Embed Size (px)
Citation preview

Latest results on Anomalous Latest results on Anomalous Galactic Microwave Emission from Galactic Microwave Emission from
the Cosmosomas Experimentthe Cosmosomas Experiment
José Alberto Rubiño Martín
(IAC-Tenerife)
Orsay, October 27th, 2006BPOL Workshop
Overview
• The COSMOSOMAS experiment• Anomalous Microwave Emission in the
Galaxy.• Detection in Perseus molecular cloud.• Diffuse emission at high galactic latitudes.
• Conclusions
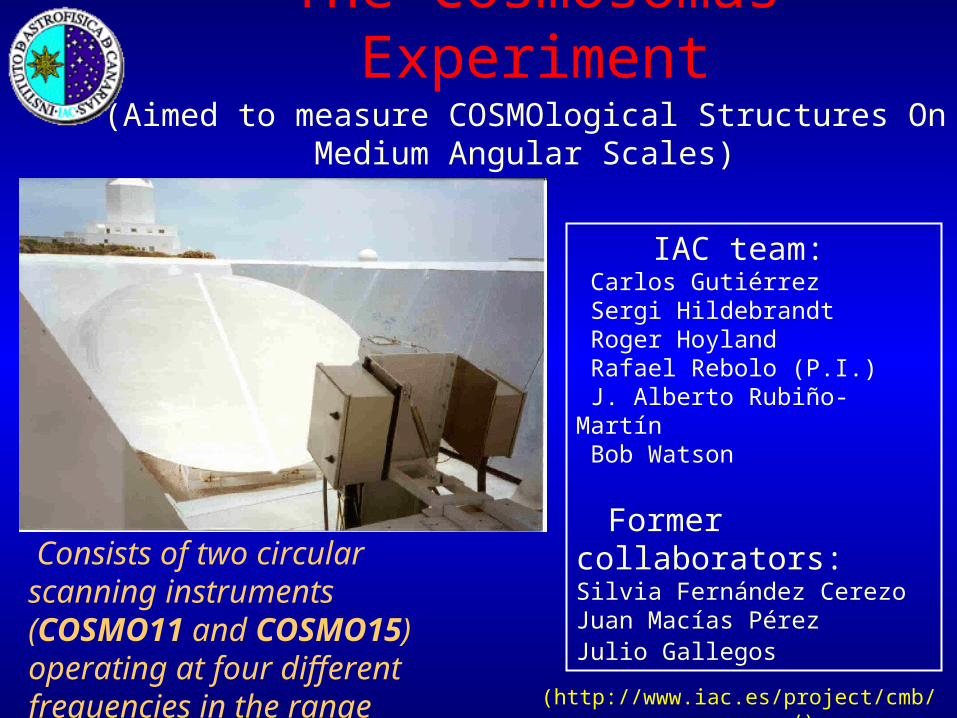
The Cosmosomas Experiment
Consists of two circular scanning instruments (COSMO11 and COSMO15) operating at four different frequencies in the range 10-17 GHz.
(Aimed to measure COSMOlogical Structures On Medium Angular Scales)
IAC team: Carlos Gutiérrez Sergi Hildebrandt Roger Hoyland Rafael Rebolo (P.I.) J. Alberto Rubiño-Martín Bob Watson
Former collaborators:Silvia Fernández CerezoJuan Macías PérezJulio Gallegos
(http://www.iac.es/project/cmb/cosmosomas/)
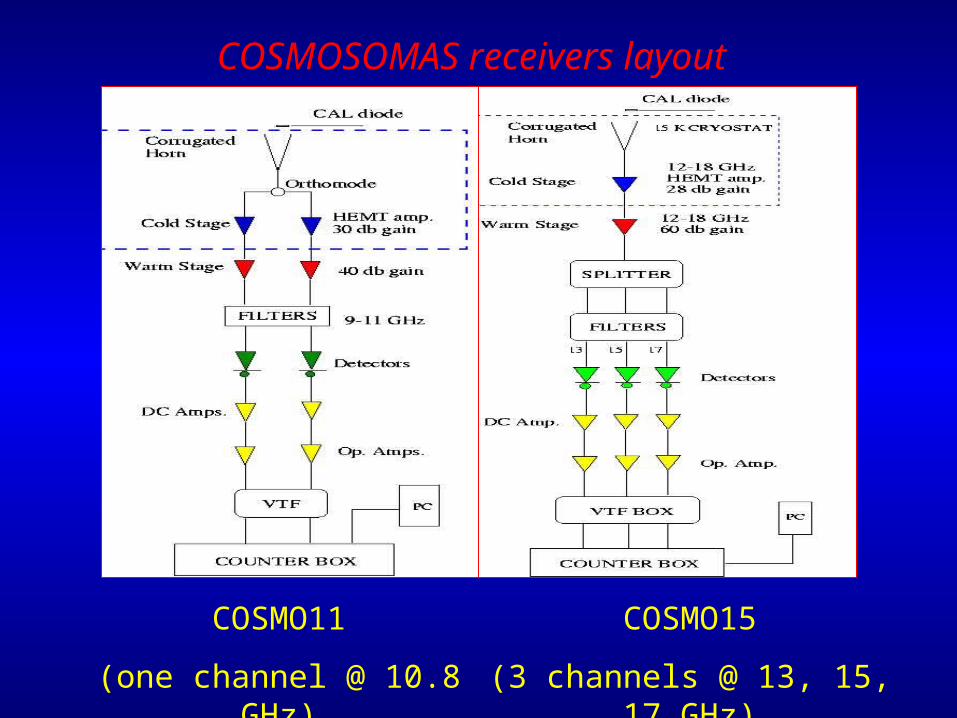
COSMOSOMAS receivers layout
COSMO11
(one channel @ 10.8 GHz)
COSMO15
(3 channels @ 13, 15, 17 GHz)
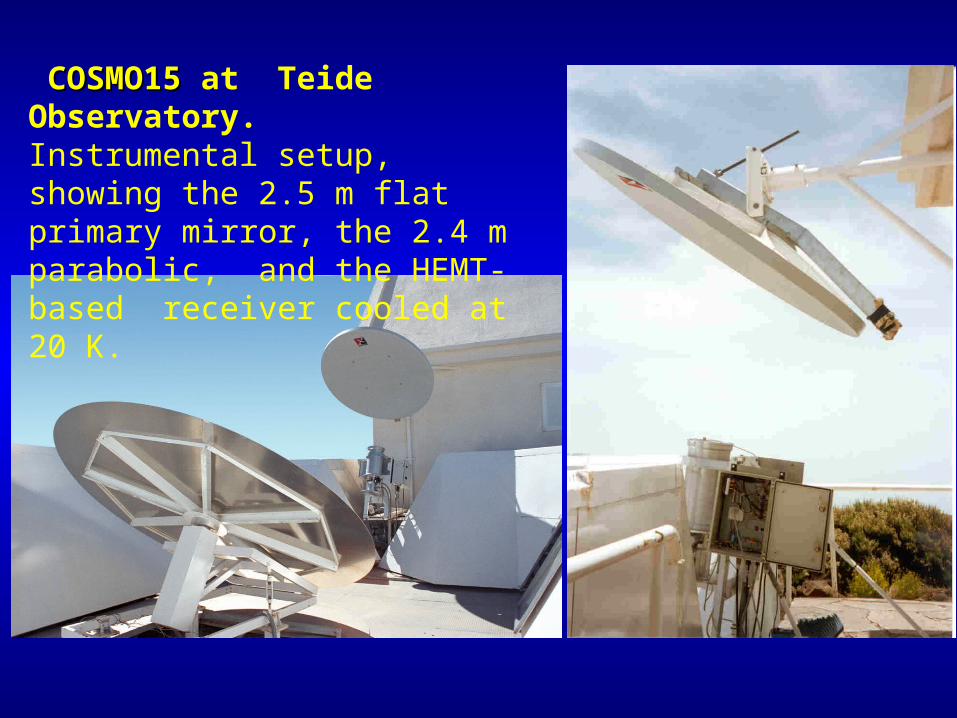
COSMO15COSMO15 at Teide Observatory. Instrumental setup, showing the 2.5 m flat primary mirror, the 2.4 m parabolic, and the HEMT-based receiver cooled at 20 K.
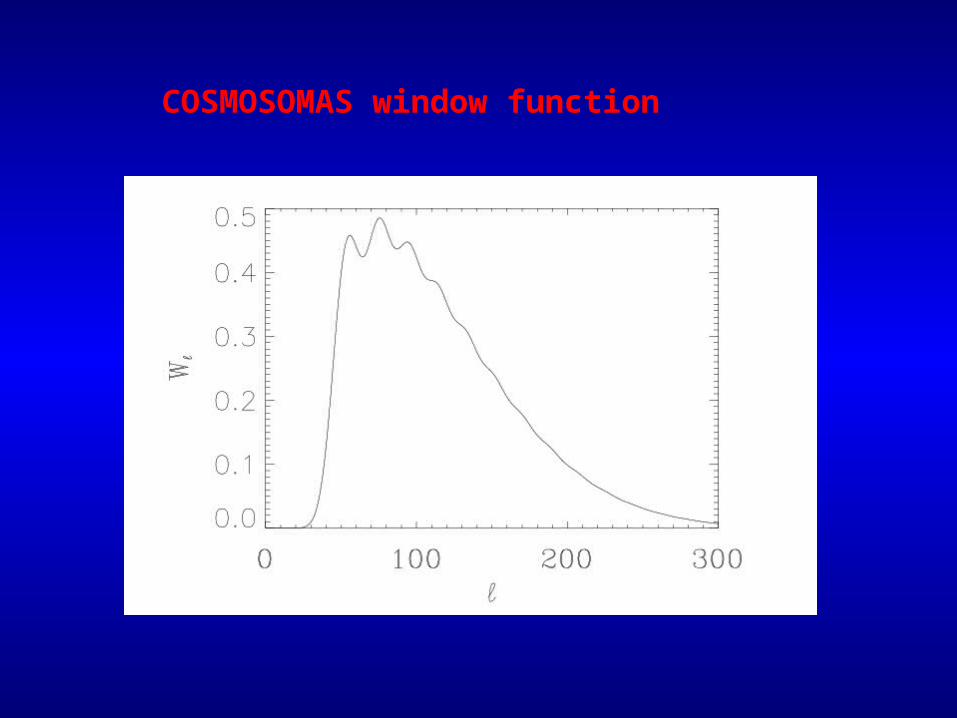
COSMOSOMAS window function
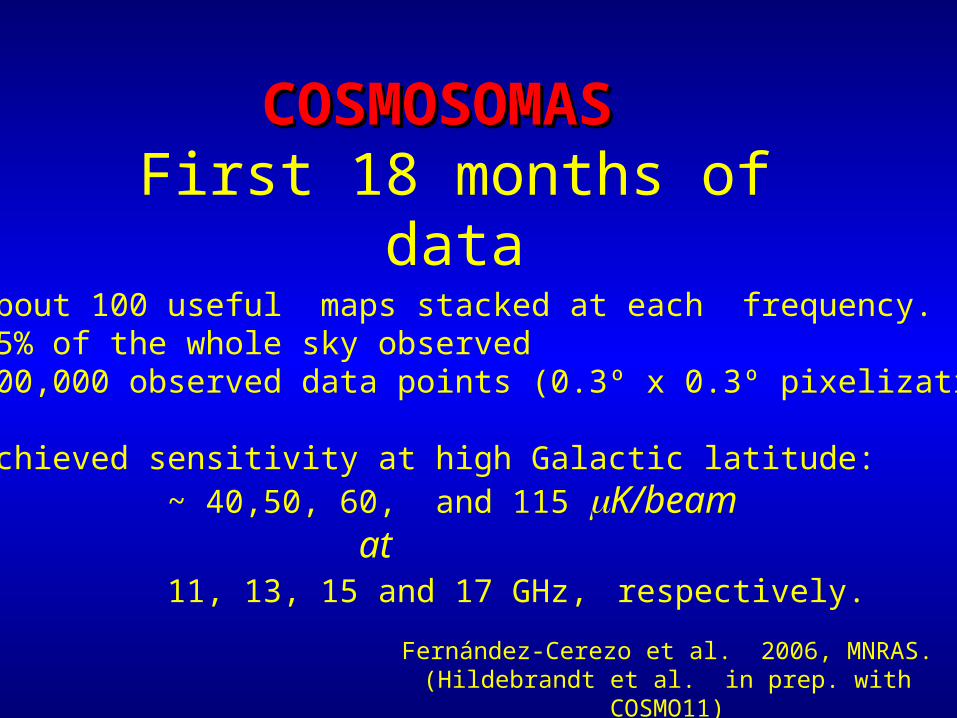
COSMOSOMASCOSMOSOMAS First 18 months of data
About 100 useful maps stacked at each frequency.25% of the whole sky observed100,000 observed data points (0.3º x 0.3º pixelization)
Achieved sensitivity at high Galactic latitude:~ 40,50, 60, and 115 K/beam
at11, 13, 15 and 17 GHz, respectively.
Fernández-Cerezo et al. 2006, MNRAS. (Hildebrandt et al. in prep. with COSMO11)
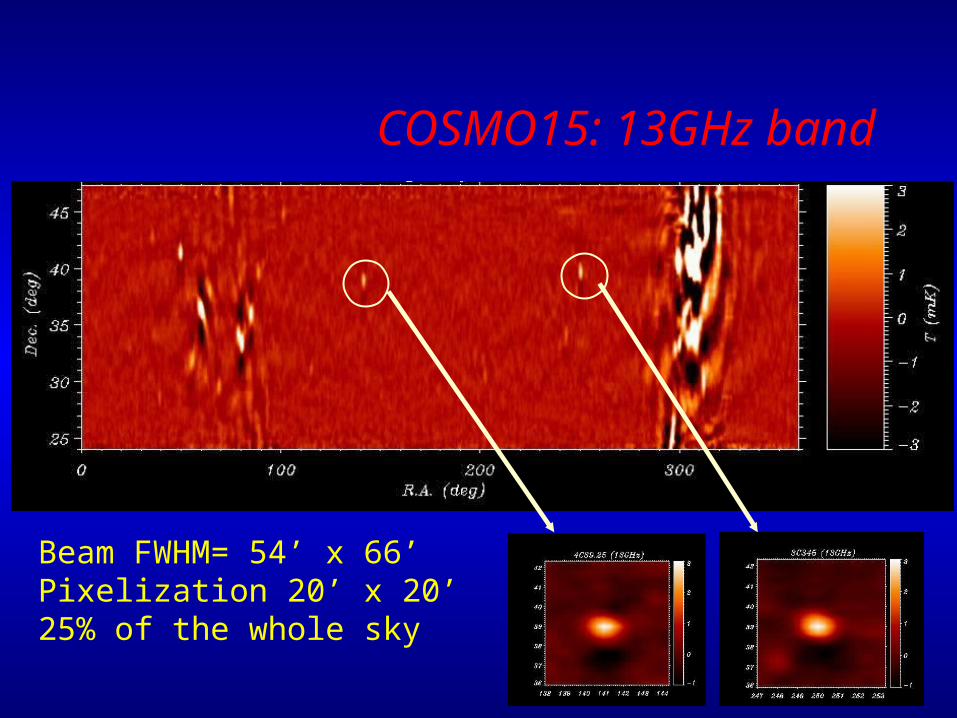
COSMO15: 13GHz band
Beam FWHM= 54’ x 66’Pixelization 20’ x 20’ 25% of the whole sky
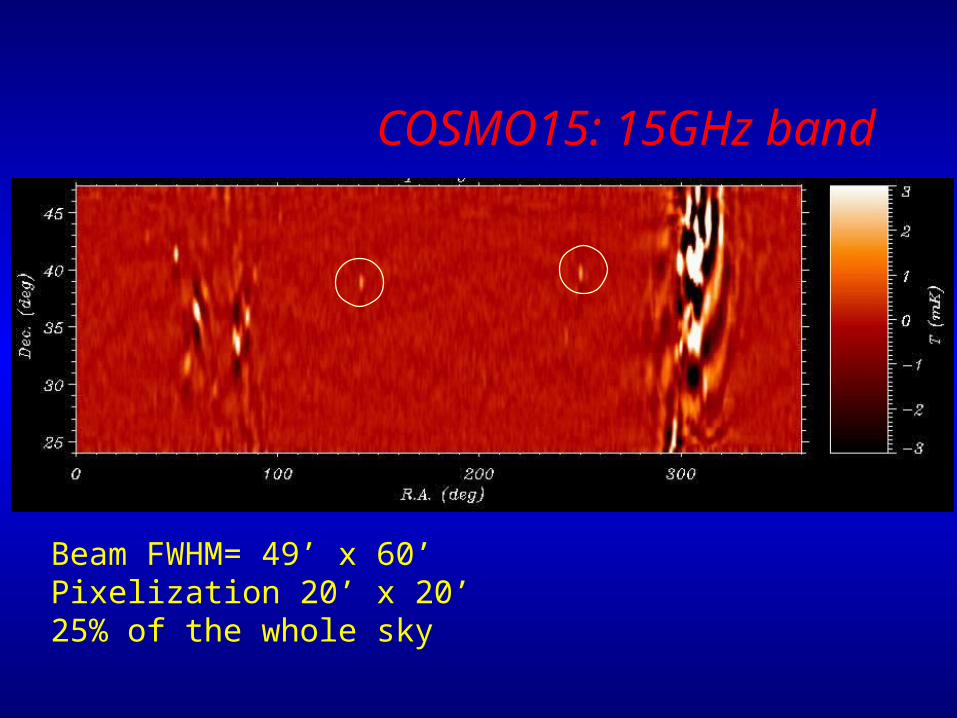
COSMO15: 15GHz band
Beam FWHM= 49’ x 60’Pixelization 20’ x 20’25% of the whole sky
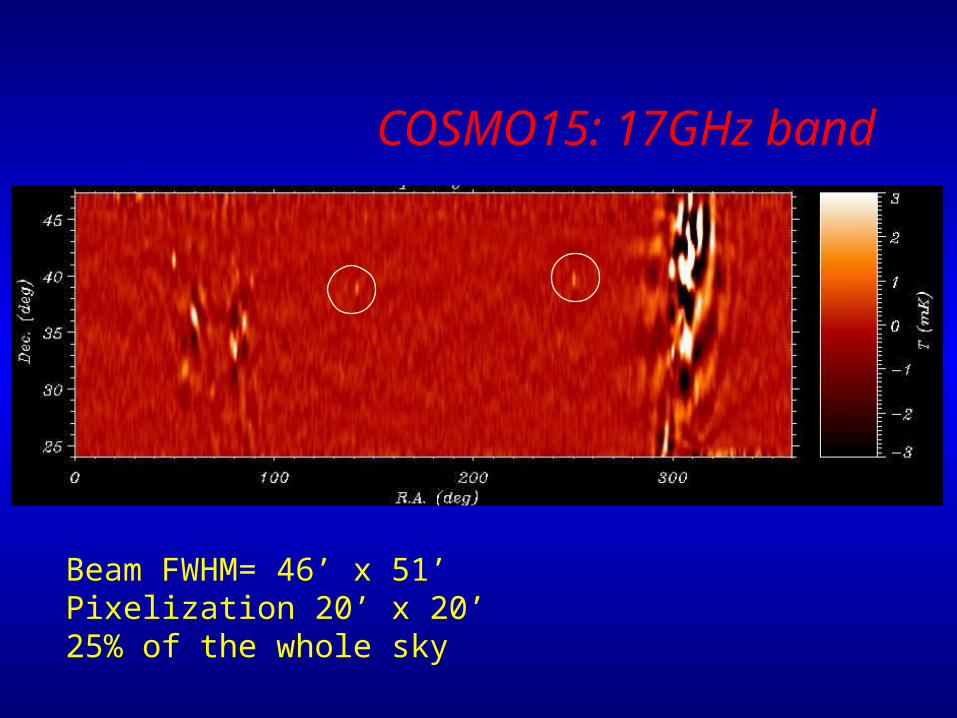
COSMO15: 17GHz band
Beam FWHM= 46’ x 51’Pixelization 20’ x 20’25% of the whole sky
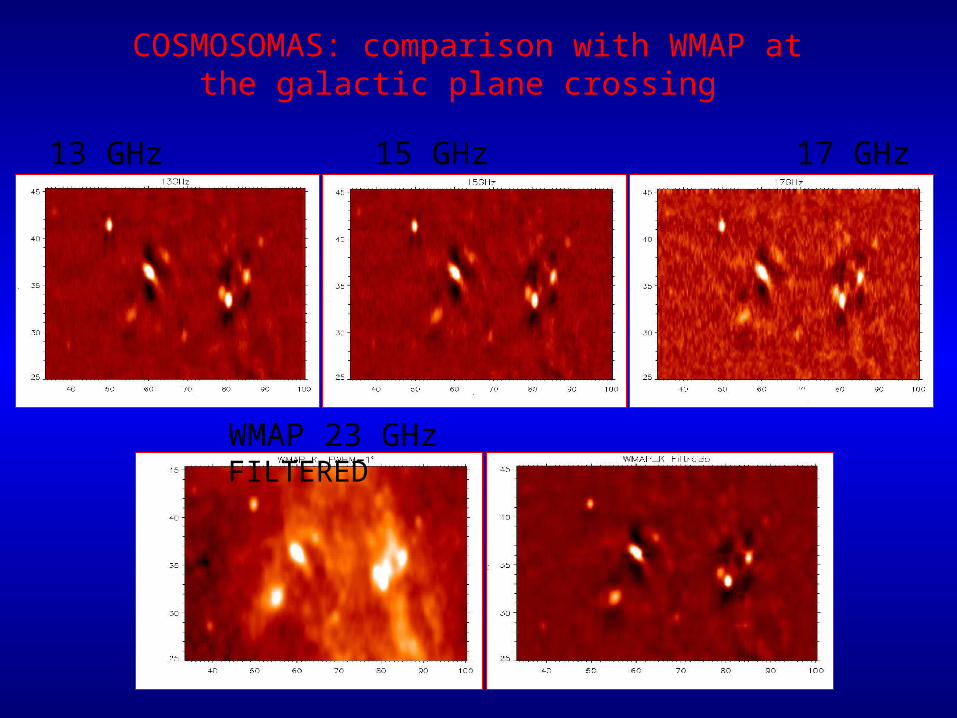
WMAP 23 GHz FILTERED
13 GHz 15 GHz 17 GHz
COSMOSOMAS: comparison with WMAP at the galactic plane crossing
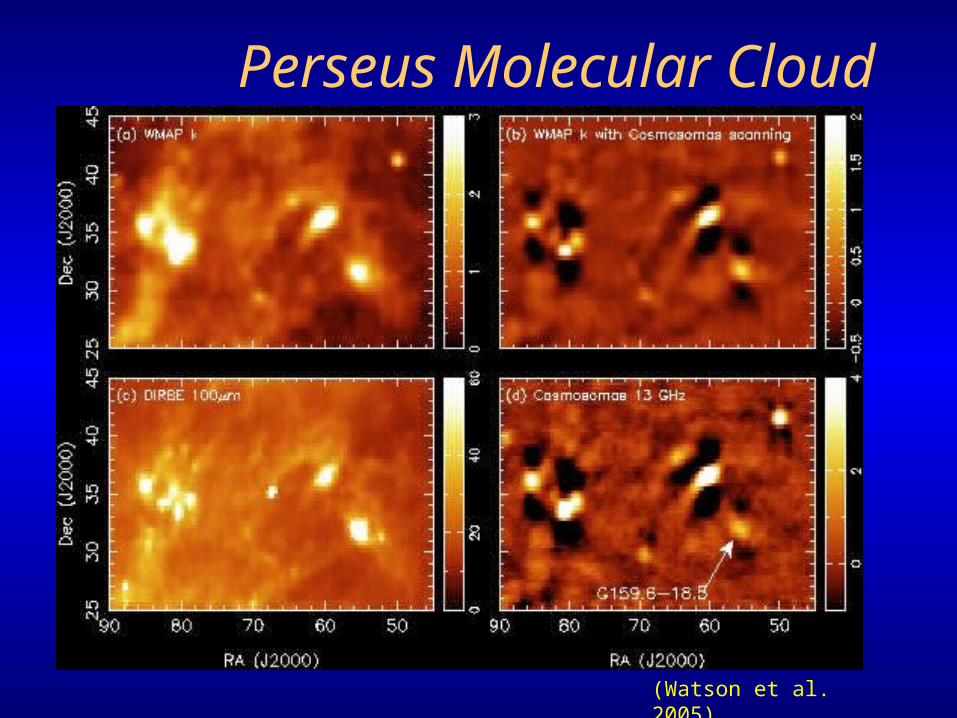
Perseus Molecular Cloud
(Watson et al. 2005)
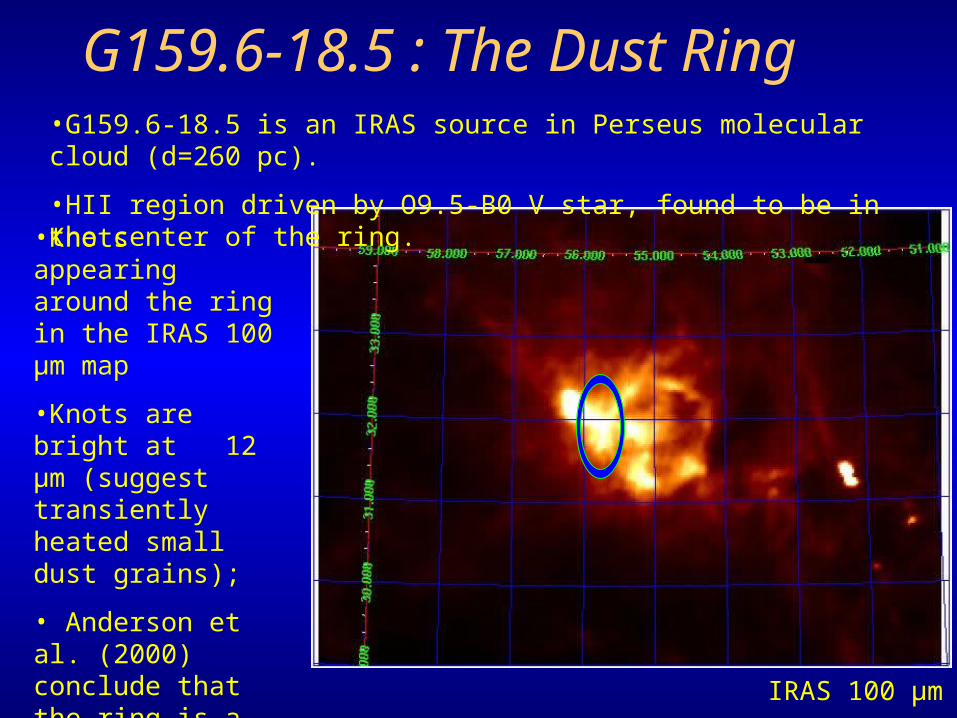
G159.6-18.5 : The Dust Ring
IRAS 100 μm
•Knots appearing around the ring in the IRAS 100 μm map
•Knots are bright at 12 μm (suggest transiently heated small dust grains);
• Anderson et al. (2000) conclude that the ring is a ruptured blister HII region.
•G159.6-18.5 is an IRAS source in Perseus molecular cloud (d=260 pc).
•HII region driven by O9.5-B0 V star, found to be in the center of the ring.
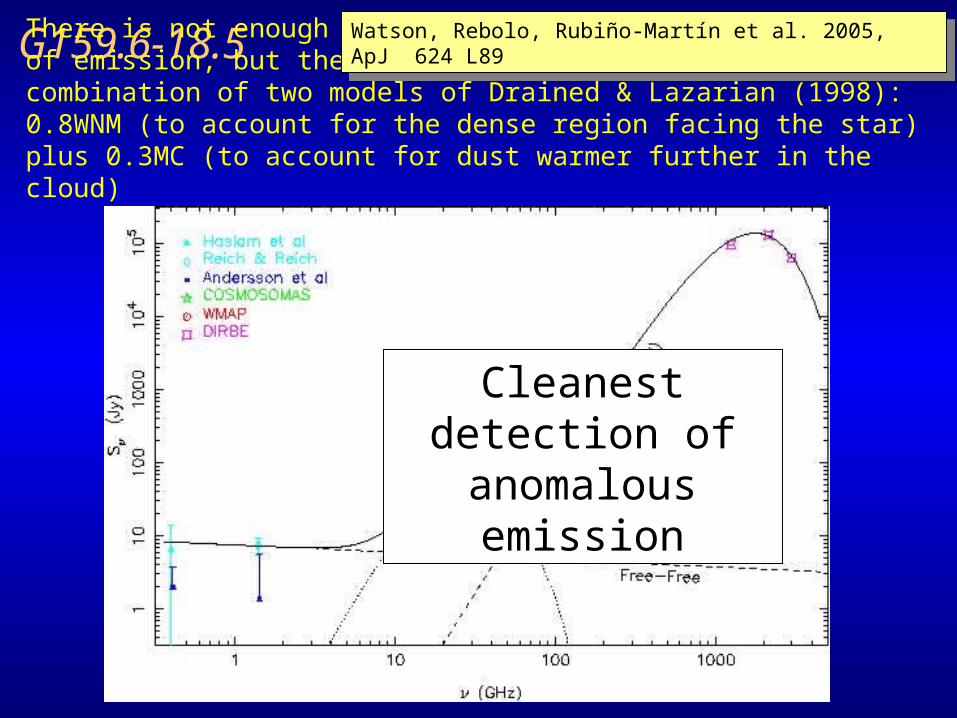
G159.6-18.5
Cleanest detection of anomalous emission
There is not enough information to make a detailed model of emission, but the signal can be fitted by a combination of two models of Drained & Lazarian (1998): 0.8WNM (to account for the dense region facing the star) plus 0.3MC (to account for dust warmer further in the cloud)
Watson, Rebolo, Rubiño-Martín et al. 2005, ApJ 624 L89Watson, Rebolo, Rubiño-Martín et al. 2005, ApJ 624 L89
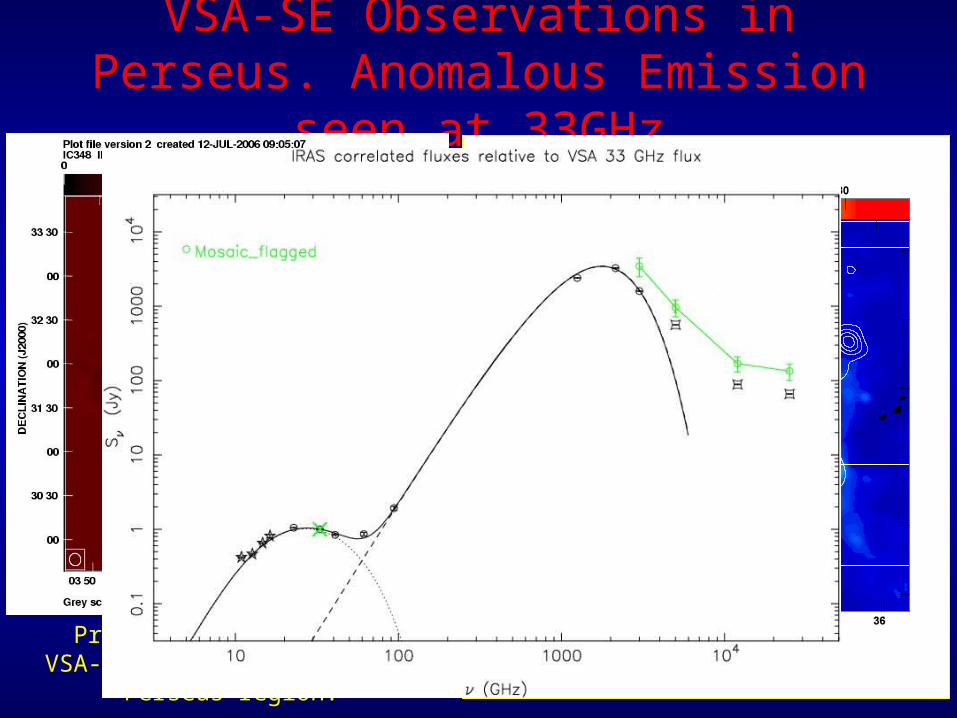
VSA-SE Observations in Perseus. Anomalous Emission seen at 33GHz
Preliminary results of VSA-SE observations in the Perseus region.
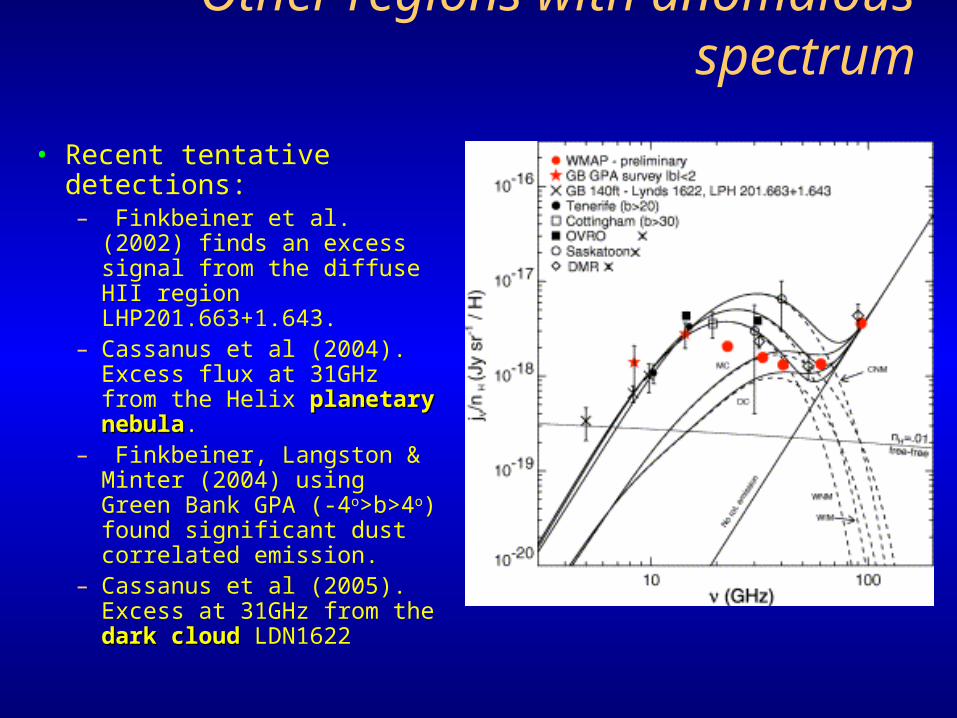
Other regions with anomalous spectrum
• Recent tentative detections:– Finkbeiner et al. (2002) finds
an excess signal from the diffuse HII region LHP201.663+1.643.
– Cassanus et al (2004). Excess flux at 31GHz from the Helix planetary nebulaplanetary nebula.
– Finkbeiner, Langston & Minter (2004) using Green Bank GPA (-4o>b>4o) found significant dust correlated emission.
– Cassanus et al (2005). Excess at 31GHz from the dark dark cloudcloud LDN1622
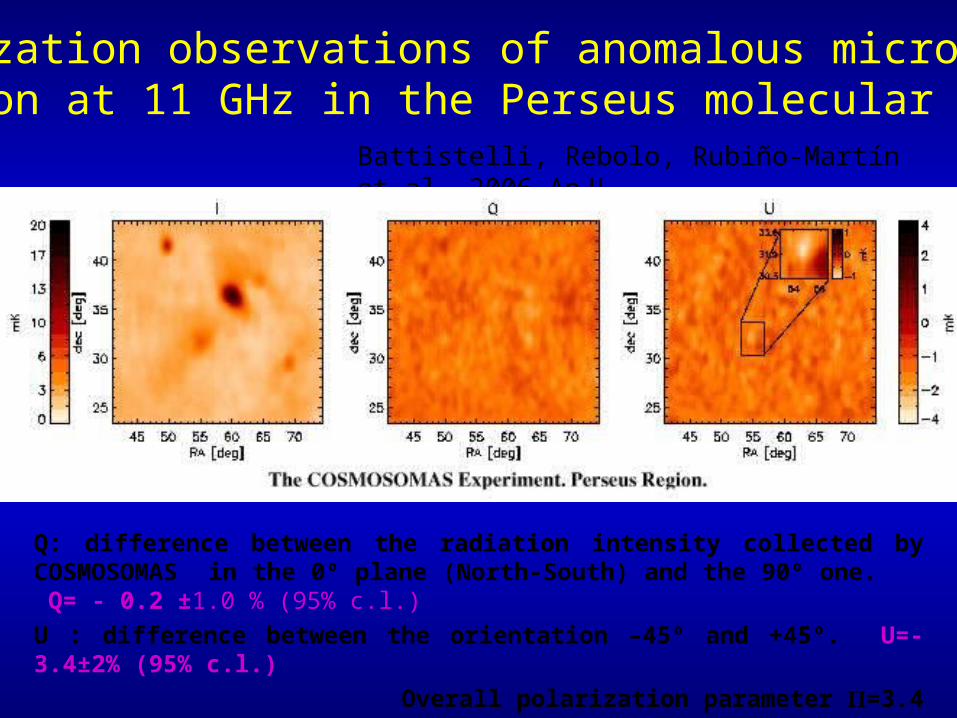
Polarization observations of anomalous microwaveemission at 11 GHz in the Perseus molecular complex
Battistelli, Rebolo, Rubiño-Martín et al. 2006 ApJL.
Q: difference between the radiation intensity collected by COSMOSOMAS in the 0º plane (North-South) and the 90º one. Q= - 0.2 ±1.0 % (95% c.l.)
U : difference between the orientation –45º and +45º. U=-3.4±2% (95% c.l.)
Overall polarization parameter =3.4 ± 2%.
The maps are calibrated to the nearby California Nebula (free-free dominated) which is assumed unpolarized (systematic error of less than 1%).
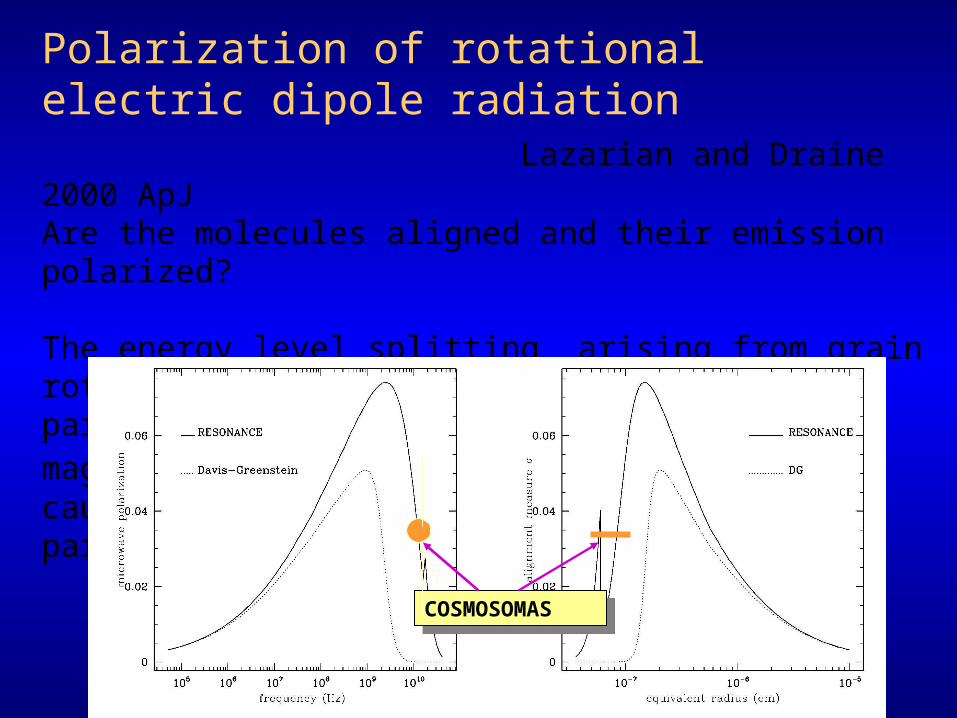
Polarization of rotational electric dipole radiationLazarian and Draine 2000 ApJ
Are the molecules aligned and their emission polarized?
The energy level splitting arising from grain rotation ensures maximum efficiency of paramagnetic dissipation : time dependentmagnetization, energy dissipation and torque causing the molecule to rotate with the axis parallel to the magnetic field
COSMOSOMASCOSMOSOMAS
Emission at high galactic Emission at high galactic latitudes with Cosmosomas. latitudes with Cosmosomas.
Fernández-Cerezo, Gutiérrez, Rebolo, Rubiño-Martín et al. 2006,
MNRAS (astro-ph/0601203)
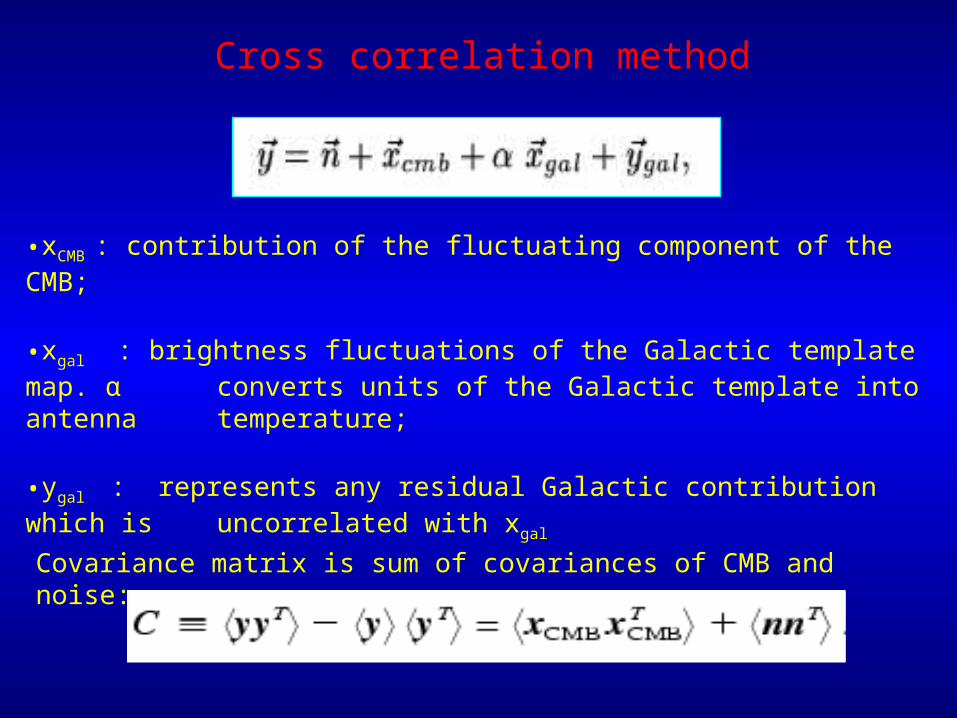
Cross correlation method
•xCMB : contribution of the fluctuating component of the CMB;
•xgal : brightness fluctuations of the Galactic template map. α converts units of the Galactic template into antenna temperature;
•ygal : represents any residual Galactic contribution which is uncorrelated with xgal
Covariance matrix is sum of covariances of CMB and noise:
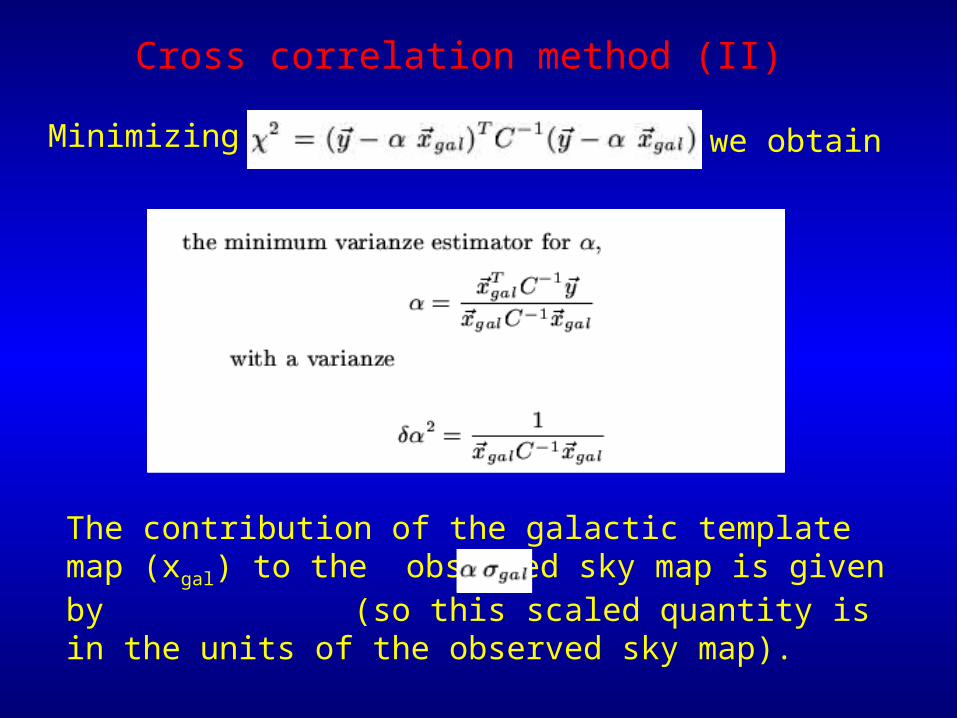
The contribution of the galactic template map (xgal) to the observed sky map is given by (so this scaled quantity is in the units of the observed sky map).
Cross correlation method (II)
Minimizing we obtain
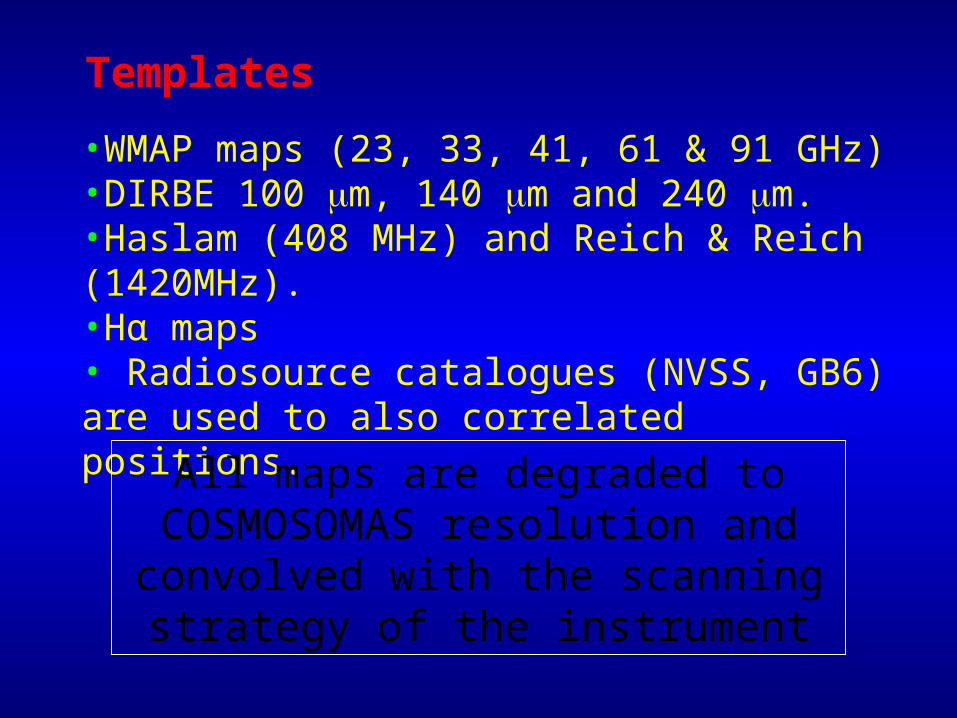
Templates
•WMAP maps (23, 33, 41, 61 & 91 GHz)•DIRBE 100 m, 140 m and 240 m.•Haslam (408 MHz) and Reich & Reich (1420MHz).•Hα maps• Radiosource catalogues (NVSS, GB6) are used to also correlated positions.
All maps are degraded to COSMOSOMAS resolution and
convolved with the scanning strategy of the instrument
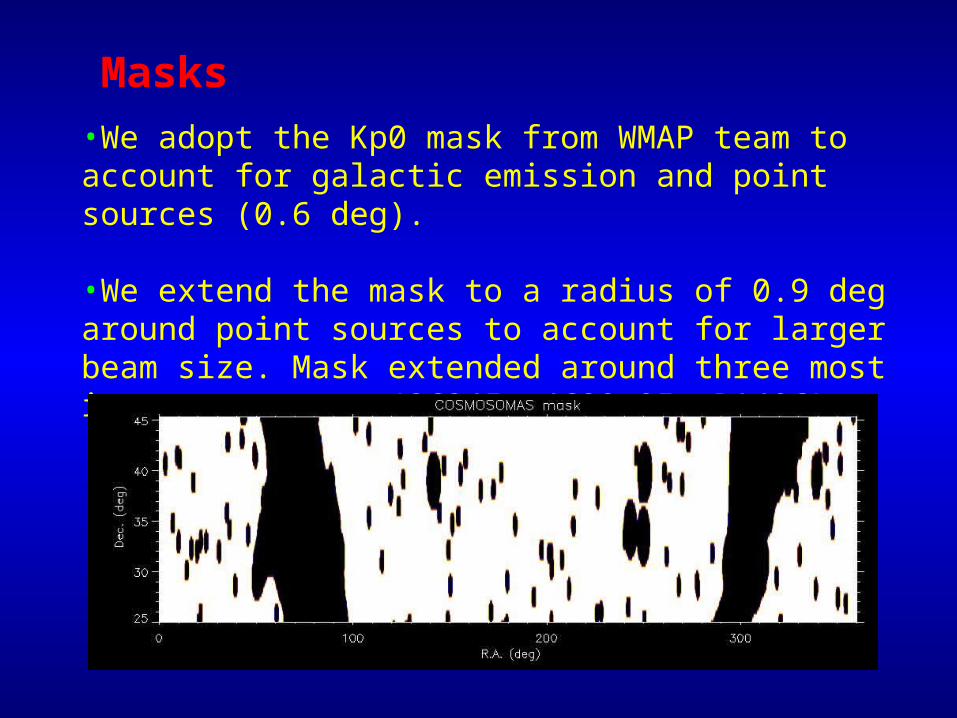
Masks
•We adopt the Kp0 mask from WMAP team to account for galactic emission and point sources (0.6 deg).
•We extend the mask to a radius of 0.9 deg around point sources to account for larger beam size. Mask extended around three most intense sources (3C345, 4C39.25, DA406)
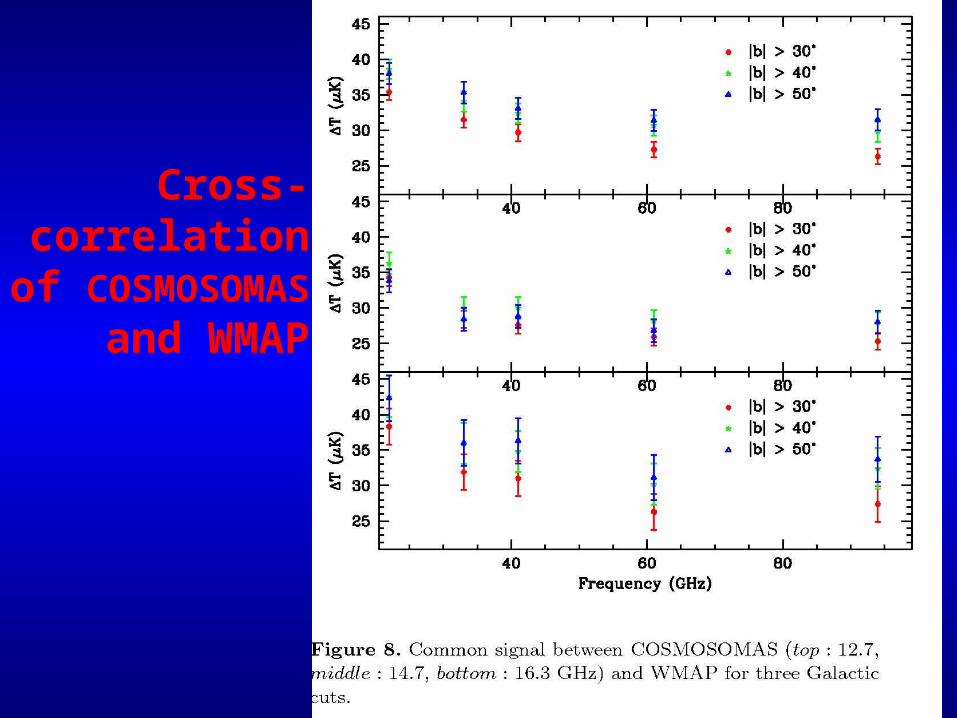
Cross-correlation of
COSMOSOMAS and WMAP
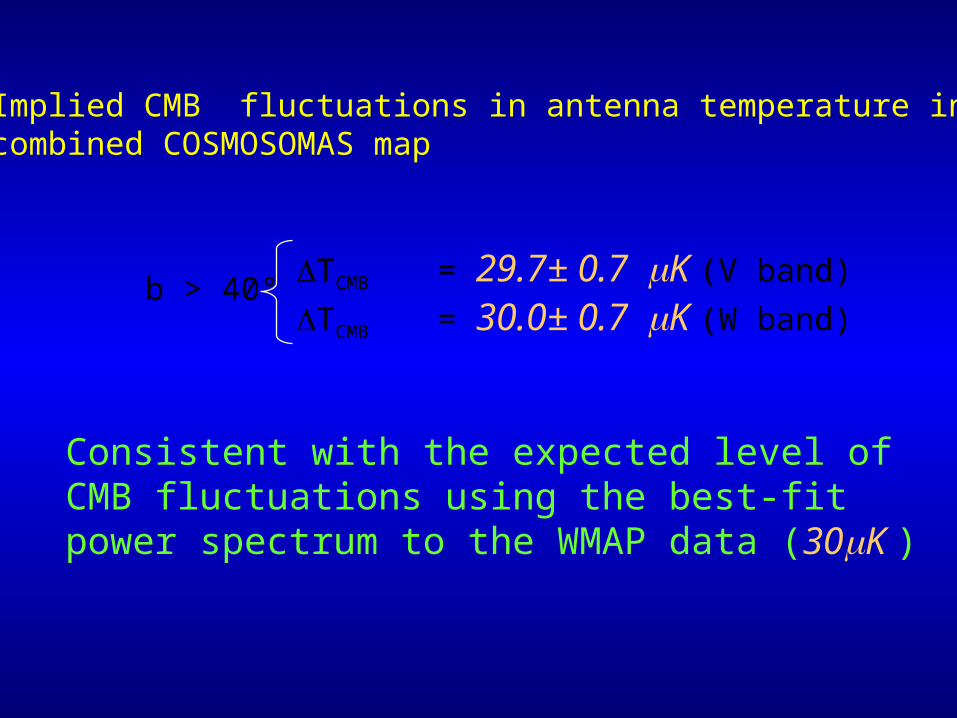
Implied CMB fluctuations in antenna temperature in thecombined COSMOSOMAS map
b > 40°TCMB = 29.7± 0.7 K (V band)
TCMB = 30.0± 0.7 K (W band)
Consistent with the expected level of CMB fluctuations using the best-fit power spectrum to the WMAP data (30K )
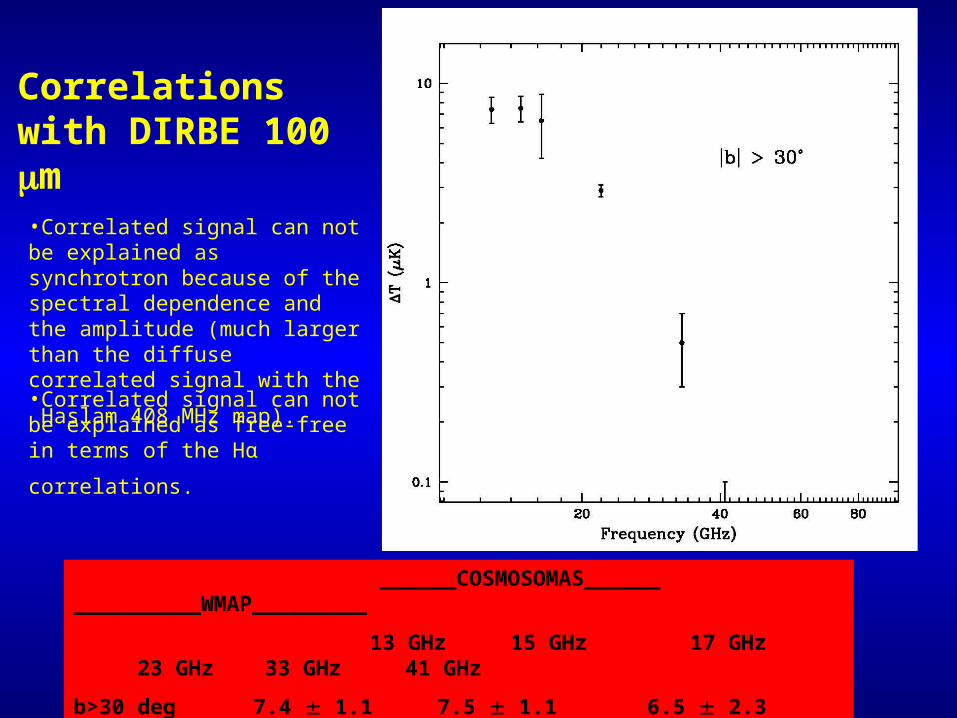
______COSMOSOMAS______ __________WMAP_________
13 GHz 15 GHz 17 GHz 23 GHz 33 GHz 41 GHz
b>30 deg 7.4 1.1 7.5 1.1 6.5 2.3 2.9 0.2 0.5 0.2 0.0 0.1
b>40 deg 3.7 1.4 5.3 1.4 1.8 2.8 3.7 0.2 2.4 0.2 1.4 0.2
Correlations with DIRBE 100 m
•Correlated signal can not be explained as synchrotron because of the spectral dependence and the amplitude (much larger than the diffuse correlated signal
with the Haslam 408 MHz map).
•Correlated signal can not be explained as free-free in terms of the Hα
correlations.
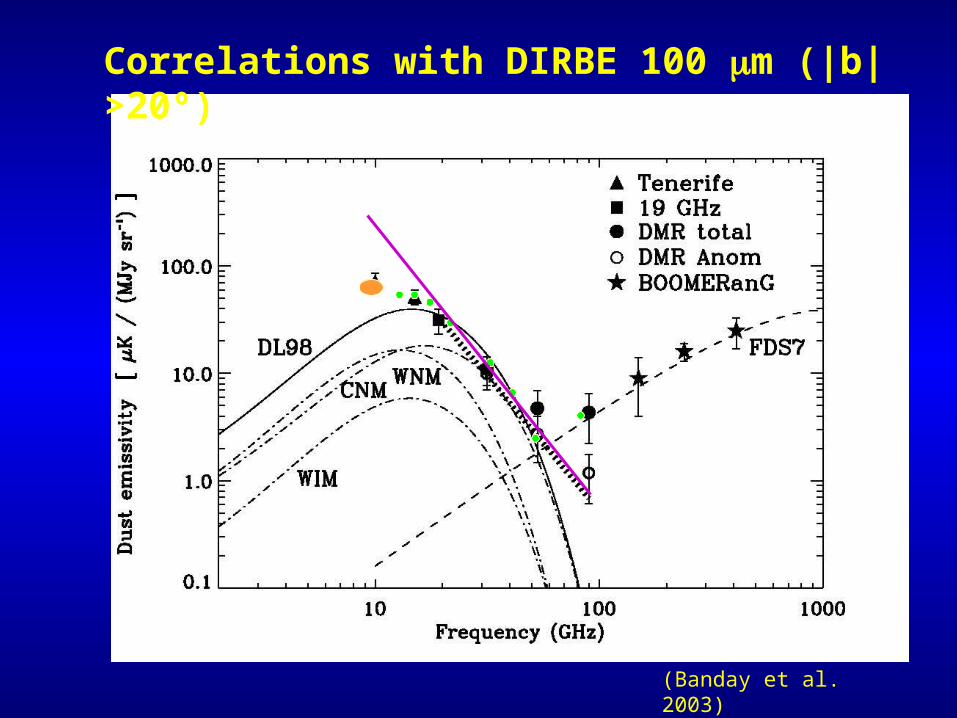
Correlations with DIRBE 100 m (|b|>20º)
(Banday et al. 2003)
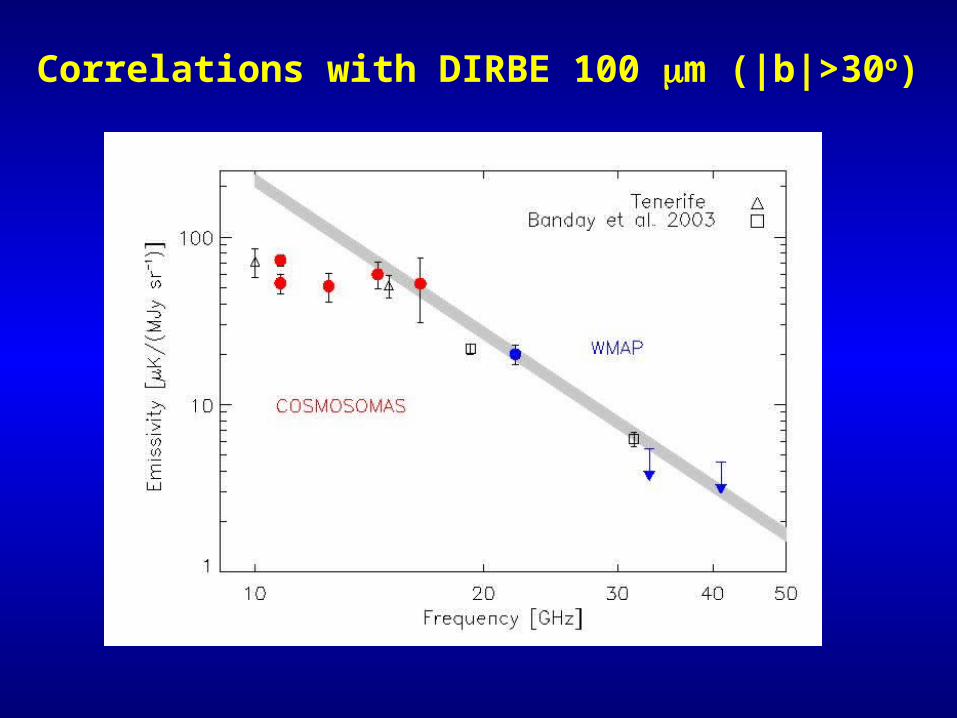
Correlations with DIRBE 100 m (|b|>30o)
CONCLUSIONS (I)• The anomalous microwave emission is the dominant
continuum emission process at 10-40 GHz in the PerseusPerseus molecular complex. Becomes comparable with thermal dust at 70-80GHz.
• The polarization levelpolarization level of this anomalous emission is less than 5%less than 5% at 11 GHz. Our best estimate is 3.42 % which would argue in favour of rotational electric dipole radiation of fast spinning small molecules.
• But this is the only existing measurement of the polarization of the anomalous emission! Measurements at higher frequencies are requiered.
CONCLUSIONS (II)
• The DIRBE-correlated signalDIRBE-correlated signal may turn out to be the dominant Galactic foreground seen by COSMOSOMAS at 1 degree scale and 15 GHz.– It decreases significantly as we go to higher Galactic latitudes and
higher frequencies. But there is signal detected up to |b| >40.– The largest correlations are found with the 100 m map. There
are significant detections (>2 ) at 140 and 240 m.– The DIRBE-correlated signal is also detected in all the frequencies
of WMAP: is about 4% to the total temperature fluctuations in Q band, and progressively less as we increase the frequency.
– We find a remarkable agreement with predictions of intensity from spinning dust models.
– Measurements of polarized dust-correlated emission needed!
Future work
• COSMO10 COSMO10 has obtained a map of similar sensitivity to those of COSMO15COSMO15, and new results will be published soon (Hildebrandt et al. in prep.)
• COSMO15COSMO15 is being re-adapted to be a polarization-sensitive experiment (using a rotating HWP to modulate polarization). First testing of the experiment expected in the next few months.