Embed Size (px)
Citation preview
Nüfusbilim Dergisi\Turkish Journal of Population Studies, 2003, 25, 3-38 3
LATE OTTOMAN POPULATION AND ITS ETHNIC DISTRIBUTION
Servet MUTLU*1
The size and ethnic and spatial distribution of the Ottoman population during the last decades of the Empire has been a contentious issue, chiefly for political reasons. The Ottomans produced figures based on censuses and their updates while the protagonists of various political causes advanced their own numbers which at times differed considerably from the official ones. These conflicting numbers pose a problem for the students of Ottoman demography.
The crux to the solution of the problem is the establishment of the degree of accuracy and of reliability of the Ottoman censuses and updated population registers. This is the main objective of the present study.
The paper first discusses the Ottoman census methods and procedures as they had a bearing on the census counts. The system incorporated incentives for individuals, especially adult males, to register and the census committees responsible for the counts had an ethnic structure such as to prevent politically motivated constructions. However, partially for cultural reasons, women and children were undercounted. These deficiencies are amenable to correction.
Two methods were devised; one for İstanbul and one for the rest of the vilayets, to correct for undercounts using Model Life Tables. Two estimates were made for each census count by principal ethnic group and administrative unit: a lower and an upper bound estimate. It is found that when corrected for undercounts of women and children, Ottoman censuses are reasonably reliable documents.
INTRODUCTION As the Ottoman Empire disintegrated due to a variety of internal and external causes,
principal ethnic minorities, at least their leaders, toward the end of the 19th century, agitated either to establish a separate state as in the case of the Armenians or to unite with their brethren as in the case of the Greeks. The size of population of each minority and its proportion in the total by geographic locality became a central issue. Various population figures were produced to justify separatist and irredentist demands. The Ottoman Administration had its own population figures based on censuses. However the separatists and irredentists claimed that these census figures were biased, unreliable and hence of no use Subsequent events had unfortunate consequences for the minority aspirations, but the claims still prefigure in some protagonists’ theses as historical fact (Dadrian, 1997).
How right were the protagonists, the Greek and Armenian separatists and irredentists and
Ottomans, in their claims as to the number and spatial distribution of minority ethnic groups and Muslims? The crux of the problem is the establishment of the degree of accuracy of the Ottoman population censuses. This is the main objective of the present study.
*Prof. Dr. Baskent University, Department of Economics 1 The author is thankful to the two anonymous referees of this journal for their incisive comments which greatly improved the paper.
4 S. MUTLU
OTTOMAN POPULATION CENSUSES How a census is conducted and its objectives directly bear upon the degree of accuracy of
its results. Hence, though not the principal aim of this study, a digression on the Ottoman censuses and their methods is in order.
Ottomans attached great importance to keeping population records through tax surveys
which recorded the taxable population, namely the adult males, representing individual households. In the resulting tax registers (tahrir defters) of the period between the fifteenth and seventeenth centuries, the heads of households, both Muslim and non-Muslim, were recorded according to the size of the land they cultivated (çift, nîm-çift, bennak and caba); adult unmarried males within the households (mücerred) were also recorded separately. As poll-tax (cizye) levied on non-Muslims constituted one of the principal tax sources for the Ottoman treasury, the central administration paid utmost attention to renew the surveys, thus updating the registers. In the 19th century their interest in the number of population and its distribution by age groups, ethnic composition and geographic distribution became progressively keener.
The first general (empire-wide) population census was undertaken in 1830/31, only a
quarter century after census procedures were adopted in the United States, Great Britain and France. The recruitment of a modern army following the destruction of the Janissary corps in 1826 necessitated accurate information on the number and age of the male population. Hence only the male population was recorded (Karal, 1943).
A separate Census Department was established in 1835 only to be dissolved after a decade
or so. However, there is evidence that census officers continued to be stationed at important points throughout the empire and population reports, as yet uncovered, were produced for 1835, 1838, 1844 and 1857 (Shaw, 1978, p. 327). Only the report for 1844 was based on an actual census and statistical information about is available in Ubicini and Eugene Boré who seemed to have had access to the figures. Ubicini, who gave a summary of the census result, claimed that his population tables “if not rigorously exact....are at least as correct as it was possible to render them. They were compiled from the general census taken in 1844 throughout the empire when Rıza Pasha, the Minister of War, undertook to organize the army by altering the method of recruitment” (cited in Karpat, 1985, p. 23)1
Conducting population censuses gained in importance after Tanzimat. In addition to the
continuing need to assess the population resources for military recruitment, there was the need to find new sources of revenue to finance the modern army and the new administrative functions assumed by the government. Many non-Muslim communities used old records to show their number as low as possible to minimize the tax burden. General conscription was introduced in 1855, though never applied to Christians, and the poll tax was converted in 1857 into a tax in lieu of military service (bedel-i askeriye).So it became vital to update the population records.
The Department of Cadastres (Tahrir-i Emlak Nezareti) was established following the
Crimean War and charged not only with the responsibility of registering property for tax purposes, but also of counting and registering male subjects and issuing population tax certificate (vergi nüfus tezkeresi) which stated the person’s tax obligation and served as an identity card (Shaw, 1978, p.327). A census of non-Muslims was ordered in 1862 with the purpose of reforming the tax system. Another census was carried out in 1866 in the Tuna (Danube) province governed by the provincial reformer Mithat Pasha under the urgency created by the issue of Islahat Fermanı in 1856 the chief purpose of which was to introduce reforms for the benefit of the non-Muslim subjects of
OTTOMAN POPULATION 5
the Empire. Female subjects were still not registered. Mithat Pasha used the census figures, completed in 1873, as bases for educational, economic and social reforms and to get further funds from the central government to meet local needs and to settle Muslim refugees fleeing from Serbia and Romania.
During his first term as Grand Vizier in 1872, Mithat Pasha formed a commission to
investigate the census system and its use. On the basis of the commission’s report, a general census regulation was issued and a new census ordered by the Council of State (Şuray-ı Devlet) in 1874. The Census Department became much more independent than before (Shaw, 1978,p.328).
The new census order was a direct response to the demographic and economic changes in
the Empire in the late 1850s and 1860s. Close to two million Muslims fled from the Caucasus into the Empire. Increase of trade with Europe produced a shift of population from the rural interior toward the coastal towns. The Vilayet Law of 1864 and its amendment in 1871 led to the abolition of positions assigned to population officials. All these led to the deterioration of population registers, undermined the collection of taxes and conscription of Muslims into the army (Karpat, 1978, pp. 246-47).
The essence of the new census system was the establishment of a committee at the district
level consisting of one government official, a Muslim, a non-Muslim chosen from among community leaders, a secretary and his assistant. The inclusion of both a Muslim and a non-Muslim in the committee was a safeguard against undercounting any ethnic group. The committee was required to do the actual counting by going to each neighbourhood and village. All male inhabitants including children living in the locality had to appear before the committee and the village council of elders (ihtiyar meclisi). The committee was instructed to see even new born babies with their own eyes. Age, skin complexion, color of eyes and any physical disabilities which would not pass with age were to be recorded. The census committee was empowered to use force if necessary to bring individuals before the officials. The roster of the village census was to be approved by the council of elders and subsequently submitted to the population office at the district center. The district official would do the sums, and pass it over to the next superior administrative unit, which would ultimately convey the list to the Defteri Hakani in Dersaadet. The district official was obliged to send copies of the registers of Muslims males to regional army offices.
The 1874 census order, despite preparations lasting a year, was never carried to completion
because of the financial crisis and the political turmoil at the top level, created by the depositions of Abdülaziz and Murat V and the accession of Abdülhamit II in 1876. The new Sultan, after the conclusion of the Ottoman- Russian War and the stabilization of the situation following the Treaty of Berlin (1878), issued an order for carrying out a new census. He hired a French expert, M. Bollond, to investigate the census organization and method and create a new system. However, Bolland reported that the old system was logical and suited the conditions in the Empire (Shaw, 1978, p. 330). The issue was referred to and debated by Şuray-ı Devlet. The Council came out with a series of recommendations. It pointed out that, although the 1874 census could not be carried out, nevertheless the knowledge gained in devising it was very useful in planning the new one. The Council was in agreement with the military authorities that the division of Muslim population into age groups was of vital practical importance. It stressed the necessity of providing each Ottoman citizen with a tezkere, an identity card, to be used in the ever increasing contacts between the individuals and the government and emphasized that the population statistics were useful for administrative, especially tax, as well as military purposes. It further pointed out that “a census showed the size of the population at a given moment. The population changes being continuous and...natural, it was necessary to devise a sound basis, a new system which could record all
6 S. MUTLU
(population) changes and thus derive the outmost benefit from a census” (cited in Karpat, 1978, p. 250). In the view of the Council, a census was only a provisional measure necessary to establish the statistical basis which would be continuously updated by registering all births and deaths to provide up to date general information on the population.
The new census regulations, Sicil-i Nüfus Nizamnamesi (Regulation for Population
Registers) reviving the old and incorporating the views of the Council was promulgated by the Sultan in 18812. The new regulations resembled the old one in the formation of the census committees and counting and registration procedures. A novelty was that each person counted and recorded was provided with a signed and sealed Population Certificate (Nüfus Tezkeresi). The significance or the Population Certificate was that no one could buy or sell property, appear in court, travel within or outside the Empire or have any dealings with the police or municipal officials without producing the document. Financial penalties and occasionally imprisonment was imposed on those found unregistered or those refusing requisite information to the census officials. Men of military age who could not produce their identity certificates were conscripted without further formalities. A second novelty was the inclusion of females in the census. Sicil-i Nüfus Nizamnamesi became the basis for all subsequent censuses in the Empire.
The new regulations required that a continuous registration process be initiated following
the initial census. All births, deaths, marriages, divorces and changes of residence were recorded locally as they took place, a practice which still continues. Periodic reports were made to the census officials at the district and provincial levels to keep the records up to date thus enabling the Empire to maintain a permanent and continuous record of the current state of its population.
Sicil-i Nüfus Nizamnamesi was revised in 1900/1, and reissued with minor revisions in
1902/3, to correct difficulties that had arisen in practice over the years. Provisions requiring display of Population Certificate were made more specific in order to make certain that all individuals, including girls and children, were counted and registered. All subjects were required to show their certificates whenever they purchased, transferred or abandoned property, whenever they were chosen to serve in any official or unofficial position, when they were admitted to a school, whether public or private, and when they retired and asked for a pension from the Treasury. Severe penalties were imposed on those forging the documents or adding unauthorized information on the certificates.
The revised law now required that all register pages be numbered consecutively and sealed
in order to curb sloppiness and corruption in the registration process. Separate registers of daily census changes (vukuat) were introduced instead of the empty pages left at the ends of original registers in the previous censuses and the district and provincial administrative councils were required to certify their accuracy before the information was sent to İstanbul to be incorporated into the Imperial statistics. The new law also upgraded the prerequisites for serving as a census official, and provided for the regular inspection of their work.
During the politically critical years of the 1890s and for most of the first decade of the
1900s, the Census Department was run either by a minority individual or an expatriate. From 1893 to 1896 the directors were Jewish. Mıgırdıç Sinabyan Efendi, an Armenian, served as the director from 1897 to 1902, and an American statistics expert from 1903 to 1907. There after Mehmet Behiç Bey, who had produced several works on statistics, was the director. Mıgırdıç Efendi, following a practice common at the time, tended to staff the Bureau with members of his millet and sent a number of them to England and France to study modern census techniques (Shaw, 1978, p. 333).
OTTOMAN POPULATION 7
The list of directors of the Census Department and its staffing at the headquarters indicate that it was meant to run professionally and not as an office to produce politically inspired documents at a time when the population issue itself was becoming political.
The Sultan, Abdülhamit II, himself took a keen interest in the censuses3 as he realized that
they had not only financial and military but political implications as well. In a memorandum dated November, 1900, he expressed his concern that “the accuracy of the census is being compromised by the efforts of non-Muslims to deviously inflate their numbers”. Citing news he had received from Bitlis Province that “during the census the Armenians are striving to show themselves to be more numerous than they are trough wiles and intrigues”, he urged that all necessary measures be taken to prevent the influx of Armenians from Russia and maintained that otherwise the census would be diverted “to serve interests other than those of the Ottomans” (Deringil, 2002, p. 42).
The first Ottoman Census conducted in accordance with the rules set down by the Sicil-i
Nüfus Nizamnamesi promulgated in 1881, started in the same year. The first results from the more accessible places came in during 1884/ 85, that of İstanbul was completed in 1885. Some provinces did not complete their censuses or establish their registration system until 1886/ 87. The Sultan showed continuous interest in the census and issued deadlines for its completion. As the census progressed, qualified teams of inspectors were sent in 1885 to control the census results and to take the necessary measures to ensure a continuous and accurate registration of all population changes. Despite these measures a few people remained unregistered in areas where the census was declared to be complete, and in some inaccessible places, the population, especially the nomadic tribes, was not counted at all and only estimates were made based on the information supplied the local officials and tribal leaders (Karpat, 1985, p. 33). Though it is impossible to say when it ended, the census records were submitted to the Sultan on August 17, 1893 by Premier Cevat Pasha. The records noted the districts and regions where the census was completed and provided estimates for the areas not subjected to individual count and registration.
Following the 1881- 1893 Census, a population statistic was issued in 1315/ 1897 (Devlet-
i Aliye-i Osmaniye’nin 1313 Senesine Mahsus İstatistik-i Umumisi). This volume gave statistics by vilayet on sex, age, religion and national affiliation of population and was the most comprehensive one to date.
A second census, the last one in the Ottoman era, was carried out in 1905/6. From an
undated memorandum of circa 1893 it appears that the Ottoman officials were not satisfied with the results of the earlier census, as much as population in some areas like Iraq and Arabian Peninsula were either undercounted or not counted at all. Furthermore nationalist struggles between Greeks, Serbians, Bulgarians and to a lesser extent Vlachs in Macedonia over the appointment of their co-nationals as heads of particular Christian communities and as priests of the local Orthodox Churches necessitated a census the results of which would be uncontested. The majority ethnic group in each locality would then be entitled to appoint the priest to the local church. In places with ethnic communities of equal size, each would appoint its own priest.
The government planned to finish the census in three months and enlisted the cooperation
and support of local ethnic communities. Each individual registered was to receive a tezakir-i osmaniye, a kind of identity card. The census report contains statistical data by sandjak and vilayet on the sex and religious distribution of the population.
8 S. MUTLU
The last report on population published in 1919 is the Memalik-i Osmaniye’nin 1330 Senesi Nüfus İstatistiği. This is the 1914 population report used in this study. This document is an updated version of the 1905/6 Census and contains statistical data by sandjak and vilayet on the religious or linguistic make up of the population without going into its distribution by sex.
Besides the census reports, the Ottomans in the 19th century produced statistical annuals,
the salnames, starting in 1847. The population data for the whole empire first appeared in the volume issued for 1877/78. Starting with Bosnia in 1866, the vilayets also issued their own salnames. The last imperial salname was issued for 1918-22. The population figures in the vilayet salnames were based on earlier figures obtained by actual count, on tax registers and other information available to provincial administrators. However, their use is limited in as much as they do not form a continuous series and the quality of the population data varies greatly by vilayet4.
RELIABILITY OF THE CENSUSES It is clear from the above account that, taking into consideration the transportation and
communication facilities, personnel situation, and the ethnic, religious, make up of The Empire, the Ottomans took logical, if not meticulous, measures in their census and registration procedures. They devised means and measures, population certificates and identity booklets, which the individuals were obligated to produce in their dealings with the governmental authorities, making it in the interest of individuals to get counted and registered. The state was always keen to get a correct count of the population by its various attributes to arrive at a reliable assessment of its financial and military capabilities, and toward the end of the century to buttress its arguments against political demands by some ethnic minorities.
In the evaluation of the reliability of the censuses, perhaps it would best first to have a
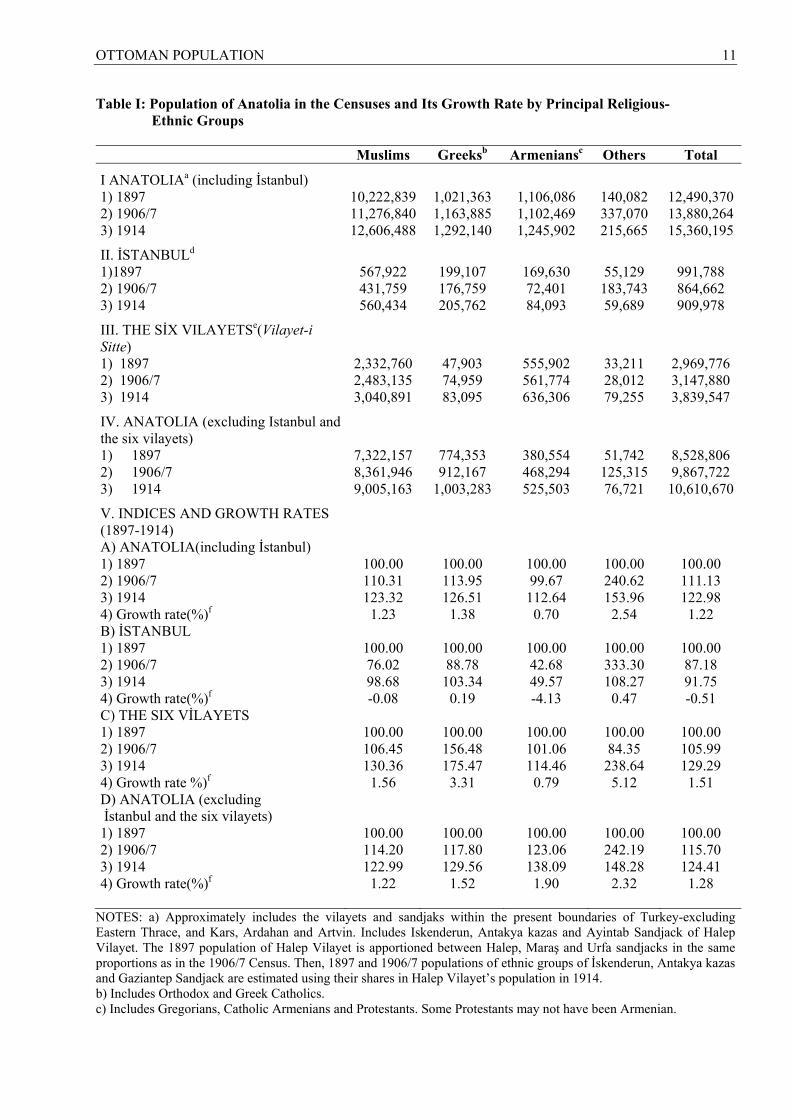
macro look at the census figures by ethnic groups and principal areas including the eastern vilayets, (Vilayet-i Sitte) over which there has been much contention. Table I gives such a macro picture.
There are wide variations between the growth rates of principal ethnic groups during the
1897-1914 period. This pattern, if the factors which might possibly account for it are not taken into consideration, might lead one to regard the censuses as unreliable, and the population figures as politically motivated.
The growth rate of Muslim population within the approximate present borders of Turkey
was 1.23 percent per annum during the period, not an unreasonable growth rate for the conditions of the time. The Greek minority, which includes all of those of Greek Orthodox denomination some of which, especially in Halep Vilayet and some sandjacks in the Southern and Southeastern Anatolia may not have been Greek, grew at 1.38 percent and the Armenian at 0.70 percent per annum. The “others” category, a small group, including the foreigners, grew at 2.54 percent per year. İstanbul’s population decreased, only the Greeks managing to grow at a positive but marginal rate. If we exclude the six eastern vilayets (vilayet-i sitte) and İstanbul, we meet with a different picture: Muslims growing at about the same rate, 1.22 percent per annum, the Greeks at 1.52 percent and the Armenians at 1.90 percent. The Greek and Armenian growth rates were quite high for the time.
What can account for these variations? A number of possible reasons can be advanced. i) The Muslims might have been undercounted, especially in the six vilayets in the 1897 Census Report, which actually was an updated summary of population registers based upon the 1881/82-1893 census. Many Muslims were nomads, for them only estimates were
OTTOMAN POPULATION 9
made. Under the pressure of the obligation to produce identity documents, the registration and estimation of those not registered got better. Hence, because it starts from a low base, the rate of growth of Muslims naturally appear higher than that of the Armenians. ii) The Armenians in the six vilayets, in the far off corner of the Empire where governmental authority was weaker, might have evaded registration in order not to pay the bedel-i askeriye, or to avoid draft after 1908 when non-Muslims were obliged to serve in the army (Zamir, 1981, p.87). Hence, their census growth rate is lower. In contradistinction to the six vilayets, in other parts of the Empire the Armenians were less rural and more amenable to count; governmental order and control was more firmly established, and the government was increasingly better able to count and register them. Moreover, in these vilayets a greater proportion of the Armenians than the Muslims were urban and engaged in trades and through time, if unwillingly, more and more Armenians had to register under the obligation to produce identity documents in their dealings with governmental authorities and non-governmental persons and bodies. Hence their census growth rates outside of the six vilayets appear higher than the Muslims. The same is true for the Greeks. iii) The lower rate of increase of the Armenians in the six vilayets in part might have been due to out-migration to other parts of Anatolia especially to the Aegean region and Cilicia where economic conditions were improving. However, such a thesis is only partially supported by the census figures. There were 85.5 thousand Armenians in the vilayets of Aydın and Hüdavendigar according to the 1897 Census Report and 105.3 thousand Armenians in roughly the same area in 1914, which means a growth rate of 1.23 percent per annum and which can be regarded as normal under the then prevailing conditions. There appears to have been some migration into Cilicia. Adana’s Armenian population was 36,695 in the 1897 Census Report, and 58,027 in 1914 including İçil’s which was formerly part of Adana vilayet. The increase between the two dates in Adana’s Armenian population, even when deaths in the inter-ethnic struggle is taken into consideration (see note 6), can hardly account for the low rate of growth in the Armenian population in other parts of the empire. However, again the substantial increase in Cilicia might have been due to better count and registration. iv) The low rate of growth of the Armenian population in six vilayets might have been due to immigration to foreign countries. There is evidence that such immigration was considerable5. v) The low rate of growth of the Armenian population might have been due to the deaths in the inter-ethnic struggle during the time. There were surely deaths, but not to the extent to produce such a low growth rate in the six vilayets, especially in comparison with the growth rate of Muslims . vi) In the case of the Greeks, they were, as the Armenians outside of the six vilayets, were more urbanized and engaged in trade. Thus they were not only likely to be better counted than Muslims but the necessity of presenting identity cards in official business might have led more of them to register. Perhaps more important, there was heavy migration of Greeks into to Aegean Region from the islands and Greece which continued well into the 20th century (Nakracas, 2003, pp. 76,80,92; Karpat, 1985, pp. 47). Hence, it was natural that the Greek population would increase at a much higher rate than the Muslims6 The reasons advanced for the differences between the growth rates of Muslims and
Armenians except the vth, may all have been valid but in differing degrees. In as much as there are only general statements in various sources, no firm statements can be made at this point. To settle contentions and establish the degree of validity of each of the above, detailed research is needed.
10 S. MUTLU
As to the census figures on İstanbul, it is difficult to advance reasons for the decrease of population. İstanbul had a growing economy (Karpat, 1985, pp. 86-105) and was a natural magnet not only for various ethnic groups in the Empire, but for foreigners as well. The only reasons that can be advanced are that i) many Greeks and Armenians might have been getting foreign passports to evade taxation7, a reason not valid for Muslims, ii) the censuses in a city so crowded were getting progressively more difficult and iii) the census regulation and registration rules were not well enforced.
Inter-ethnic growth rate differentials do not discredit or throw doubt upon the reliability of
the Ottoman censuses, for the reasons advanced above. The Ottoman censuses surely were not perfect as no census is8. The real question is were they better than the estimates made by the proponents of various irredentist claims. This point will be taken up later.
Students of Ottoman population censuses conducted since the 1880s are in agreement that,
despite some shortcomings admitted by the authorities, they were essentially correct counts in most of the provinces. There is little evidence of large scale avoidance of counting and registration especially in heavily populated areas and, according to informed opinion, no evidence so far of falsification of or adjustments in records for political purposes (Shaw, 1978, p. 336; Zamir, 1981, p. 86). According to the informed opinion of another student the margin of error of 1881-93 Census is possibly between 2 to 5 percent in areas with reasonably good communication facilities and 6 to 10 percent in remote areas (Karpat, 1978, p. 256; also see McCarthy 1998a, pp. 175-85, 192- 93). However, as it will become clear from a later section, margin of error was considerably greater than 10 percent in some provinces.
There are two principal sources of the margin of error: undercounting of i) women and ii)
children. To correct the census figures for undercounting of women we need to know the sex ratio. Though no information is available on the ratio for the relevant period, there is some data on Turkey. In as much as such parameters stay constant or nearly constant for long periods of time, contemporaneous data can be used without large margin of error.
OTTOMAN POPULATION 11
Table I: Population of Anatolia in the Censuses and Its Growth Rate by Principal Religious- Ethnic Groups
Muslims Greeksb Armeniansc Others Total
I ANATOLIAa (including İstanbul) 1) 1897 2) 1906/7 3) 1914
II. İSTANBULd 1)1897 2) 1906/7 3) 1914
III. THE SİX VILAYETSe(Vilayet-i Sitte) 1) 1897 2) 1906/7 3) 1914
IV. ANATOLIA (excluding Istanbul and the six vilayets) 1) 1897 2) 1906/7 3) 1914
V. INDICES AND GROWTH RATES (1897-1914) A) ANATOLIA(including İstanbul) 1) 1897 2) 1906/7 3) 1914 4) Growth rate(%)f B) İSTANBUL 1) 1897 2) 1906/7 3) 1914 4) Growth rate(%)f C) THE SIX VİLAYETS 1) 1897 2) 1906/7 3) 1914 4) Growth rate %)f D) ANATOLIA (excluding İstanbul and the six vilayets) 1) 1897 2) 1906/7 3) 1914 4) Growth rate(%)f
10,222,83911,276,84012,606,488
567,922 431,759 560,434
2,332,760 2,483,135 3,040,891
7,322,157 8,361,946 9,005,163
100.00 110.31 123.32
1.23
100.00 76.02 98.68 -0.08
100.00 106.45 130.36
1.56
100.00 114.20 122.99
1.22
1,021,363 1,163,885 1,292,140
199,107 176,759 205,762
47,903 74,959 83,095
774,353 912,167
1,003,283
100.00 113.95 126.51
1.38
100.00 88.78
103.34 0.19
100.00 156.48 175.47
3.31
100.00 117.80 129.56
1.52
1,106,086 1,102,469 1,245,902
169,630 72,401 84,093
555,902 561,774 636,306
380,554 468,294 525,503
100.00 99.67
112.64 0.70
100.00 42.68 49.57 -4.13
100.00 101.06 114.46 0.79
100.00 123.06 138.09 1.90
140,082 337,070 215,665
55,129
183,743 59,689
33,211 28,012 79,255
51,742 125,315 76,721
100.00 240.62 153.96
2.54
100.00 333.30 108.27
0.47
100.00 84.35
238.64 5.12
100.00 242.19 148.28
2.32
12,490,370 13,880,264 15,360,195
991,788 864,662 909,978
2,969,776 3,147,880 3,839,547
8,528,806 9,867,722
10,610,670
100.00 111.13 122.98 1.22
100.00 87.18 91.75 -0.51
100.00 105.99 129.29 1.51
100.00 115.70 124.41 1.28
NOTES: a) Approximately includes the vilayets and sandjaks within the present boundaries of Turkey-excluding Eastern Thrace, and Kars, Ardahan and Artvin. Includes Iskenderun, Antakya kazas and Ayintab Sandjack of Halep Vilayet. The 1897 population of Halep Vilayet is apportioned between Halep, Maraş and Urfa sandjacks in the same proportions as in the 1906/7 Census. Then, 1897 and 1906/7 populations of ethnic groups of İskenderun, Antakya kazas and Gaziantep Sandjack are estimated using their shares in Halep Vilayet’s population in 1914. b) Includes Orthodox and Greek Catholics. c) Includes Gregorians, Catholic Armenians and Protestants. Some Protestants may not have been Armenian.
12 S. MUTLU
d) İstanbul includes Dersaadet, and the suburbs (Şehremaneti Mülhakati). Catholics in the 1897 population register is apportioned between Greeks and Armenians, according to their shares of Catholic population in the 1914 register. e) Erzurum, Bitlis, Diyarbakır, Mamüretülaziz, Sivas and Van vilayets. f) Growth rate is over the period 1897 - 1914. DATA SOURCES: Güran (1997, pp. 23-25); Karpat (1985, pp. 162-89).
Table II: Sex Distribution of Population by Selected Vilayet
VİLAYET
1897 Census 1906/7 Census Male (%)
Female (%)
Male (%)
Female (%)
AYDIN i) Muslims ii) Greeks
ANKARA i) Muslims ii) Greeks
ERZURUM i) Muslims ii) Armeniansa
DİYARBAKIR i) Muslims ii) Armeniansa
VAN i) Muslims ii) Armeniansa
EMPIRE TOTAL
50.28 51.24
50.82 49.19
53.49 53.11
53.95 52.50
58.85 47.38
53.04
49.72 48.76
49.17 50.81
46.50 46.89
46.04 47.50
41.14 52.62
46.96
50.62 52.28
51.88 52.39
53.93 51.85
54.49 51.40
53.88 57.24
53.49
49.38 47.72
48.12 47.61
46.06 48.14
45.51 48.59
46.12 42.75
46.51
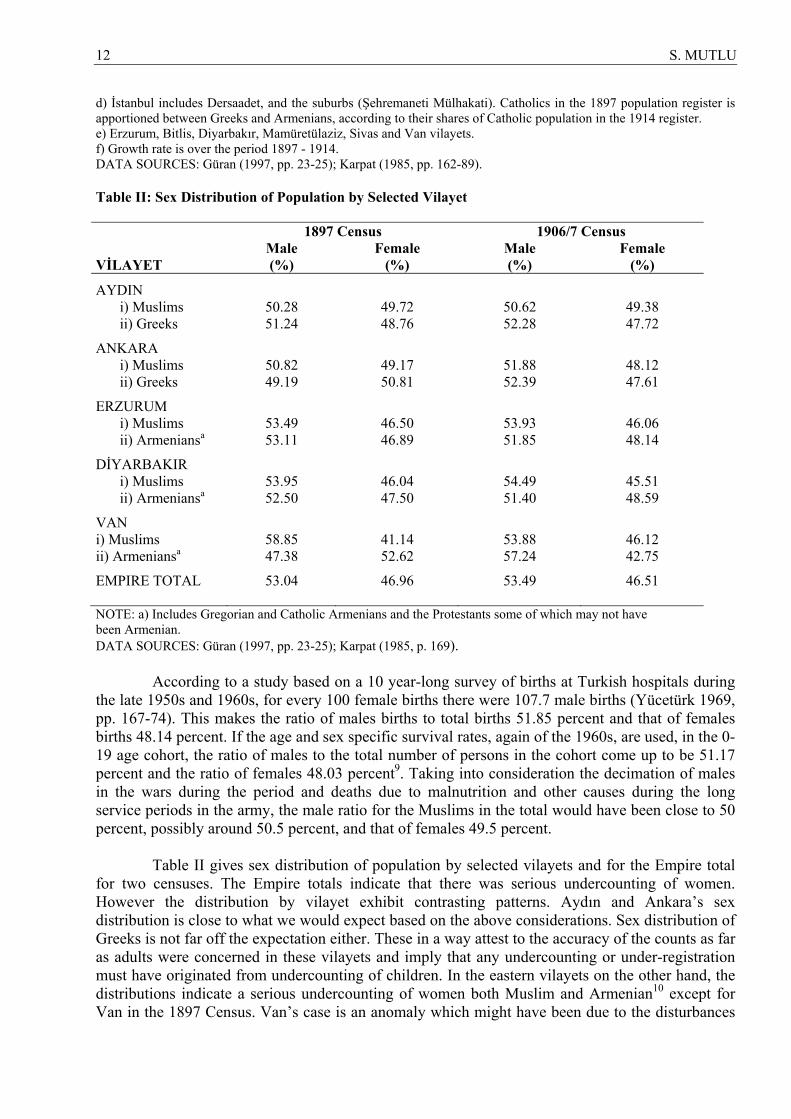
NOTE: a) Includes Gregorian and Catholic Armenians and the Protestants some of which may not have been Armenian. DATA SOURCES: Güran (1997, pp. 23-25); Karpat (1985, p. 169).
According to a study based on a 10 year-long survey of births at Turkish hospitals during
the late 1950s and 1960s, for every 100 female births there were 107.7 male births (Yücetürk 1969, pp. 167-74). This makes the ratio of males births to total births 51.85 percent and that of females births 48.14 percent. If the age and sex specific survival rates, again of the 1960s, are used, in the 0-19 age cohort, the ratio of males to the total number of persons in the cohort come up to be 51.17 percent and the ratio of females 48.03 percent9. Taking into consideration the decimation of males in the wars during the period and deaths due to malnutrition and other causes during the long service periods in the army, the male ratio for the Muslims in the total would have been close to 50 percent, possibly around 50.5 percent, and that of females 49.5 percent.
Table II gives sex distribution of population by selected vilayets and for the Empire total
for two censuses. The Empire totals indicate that there was serious undercounting of women. However the distribution by vilayet exhibit contrasting patterns. Aydın and Ankara’s sex distribution is close to what we would expect based on the above considerations. Sex distribution of Greeks is not far off the expectation either. These in a way attest to the accuracy of the counts as far as adults were concerned in these vilayets and imply that any undercounting or under-registration must have originated from undercounting of children. In the eastern vilayets on the other hand, the distributions indicate a serious undercounting of women both Muslim and Armenian10 except for Van in the 1897 Census. Van’s case is an anomaly which might have been due to the disturbances
OTTOMAN POPULATION 13
there at the time (McCarthy, 1998b, p. 130; Dadrian, 1997, pp. 131-38). Undercounting of children was widespread. Even when women were not seriously
undercounted as in Aydın, children were. Aydın’s population of 15 years of age and under was 191,202 in the 1897 Census. Taking a mortality level of 5, Gross Reproduction Rate (GRR) of 3, two parameters of which more will be said in the following section, and using the East Model Life Table (Demeny and Coale 1966, p. 614), we find that the number of males 15 years of age and under should have been 329,230 which gives us an undercount of 138,028 or 41.92 percent. This is not surprising in view of the fact that under-registration of children continued in the Republican Era, especially in the eastern provinces, though in a diminishing extent.
Apart from undercounting of women and children, there are some anomalies between
figures given in successive censuses or population reports, which are hard to explain. They don’t discredit the censuses but have to be kept in mind. A few of them will be pointed out.
The Armenian population of Greater İstanbul went down to 70 thousand in 1906/7 from
169 thousand in 1897, a drop of 58.6 percent in 10 years. Though there were widespread immigration of Armenians during the period, especially to the USA, it is still hard to account for such a drop in so short a period in one of the safest places in the Empire.İstanbul’s Muslim and Greek populations show a similar decline, but to a much smaller extent. Van’s Muslim population was 76.9 thousand in 1897 and 179.4 thousand in 1914, an increase of 133.3 percent in 17 years: an impossible rate of increase in the absence of wide-scale immigration.
The Armenians constituted 31.9 percent of the total population in Bitlis in the 1897 census
but only 27.2 percent 1914. However, unlike İstanbul’s case, a number of reasons can be advanced for this. The relative decline of Armenian population might have been due to under-registration and deaths during the wide-spread disturbances in the region at the time, and migration to foreign countries and to Cilicia, the latter of which was encouraged by the Armenian leadership11.
The number of Muslims, Greeks, Armenians and Jews in Dersaadet were exactly the same
in the Census Report of 1897 as in the report issued earlier containing the number of population counted up to 189512. By the latter date Muslim population in Edirne was 434,366 which went up to 539,031 in the 1897 Census Report. There were similar increases in other religious groups13. Apparently counting and registration continued during the period in Edirne whereas in İstanbul, registration was either discontinued or if continued it was not reflected in the Census Report14. This indicates that the population figures in the 1897 census are not of the same period for different vilayets. The same may be true for the later census reports and hence they must be used with discretion.
One final point about the Ottoman population censuses is that as towns were better
counted than less accessible rural areas, to the extent that Greeks and Armenians were more urbanized and lived in more accessible places than Muslims, especially in Eastern Anatolia where the latter were mostly nomads, they were better counted (Karpat, 1985).
CORRECTION COEFFICIENTS AND SOME ADJUSTMENTS As they are, the population figures in the Ottoman Census Reports and other documents
need to be corrected for undercounting of women and children. McCarthy (1998a) has done this with meticulous care. However, his work produced point estimates and this for only the Anatolian vilayets, excluding Thrace and İstanbul, within the approximate present borders of Turkey.
14 S. MUTLU
In as much as we can never be sure of selecting the correct parameters within the
framework of which the corrections are made it seems more reasonable to make the estimates within a range, with a lower and an upper bound. The present study is an attempt in that direction and includes not only the Anatolian vilayets but İstanbul and Thrace as well. In method, it follows McCarthy (1998a).
To make the estimates using a Model Life Table15 ,we need two parameters, a mortality
level16 and Gross Reproduction Rate (GRR)17, and the age distribution of population by sex. A study done in the 1960s found, that GRR for Turkey was 3 (SSYB, 1970, pp. 39,46).
Other studies support this finding (Demeny and Shorter, 1968, pp.46-52; Shorter, 1969, pp. 34-37; U.N., 1972, p.79). Moreover, there is evidence that his GRR was fairly stable over a long period of time (Shorter, 1969, pp. 34-37). Hence, in view of these findings a GRR of 3 was chosen for the study18.
An analysis of the census figures indicates that most of the vilayets were growing by about
1 percent per year during the period and some vilayets at considerable higher rates19. With the assumed GRR of 3, the mortality chosen must be of such level as to give a growth rate of at least this magnitude of 1. Level 5 assures this. The next lower mortality level, 4, gives a growth rate of 0.87 percent per year which is lower than the rate implied by the population census reports of 1897, 1905/6 and 1914. So, for the lower bound of estimates mortality level 5 is assumed to be the relevant one. For the upper bound of estimates mortality level 8 is taken, which implies a growth rate of 1.87 percent per year- with a GRR of 3.
The appropriateness of these mortality levels for the lower and upper bounds of the
estimates is supported by evidence provided by the expectation of life estimate of 36.7 years for men in Turkey for the 1945-50 period (Shorter and Macura, 1983, p. 100), at which time mass killers such as malaria and tuberculosis which used to decimate the Ottoman population were under reasonable control. Hence, expectation of life at birth during the period under consideration must have been lower than that during the 1945- 50 period. At mortality level 5, expectation of of life at birth for males is 27.39 years and at level 8, it is 34.77 years. These corroborate our choice of mortality levels for the lower and upper bounds of the estimates.
We follow McCharty (1998a) in deriving the correction coefficients. Except for İstanbul
the following formula is used20.
CC= ( ) MrtPmr
Mra÷⎥
⎦
⎤⎢⎣
⎡−1
Where CC is the correction coefficient, Mra the recorded number of males aged 15 years
of age and above, Pmr the percentage of males under 15 years of age in the Model Life Table and Mrt the total number of males recorded in the census.
Using the above formula, the East Model Life Tables, and the 1897 Census which has data
on age distribution by sex, first two sets of corrected population estimates were made by vilayet for the year 1897: one for mortality level 5 constituting the lower bound of estimates and one for mortality level 8 forming the upper bound. Then, using the same correction coefficients, sets of estimates were made 1905/06 and 1914. The same coefficients were used for the latter estimates
OTTOMAN POPULATION 15
because of the lack of census data on the distribution of population by age groups. To the extent that counting and registration of children improved in the census subsequent to the 1897 one, and in the registers, the latter corrected populations slightly overestimate the true populations21.
It is likely that this method underestimates the Muslim population of the western
provinces, especially of Aydın and Hüdavendigar, in as much as, being more densely settled and closer to the coast, a disproportionate number of male Muslims were recruited to the army few of which returned. For example, 90,079 Muslims were recruited to the army from the western provinces from the western vilayets in 1885 only 15734 of which returned (Kurmuş, 1982, pp. 74- 75).
A different method was used for the estimation of İstanbul’s population. Use of the same
method would have greatly overestimated the city’s population. İstanbul in the 19th century, as in the 20th, formed a magnet for temporary male workers (Karpat, 1985, p. 103; Quataert, 1983, pp. 96-100) and there were a lot of single person households (Duben, 2002, pp.190-91). To account for this particularity of İstanbul the following formula was used22 .
CC = TFrMrPfr
Frf÷
⎭⎬⎫
⎩⎨⎧
−+⎥⎦
⎤⎢⎣
⎡×
−)(2
1
Where Frf is the number of recorded females 15 years of age and above, Pfr the percentage of females under 15 years of age in the Model Life Table, Mr the recorded number of males, Fr the recorded number of females and T total population.
A correction coefficient was calculated for each of the principal religious - ethnic - group,
for Muslims, Greeks and Armenians, and an ethnic group population weighted average correction coefficient was calculated for the “other” category. The weighted coefficient comes up to be 1.1263 whereas if the formula used for other vilayets were utilized, the correction coefficient would have been 1.3225.
As has been said earlier, two correction coefficients have been calculated for each vilayet.
However, for Trabzon, with a GRR of 3, mortality level 5 gives a correction coefficient less than 1. Hence only one coefficient, for mortality level 8, was calculated for Trabzon.
A different kind of problem is represented by Van. Vilayet of Van’s Muslim population,
exclusive of Hakkari sandjak, was 77 thousand in 1897 constituting 58 percent of the total and that of non-Muslims 55 thousand, making up 42 percent of the population. Muslim population in the 1914 Census Report was 179.4 thousand and that of non-Muslims 79.8 thousand. The Muslim figures mean a rate of growth of 5.29 percent per annum, which is an impossibility in the absence of heavy immigration and a phenomena no known group in history has ever experienced. Clearly, Van’s Muslim population was grossly undercounted in the 1897 Census, the same was true of the non-Muslims 85 percent of which were Armenians. In making the corrections we follow McCarthy (1998a, pp. 83-84). We assume that the ethnic groups were undercounted by the same degree in the 1897 Census; hence the true proportion of each ethnic group in the total was the same as represented in the census, 58 percent and 42 percent for Muslims and non-Muslims respectively, and further that the proportions remained invariant over the period, from 1897 to 1914. This gives us an Armenian population of 110.4 thousand in 191423 , and we use this figure as the one to which the correction coefficient is to be applied.
16 S. MUTLU
A similar problem is exhibited by Bitlis. The proportion of Armenians in the 1897 Census Report was 32 percent. However in the 1914 Census Report it was only 27.2 percent, a sharp drop which may have been due to under-registration and deaths-on both sides-during the wide-spread disturbances in the region at the time. If we assume that the Muslim and Armenian population had increased at the same rate, during the interval between the two censuses, then the Armenian population in 1914 should have been 149 thousand. We take this figure as the one to which the correction coefficient is to be applied.24
A further accounting had to be done before population estimates were made. The 1897
Census Report gives the number of Catholic and Protestants by vilayet, but does not apportion these between Armenians and Greeks. The 1905/96 Census and 1914 Statistic not only have columns for Armenians and Greeks along with for other religious groups, but also separate columns for Greek Catholics, Armenian Catholics and Protestants. In the estimates for 1897 and 1914 populations, Greek Catholics were added to the Greeks (Orthodox) and Armenian Catholics and Protestants to the Armenians (Gregorians) although some Protestants may not have been Armenian25 and some Greek Orthodox especially in Halep Vilayet and some sandjacks in south and southeastern Anatolia not Greek. In order to bring the 1897 Census figures to the same base as in the other two, percentages of Greek Catholics and Armenian Catholics in the total Catholic population excluding Latins (Roman Catholics) were calculated and the Catholic population in the 1897 Census Report was apportioned between Greeks and Armenians, in the same proportion as in the 1914 Statistic.
The correction coefficients are given in Table III.They are by vilayets included in the 1897
Census Report. Due to lack of data by age groups, the same correction coefficients were used for the subsequent censuses. To the extent that counting and registration improved, this practice leads to over estimation of true population in the subsequent censuses.
More vilayets and some independent sandjaks were created after the 1st Census Report
considered here. For these, the same correction coefficient was used as the vilayets of which they were formerly a part. If a new vilayet was carved out of more than one vilayet, then the arithmetic average of the relevant vilayets was used as the correction coefficient for the new administrative unit.
A separate table is not produced for Mortality Level 8. Correction coefficients for M= 8
are 1.0464 times the coefficients for Mortality Level 5. Thus, the upper bound of population estimate for each vilayet is 1.0464 times the lower bound.
CORRECTED POPULATION AND ITS DISTRIBUTION Corrected population estimates for 1897 and 1914 by vilayets and by principal ethnic
groups are given in the Annex (Tables A I and A II). A summary for 1914 is given in Table IV. In those parts of the Empire within the approximate present boundaries of Turkey in 1914,
there were at most 19.59 million people of which 15.82 million were Muslims, 1.81 million were Greeks and 1.67 million Armenians. These groups constituted 80.72 percent, 9.25 percent and 8.51 percent of the total respectively. If we take the lower bound of estimates (M=5), the percentage distribution by ethnic groups varies slightly.
OTTOMAN POPULATION 17
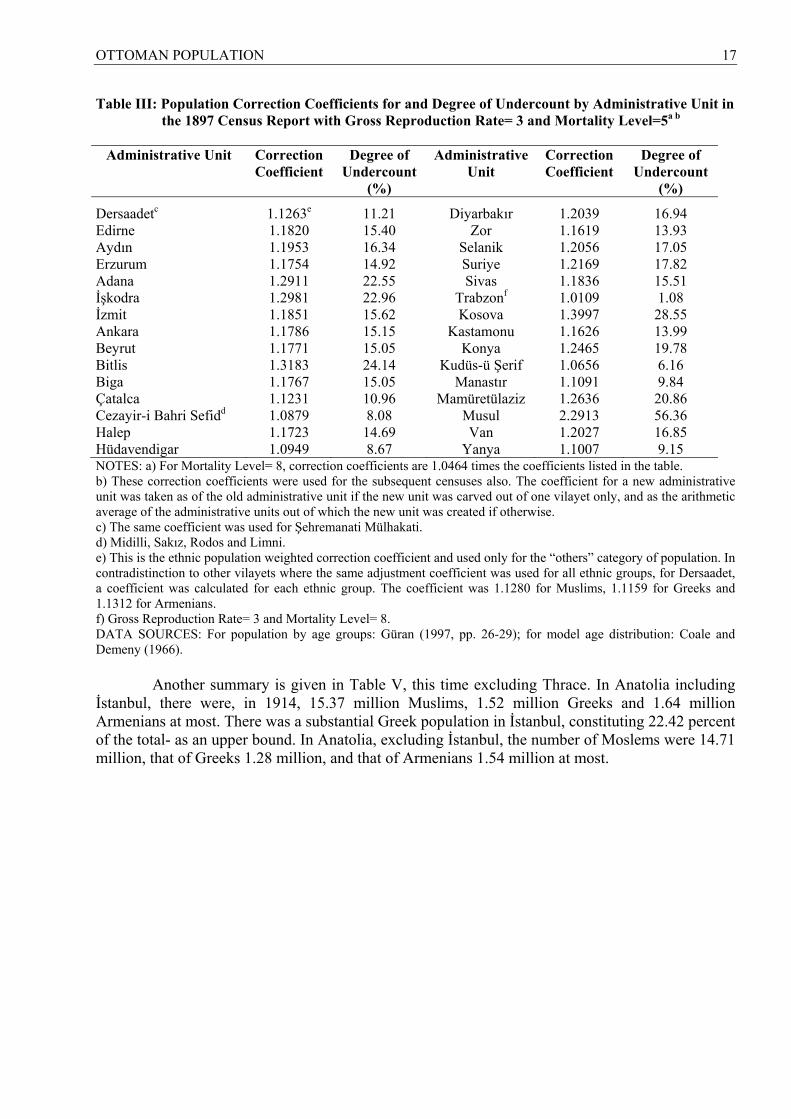
Table III: Population Correction Coefficients for and Degree of Undercount by Administrative Unit in the 1897 Census Report with Gross Reproduction Rate= 3 and Mortality Level=5a b
Administrative Unit
Correction Coefficient
Degree of Undercount
(%)
Administrative Unit
Correction Coefficient
Degree of Undercount
(%)
Dersaadetc
Edirne Aydın Erzurum Adana İşkodra İzmit Ankara Beyrut Bitlis Biga Çatalca Cezayir-i Bahri Sefidd Halep Hüdavendigar
1.1263e 1.1820 1.1953 1.1754 1.2911 1.2981 1.1851 1.1786 1.1771 1.3183 1.1767 1.1231 1.0879 1.1723 1.0949
11.21 15.40 16.34 14.92 22.55 22.96 15.62 15.15 15.05 24.14 15.05 10.96 8.08
14.69 8.67
Diyarbakır Zor
Selanik Suriye Sivas
Trabzonf Kosova
Kastamonu Konya
Kudüs-ü Şerif Manastır
Mamüretülaziz Musul Van
Yanya
1.2039 1.1619 1.2056 1.2169 1.1836 1.0109 1.3997 1.1626 1.2465 1.0656 1.1091 1.2636 2.2913 1.2027 1.1007
16.94 13.93 17.05 17.82 15.51 1.08
28.55 13.99 19.78 6.16 9.84
20.86 56.36 16.85 9.15
NOTES: a) For Mortality Level= 8, correction coefficients are 1.0464 times the coefficients listed in the table. b) These correction coefficients were used for the subsequent censuses also. The coefficient for a new administrative unit was taken as of the old administrative unit if the new unit was carved out of one vilayet only, and as the arithmetic average of the administrative units out of which the new unit was created if otherwise. c) The same coefficient was used for Şehremanati Mülhakati. d) Midilli, Sakız, Rodos and Limni. e) This is the ethnic population weighted correction coefficient and used only for the “others” category of population. In contradistinction to other vilayets where the same adjustment coefficient was used for all ethnic groups, for Dersaadet, a coefficient was calculated for each ethnic group. The coefficient was 1.1280 for Muslims, 1.1159 for Greeks and 1.1312 for Armenians. f) Gross Reproduction Rate= 3 and Mortality Level= 8. DATA SOURCES: For population by age groups: Güran (1997, pp. 26-29); for model age distribution: Coale and Demeny (1966).
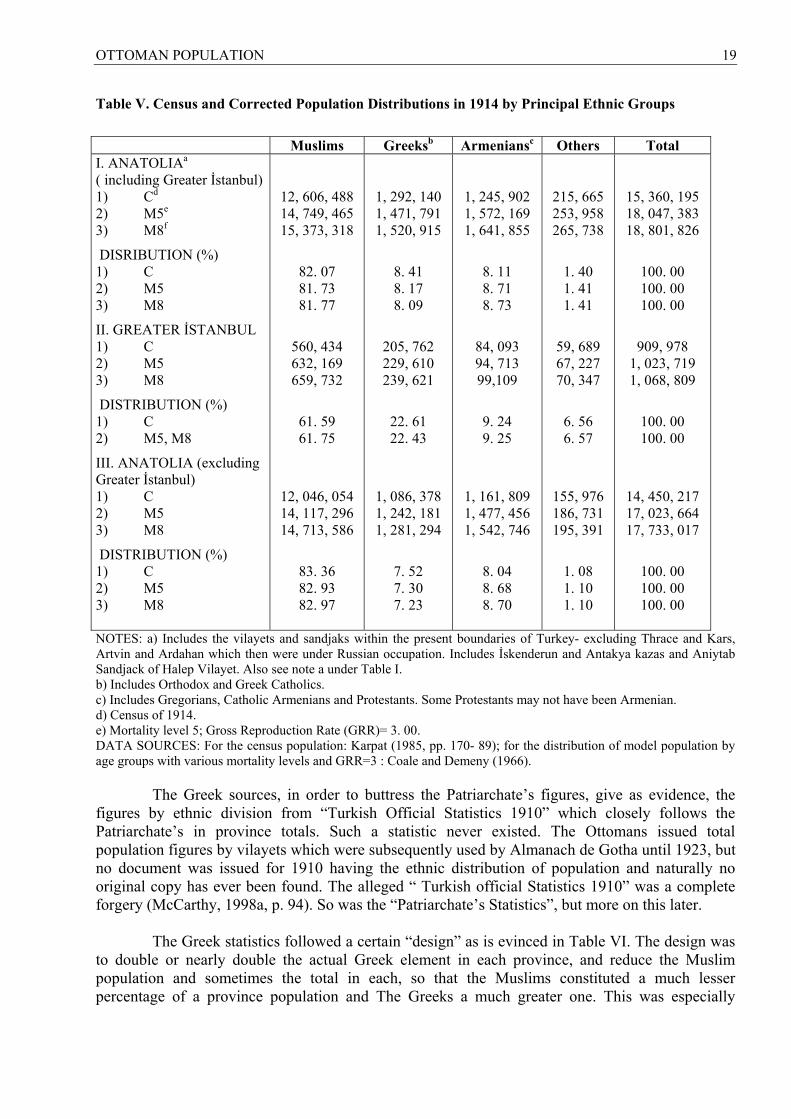
Another summary is given in Table V, this time excluding Thrace. In Anatolia including İstanbul, there were, in 1914, 15.37 million Muslims, 1.52 million Greeks and 1.64 million Armenians at most. There was a substantial Greek population in İstanbul, constituting 22.42 percent of the total- as an upper bound. In Anatolia, excluding İstanbul, the number of Moslems were 14.71 million, that of Greeks 1.28 million, and that of Armenians 1.54 million at most.
18 S. MUTLU
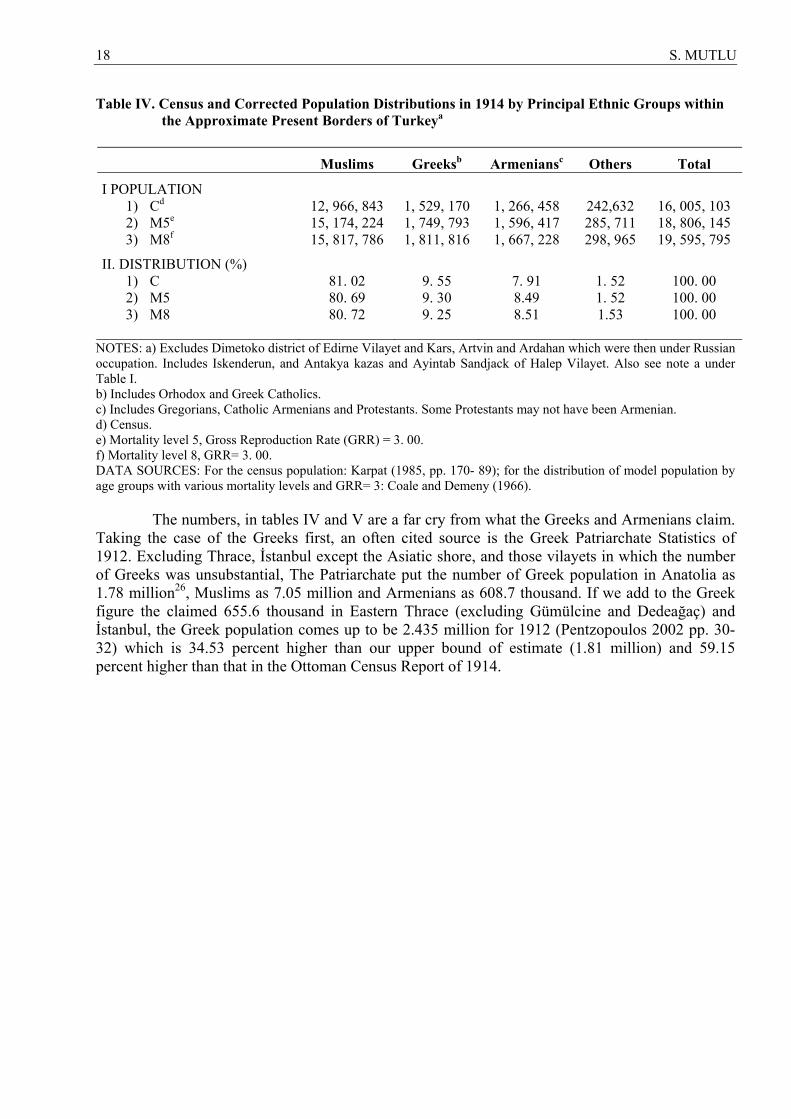
Table IV. Census and Corrected Population Distributions in 1914 by Principal Ethnic Groups within the Approximate Present Borders of Turkeya
Muslims
Greeksb
Armeniansc
Others
Total
I POPULATION 1) Cd 2) M5e 3) M8f
II. DISTRIBUTION (%) 1) C 2) M5 3) M8
12, 966, 843 15, 174, 224 15, 817, 786
81. 02 80. 69 80. 72
1, 529, 170 1, 749, 793 1, 811, 816
9. 55 9. 30 9. 25
1, 266, 458 1, 596, 417 1, 667, 228
7. 91 8.49 8.51
242,632 285, 711 298, 965
1. 52 1. 52 1.53
16, 005, 103 18, 806, 145 19, 595, 795
100. 00 100. 00 100. 00
NOTES: a) Excludes Dimetoko district of Edirne Vilayet and Kars, Artvin and Ardahan which were then under Russian occupation. Includes Iskenderun, and Antakya kazas and Ayintab Sandjack of Halep Vilayet. Also see note a under Table I. b) Includes Orhodox and Greek Catholics. c) Includes Gregorians, Catholic Armenians and Protestants. Some Protestants may not have been Armenian. d) Census. e) Mortality level 5, Gross Reproduction Rate (GRR) = 3. 00. f) Mortality level 8, GRR= 3. 00. DATA SOURCES: For the census population: Karpat (1985, pp. 170- 89); for the distribution of model population by age groups with various mortality levels and GRR= 3: Coale and Demeny (1966).
The numbers, in tables IV and V are a far cry from what the Greeks and Armenians claim.
Taking the case of the Greeks first, an often cited source is the Greek Patriarchate Statistics of 1912. Excluding Thrace, İstanbul except the Asiatic shore, and those vilayets in which the number of Greeks was unsubstantial, The Patriarchate put the number of Greek population in Anatolia as 1.78 million26, Muslims as 7.05 million and Armenians as 608.7 thousand. If we add to the Greek figure the claimed 655.6 thousand in Eastern Thrace (excluding Gümülcine and Dedeağaç) and İstanbul, the Greek population comes up to be 2.435 million for 1912 (Pentzopoulos 2002 pp. 30-32) which is 34.53 percent higher than our upper bound of estimate (1.81 million) and 59.15 percent higher than that in the Ottoman Census Report of 1914.
OTTOMAN POPULATION 19
Table V. Census and Corrected Population Distributions in 1914 by Principal Ethnic Groups
NOTES: a) Includes the vilayets and sandjaks within the present boundaries of Turkey- excluding Thrace and Kars, Artvin and Ardahan which then were under Russian occupation. Includes İskenderun and Antakya kazas and Aniytab Sandjack of Halep Vilayet. Also see note a under Table I. b) Includes Orthodox and Greek Catholics. c) Includes Gregorians, Catholic Armenians and Protestants. Some Protestants may not have been Armenian. d) Census of 1914. e) Mortality level 5; Gross Reproduction Rate (GRR)= 3. 00. DATA SOURCES: For the census population: Karpat (1985, pp. 170- 89); for the distribution of model population by age groups with various mortality levels and GRR=3 : Coale and Demeny (1966).
The Greek sources, in order to buttress the Patriarchate’s figures, give as evidence, the
figures by ethnic division from “Turkish Official Statistics 1910” which closely follows the Patriarchate’s in province totals. Such a statistic never existed. The Ottomans issued total population figures by vilayets which were subsequently used by Almanach de Gotha until 1923, but no document was issued for 1910 having the ethnic distribution of population and naturally no original copy has ever been found. The alleged “ Turkish official Statistics 1910” was a complete forgery (McCarthy, 1998a, p. 94). So was the “Patriarchate’s Statistics”, but more on this later.
The Greek statistics followed a certain “design” as is evinced in Table VI. The design was
to double or nearly double the actual Greek element in each province, and reduce the Muslim population and sometimes the total in each, so that the Muslims constituted a much lesser percentage of a province population and The Greeks a much greater one. This was especially
Muslims Greeksb Armeniansc Others Total I. ANATOLIAa ( including Greater İstanbul) 1) Cd 2) M5e 3) M8f
DISRIBUTION (%) 1) C 2) M5 3) M8
II. GREATER İSTANBUL 1) C 2) M5 3) M8
DISTRIBUTION (%) 1) C 2) M5, M8
III. ANATOLIA (excluding Greater İstanbul) 1) C 2) M5 3) M8
DISTRIBUTION (%) 1) C 2) M5 3) M8
12, 606, 488 14, 749, 465 15, 373, 318
82. 07 81. 73 81. 77
560, 434 632, 169 659, 732
61. 59 61. 75
12, 046, 054 14, 117, 296 14, 713, 586
83. 36 82. 93 82. 97
1, 292, 140 1, 471, 791 1, 520, 915
8. 41 8. 17 8. 09
205, 762 229, 610 239, 621
22. 61 22. 43
1, 086, 378 1, 242, 181 1, 281, 294
7. 52 7. 30 7. 23
1, 245, 902 1, 572, 169 1, 641, 855
8. 11 8. 71 8. 73
84, 093 94, 713 99,109
9. 24 9. 25
1, 161, 809 1, 477, 456 1, 542, 746
8. 04 8. 68 8. 70
215, 665 253, 958 265, 738
1. 40 1. 41 1. 41
59, 689 67, 227 70, 347
6. 56 6. 57
155, 976 186, 731 195, 391
1. 08 1. 10 1. 10
15, 360, 195 18, 047, 383 18, 801, 826
100. 00 100. 00 100. 00
909, 978
1, 023, 719 1, 068, 809
100. 00 100. 00
14, 450, 217 17, 023, 664 17, 733, 017
100. 00 100. 00 100. 00
20 S. MUTLU
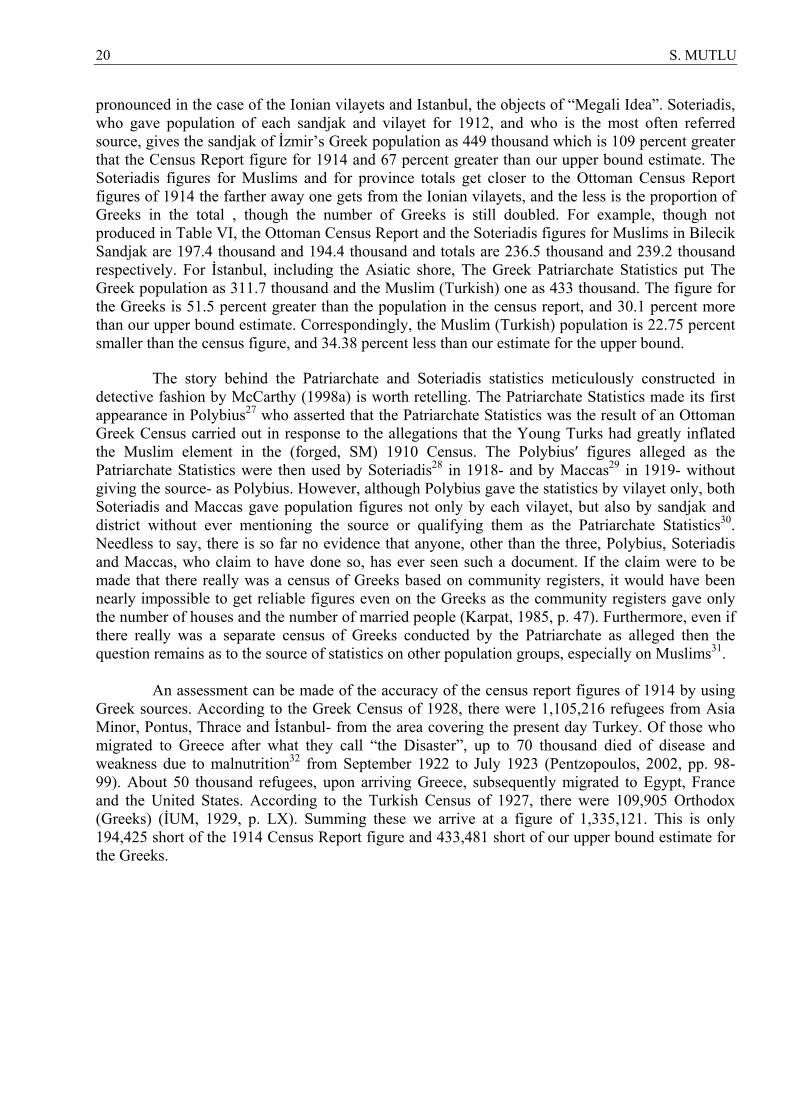
pronounced in the case of the Ionian vilayets and Istanbul, the objects of “Megali Idea”. Soteriadis, who gave population of each sandjak and vilayet for 1912, and who is the most often referred source, gives the sandjak of İzmir’s Greek population as 449 thousand which is 109 percent greater that the Census Report figure for 1914 and 67 percent greater than our upper bound estimate. The Soteriadis figures for Muslims and for province totals get closer to the Ottoman Census Report figures of 1914 the farther away one gets from the Ionian vilayets, and the less is the proportion of Greeks in the total , though the number of Greeks is still doubled. For example, though not produced in Table VI, the Ottoman Census Report and the Soteriadis figures for Muslims in Bilecik Sandjak are 197.4 thousand and 194.4 thousand and totals are 236.5 thousand and 239.2 thousand respectively. For İstanbul, including the Asiatic shore, The Greek Patriarchate Statistics put The Greek population as 311.7 thousand and the Muslim (Turkish) one as 433 thousand. The figure for the Greeks is 51.5 percent greater than the population in the census report, and 30.1 percent more than our upper bound estimate. Correspondingly, the Muslim (Turkish) population is 22.75 percent smaller than the census figure, and 34.38 percent less than our estimate for the upper bound.
The story behind the Patriarchate and Soteriadis statistics meticulously constructed in
detective fashion by McCarthy (1998a) is worth retelling. The Patriarchate Statistics made its first appearance in Polybius27 who asserted that the Patriarchate Statistics was the result of an Ottoman Greek Census carried out in response to the allegations that the Young Turks had greatly inflated the Muslim element in the (forged, SM) 1910 Census. The Polybius′ figures alleged as the Patriarchate Statistics were then used by Soteriadis28 in 1918- and by Maccas29 in 1919- without giving the source- as Polybius. However, although Polybius gave the statistics by vilayet only, both Soteriadis and Maccas gave population figures not only by each vilayet, but also by sandjak and district without ever mentioning the source or qualifying them as the Patriarchate Statistics30. Needless to say, there is so far no evidence that anyone, other than the three, Polybius, Soteriadis and Maccas, who claim to have done so, has ever seen such a document. If the claim were to be made that there really was a census of Greeks based on community registers, it would have been nearly impossible to get reliable figures even on the Greeks as the community registers gave only the number of houses and the number of married people (Karpat, 1985, p. 47). Furthermore, even if there really was a separate census of Greeks conducted by the Patriarchate as alleged then the question remains as to the source of statistics on other population groups, especially on Muslims31.
An assessment can be made of the accuracy of the census report figures of 1914 by using
Greek sources. According to the Greek Census of 1928, there were 1,105,216 refugees from Asia Minor, Pontus, Thrace and İstanbul- from the area covering the present day Turkey. Of those who migrated to Greece after what they call “the Disaster”, up to 70 thousand died of disease and weakness due to malnutrition32 from September 1922 to July 1923 (Pentzopoulos, 2002, pp. 98- 99). About 50 thousand refugees, upon arriving Greece, subsequently migrated to Egypt, France and the United States. According to the Turkish Census of 1927, there were 109,905 Orthodox (Greeks) (İUM, 1929, p. LX). Summing these we arrive at a figure of 1,335,121. This is only 194,425 short of the 1914 Census Report figure and 433,481 short of our upper bound estimate for the Greeks.

OTTOMAN POPULATION 21
Table VI: Population Distribution of Western Anatolia by Principal Ethnic Groups in 1914 According to Different Sources
Muslims
Greeks
Armenians
Others
Total
I. 3 SANDJAKS 1) İzmir
a) Census b) Soteriadisa c)Corrected Censusb
2) Manisa a) Census b) Soteriadis c) Corrected Census
3) Aydın a) Census b) Soteriadis c) Corrected Census
II. TOTAL (3 sandjaks) a) Census b) Soteriadis c) Corrected Census
II. OTHER WESTERN SANDJAKSe 1) Census 2) Soteriadis 3) Corrected Census
III. DISTRIBUTION (%)
A) 3 SANDJAKS 1) Census 2) Soteriadis 3) Corrected Census
B) OTHER WESTERN SANDJAKS 1) Census 2) Soteriadis 3) Corrected Census
378,883219,494472,703
378, 336247, 776473, 208
234, 449162, 554c
293, 248
991, 668629, 824
1, 239, 159
2, 008, 1431, 640, 1762, 360, 225
73. 4648. 0173. 43
86. 2878. 2886. 47
214, 686449, 044268, 521
47, 32683, 62559, 193
30, 39954, 63338, 023
292, 411587, 302365, 736
213, 969352, 759248, 372
21. 6644. 7721. 68
9. 1916. 849. 10
14, 273 11, 395 17, 853
4, 882 3, 960 6, 106
1,293
634 1,617
20, 448 15, 989 25, 576
85, 448 95, 140f 97, 739
1. 51 1. 22 1. 52
3. 67 4. 54 3. 58
32, 915 74, 113 41, 169
3, 910 2, 564 4, 890
8, 648
2, 138d 10.,817
45, 473 78, 815 56, 876
20, 169 13, 127 23, 736
3. 37 6. 01 3. 37
0. 87 0. 63 0. 87
640, 757754, 046800, 246
434, 454337, 925543, 397
274, 789219, 959343, 705
1, 350, 0001, 311, 9301, 687, 347
2, 327, 7292, 095, 2622, 729, 622
100. 00100. 00100. 00
100. 00100. 00100. 00
NOTES: a) The original source is George Soteriadis, An Ethnological Map Illustrating Hellenism in the Balkan Peninsula and Asia Minor. London: Edward Stanford Ltd., 1918. Here, we use Soteriadis′ figures as given in Nakracas (2003). b) Upper bound estimate with GRR=3 and Mortality Level=8. c) The total given by Nakracas (2003, p. 107) is 165, 554. However his figures by district add up to only 162, 554. d) When the Muslim (Turkish), Greek and Armenian populations by district are substracted from the total population of the sandjak, the population in the other category comes up to be 2564 which is greater than 2138 given in Nakracas (2003, p. 107). e) The other sandjaks are Denizli, Menteşe, Kale-i Sultaniye (Çanakkale), Karesi (Balıkesir) Hüdavendigar (Bursa), Bilecik, Kütahya and Karahisar-ı Sahip (Afyonkarahisar). f) Nakracas (2003) does not give a figure for the Armenian population in Karahisar-ı Sahip, Here, the census figure is taken and the “others” category adjusted accordingly. DATA SOURCES: Karpat (1985, pp. 170- 87), Nakracas (2003).
However the 1928 Greek Census does not depict the real number of refugees. The third
Chairman of the Refugee Commission of the League of Nations, Charles B. Eddy, characterized the
22 S. MUTLU
census figures as an understatement and considered that a refugee figure of 1.3 million as being more accurate33. There are others who put number of refugees as high as 1.4 million (Pentzopoulos, 2002, p. 99). If we take Eddy’s figure, the total number of refugees adds up to 1,459,905 only 33,641 short of the 1914 Census Report figure and 308,697 less than our higher bound estimate. These differences are a consequence of the deaths during the First World War and the Turco- Greek War34 and attest to the high degree of reliability of the Ottoman Census Report.
As in the case of the Greeks, there are controversial figures on the Armenian population
within the Empire. Ever since the beginning decades of the19th century, the Western powers of the time took an increasing interest in the Ottoman Armenians. First came the missionaries, and partly due to their efforts, there arose a cultural invigoration among the Armenians (Shaw and Shaw, 2000, vol. II, pp. 251- 52), especially of Catholic and Protestant denomination, which in time led to nationalist movements and demands and towards the end of the 19th century to uprising and terrorist activities. In the Berlin Congress of 1878, the Ottoman government pledged to undertake reforms in the areas where the Armenians were concentrated- in the eastern vilayets. This further intensified western interest in the Armenian affairs and produced a plethora of figures on Armenian population. These can be seen in Uras (1988, pp. 353- 65), Karpat (1978, p. 257), McCarthy (1998a, p. 66), and Karpat (1985, pp. 51- 54). There are wide variations in the figures, and sometimes gross exaggerations. In a memorandum to the Lausanne Conference, the United Armenian Delegation argued that there were 2.25 million Armenians in Turkey before the War of which 1. 25 million had been killed and 700 thousand emigrated (Uras, 1988, p. 975). In the same conference, the head of the British Delegation, Lord Curzon asked the Turkish Delegation “..., how was it that the 3 million Armenians formerly in Asia Minor had been reduced to 130 thousand?”, to which the Turkish Delegation responded by pointing out that there must be some error in the figure of 3 million, for they had never seen such a figure in any statistics, and that Cuinet from which most of the statistics published in Europe were derived spoke of 1.4 million only (Uras, 1988, p. 983). For a time it seemed as if Armenian population estimate was a free for all game.
What did the Ottoman statistics say on the Armenian population? According to the 1914
Census Report, there were 1.27 million Armenians then within the approximate present borders of Turkey. Our upper bound estimate is 1.67 million. The Armenians constituted 7.91 percent of the population according to our estimate (Table IV).
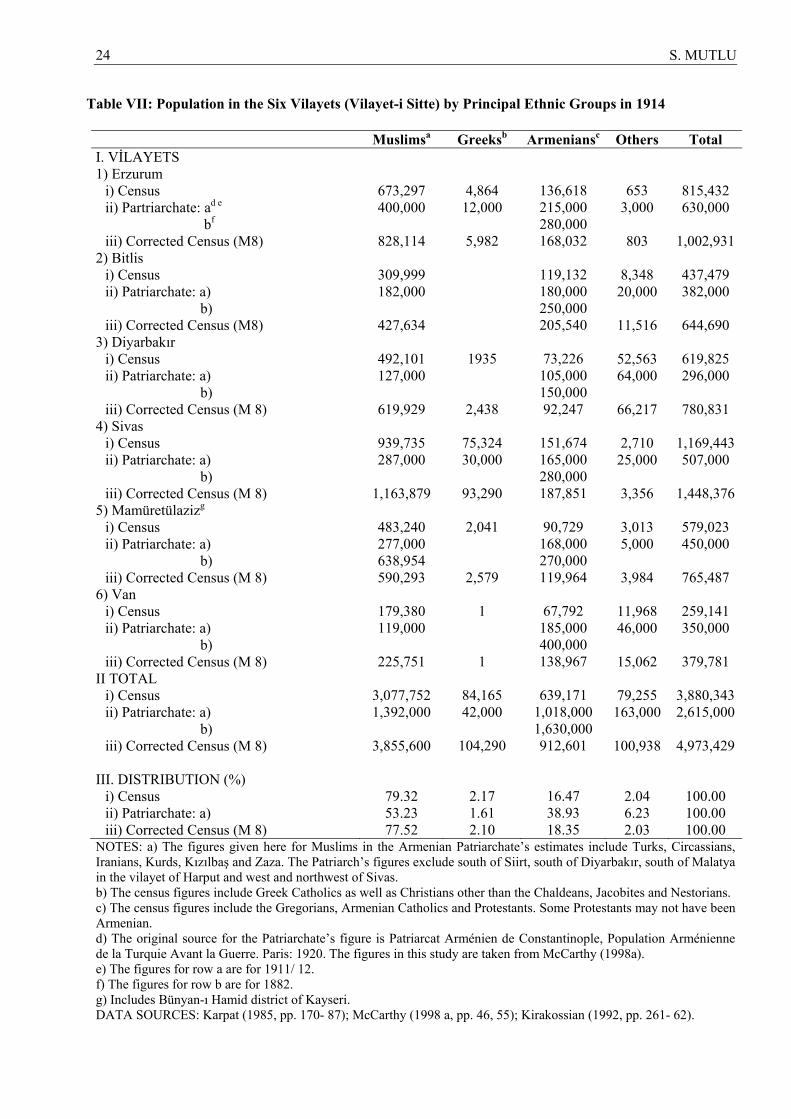
At the center of contention between various population estimates lies the population of the
six vilayets (vilayet-i sitte) in the East in which the Ottoman government pledged to undertake reforms favoring the Armenians. In those vilayets, the Armenians numbered 639 thousand in the 1914 Census Report, and 1.018 million in 1912 according to the Armenian Patriarch of the time. Our upper bound estimate gives 912.6 million. The Muslims constituted 79.32 percent of the total population and Armenians 16.47 percent in the 1914 Census Report (Table VII). In the Patriarch’s statistics they accounted for 53.23 percent and 38.93 percent of the population respectively. Our upper bound estimate gives a slightly lower percentage for Muslims (77.52 percent) than the Census Report and higher one for the Armenians (18.35 percent). The ratio of the Armenian population to total population in the Patriarch’s figures is more than twice as high as the ratio in the Census Report and in our upper bound estimate. As to the total population in the six vilayets; the Patriarch’s figure is only 67.39 percent of that of the Census Report and only 52.58 percent of our upper bound estimate.
OTTOMAN POPULATION 23
Earlier, in 1882, the Patriarch issued a set of figures on the Armenians. In that statistic the Armenians numbered 1.63 million in the six vilayets, 2.55 times the number they reached in the 1914 Census Report. These figures were implicitly disowned when the Patriarch issued the 1912 figures.
The ploy in the Armenian Patriarch’s figures was the same as in the forged Greek
Patriarchate Statistics: doubling or near- doubling of the Cuinet’s estimates or the earlier Ottoman census figures for the Armenians, and correspondingly, but to a much greater extent, decreasing the figures for Muslims and the vilayet totals.
There is no evidence supporting the Patriarch’s numbers. Conceivably they could have
been based on church registers. But to date, neither any local church register nor any document showing the summation of local registers at the Patriarchate in İstanbul has been produced as proof (McCarthy, 1998a, pp.56- 59). More important, even if such records of the Armenian population existed, how could the local priests, and hence the Patriarch who would be getting his numbers from them, ever know how many Muslims existed short of a census. Yet, the census figures belie the Patriarch’s . Hence, the Patriarch’s figures were nothing but politically motivated constructions.
24 S. MUTLU
Table VII: Population in the Six Vilayets (Vilayet-i Sitte) by Principal Ethnic Groups in 1914
Muslimsa Greeksb Armeniansc Others Total I. VİLAYETS 1) Erzurum
i) Census ii) Partriarchate: ad e
bf iii) Corrected Census (M8)
2) Bitlis i) Census ii) Patriarchate: a) b) iii) Corrected Census (M8)
3) Diyarbakır i) Census ii) Patriarchate: a) b) iii) Corrected Census (M 8)
4) Sivas i) Census ii) Patriarchate: a) b) iii) Corrected Census (M 8)
5) Mamüretülazizg i) Census ii) Patriarchate: a) b) iii) Corrected Census (M 8)
6) Van i) Census ii) Patriarchate: a) b) iii) Corrected Census (M 8)
II TOTAL i) Census ii) Patriarchate: a) b) iii) Corrected Census (M 8)
III. DISTRIBUTION (%)
i) Census ii) Patriarchate: a) iii) Corrected Census (M 8)
673,297 400,000
828,114
309,999 182,000
427,634
492,101 127,000
619,929
939,735 287,000
1,163,879
483,240 277,000 638,954 590,293
179,380 119,000
225,751
3,077,752 1,392,000
3,855,600
79.32 53.23 77.52
4,864 12,000
5,982
1935
2,438
75,324 30,000
93,290
2,041
2,579
1
1
84,165 42,000
104,290
2.17 1.61 2.10
136,618 215,000 280,000 168,032
119,132 180,000 250,000 205,540
73,226
105,000 150,000 92,247
151,674 165,000 280,000 187,851
90,729
168,000 270,000 119,964
67,792
185,000 400,000 138,967
639,171
1,018,000 1,630,000 912,601
16.47 38.93 18.35
653 3,000
803
8,348
20,000
11,516
52,563 64,000
66,217
2,710
25,000
3,356
3,013 5,000
3,984
11,968 46,000
15,062
79,255
163,000
100,938
2.04 6.23 2.03
815,432 630,000
1,002,931
437,479 382,000
644,690
619,825 296,000
780,831
1,169,443 507,000
1,448,376
579,023 450,000
765,487
259,141 350,000
379,781
3,880,343 2,615,000
4,973,429
100.00 100.00 100.00
NOTES: a) The figures given here for Muslims in the Armenian Patriarchate’s estimates include Turks, Circassians, Iranians, Kurds, Kızılbaş and Zaza. The Patriarch’s figures exclude south of Siirt, south of Diyarbakır, south of Malatya in the vilayet of Harput and west and northwest of Sivas. b) The census figures include Greek Catholics as well as Christians other than the Chaldeans, Jacobites and Nestorians. c) The census figures include the Gregorians, Armenian Catholics and Protestants. Some Protestants may not have been Armenian. d) The original source for the Patriarchate’s figure is Patriarcat Arménien de Constantinople, Population Arménienne de la Turquie Avant la Guerre. Paris: 1920. The figures in this study are taken from McCarthy (1998a). e) The figures for row a are for 1911/ 12. f) The figures for row b are for 1882. g) Includes Bünyan-ı Hamid district of Kayseri. DATA SOURCES: Karpat (1985, pp. 170- 87); McCarthy (1998 a, pp. 46, 55); Kirakossian (1992, pp. 261- 62).
OTTOMAN POPULATION 25
CONCLUSIONS The Ottomans had a keen interest in censuses, in knowing the number of Muslim and non-
Muslim subjects in as much as their recruitment for the army, and the assessment of their taxes depended on such knowledge. Their census procedures improved over time, and the obligation on the part or the subjects to produce identity documents in their official dealings led to progressively better registration.
The censuses were far from perfect. Women and children were undercounted, and in some
vilayets seriously. These are amenable to correction and this has been done in this study producing a lower bound and an upper bound estimate for each administrative unit.
The population figures advanced to support various political causes by the minority
protagonists do not stand up to investigation. There is no evidence neither of politically motivated interference by the Ottoman authorities in census procedures, nor of any falsification in the census records. When corrected for undercounts of women and children, the census records prove to be reliable documents.
26 S. MUTLU
NOTES 1 The quotation by Karpat is from Ubicini, Letters on Turkey, trans: by Lady Easthope. London, 1956; reprinted., NewYork: Arno Press, 1973, pp. 23-24. The census figures were used also by Eugène Boré, Almanach de L' Empire Ottoman Pour L'année 1849/1850. Constantinople, 1849/1850. 2 Shaw gives te date as 1878 in the text. But his footnote 12, on the same page, referring to BUA, Şuray-ı Devlet 3148, gives it as 8 Şevval 1298/21 August 1881 (Shaw, 1978, p.330). Karpat gives the date as 8 Şaban 1298/5 July 1881, again referring to BUA, İrade, Şuray-ı Devlet 3148 (Karpat, 1978, p.251). 3 His interest in the censuses is attested by the American Ambassador S. Cox who was asked by the Sultan for a statistical review of the recent American Census. He told the ambassador in 1886 that he was very interested in such works and pointed out that it was his hope to compile a complete and systematic statistical record of the entire population in his realm. (Karpat, 1978, pp. 242-43 and Karpat, 1985, p. 3). Karpat’s sources are a letter from the Sultan’s private secretary and Ambassador Cox’s memoirs. 4 A complete list of the imperial salnames can be found in Karpat (1985, pp. 12-13); see also McCarthy (1998a, pp. 173-74). 5 Before the First World War, Armenians migrated mainly to the United States and to the neighbouring countries, to the Russian Armenia and some to Persia. Karpat estimates that between 1854 and 1908, some 500,000 to 800,000 Greeks, Armenians and Arabs emigrated, chiefly to Russia and the Americas (Karpat, 1985, p. 11). 6 A source notes that there were 150,000 Armenian deaths during 1895/96 due to inter-ethnic struggle, in the Central and Eastern Anatolia: Garo Chichekian, “The Armenians Since The Treaty of San Stephano”, Armenian Review. Vol. 22, No. 2 (Spring 1968) pp. 42-56; cited in McCarthy (1998a, p. 55) . McCarthy finds this figure, as highly exaggerated, and his claim is supported by some figures. According to an Armenian historian, in the first Sasun rebellion in 1894, “No one has ever been able to give even an approximate number of the Armenians killed. Some say six or seven thousand, others say around one thousand. Probably the latter is nearer the truth”. M. Varandian, History of the Dashnaksution, Paris, 1932, p. 146; cited in Uras (1988, p. 728). In the second Sason rebellion, in 1904, according to an Armenian source, the casualties were about 1000 mainly on the Turkish side; the Armenian casualties were in the low hundreds (Kukulian, The Battles of Antranik, Beirut, 1929; cited in Uras 1988, pp. 778-780). Between 1 July and 3 December, 1895 ,there were 26 inter-ethic incidents in which, according to the Ottoman sources, there were 1828 Muslim and 8717 non-Muslim (Armenian) deaths; The wounded were 1433 and 2238 respectively (Gürün, 2001, pp. 147-149). Outside of the six vilayets the bloodiest incident took place in Adana in April 1909. The Armenians, without giving supporting documents, claim that in the April 1909 uprising in Adana 25,000 Armenians were killed (Dadrian, 1997, p. 182). According to the report prepared by Babikian Efendi, the Edirne representative in the Ottoman Assembly, there were 20,001 deaths. Cemal Pasha who was appointed governor of the provience after the incidents, gave the numbers as 17000 Armenian, and 1850 Muslim deaths. The Amerinian Patriarchate put the total number of deaths as 21,300, based on the investigation it carried out. According to Babikian Efendi, Ottoman government put the number of deaths as 1487 Muslims and 4196 non-Muslims, based on population registers (McCarthy, 1998b, p. 133, note 58; Gürün ,2001, pp. 169-170; Sonyel, 1988; pp. 41-42). The whole Armenian population in Cilicia in 1897 was 37 thousand. Assuming population growth of 1.5 percent per year, the Armenian population in Cilicia should have reached 45 thousand in 1909; taking account of undercounting of women and children and assuming GRR= 3 and mortality level 8, to 61 thousand. There were 58 thousand Armenians in Cilicia in 1914. Adding to this figure the claimed 25 thousand dead, the Armenan population would have added up to 83 thousand, almost double the number the Armenian community would have reached by natural growth. There is evidence that there was heavy immigration of Armenious into Cilicia, especially from the eastern vilayets. Adana’s Armenian population, according to a Turkish source, doubled between 1903-1908. This, taking into account the deaths during 1909, further corroborates the census figures (see Sakarya, 1984, p. 129). The immigration into Cilicia was an organized effort by the Armenions to ensure a strong presence in the region. This was freely admitted by Bishop Mushegh, in his book The Adana Massacres and Their Instigators. Cairo: 1909 (in Armenian), cited by Uras (1988, p. 811). 7 Nakracas (2003, p. 86) makes this point about the Greeks, and Süslü (1990, p. 20) on the Armenians. 8 For example, despite all the efforts to improve the count the American Census Bureau estimated that in the 1980 Census, as much as 18 percent of some age groups in some densely populated areas would escape the count (Karpat, 1985, p. 9). 9 McCarthy (1998a, p. 162). He is using Life Tables prepared by Alpay for three metropolitan cities and some selected regions in the 1960s (Alpay, 1969). 10 The undercounting of Muslim women in these vilayets is not a suprise in view of the orthodox Muslim view still held in those areas that women are namahrem and should not be exposed to adult males other than close kin. The contrast between Aydın and the easternn vilayets is possibly due to the less orhodox beliefs held in the west. Also, the distributions for Muslims and Armenians in the eastern vilayets may attest to the possibility if not the fact that despite religious differences, the two communities held similar mores respecting women. 11 This relative decline was noted by McCarthy (1998a, p. 80). See note 6; also see Sonyel (1987, pp. 148, 253-256).
OTTOMAN POPULATION 27
12 This report is “Sicil-i Nüfus İdare-i Umumiyesi” of 17 Ramazan 1312/14 March 1895 (Karpat, 1985, p. 156-57, 160). 13 The figures are from Karpat (1985, pp. 156-161). The population figures given by Karpat for 1897 are really the figures of the 1895/96 Census, which are in agreement with the ones used by McCarthy (1998a) as belonging to 1313/ 1895-96 census. 14 In a similar case, Karpat (1985, p. 254, note b notes that the population of İstanbul given for 1885 and for 1893 are identical. 15 A Model Life Table is an expression of typical mortality experience derived from a group of observed Life Tables. A life table is a listing of survivors at different ages, up to the highest age attained in a hypothetical cohort subject from birth to a particular set of age-specific mortality rate. The rates are those observed in a given population during a particular period of time. The Model Life Table chosen for the study is that of the East which is based on the mortality experience of Austria, Germany, Czechoslovakia, North and Central Italy, Hungary and Poland. The periods considered vary from 1881 to 1890 for Germany, 1931-32 for Poland and 1949-1951 for Czechoslovakia. See Coale and Demeny (1966, pp. 12-14). While the child mortality in Turkey even in the 1960s was considerably higher than that represented by the East Model Life Table and it must have been much higher for the period under consideration (Demeny and Shorter, 1968), nevertheless it is found that the Turkish mortality experience fits the EastTable best (Shorter and Macura, 1983, pp. 70-71; also see McCarthy, 1998a, p. 203-204). 16 A mortality level in a Model Life Table gives the age pattern of mortality by Gross Reproduction Rates with a specific expectation of life at birth. A low mortality level is associated with a low expectation of life at birth and a higher mortality level with a higher expectation of life. 17 Gross Reproduction Rate is the average number of female children a woman would have if she survived to the end of her child bearing years and if, throughout, she were subject to a given set of age-specific fertility rates and a given sex ratio at birth. In the Model Life Tables, the mean of underlying maternity schedule is taken as 29 years, that is a woman is assumed to remain fertile for 29 years. 18 Except for Biga, McCarthy uses the same GRR (=3) in his study (McCarthy, 1998a, p. 231). 19 Apart from the census reports, McCarthy, using censuses and salmanes, gives tables for some vilayets from which development of population over time can easily be followed (McCarthy, 1998a, see also Karpat, 1985, p. 190). 20 The underlying assumption in the formula is that males above 15 years of age were correctly recorded and male/ female ratio is 1. 21 These overestimates may result from possibly less massing of children at age 15 in the 1905/06 census. Massing at round numbers such as 15 or 20 still continues in Turkish censuses. 22 The underlying assumption in the formula, though could not possibly be wholly true, is that the adult females, those 15 years of age and above, were correctly counted. 23 McCarthy (1998a, pp. 83-84) calculates another figure for the Armenians, assuming that each Armenian household had the same number of persons as the Muslim households-6.69 persons per household. This second figure come up to be 91 thousand which he takes as the minimum number of Armenians to which the correction coefficient is to be applied. 24 McCarthy uses a different method and utilizing Cuinet’s estimates arrives at a population of 144,991 Armenians for 1911/12 (McCarthy, 1998a pp. 79-80). The date should have been 1914. The error is due to interpretation of the date in the Ottoman document as Hicrî rather than Rumî. Both McCarthy’s and our estimate are possibly on the high end, in as much as there was out-migration of Armenians to other countries and to Cilicia during the period. 25 In the Eastern Vilayets, there were intensive proselytization efforts to convert Christians to Protestanism. These efforts were concentrated on Armenians, and all Protestants may have been Armenians, In the other vilayets some Protestants may not have been Armenians and hence for vilayets other than those in the East, Armenians may have been slightly overestimated. For the proselytization efforts by Protestant missionaries see Kocabaşoğlu (1989) and Engelhardt (1999, pp. 65-67, 297-301). 26 Some sources put the Greek population in Ionia alone as 2 million in 1914. There are other inflated figures. For examples, see Pentzopoulas (2002, p. 30- 31), who mentions them so that his use of the Patriarchate’s Statistics looks conservative and cautious in comparision with the other figures. 27 Polybius, Greece Before the Conference, London: Methuen and Co. Ltd., 1919 28 George Soteriadis, An Ethnological Map Illustrating Hellenism in the Balkan Peninsula and Asia Minor. London: Edward Stanford Ltd., 1918. 29 Léon Maccas, L’Hellénisme de L’Asie Mineure.Paris, 1919. 30 Apparently whoever prepared the so called Patriarchate Statistics took Vital Cuinet’s well- known work (La Turquie d’Asie, 4 volumes. Paris: 1890-94) as the starting point and added to or subtracted from each ethnic group as he deemed fit, and labelled it as the Greek Patriarchate Statistics, To butress the alleged Patriarchate figures then Ottoman Official Statistics was concocted (McCarthy, 1998a, pp. 96-97).
28 S. MUTLU
31 Venizelos used the alleged Patriarchate Statistics in the Peace Conference following the First World War to buttress his arguments on the number of Greek population in the Ottoman Empire. F.O. Documents on British Foreign Policy, 1919- 1939, series 1, vol. VIII, pp. 64-65, cited in McCarthy (1998a, p. 96), also see Shaw (2000, pp. 395-96). The head of the Ottoman Delegation to the Sevres, on June 17, 1919, in his presentation to the Supreme Council made no direct reference to the population issue. However, in a memorandum to the Supreme Council on June 23rd, in connection with the border issue in Thrace, it was declared that the north and west of the vilayet of Edirne, including western Thrace, was predominantly Turkish (Shaw, 2000, pp. 416, 419). The population issue was brought out in the London Conference, by the Turkish nationalist delegation to prove that Western Anatolia under Greek occupation was overwhelmingly Turkish. On February 24, 1921, the delegation cited the figures collected in 1896 by a recognized French authority, M. Puymet, for purposes connected with the collection of Ottoman Public Debt and published as an official publication, a Yellow Book, by the French. Puymet’s figures for Aydın was 1,296,595 Muslims (Turkish) and 230,711 Greeks (Shaw 2000, pp. 1233-1234). 32 The mortality rate among the refugees was 45 percent during the last months of 1923 (Pentzopoulos, 2002, p. 98). The high degree of mortality among the refugees is attested by the surviving refugees in interviews conducted by a Turk from Honaz (Denizli) who in the early 1990s traversed refugee settlements throughout Greece in search of the family of the Greek neighbour of his father; see Yalçın (1998, passim). 33 Charles B. Eddy, Greece and the Greek Refugees. London: George Allen and Unwin Ltd., 1931., pp. 52, 248; cited in Pentzopoulos (2002, p. 98). 34 During the two wars, the Anatolian and Thraceian Greeks died not only during the clashes, but also during the deportations. It is claimed that 418 thousand Greeks were deported during the First World War and that deportations continued during 1919 and 1920 (Pentzopoulas, 2002, p. 57). Ladas gives the number of deportees to the interior of Anatolia as 50 thousand (Ladas, 1932, p. 21). These figures need to be checked in the Ottoman archives, but there is no doubt that there were deportations and some deportees perished. There is a moving account of a deportee in Dido Sotriyu’s novel, Benden Selam Söyle Anadolu’ya.
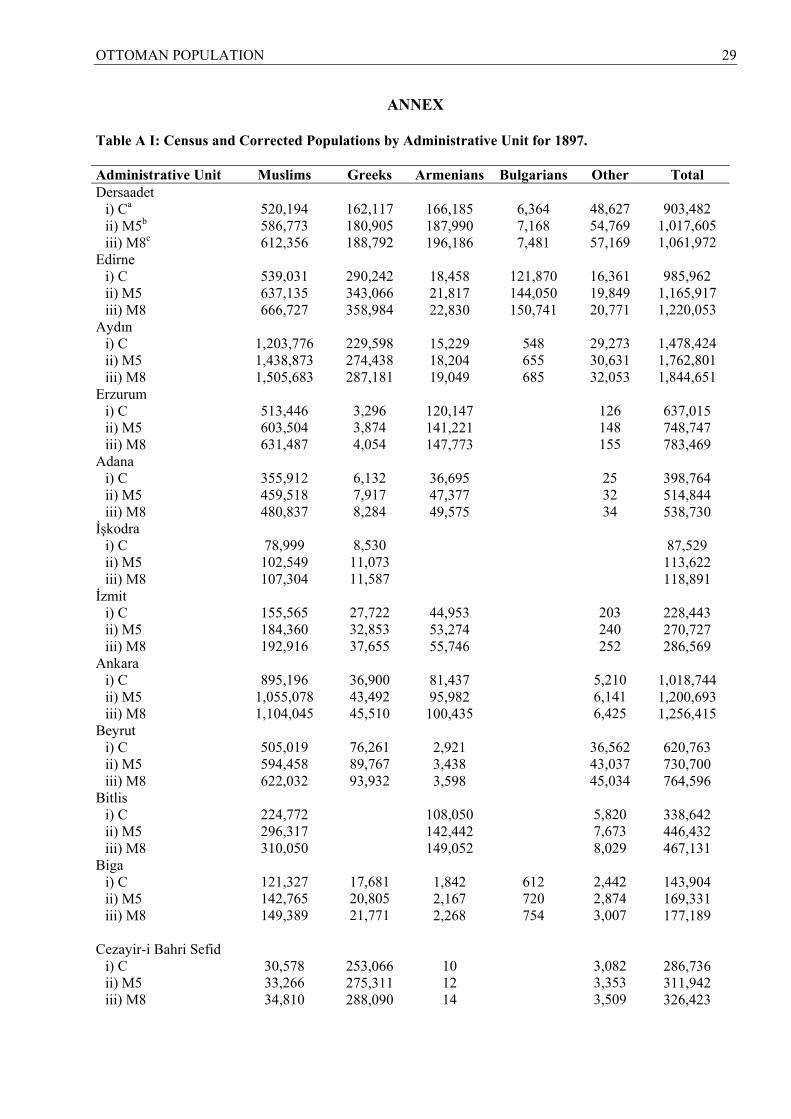
OTTOMAN POPULATION 29
ANNEX
Table A I: Census and Corrected Populations by Administrative Unit for 1897.
Administrative Unit Muslims Greeks Armenians Bulgarians Other Total Dersaadet
i) Ca
ii) M5b iii) M8c
Edirne i) C ii) M5 iii) M8
Aydın i) C ii) M5 iii) M8
Erzurum i) C ii) M5 iii) M8
Adana i) C ii) M5 iii) M8
İşkodra i) C ii) M5 iii) M8
İzmit i) C ii) M5 iii) M8
Ankara i) C ii) M5 iii) M8
Beyrut i) C ii) M5 iii) M8
Bitlis i) C ii) M5 iii) M8
Biga i) C ii) M5 iii) M8
Cezayir-i Bahri Sefid
i) C ii) M5 iii) M8
520,194 586,773 612,356
539,031 637,135 666,727
1,203,776 1,438,873 1,505,683
513,446 603,504 631,487
355,912 459,518 480,837
78,999
102,549 107,304
155,565 184,360 192,916
895,196
1,055,078 1,104,045
505,019 594,458 622,032
224,772 296,317 310,050
121,327 142,765 149,389
30,578 33,266 34,810
162,117 180,905 188,792
290,242 343,066 358,984
229,598 274,438 287,181
3,296 3,874 4,054
6,132 7,917 8,284
8,530
11,073 11,587
27,722 32,853 37,655
36,900 43,492 45,510
76,261 89,767 93,932
17,681 20,805 21,771
253,066 275,311 288,090
166,185 187,990 196,186
18,458 21,817 22,830
15,229 18,204 19,049
120,147 141,221 147,773
36,695 47,377 49,575
44,953 53,274 55,746
81,437 95,982
100,435
2,921 3,438 3,598
108,050 142,442 149,052
1,842 2,167 2,268
10 12 14
6,364 7,168 7,481
121,870 144,050 150,741
548 655 685
612 720 754
48,627 54,769 57,169
16,361 19,849 20,771
29,273 30,631 32,053
126 148 155
25 32 34
203 240 252
5,210 6,141 6,425
36,562 43,037 45,034
5,820 7,673 8,029
2,442 2,874 3,007
3,082 3,353 3,509
903,482
1,017,605 1,061,972
985,962
1,165,917 1,220,053
1,478,424 1,762,801 1,844,651
637,015 748,747 783,469
398,764 514,844 538,730
87,529
113,622 118,891
228,443 270,727 286,569
1,018,744 1,200,693 1,256,415
620,763 730,700 764,596
338,642 446,432 467,131
143,904 169,331 177,189
286,736 311,942 326,423
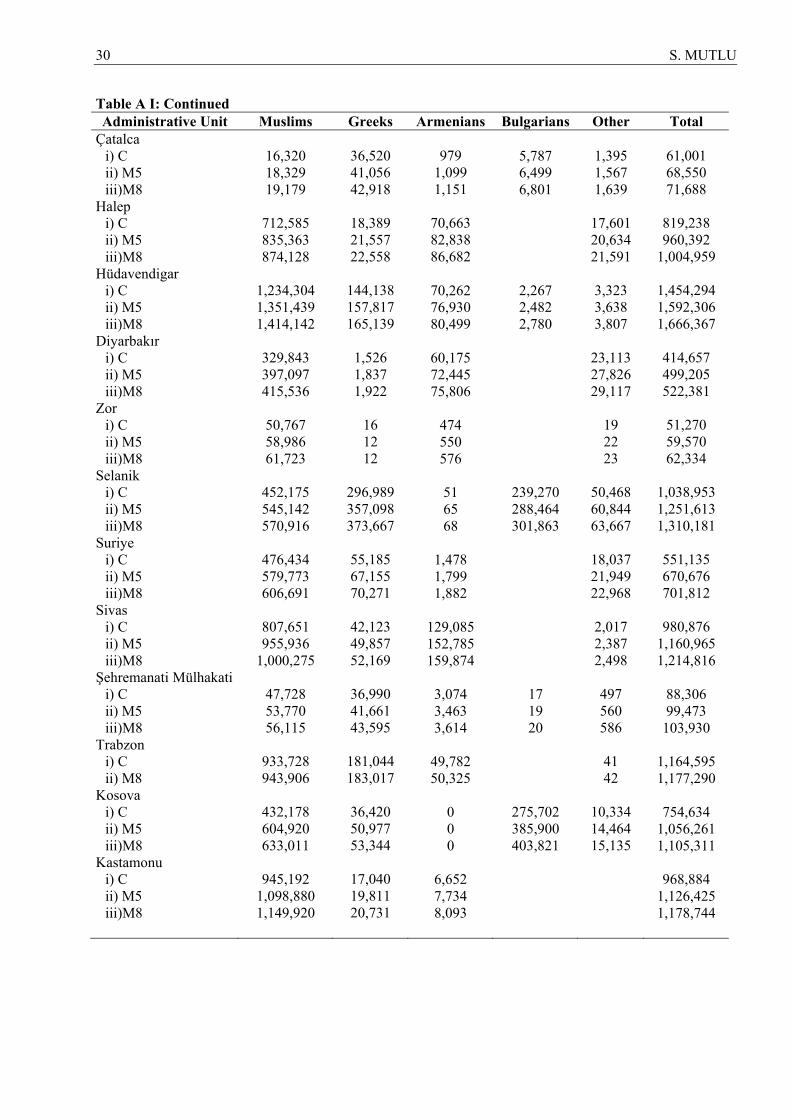
30 S. MUTLU
Table A I: Continued Administrative Unit Muslims Greeks Armenians Bulgarians Other Total
Çatalca i) C ii) M5 iii)M8
Halep i) C ii) M5 iii)M8
Hüdavendigar i) C ii) M5 iii)M8
Diyarbakır i) C ii) M5 iii)M8
Zor i) C ii) M5 iii)M8
Selanik i) C ii) M5 iii)M8
Suriye i) C ii) M5 iii)M8
Sivas i) C ii) M5 iii)M8
Şehremanati Mülhakatii) C ii) M5 iii)M8
Trabzon i) C ii) M8
Kosova i) C ii) M5 iii)M8
Kastamonu i) C ii) M5 iii)M8
16,320 18,329 19,179
712,585 835,363 874,128
1,234,304 1,351,439 1,414,142
329,843 397,097 415,536
50,767 58,986 61,723
452,175 545,142 570,916
476,434 579,773 606,691
807,651 955,936
1,000,275
47,728 53,770 56,115
933,728 943,906
432,178 604,920 633,011
945,192
1,098,880 1,149,920
36,520 41,056 42,918
18,389 21,557 22,558
144,138 157,817 165,139
1,526 1,837 1,922
16 12 12
296,989 357,098 373,667
55,185 67,155 70,271
42,123 49,857 52,169
36,990 41,661 43,595
181,044 183,017
36,420 50,977 53,344
17,040 19,811 20,731
979
1,099 1,151
70,663 82,838 86,682
70,262 76,930 80,499
60,175 72,445 75,806
474 550 576
51 65 68
1,478 1,799 1,882
129,085 152,785 159,874
3,074 3,463 3,614
49,782 50,325
0 0 0
6,652 7,734 8,093
5,787 6,499 6,801
2,267 2,482 2,780
239,270 288,464 301,863
17 19 20
275,702 385,900 403,821
1,395 1,567 1,639
17,601 20,634 21,591
3,323 3,638 3,807
23,113 27,826 29,117
19 22 23
50,468 60,844 63,667
18,037 21,949 22,968
2,017 2,387 2,498
497 560 586
41 42
10,334 14,464 15,135
61,001 68,550 71,688
819,238 960,392
1,004,959
1,454,294 1,592,306 1,666,367
414,657 499,205 522,381
51,270 59,570 62,334
1,038,953 1,251,613 1,310,181
551,135 670,676 701,812
980,876
1,160,965 1,214,816
88,306 99,473
103,930
1,164,595 1,177,290
754,634
1,056,261 1,105,311
968,884
1,126,425 1,178,744
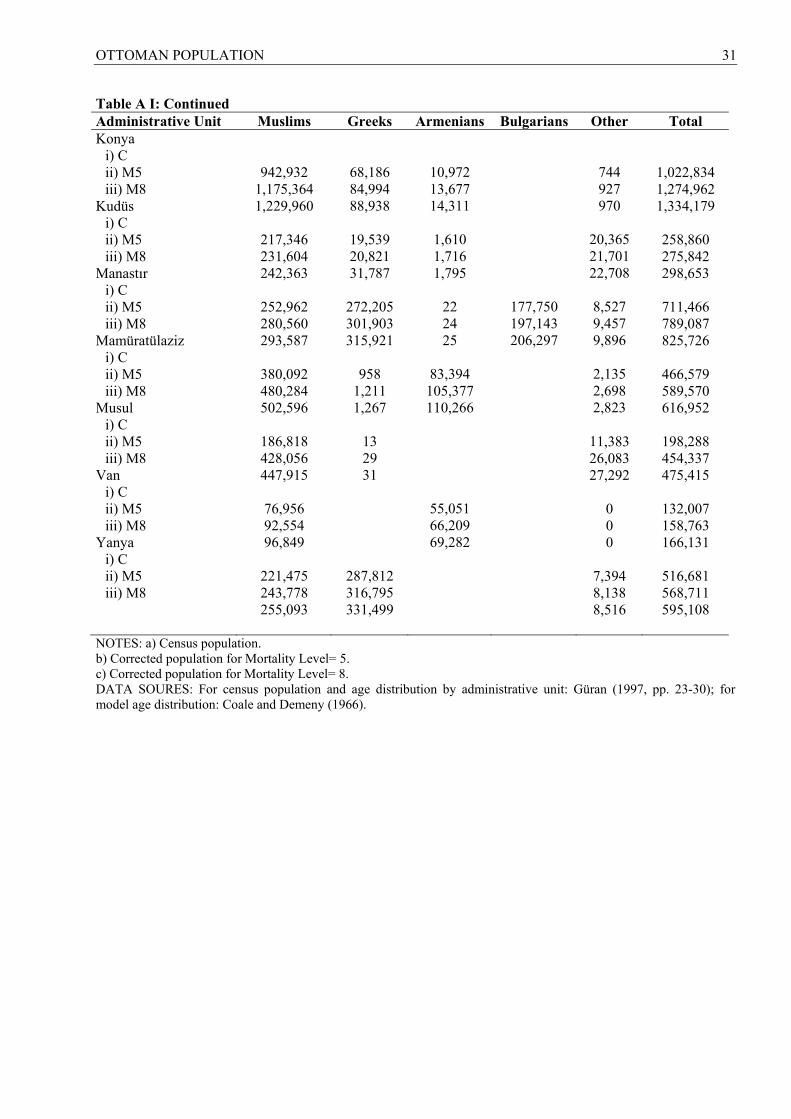
OTTOMAN POPULATION 31
Table A I: Continued Administrative Unit Muslims Greeks Armenians Bulgarians Other Total Konya
i) C ii) M5 iii) M8
Kudüs i) C ii) M5 iii) M8
Manastır i) C ii) M5 iii) M8
Mamüratülaziz i) C ii) M5 iii) M8
Musul i) C ii) M5 iii) M8
Van i) C ii) M5 iii) M8
Yanya i) C ii) M5 iii) M8
942,932 1,175,364 1,229,960
217,346 231,604 242,363
252,962 280,560 293,587
380,092 480,284 502,596
186,818 428,056 447,915
76,956 92,554 96,849
221,475 243,778 255,093
68,186 84,994 88,938
19,539 20,821 31,787
272,205 301,903 315,921
958
1,211 1,267
13 29 31
287,812 316,795 331,499
10,972 13,677 14,311
1,610 1,716 1,795
22 24 25
83,394
105,377 110,266
55,051 66,209 69,282
177,750 197,143 206,297
744 927 970
20,365 21,701 22,708
8,527 9,457 9,896
2,135 2,698 2,823
11,383 26,083 27,292
0 0 0
7,394 8,138 8,516
1,022,834 1,274,962 1,334,179
258,860 275,842 298,653
711,466 789,087 825,726
466,579 589,570 616,952
198,288 454,337 475,415
132,007 158,763 166,131
516,681 568,711 595,108
NOTES: a) Census population. b) Corrected population for Mortality Level= 5. c) Corrected population for Mortality Level= 8. DATA SOURES: For census population and age distribution by administrative unit: Güran (1997, pp. 23-30); for model age distribution: Coale and Demeny (1966).
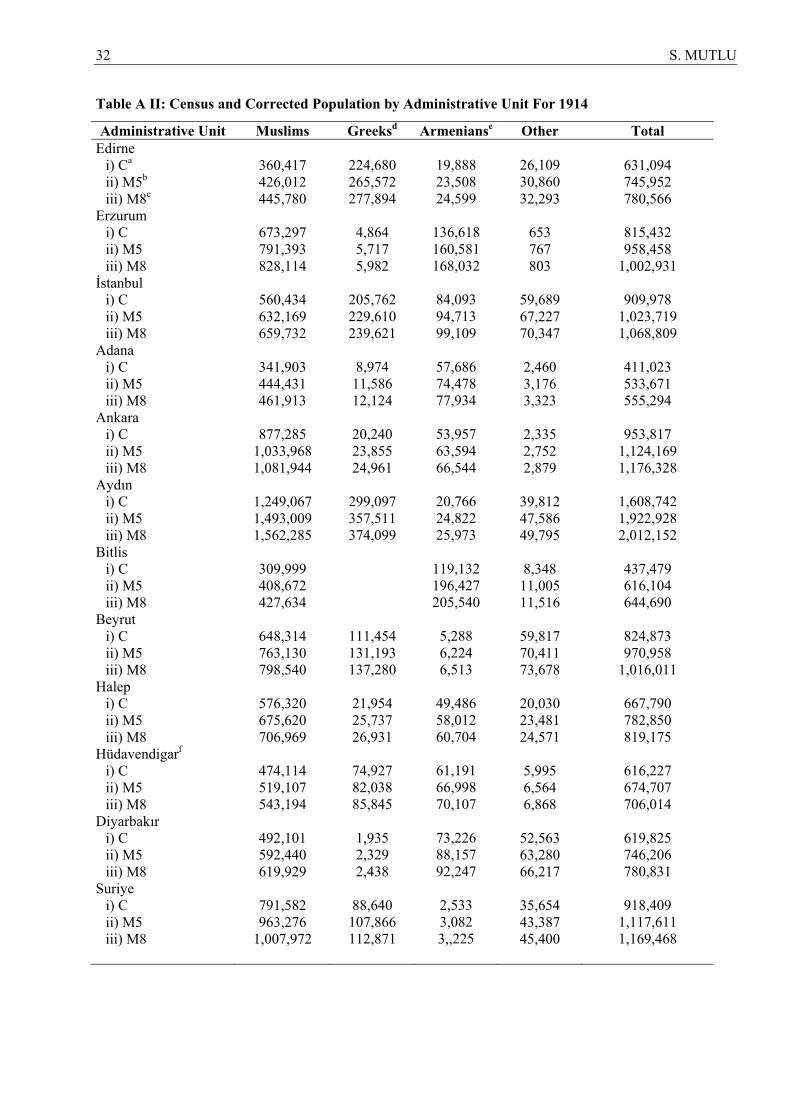
32 S. MUTLU
Table A II: Census and Corrected Population by Administrative Unit For 1914
Administrative Unit Muslims Greeksd Armenianse Other Total Edirne
i) Ca ii) M5b iii) M8c
Erzurum i) C ii) M5
iii) M8 İstanbul
i) C ii) M5 iii) M8
Adana i) C ii) M5
iii) M8 Ankara
i) C ii) M5
iii) M8 Aydın
i) C ii) M5
iii) M8 Bitlis
i) C ii) M5
iii) M8 Beyrut
i) C ii) M5
iii) M8 Halep
i) C ii) M5
iii) M8 Hüdavendigarf
i) C ii) M5
iii) M8 Diyarbakır
i) C ii) M5
iii) M8 Suriye
i) C ii) M5
iii) M8
360,417 426,012 445,780
673,297 791,393 828,114
560,434 632,169 659,732
341,903 444,431 461,913
877,285
1,033,968 1,081,944
1,249,067 1,493,009 1,562,285
309,999 408,672 427,634
648,314 763,130 798,540
576,320 675,620 706,969
474,114 519,107 543,194
492,101 592,440 619,929
791,582 963,276
1,007,972
224,680 265,572 277,894
4,864 5,717 5,982
205,762 229,610 239,621
8,974
11,586 12,124
20,240 23,855 24,961
299,097 357,511 374,099
111,454 131,193 137,280
21,954 25,737 26,931
74,927 82,038 85,845
1,935 2,329 2,438
88,640
107,866 112,871
19,888 23,508 24,599
136,618 160,581 168,032
84,093 94,713 99,109
57,686 74,478 77,934
53,957 63,594 66,544
20,766 24,822 25,973
119,132 196,427 205,540
5,288 6,224 6,513
49,486 58,012 60,704
61,191 66,998 70,107
73,226 88,157 92,247
2,533 3,082 3,,225
26,109 30,860 32,293
653 767 803
59,689 67,227 70,347
2,460 3,176 3,323
2,335 2,752 2,879
39,812 47,586 49,795
8,348
11,005 11,516
59,817 70,411 73,678
20,030 23,481 24,571
5,995 6,564 6,868
52,563 63,280 66,217
35,654 43,387 45,400
631,094 745,952 780,566
815,432 958,458
1,002,931
909,978 1,023,719 1,068,809
411,023 533,671 555,294
953,817
1,124,169 1,176,328
1,608,742 1,922,928 2,012,152
437,479 616,104 644,690
824,873 970,958
1,016,011
667,790 782,850 819,175
616,227 674,707 706,014
619,825 746,206 780,831
918,409
1,117,611 1,169,468
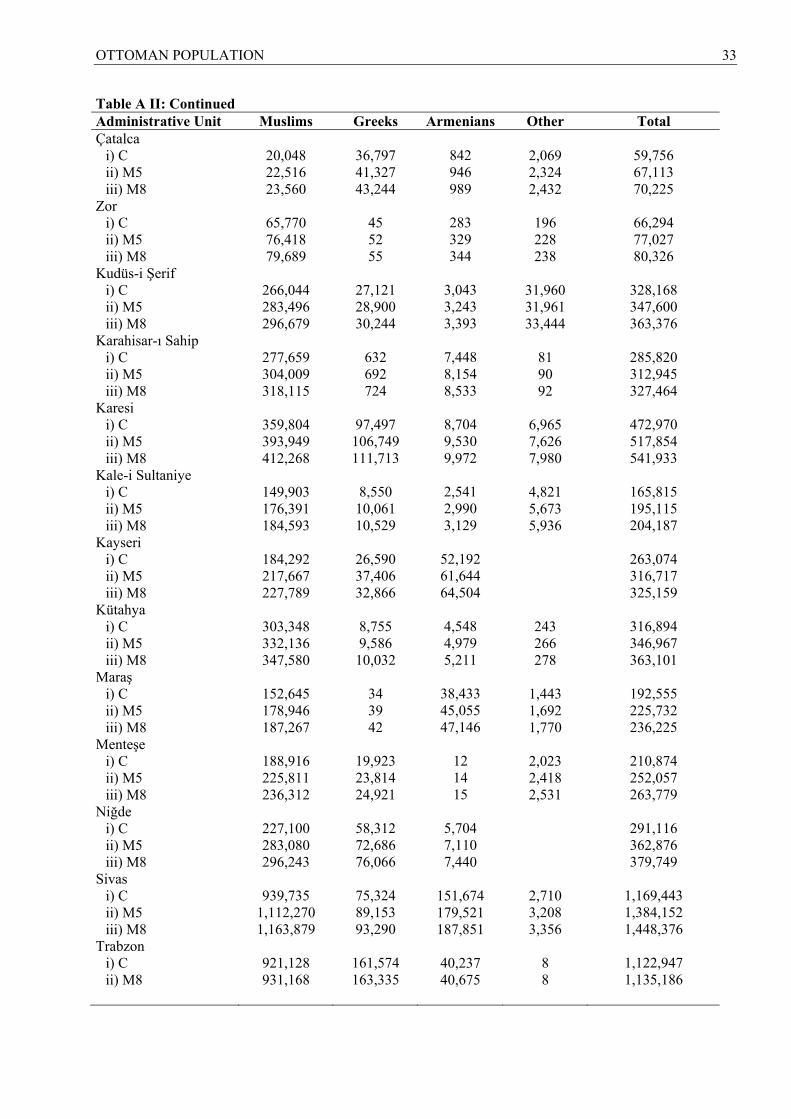
OTTOMAN POPULATION 33
Table A II: Continued Administrative Unit Muslims Greeks Armenians Other Total Çatalca
i) C ii) M5
iii) M8 Zor
i) C ii) M5
iii) M8 Kudüs-i Şerif
i) C ii) M5
iii) M8 Karahisar-ı Sahip
i) C ii) M5
iii) M8 Karesi
i) C ii) M5
iii) M8 Kale-i Sultaniye
i) C ii) M5
iii) M8 Kayseri
i) C ii) M5
iii) M8 Kütahya
i) C ii) M5
iii) M8 Maraş
i) C ii) M5
iii) M8 Menteşe
i) C ii) M5
iii) M8 Niğde
i) C ii) M5
iii) M8 Sivas
i) C ii) M5
iii) M8 Trabzon
i) C ii) M8
20,048 22,516 23,560
65,770 76,418 79,689
266,044 283,496 296,679
277,659 304,009 318,115
359,804 393,949 412,268
149,903 176,391 184,593
184,292 217,667 227,789
303,348 332,136 347,580
152,645 178,946 187,267
188,916 225,811 236,312
227,100 283,080 296,243
939,735
1,112,270 1,163,879
921,128 931,168
36,797 41,327 43,244
45 52 55
27,121 28,900 30,244
632 692 724
97,497
106,749 111,713
8,550
10,061 10,529
26,590 37,406 32,866
8,755 9,586
10,032
34 39 42
19,923 23,814 24,921
58,312 72,686 76,066
75,324 89,153 93,290
161,574 163,335
842 946 989
283 329 344
3,043 3,243 3,393
7,448 8,154 8,533
8,704 9,530 9,972
2,541 2,990 3,129
52,192 61,644 64,504
4,548 4,979 5,211
38,433 45,055 47,146
12 14 15
5,704 7,110 7,440
151,674 179,521 187,851
40,237 40,675
2,069 2,324 2,432
196 228 238
31,960 31,961 33,444
81 90 92
6,965 7,626 7,980
4,821 5,673 5,936
243 266 278
1,443 1,692 1,770
2,023 2,418 2,531
2,710 3,208 3,356
8 8
59,756 67,113 70,225
66,294 77,027 80,326
328,168 347,600 363,376
285,820 312,945 327,464
472,970 517,854 541,933
165,815 195,115 204,187
263,074 316,717 325,159
316,894 346,967 363,101
192,555 225,732 236,225
210,874 252,057 263,779
291,116 362,876 379,749
1,169,443 1,384,152 1,448,376
1,122,947 1,135,186
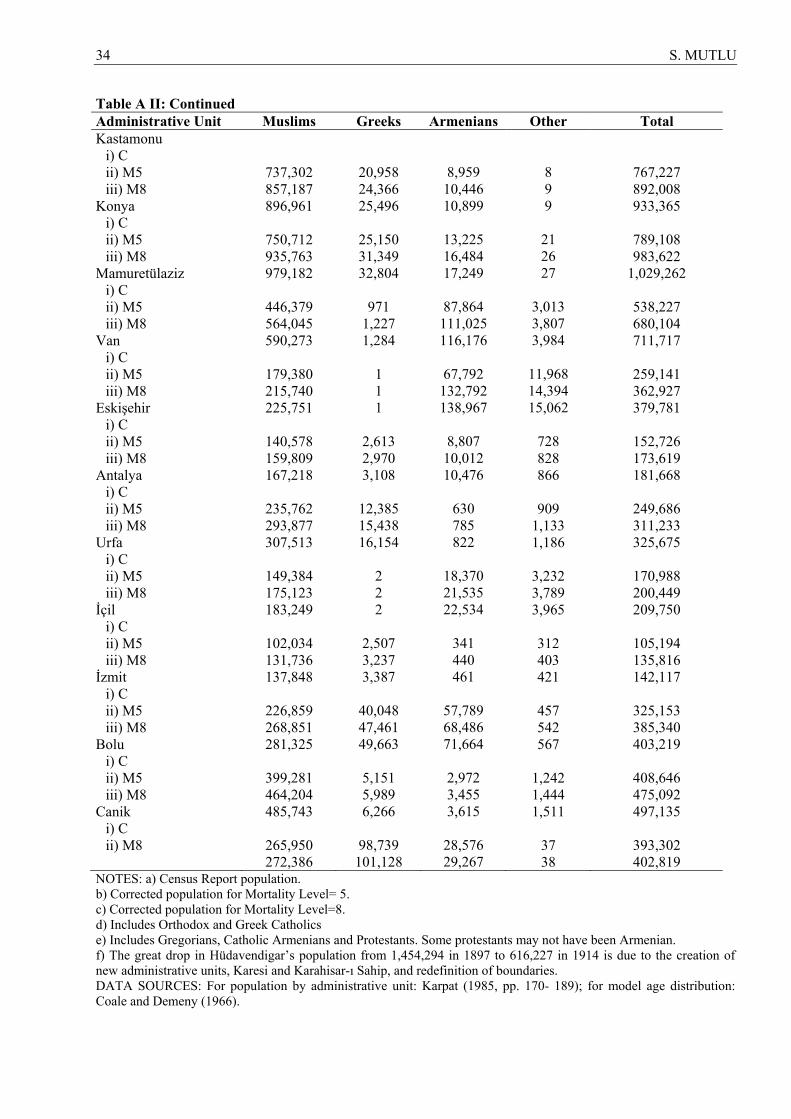
34 S. MUTLU
Table A II: Continued Administrative Unit Muslims Greeks Armenians Other Total Kastamonu
i) C ii) M5
iii) M8 Konya
i) C ii) M5
iii) M8 Mamuretülaziz
i) C ii) M5
iii) M8 Van
i) C ii) M5
iii) M8 Eskişehir
i) C ii) M5
iii) M8 Antalya
i) C ii) M5
iii) M8 Urfa
i) C ii) M5
iii) M8 İçil
i) C ii) M5
iii) M8 İzmit
i) C ii) M5
iii) M8 Bolu
i) C ii) M5
iii) M8 Canik
i) C ii) M8
737,302 857,187 896,961
750,712 935,763 979,182
446,379 564,045 590,273
179,380 215,740 225,751
140,578 159,809 167,218
235,762 293,877 307,513
149,384 175,123 183,249
102,034 131,736 137,848
226,859 268,851 281,325
399,281 464,204 485,743
265,950 272,386
20,958 24,366 25,496
25,150 31,349 32,804
971
1,227 1,284
1 1 1
2,613 2,970 3,108
12,385 15,438 16,154
2 2 2
2,507 3,237 3,387
40,048 47,461 49,663
5,151 5,989 6,266
98,739
101,128
8,959 10,446 10,899
13,225 16,484 17,249
87,864
111,025 116,176
67,792
132,792 138,967
8,807
10,012 10,476
630 785 822
18,370 21,535 22,534
341 440 461
57,789 68,486 71,664
2,972 3,455 3,615
28,576 29,267
8 9 9
21 26 27
3,013 3,807 3,984
11,968 14,394 15,062
728 828 866
909
1,133 1,186
3,232 3,789 3,965
312 403 421
457 542 567
1,242 1,444 1,511
37 38
767,227 892,008 933,365
789,108 983,622
1,029,262
538,227 680,104 711,717
259,141 362,927 379,781
152,726 173,619 181,668
249,686 311,233 325,675
170,988 200,449 209,750
105,194 135,816 142,117
325,153 385,340 403,219
408,646 475,092 497,135
393,302 402,819
NOTES: a) Census Report population. b) Corrected population for Mortality Level= 5. c) Corrected population for Mortality Level=8. d) Includes Orthodox and Greek Catholics e) Includes Gregorians, Catholic Armenians and Protestants. Some protestants may not have been Armenian. f) The great drop in Hüdavendigar’s population from 1,454,294 in 1897 to 616,227 in 1914 is due to the creation of new administrative units, Karesi and Karahisar-ı Sahip, and redefinition of boundaries. DATA SOURCES: For population by administrative unit: Karpat (1985, pp. 170- 189); for model age distribution: Coale and Demeny (1966).
OTTOMAN POPULATION 35
REFERENCES Akbal, Fazıla (1961), 1831 Tarihinde Osmanlı İmparatorluğunda İdari Taksimat ve Nüfus.
Belleten, 15 (60), pp. 617- 628. Alpay, Aysel (1969), “Abridged Life Tables for Three Metropolitan Cities and selected Regions of
Turkey by Sex”, in Shorter, Frederic C. and Bozkurt Güvenç (eds.). Turkish Demography: Proceedings of a Conference.. Ankara: Hacettepe University, pp. 83- 108.
Behar, Cem (1996), Osmanlı İmparatorluğu’nun ve Türkiye’nin Nüfusu 1500- 1927. Tarihi
İstatistikler Dizisi, C.2. Ankara: Devlet İstatistik Enstitüsü. Coale, Ansley J. and Paul Demeny (1966), Regional Model Life Tables and Stable Populations.
Princeton, NJ: Princeton University Press. Dadrian, Vahakn N (1997), The History of the Armenian Genocide: Ethnic Conflict from the
Balkans to Anatolia to the Caucasus. 2ndrev. ed. Providence, RI: Berghahn Books. Davis, Leslie A. (1989), The Slaughterhouse Province: An American Diplomat’s Report on the
Armenian Genocide. 1915-1917. New Rochelle, NY: Aristide D. Caratzas, Publisher. Demeny, Paul and Frederic C. Shorter (1968), Estimating Turkish Mortality, Fertility and Age
Structure: Application of Some New Tecniques. İstanbul: İstanbul University Press. Deringil, Selim (2002), “The Study of the Armenian Crisis of the Late Ottoman Empire, or '
Seizing The Document by the Throat’ ”, New Perspectives on Turkey, 27 (Fall), pp. 35-59. Duben, Alan (2002), Kent, Aile, Tarih, trans. by Leyla Şimşek. İstanbul: İletişim. Engelhardt (1999), Tanzimat ve Türkiye. çev. Ali Reşad, 1st pub. in French in 1883. İstanbul:
Kaknüs Yayınları. Güran, Tevfik (1997), Osmanlı Devleti’nin İlk İstatistik Yıllığı, Tarihi İstatistikler Dizisi, C. 5.
Ankara: Devlet İstatistik Enstitüsü. Gürün, Kamuran (2001), The Armenian File: The Myth of Innocence Exposed, 1st pub. 1985.
Mersin: Rustem. İUM: İstatistik Umum Müdürlüğü (1929), 28 Teşrinievvel 1927 Umumi Nüfus Tahriri, Fasikül
I, Mufassal Neticeler İcmal Tabloları. İstanbul: Hüsnütabiat Matbaası. Karacakaya, Recep (2001), Kaynakçalı Ermeni Meselesi Kronolojisi (1878-1923), yayın no: 52.
İstanbul : Devlet Arşivleri Genel Müdürlüğü. Karal, Enver Ziya (1943), Osmanlı İmparatorluğu’nda İlk Nüfus Sayımı. Ankara: İstatistik
Umum Müdürlüğü. Karpat, Kemal H (1985), Ottoman Population 1830- 1914: Demographic and Social
Characteristics. Madison, WISC: The University of Wisconsin Press.
36 S. MUTLU
Karpat, Kemal (1978), “Ottoman Population Records and the Census of 1881/82- 1893”, International Journal of Middle East Studies, 18, pp. 237-274.
Kirakossian, John S. (1992), The Armenian Genocide: The Young Turks Before The Judgment
of History. trans. from the Russian by Shushan Altunian. Madison, CONN.: Sphinx Press, Inc.
Kocabaşoğlu, Uygur (1989), Kendi Belgeleriyle Anadoluda’daki Amerika: 19. Yüzyılda
Osmanlı İmparatorluğu’ndaki Amerikan Misyoner Okulları. İstanbul: Arba Yayınları. Kurmuş, Orhan (1982), Emperyalizmin Türkiye’ye Girişi. 3. basım. Ankara: Savaş Yayınları. Ladas, S.P. (1932), The Exchange of Minorities: Bulgaria, Greece and Turkey. NewYork: The
Macmillan Co. McCarthy, Justin (1998a), Müslümanlar ve Azınlıklar. 1st publ. in English in 1983, trans. by Bilge
Umar. İstanbul: İnkılâp. McCarthy, Justin (1998b), Ölüm ve Sürgün. 1stpubl. in English in 1995, trans. by Bilge Umar.
İstanbul: İnkılap. Nakracas, George (2003), Anadolu ve Rum Göçmenlerin Kökeni; 1922 Anadolu Felaketi.1st
publ. in Greek in 2000, trans. By İbram Onsunoğlu. İstanbul: Belge Yayınları. Pentzopoulos, Dimitri (2002), The Balkan Exchange of Minorities and Its Impact on Greece, 1st
pub. 1962. London: Hurst& Company. Quataert, Donald (1983), Social Disintegration and Popular Resistance in the Ottoman Empire,
1881- 1908: Reactions to European Economic Penetration. NewYork: NewYork University Press.
Sakarya, İhsan (1984), Belgelerle Ermeni Sorunu. 2’nci baskı. Ankara: T.C. Genelkurmay Askeri
Tarih ve Stratejik Etüt Başkanlığı. Shaw, Stanford J. (2000), From Empire to Republic: the Turkish War of National Liberation,
1918-1923, a Documentary Study. V. vols., Ankara: Türk Tarih Kurumu. Shaw, Stanford J. (1978), “The Ottoman Census System and Population, 1831-1914”,
International Journal of Middle East Studies, 9, pp. 325-338. Shaw, Stanford J. and Ezel Kural Shaw (2000), Osmanlı İmparatorluğu ve Modern Türkiye.
c.II, 1st pub. 1976, trans. by Mehmet Harmancı, 3rd imp. İstanbul: e yayınları. Shorter, Frederic C. (1969), “Information on Fertility, Mortality and Population Growth in Turkey”,
in Shorter, Frederic C. and Bozkurt Güvenç (Eds.). Turkish Demography: Proceedings of a Conference. Ankara: Hacettepe University, pp. 19- 41.
Shorter, Frederic C. And Miroslar Macura (1983), Türkiye’de Nüfus Artışı (1935- 1975):
Doğurganlık ve Ölümlülük Eğilimleri. 1st publ. in English in 1982. Ankara: Yurt Yayınları.
OTTOMAN POPULATION 37
SSYB: Sağlık ve Sosyal Yardım Bakanlığı, Hıfzısıhha Okulu (1970), Türkiye Nüfus Araştırmasından Elde Edilen Hayati İstatistikler, 1966-67. Ankara: Hacettepe Basımevi.
Sonyel, Salahi R. (1988), The Turco-Armenian ‘Adana Incidents’ in the Light of Secret British
Documents (July 1908- December 1909). Ankara: Türk Tarih Kurumu. Sonyel, Salahi R. (1987), The Ottoman Armenians: Victims of Great Power Diplomacy.
London: K. Rustem & Brother. Süslü, Azmi (1970), Ermeniler ve 1915 Tehcir Olayı. Yayın No. 5. Van: Yüzüncü Yıl
Üniversitesi Rektörlüğü. U.N. Department of Economic and Social Affairs (1972), Interim Report of Conditions and Trends
of Fertility in the World, 1960- 65, Population Studies, No. 52. New York: United Nations. Uras, Esat (1988), The Armenians in History and the Armenian Question. rev. and exp. ver.,
trans. by Süheyla Artemel., 1st publ. 1953. İstanbul: Documentary Publications. Yalçın, Kemal (1998), Emanet Çeyiz: Mübadele İnsanları. İstanbul: Doğan Kitap. Yücetürk, Alper (1969), “Sex Ratio and Monthly Distribution of Births,” in Shorter, Frederic C.
and Bozkurt Güvenç (Eds.). Turkish Demography: Proceedings of a Conference. Ankara: Hacettepe University, p. 167- 173.
38 S. MUTLU
ÖZET
SON DÖNEM OSMANLI NÜFUSU VE ETNİK DAĞILIMI
İmparatorluğun son yıllarında Osmanlı nüfusunun büyüklüğü ve etnik ve mekânsal dağılımı daha çok politik nedenlerle tartışmalı bir konu olagelmiştir. Osmanlılar nüfus sayımlarına ve bunların güncelleştirmelerine dayalı nüfus verileri üretirken çeşitli politik davaların taraftarları, kimi zaman resmi verilerden oldukça farklı rakamlar ileri sürmüşlerdir. Bu ihtilaflı rakamlar Osmanlı demografisi araştırmacıları için bir sorun arzetmektedir.
Sorunun çözümünün düğüm noktası Osmanlı nüfus sayımlarının ve güncelleştirmelerinin
doğruluk ya da güvenilirlik derecelerinin belirlenmesidir. Bu makalenin temel amacı budur. Sayım sonuçları üzerinde etkili olduklarından, makale önce Osmanlı nüfus sayım yöntem ve süreçleri üzerinde durmaktadır. Sayım sistemi kişilerin, özellikle erişkin erkeklerin, kaydolmaları için özendiriciler içeriyor ve sayımdan sorumlu komiteler, politik maksatlı veri üretimini engelleyici bir etnik yapıdan oluşuyordu. Ancak, kısmen kültürel nedenlerle, kadın ve çocuklar eksik sayılmışlardı. Sayımlardaki bu kusurlar, düzeltilebilecek niteliktedir.
Model Hayat Tabloları kullanarak, eksik sayımları düzeltmek için biri İstanbul, biri de diğer vilayetler için olmak üzer iki yöntem geliştirilmiştir. Her sayım için, etnik grup ve idari birim itibariyle, biri de alt sınır biri de üst sınır olmak üzere iki tahmin yapılmıştır. Kadın ve çocukların eksik sayımları için düzeltmeler yapıldığında, Osmanlı nüfus sayımlarının makul ölçüde güvenilir belgeler oldukları ortaya çıkmaktadır.
OTTOMAN POPULATION 39
NOTES 1 The quotation by Karpat is from Ubicini, Letters on Turkey, trans: by Lady Easthope. London, 1956; reprinted., NewYork: Arno Press, 1973, pp. 23-24. The census figures were used also by Eugène Boré, Almanach de L' Empire Ottoman Pour L'année 1849/1850. Constantinople, 1849/1850. 2 Shaw gives te date as 1878 in the text. But his footnote 12, on the same page, referring to BUA, Şuray-ı Devlet 3148, gives it as 8 Şevval 1298/21 August 1881 (Shaw, 1978, p.330). Karpat gives the date as 8 Şaban 1298/5 July 1881, again referring to BUA, İrade, Şuray-ı Devlet 3148 (Karpat, 1978, p.251). 3 His interest in the censuses is attested by the American Ambassador S. Cox who was asked by the Sultan for a statistical review of the recent American Census. He told the ambassador in 1886 that he was very interested in such works and pointed out that it was his hope to compile a complete and systematic statistical record of the entire population in his realm. (Karpat, 1978, pp. 242-43 and Karpat, 1985, p. 3). Karpat’s sources are a letter from the Sultan’s private secretary and Ambassador Cox’s memoirs. 4 A complete list of the imperial salnames can be found in Karpat (1985, pp. 12-13); see also McCarthy (1998a, pp. 173-74). 5 Before the First World War, Armenians migrated mainly to the United States and to the neighbouring countries, to the Russian Armenia and some to Persia. Karpat estimates that between 1854 and 1908, some 500,000 to 800,000 Greeks, Armenians and Arabs emigrated, chiefly to Russia and the Americas (Karpat, 1985, p. 11). 6 A source notes that there were 150,000 Armenian deaths during 1895/96 due to inter-ethnic struggle, in the Central and Eastern Anatolia: Garo Chichekian, “The Armenians Since The Treaty of San Stephano”, Armenian Review. Vol. 22, No. 2 (Spring 1968) pp. 42-56; cited in McCarthy (1998a, p. 55) . McCarthy finds this figure, as highly exaggerated, and his claim is supported by some figures. According to an Armenian historian, in the first Sasun rebellion in 1894, “No one has ever been able to give even an approximate number of the Armenians killed. Some say six or seven thousand, others say around one thousand. Probably the latter is nearer the truth”. M. Varandian, History of the Dashnaksution, Paris, 1932, p. 146; cited in Uras (1988, p. 728). In the second Sason rebellion, in 1904, according to an Armenian source, the casualties were about 1000 mainly on the Turkish side; the Armenian casualties were in the low hundreds (Kukulian, The Battles of Antranik, Beirut, 1929; cited in Uras 1988, pp. 778-780). Between 1 July and 3 December, 1895 ,there were 26 inter-ethic incidents in which, according to the Ottoman sources, there were 1828 Muslim and 8717 non-Muslim (Armenian) deaths; The wounded were 1433 and 2238 respectively (Gürün, 2001, pp. 147-149).
Outside of the six vilayets the bloodiest incident took place in Adana in April 1909. The Armenians, without giving supporting documents, claim that in the April 1909 uprising in Adana 25,000 Armenians were killed (Dadrian, 1997, p. 182). According to the report prepared by Babikian Efendi, the Edirne representative in the Ottoman Assembly, there were 20,001 deaths. Cemal Pasha who was appointed governor of the provience after the incidents, gave the numbers as 17000 Armenian, and 1850 Muslim deaths. The Amerinian Patriarchate put the total number of deaths as 21,300, based on the investigation it carried out. According to Babikian Efendi, Ottoman government put the number of deaths as 1487 Muslims and 4196 non-Muslims, based on population registers (McCarthy, 1998b, p. 133, note 58; Gürün ,2001, pp. 169-170; Sonyel, 1988; pp. 41-42). The whole Armenian population in Cilicia in 1897 was 37 thousand. Assuming population growth of 1.5 percent per year, the Armenian population in Cilicia should have reached 45 thousand in 1909; taking account of undercounting of women and children and assuming GRR= 3 and mortality level 8, to 61 thousand. There were 58 thousand Armenians in Cilicia in 1914. Adding to this figure the claimed 25 thousand dead, the Armenan population would have added up to 83 thousand, almost double the number the Armenian community would have reached by natural growth. There is evidence that there was heavy immigration of Armenious into Cilicia, especially from the eastern vilayets. Adana’s Armenian population, according to a Turkish source, doubled between 1903-1908. This, taking into account the deaths during 1909, further corroborates the census figures (see Sakarya, 1984, p. 129). The immigration into Cilicia was an organized effort by the Armenions to ensure a strong presence in the region. This was freely admitted by Bishop Mushegh, in his book The Adana Massacres and Their Instigators. Cairo: 1909 (in Armenian), cited by Uras (1988, p. 811). 7 Nakracas (2003, p. 86) makes this point about the Greeks, and Süslü (1990, p. 20) on the Armenians. 8 For example, despite all the efforts to improve the count the American Census Bureau estimated that in the 1980 Census, as much as 18 percent of some age groups in some densely populated areas would escape the count (Karpat, 1985, p. 9). 9 McCarthy (1998a, p. 162). He is using Life Tables prepared by Alpay for three metropolitan cities and some selected regions in the 1960s (Alpay, 1969). 10 The undercounting of Muslim women in these vilayets is not a suprise in view of the orthodox Muslim view still held in those areas that women are namahrem and should not be exposed to adult males other than close kin. The contrast between Aydın and the easternn vilayets is possibly due to the less orhodox beliefs held in the west. Also, the
40 S. MUTLU
distributions for Muslims and Armenians in the eastern vilayets may attest to the possibility if not the fact that despite religious differences, the two communities held similar mores respecting women. 11 This relative decline was noted by McCarthy (1998a, p. 80). See note 6; also see Sonyel (1987, pp. 148, 253-256). 12 This report is “Sicil-i Nüfus İdare-i Umumiyesi” of 17 Ramazan 1312/14 March 1895 (Karpat, 1985, p. 156-57, 160). 13 The figures are from Karpat (1985, pp. 156-161). The population figures given by Karpat for 1897 are really the figures of the 1895/96 Census, which are in agreement with the ones used by McCarthy (1998a) as belonging to 1313/ 1895-96 census. 14 In a similar case, Karpat (1985, p. 254, note b notes that the population of İstanbul given for 1885 and for 1893 are identical. 15 A Model Life Table is an expression of typical mortality experience derived from a group of observed Life Tables. A life table is a listing of survivors at different ages, up to the highest age attained in a hypothetical cohort subject from birth to a particular set of age-specific mortality rate. The rates are those observed in a given population during a particular period of time. The Model Life Table chosen for the study is that of the East which is based on the mortality experience of Austria, Germany, Czechoslovakia, North and Central Italy, Hungary and Poland. The periods considered vary from 1881 to 1890 for Germany, 1931-32 for Poland and 1949-1951 for Czechoslovakia. See Coale and Demeny (1966, pp. 12-14). While the child mortality in Turkey even in the 1960s was considerably higher than that represented by the East Model Life Table and it must have been much higher for the period under consideration (Demeny and Shorter, 1968), nevertheless it is found that the Turkish mortality experience fits the EastTable best (Shorter and Macura, 1983, pp. 70-71; also see McCarthy, 1998a, p. 203-204). 16 A mortality level in a Model Life Table gives the age pattern of mortality by Gross Reproduction Rates with a specific expectation of life at birth. A low mortality level is associated with a low expectation of life at birth and a higher mortality level with a higher expectation of life. 17 Gross Reproduction Rate is the average number of female children a woman would have if she survived to the end of her child bearing years and if, throughout, she were subject to a given set of age-specific fertility rates and a given sex ratio at birth. In the Model Life Tables, the mean of underlying maternity schedule is taken as 29 years, that is a woman is assumed to remain fertile for 29 years. 18 Except for Biga, McCarthy uses the same GRR (=3) in his study (McCarthy, 1998a, p. 231). 19 Apart from the census reports, McCarthy, using censuses and salmanes, gives tables for some vilayets from which development of population over time can easily be followed (McCarthy, 1998a, see also Karpat, 1985, p. 190). 20 The underlying assumption in the formula is that males above 15 years of age were correctly recorded and male/ female ratio is 1. 21 These overestimates may result from possibly less massing of children at age 15 in the 1905/06 census. Massing at round numbers such as 15 or 20 still continues in Turkish censuses. 22 The underlying assumption in the formula, though could not possibly be wholly true, is that the adult females, those 15 years of age and above, were correctly counted. 23 McCarthy (1998a, pp. 83-84) calculates another figure for the Armenians, assuming that each Armenian household had the same number of persons as the Muslim households-6.69 persons per household. This second figure come up to be 91 thousand which he takes as the minimum number of Armenians to which the correction coefficient is to be applied. 24 McCarthy uses a different method and utilizing Cuinet’s estimates arrives at a population of 144,991 Armenians for 1911/12 (McCarthy, 1998a pp. 79-80). The date should have been 1914. The error is due to interpretation of the date in the Ottoman document as Hicrî rather than Rumî. Both McCarthy’s and our estimate are possibly on the high end, in as much as there was out-migration of Armenians to other countries and to Cilicia during the period. 25 In the Eastern Vilayets, there were intensive proselytization efforts to convert Christians to Protestanism. These efforts were concentrated on Armenians, and all Protestants may have been Armenians, In the other vilayets some Protestants may not have been Armenians and hence for vilayets other than those in the East, Armenians may have been slightly overestimated. For the proselytization efforts by Protestant missionaries see Kocabaşoğlu (1989) and Engelhardt (1999, pp. 65-67, 297-301). 26 Some sources put the Greek population in Ionia alone as 2 million in 1914. There are other inflated figures. For examples, see Pentzopoulas (2002, p. 30- 31), who mentions them so that his use of the Patriarchate’s Statistics looks conservative and cautious in comparision with the other figures. 27 Polybius, Greece Before the Conference, London: Methuen and Co. Ltd., 1919 28 George Soteriadis, An Ethnological Map Illustrating Hellenism in the Balkan Peninsula and Asia Minor. London: Edward Stanford Ltd., 1918. 29 Léon Maccas, L’Hellénisme de L’Asie Mineure.Paris, 1919. 30 Apparently whoever prepared the so called Patriarchate Statistics took Vital Cuinet’s well- known work (La Turquie d’Asie, 4 volumes. Paris: 1890-94) as the starting point and added to or subtracted from each ethnic group as he deemed fit, and labelled it as the Greek Patriarchate Statistics, To butress the alleged Patriarchate figures then Ottoman Official Statistics was concocted (McCarthy, 1998a, pp. 96-97).
OTTOMAN POPULATION 41
31 Venizelos used the alleged Patriarchate Statistics in the Peace Conference following the First World War to buttress his arguments on the number of Greek population in the Ottoman Empire. F.O. Documents on British Foreign Policy, 1919- 1939, series 1, vol. VIII, pp. 64-65, cited in McCarthy (1998a, p. 96), also see Shaw (2000, pp. 395-96).
The head of the Ottoman Delegation to the Sevres, on June 17, 1919, in his presentation to the Supreme Council made no direct reference to the population issue. However, in a memorandum to the Supreme Council on June 23rd, in connection with the border issue in Thrace, it was declared that the north and west of the vilayet of Edirne, including western Thrace, was predominantly Turkish (Shaw, 2000, pp. 416, 419). The population issue was brought out in the London Conference, by the Turkish nationalist delegation to prove that Western Anatolia under Greek occupation was overwhelmingly Turkish. On February 24, 1921, the delegation cited the figures collected in 1896 by a recognized French authority, M. Puymet, for purposes connected with the collection of Ottoman Public Debt and published as an official publication, a Yellow Book, by the French. Puymet’s figures for Aydın was 1,296,595 Muslims (Turkish) and 230,711 Greeks (Shaw 2000, pp. 1233-1234). 32 The mortality rate among the refugees was 45 percent during the last months of 1923 (Pentzopoulos, 2002, p. 98). The high degree of mortality among the refugees is attested by the surviving refugees in interviews conducted by a Turk from Honaz (Denizli) who in the early 1990s traversed refugee settlements throughout Greece in search of the family of the Greek neighbour of his father; see Yalçın (1998, passim). 33 Charles B. Eddy, Greece and the Greek Refugees. London: George Allen and Unwin Ltd., 1931., pp. 52, 248; cited in Pentzopoulos (2002, p. 98). 34 During the two wars, the Anatolian and Thraceian Greeks died not only during the clashes, but also during the deportations. It is claimed that 418 thousand Greeks were deported during the First World War and that deportations continued during 1919 and 1920 (Pentzopoulas, 2002, p. 57). Ladas gives the number of deportees to the interior of Anatolia as 50 thousand (Ladas, 1932, p. 21). These figures need to be checked in the Ottoman archives, but there is no doubt that there were deportations and some deportees perished. There is a moving account of a deportee in Dido Sotriyu’s novel, Benden Selam Söyle Anadolu’ya.