Embed Size (px)
Citation preview

Late Entitlement to Retirement Benefits: Findings From the Survey of New Beneficiaries j
by LEONARD RUBIN*
The Burve~ of New Beneficiaries provides in- formation on whu people claim retired-worker benefits at a particular tinw. A small portion of nctv clainaants bccomc entitled at age 66 or latrr. This report dcscribrs thcsc newly entitled older persons, considers the circumstances and impli- cations of their late entitlement, and compares them with other beneficiaries. Older brncficiarics were less likely to have reached high school and more likely to be black, to have been unskilled, and to have had PIA’s at the minimum level of $64. At that level, though many had been Federal Government or railroad workers with second pcn- sions, many others had no such additional pensions. Generally, older beneficiaries were not so well off with regard to retirement inoomc, and a greater proportion continued to work after entitlement despite their age afind presumably because they needed the income. Many of tkcm, however, could have bcoome entitled to full payable benefits earlier and may have lost benefits for which theu were eligible.
INCLUDED AMONG WORKERS who file claims for retirement benefits under the social security program are a group who do not become entitled until they are aged 66 or older. The fact that some of them lose benefits to which they would have been entitled had they filed earlier is a matter of concern to the Social Security Ad- ministration, which tries to ensure that no eligible individual forgoes benefits. To provide informa- tion about why workers claim benefits at different ages, the Social Security Administration has un- dertaken the Survey of Newly Entitled Bene- ficiaries (SNEB) .
Findings from the survey on economic, demo- graphic, work, and program characteristics of new beneficiaries have been described and ana- lyzed in 11 earlier articles. In this article drawn from SNEB data, late claimants ,are compared with all newly entitled retired workers aged 62 and over, and some attempt is made to find out how the circumstances of the older beneficiaries may have affected their late entitlement.
* Division of Retirement and , Survivor Studies, Offlice of Research and Statistics.
BULLETIN, JULY 1973
The estimates presented here are based on a sample and may differ somewhat from figures that might have been obtained had the same questions been asked of all persons in the subject population. Estimates of sampling variability are given in the Technical Note at the end of the article. Differences between percentages are pre- sented only if they appear significant according to procedures described in the note.
Data for beneficiaries entitled at age 66 or older were accumulated for the entire survey period, which covered new entitlements during the 2 years July 1968June 19’70. In view of the large size of the total sample, it was deemed in- efficient and too costly to tabulate comparable data for the full 2 years for those aged 65 and under. At the time, it was believed necessary to include 12 months to cover all seasons as for the group aged 66 and over. The two populations are not mutually exclusive, but differences observed between the two populations would generally be even greater if they were independent. Exclusion of older beneficiaries from the total would have had little effect on the estimated percentages for all beneficiaries because that population would have been reduced only by somewhat less than 5 percent.
5 percent of the SNEB sample popula- tion-104,000 persons-became entitled to retired- worker benefits at age 66 or later. More than three-fourths of these late claimants were en- titled to benefits that were payable at award, a larger proportion than among all newly entitled beneficiaries, particularly for the men, as the data below indicate. The 22 percent of the older
Aged 66 and over All beneflctsries
Total 1 Men IWomen Total ( Men (Women
3

c persons who became entitled to benefits post- poned at award were, as a group, not so old at entitlement as those with payable benefits: 68 percent of the former became entitled at ages 66 or 67 but only 40 percent of the latter (table 1). It is not surprising that the incidence of post- poned benefits is greatest for the younger per- sons among the late claimants because postpone- ment implies substantial if not full-time employ- ment that would tend to lessen with age. As the tabulation above indicates, among the men, the older beneficiaries are less likely to have post- poned awards. This difference is consistent with the fact that it is less usual among older persons to have employment that would lead to postpone- ment of benefits at entitlement.
/
Differences by payment status are presented in the following tabulation. Two-thirds of the older beneficiaries with postponed benefits were men, but men and women were about equally repre- sented among those with payable benefits. Roughly the same relationship between sex and payment status existed among all those newly entitled. There is, however, a greater proportion of women among late claimants than among all newly entitled beneficiaries, notably for those with postponed benefits. This is predictable, be- cause women tend to outlive men and may often
Ihave to continue to work to support themselves.
I’
I
under the Social Security Act at least 1 year before becoming entitled to the cash retirement benefits (table 2). One factor that would account for the time lapse is the difference in quarters of coverage required for each. Workers could become entitled to hospital benefits either if they had reached age 65 before 1968 or if they reached age 65 at or after 196s and had acquired a cer- tain number of quarters of coverage. Fewer quarters of coverage are needed for hospital benefits than for retirement benefits, as shown below.
Quarters required for entitlement
1 Men 1 \vornen 1 I Men I women
66 __-_---_-_ :i
,L
67 ________ __ : :i i :; ::
68 ____ ____ . _ 0 69 _____ __ ___ :z- :t 70 ---------- : 12 i
i :H :i 11
71-_-----_-- : :t : :;
10 72 __-_____._ / Q 73 and over- 0 ‘Q ‘6 0 1 11 ‘8
1 Or fewer quarters. 1% ’
BeneW&.~t (2& 1 TotT;T;omen ’
Aged 66 and over
pos~~l---::~---~::::~~: -;I Payable _________________
All beneficiaries
Total ________________ 1,173 100 60 40
Payable _________________ 805 100 53 47 Postponed _______________ 368 100 74 26
PROGRAM CHARACTERISTICS
i . Interval Between Entitlements to Hospital and Retirement Benefits
/ Among late claimants with payable benefits?
Persons with sufficient quarters of coverage for hospital benefit entitlement may have needed additional quarters of coverage for the fully insured status required for cash benefits as re- tired workers. Having earned those quarters, they may, through oversight or choice, have de- layed filing and then claimed retroactive entitle- ment. In any case, at least some of the time may be accounted for by their efforts to achieve fully insured status. For those who had to earn quar- ters of coverage, the amount of elapsed time be- tween the two entitlements may reflect either the number of quarters yet ‘to be earned or the amount of work they could undertake. For some late claimants, the kind of work they could do may not have been available or health problems may have made any work difficult. Hence, those who were older at entitlement to retirement bene- fits were more likely to have experienced a lapse of time after they became entitled to hospital benefits. ’
7 Of those entitled late to payable benefits, 58 percent became entitled to hospital and retired- worker, benefits in the same year. Some of them
/ 42 percent became entitled to hospital benefitbay have been eligible before they filed but did
4 SOCIAL SEWRITY

TABLE l.-Age at entitlement of older beneficiaries, by benefit-payment status and sex: Percentage distribution of persons initially entitled to retired-worker benefits, July 1968Jung 1970 awards
Benefit-payment status
. Age at entitlement Total Payable Postponed
Total Men Women Total MelI Women Total Men Women
Total number (in thousands) __________ 104 57 47 80 42 38 23 15 8
Total percent..-.-..------------------- 100 100 100 100 100 100 100 100 109
64 ________________________________________-- 29 28 29 23 21 25 67-s _ _ _ _ _ _ _ _ _ _ _ _ _ _ _ _ _ _ _ _ _ _ _ _ _ _ _ __ _ _ _ _ __ _ __ _ _ 68- _ _ _ _ - _ _ - _ - _ - _ - _ _ _ _ _ _ _ _ _ _ _ _ _ _ - - _ __ _ _ _ _ __ _ _ :; :i :i :a :i :;
2: ‘2:
69. ___ ____ _ ________ _ __ ____ __ ___________ _____ 10 10 10 11 11 11 ‘i ‘:
$
70. _ _ _ _ _ _ _ _ _ _ - _ _ - - - _ _ _ - - _ _ _ _ _ _ _ _ _ _ - _ _ - _ - - _ _ _ 71. --_______---_-_____-- ___ ____-_ --_ ---_____ Ex : : : -
7 i
8 :
72. _ - - _ _ _ _ _ _ _ - - _ _ _ - _ _ _ - _ _ _ _ _ _ _ _ _ - _ - _ _ _ - _ - _ _ _ 73 and over _________________________________ 1: 1: 1: 1:
ii 6 1:; * : 18 5 I
IS 1 1
LO.5 percent or less.
not claim retired-worker benefits because they ure to claim retirement benefits at that time most were fully employed. Ot,hers may have needed
c
probably reflected lack of sufficient quarters of additional quarters of coverage for fully insured coverage. &&us. This would be the situation for Federal employees who wish to enroll in Medicare for hospital benefits. If they were to continue to bc covered by the Federal employees health benc- fits program they would have to continue to pay premiums. Hospital coverage under Rledicare does not require premium payments but Federal employees must earn full coverage for retired- worker benefits before they are eligible for Medi- care hospital benefits. Since Federal employment is not covered under the social security program, many would have to earn quarters of coverage relatively late in life if they wanted Medicare
The newly entitled whose benefits had been postponed more often became entitled to hospital and retired-worker benefits simultaneously than did those with payable benefits. They may have waited to claim hospital benefits Lmtil they felt Yhey were near actual retirement-reducing their mount of work or stopping altogether. Indeed, titlement to cash benefits may have been only byproduct of their filing for hospital benefits cover hospitalization in the previous year or
ticipated hospitalization. For the 21 percent o had benefit’s postponed at award and who
1 or more years between entitlements, the to earn quarters of coverage for fully in-
sured status may well have been the determining factor in their late entitlement to cash benefits. They must have been informed of the rules gov- erning entitlement as a result of visiting a dis- trict office to file for hospital benefits. Their fail-
BULLETIN, JULY 1973
Retroactive Entitlement
Persons claiming their retirement benefits may request retroactive entitlement for up to 12 months before the date of filing if at the desired date of entitlement they had the necessary quarters of coverage and were at least aged 62. They receive in a lump sum the benefits that ac- cumulated during the period of retroactivity. (Not included in this article are those persons who filed at age 66 for retroactive benefits ef- fective in their 65th year because the concern here is only with those entitled at age 66 or later.)
As could be expected, the great majority (about 95 percent) of persons who became’ entitled to retirement benefits at age 66 or later chose retro- active entitlement (table 3). Furthermore, the greatest proporlion-at least two-thirds-had retroactive entitlements for the full 12-month period allowed by law. A far smaller proportion of all the newly entitled had retroactive entitle- ments--23 percent of those with payable benefits and 26 percent of those with postponed benefits- partly because a large proportion of the new beneficiaries became entitled at age 62. - As evinced by their retrocative status the vas G majority of late claimants were ‘eligible for full benefits before they actually filed their claims. The extent of filing for retroactive entitlements is a phenomenon among older beneficiaries ren- \, dered even mpre curious by the large proportion
5

TABLE 2.-Interval between entitlement to hospital and retired-worker benefits among older beneficiaries, by age at entitlement: Percentage distribution of persons initially entitled to retired-worker benefits, July 196SJune 1970 awards1
Age at entitlement *
1 I I I
Payable benefits
I I I I I Number (in thousands):
Total-..--...---....------------- Reporting ________________________
p-e-
Total percent..--....--...--- IM) 100 100 100 ----
Hospital benefit at retired-worker
Hospnal nenenf titlement.-.-
Hospital benefit titlement.-.-
Hospital benefit J year: before entitlement-..
__ e++men& ___________________ 68 67 81 80 1 year before en-
_____--_--_________ 19 23 14 14 2 years before en- ------_____------__ 16 10 19 20 n ---7 or more
---_--__-_- 7 -.*___ ‘6 6
_-- 100 100
---
49 55
21 19
21 14
9 13
I I I I I I Postponed benefits
Number (in thousands): Total __._________________________ 23 11 4 Reporting ________________________ 23 11 :: 3
---- Total percent ________________ 100 100 100 100
---- IIospital beneflt at retired-worker
entitlement ____._______________ 78 85 82 72 Hospital benefit 1 year before en-
titlement _______________________ 9 11 4 10 Hospital benefit 2 years before en-
titlement _______________________ 9 4 9 16 Hospital bene5t 3 years or more
before entitlement ______________ 3 ---___ “5 3
: i:; --
100 100 --
60 (9
10 (‘1
19 (4)
11 (9
I /
Others among the older beneficiaries may have felt no urgency or perhaps initially may not have cared about getting retirement benefits, or they may not have felt the need to include them in their retirement plans but later changed their minds. i
Interval Between Last Job and Entitlement of Nonworking Older Beneficiaries
/ Of those with benefits postponed at award, only
19 percent were no longer working at the time they were interviewed. Practically all of them (92 percent) reported that they had stopped work at or after entitlement (table 4). Fifty- nine percent of those with benefits payable at
i
award, hbwever, were not working at the time of the survey, and these persons were far more
terval
likely to have been without work for some time
they could not have been earning the
before becoming entitled: almost half had not
quarters of coverage essential to entitlement. In
worked for 3 or more years before entitlement. Though a smaller proportion of the older group had stopped work before becoming entitled (37 percent compared with 61 percent), relatively more of them had stopped work 3 or more years
becoming entitled-roughly half of the group but only one-third of all the newly-
There is, then, a significant proportion the nonworking older beneficiaries with pay-
ble benefits who could have become entitled earlier than they did. If they reported accurately on when they had stopped work, during this in-
1 Percentages exclude 2 percent of the survey population who were not entitled to hospital benefits at the time of the survey.
* Data obtamed by subtracting date of hospital beneflt entitlement from date of entitlement to retired-worker benefits.
8 The reason that intervals of 3 years may he shown for persons aged 67 is that, if a wcxker with entitkment to retired-worker benefits in his 67th year became entftled to hospitd bez&ts in his 65th year but at an earlier point in the calendar year than his retired-worker benefit entitlement, the interval between entitlements is counted as 3 years. It actually represents 2 full years and
48 art of another. ot computed because base less than 2,000.
other words, they -must have had the requireL
/” / who had already become entitled to hospital coverage when they stopped work.
benefits. Two general questions arise: Why did they delay filing for retired-worker benefits for which they were eligible earlier? And what pro- portion of them had been ’ eligible even more than 12 months before they filed? Perhaps some persons did not understand or did not have ade- quate information on some aspects of the pro- gram regulations, especially with respect to the number of quarters of coverage needed at dif- ~ ferent ages for fully insured status. They may not have understood that benefits may be claimed (and possibly postponed) by an ‘employed person and that the benefit rate may later be adjusted I
K A y Questions
The description of program characteristics of the older beneficiaries raises key questions about their late entitlement. These questions center on three points : (1) the extent of beneficiaries’ pro- gram knowledge before entitlement, (2) the ex- tent to which they felt that benefits were impor- tant to them before they became entitled, and (3) the need to continue working to earn the requi- site number of quarters of coverage for fully
upward on the basis of postentitlement earnings.bsured status.
6 SOCIAL SECURITY
TABLE 3.-Retroactive entitlement among older and all beneficiaries, by benefit-payment status and sex: Percenta e distribution of persons initially entitled to retired-worker benefits, for older beneficiaries, July 1968-June 1970 awards, an i for all tiene- ficiaries, July 1969-June 1970 awards
Benefit-payment status
Retroactive awards Older Ijene5ciaries All beneficiaries
Payable Postponed Payable Postponed
Total Men Women Total Men Women Total Men Women Total Men women -----------
Total number (in thousands) _____________ 80 42 38 2.3 15 8 805 425 380 368 272 96
-~~---___~--- Total percent-- __________ 100 100 100 100 100 100 100 100 100 100 100 100
----------- Not retroactive _______________ I3 7 4 4 5 2 57 65 80 74 77 86
Retroactive. _________________ Less than 12 months _______ 94 :“2 i: 96 95 “i i; -2 26 23 12 months __________________
ii ii i”z 18 16 ii 61 70 93 16 16 8 8 11
DEMOGRAPHIC CHARACTERISTICS
Race
Among older beneficiaries with benefits payable at award, 20 percent are black; among those with postponed benefits, 13 percent are black (table 5). Black women are three times as likely to have payable rather than postponed benefits, but no such variation is observed among black men.
Except among women with postponed benefits, black persons constitute a much higher propor- tion (about twice as great) of older beneficiaries than of all the newly entitled. Only among older new beneficiaries-and particularly among the older men with payable benefits-does the pro- portion of persons who are of other minority races rise above 1 percent. Generally, those with postponed benefits have a higher economic status
than do persons with payable benefits and thus are likely to include fewer persons from disad- vantaged groups.
Education
Fifty-four percent of the older beneficiaries with payable benefits and 38 percent of those with postponed benefits had a grade-school edu- cation or less. Those who went beyond grade school were relatively evenly distributed among the levels of educational attainment.
Older beneficiaries were far less likely to have gone beyond grade school than were all bene- ficiaries, but those among the older group who finished secondary school were more likely than were all beneficiaries to have gone even further in their education and to have completed at least
TABLE 4.- status and June 1970
-Interval between last job and entitlement among older and all beneficiaries who are not em sex: Percentage distribution of persons initially entitled to retired-worker benefits, for 01 (P
loyed, by benefit-payment
awards, and for all beneficiaries, July 1969-June 1970 awards er beneficiaries, July 196%
Benefit-payment status
Interval between last job and entitlement Older bene5ciaries All bene5ciarfes
Payable I Postponed _ Payable I Postponed
Total Men Women Total Men Women Total Men Women Total Men Women --~---------
Total number (in thousands) _____________________ 47 24 23 4 3 2 541 274 267 72 52 20 -----------
Totalpercent..----.-----------------------~----- 100 100 100 100 100 100 100 100 100 100 100 100
Stopped work at or after entitlement _________________ Stopped work before entitlement _____________________
3 years or more before ______________________________ Not reporting on date stopped work. _________________
I I I I I I I I I I I I
1 Not computed because base less than 2,000.
BULLETIN, JULY 1973 7

TABLE 5.-Selected demogra hit distribution of persona
characteristics of older and all benificiaries, by benefit-payment statue and sex: Percentage initial y entitled to retired-worker benefits, for older beneficiaries, July 1968~June 1970 awards, and for P
all beneficiaries, July 1969-June 1970 awards
I Ben&t-payment status -
All bene5ciaries CharacterL3tic
Older beneficiaries
Payable I Payable i- - ‘otsl Men omen
-
Men W r0m --
425 390 ‘368 --
--
Men
ical Area, as defined by the
fomen Hen rota1 ome* Total
Total number (in thousands) _____________________ 66
Total percent ____________________________________ 160
Race: White ________________________________________------ 77 yet ~‘-“---- * ~~--~~~~~-~-~_~~~-~~-~~~~~~~~~
__-_-____-_____---_-------------------------- 2;
Education: Grade school or less ________________________________ 54 Less than high school ______________________________ Completed high school _____________________________ ::: Eome college. _______.______________________________ Completed college or more _________________________ Not reporting on education _________________________
1:
Marital status: Married ________________________________________---- Notmarried.--.-....-..--------------------------- 9:
ShllS~;~Ad region: ___________._-__________________________--
Northeast ________________________________________ El North Central...-.--.-..-.---------------------- South _____________.__________________________---- ii West ______________._________________________-----
Not in SMSA ______________________________________ Northesst....-----.------------------------------ North Central ____.______________________________ South.------.-..-...----------------------------- 1: West ________________________________________----- 4
r 0.6 percent or less.
42 36
f&and Census.
of the
among the older beneficiaries, the majority of whom were widows.
4 years of college. This finding suggests that older beneficiaries had been at least as well pre- pared for professional careers as were all bene- ficiaries.
Residence
Two-thirds of ‘the older beneficiaries with pay- able benefits and four-fifths of those with post- poned benefits lived in metropolitan areas. Of those outside metropolitan areas, about one-half were concentrated in the Southern States. No meaningful differences related to place of resi- dence are evident for older beneficiaries and all the newly entitled, but the older beneficiaries in rural areas may be more disadvantaged than younger ones because services and amenities are less accessible or nonexistent.
Marital Status
Among those who became entitled to retire- ment benefits at age 66 or later, somewhat more than half were married at the time of the survey. Women beneficiaries were far less likely to be married than were men, a reflection in part of different death rates. Women who were earning enough to have their benefits postponed at en- titlement were more likely to be single and mostly self-supporting than were women with payable benefits.
It is not surprising that older beneficiaries were much less likely to be married at the time of the survey than were all beneficiaries, who were far younger as a group. This difference is especially noteworthy for women with payable benefits: 63 percent among all the newly entitled were married-a proportion almost twice that
Summing’ Up
8 SOCIAL SECURITY
Four-fifths of the older beneficiaries had pay- able benefits. Of this group almost one-fourth
to a minority group. More than one- had only a grade-school education or less,

TABLE 6.-Work limitation and employment status of older and all beneficiaries, by benefit-payment status and sex: Percentage distribution of persons initially entitled to retired-worker benefits, for older beneficiaries, July.l968-June 1970 awards, and for all beneficiaries, July 1969-June 1970 awards
Work limitation and employment status
Total number (in thousands) ____________________.
Total percent.-.-.-.--.-------------------------.
Work limitation: Nolirnitation-.-------------------------.---------. WMl limitation ____________________---------------.
Cannot work.. ____________________--------------. Can work------.--------------------------------. Not reporting on limitation ______________________
Emplovment status: Employed--. ____________________-----------------. Not employed ____________________-----------------.
- Beneflt-payment status
Older beneficiaries All beneflciarles
Payable I Postponed Payable I Postponed
Men Women Total
42
ik 31
7
43 57
hbout one-half were married, and about one-third lived in rural areas, often in the South. Compari- son of these demographic data for late claimants with data for all newly entitled beneficiaries sug- gests that the older beneficiaries include some- what greater proportions of persons of lower social and economic status and perhaps of the poor. Moreover, both poverty and old age in- crease the likelihood of living a relatively re- tricted life, if not one of relative social isola-
Such conditions could affect not only the ich the regulations governing social
curity coverage and entitlement are understood also the ability of some late claimants to e the effort to contact a district office. In
ltion, this group of late filers may be slower lating the required quarters of cover- their lower level of school achievement
concomitant of little skill and resulting access to the labor market--especially
health problems restrict the ability to ysically demanding unskilled or semi-
EMPLOYMENT CHARACTERISTICS
limitations on Ability to Work
Oldek beneficiaries with postponed benefits, clearly likely to be working, were also likely to be able to work (table 6). Twenty-four percent of this group said they had limitations on their ability to work, but only 4 percent said they
Men Women Total Men ----
15 8 305 425
-iiF----- 100 100 loo ----
pornen Total Men Women ----
330 368 272 96
-G---- --
100 100 100 ----
were inable to work at all, when they were asked to assess the affects of any health problems on their ability to work. Those with payable bene- fits were twice as likely as those that had their benefits postponed to report limitations, and 21 percent said that their iimitations prevented them from working. There were no notakle differences between the older group and all the newly entitled beneficiaries with respect to work limitations.
Employment Status
When they were interviewed, 80 percent of ‘the older beneficiaries with postponed benefits were employed. Although those with payable benefits were far less likely to have been employed at the time of the survey, 41 percent were in fact working when interviewed. Surprisingly, a smaller proportion (33 percent) of all new bene- ficiaries with payable benefits were working at the time of the survey.
Occupation
Generally, occupational status is related to both sex and benefit-payment status (table 7) .I
1 The occupation categories used in the survey data are very broad. Included among others in the household and service category, for example, are domestics, police- men, waitresses, and delivery persons. Clearly, these occupations will reflect differences related to sex.
BULLETIN, JULY 1973 9
TABLE 7.-Occupation and employment status of older and all beneficiaries, by benefit-payment status and sex: Percentage distribution of persons initially entitled to retired-worker benefits, for older beneficiaries, July 1968-June 1970 awards, and for all beneficiaries, July 1969June 1970 awards
-
_-
Benefit-payment status
Older beneficiaries All beneficiaries
Payable Postponed Payable I Postponed
Employment status and occupation
Total 1 Men (Women/ Total 1 Men (Women( Total 1 Men IWomen Total 1 Men IWomen
Employed beneficiaries
Total number (in thousands) ____________________. 33 1 18 1 15 I 19 I 12 I 6 264
Total percent-..--.-.--..-----------------------.
Current occupation: Selfemployed ____________________-----------------. Wage and salary ____________________--------------.
Profewonal, technical, and managerial __________. Clerical and sales. ____________________-----------. Craftsmen and operatives ____________________---. Service and household ____________________-------. Laborers ________________________________________.
Not reporting on occupation ____________________--.
Not employed beneficiaries
274 ( 267 1 72 62 20 4
100
-
--
--
-
23
100
641
100
8:
ti 34 15 6 1
Total number (in thousands) ____________________.
Total percent------.----..----------------------.
Occupation on longest job: Self-employed ______________________________________ Wage and salary ___________________________________
Professional, technical, and managerial ___________ Clerical and sales _________________________________ Craftsmen and operatives.-------..-------------. Service and household ____________________________ Laborers ______._________________________________-
Not reporting on occupation _______________________
3 5 --
100 lO( _- __ -
-
24
:: :
9: ;: 32
‘3” 6 I
less than 2,000. 10.6 percent or less. ’ Nc
Men, for example, are much more likely than women to be self-employed and, if they are wage and salary workers, to be craftsmen or operatives or laborers. Women are more frequently in household or service work or, when they are in white-collar occupations, in clerical or sales posi- tions. Older persons with postponed benefits are more likely to be employees rather than self- employed and to be in white-collar or relatively skilled blue-collar positions than are the workers to whom benefits were payable at iward.
Among older beneficiaries who were working at the time of the survey and whose benefits were postponed, 72 percent of the men and 82 percent of the women were wage and salary workers. About one-half of the wage and salary workers were in white-collar occupations, about one- fourth were in skilled blue-collar work, and the
i remaining one-fourth were in blue-collar occupa- tions of lower status.
Among older beneficiaries with payable bene- fits who were still employed at the time of the survey, 62 percent of the men and 78 percent of
the women were wage and salary workers. 7S7ith- in this group, about one-half of the men and more than one-half of the women were in un- skilled or semiskilled blue-collar occupations ; about one-third were white-collar workers; the remainder were in skilled blue-collar work. Of all those working at the time of the interview a large proportion were self-employed-35 per- cent of the men and 16 percent of the women.
Differences between the late filers and all new beneficiaries still employed at the time of the survey vary with sex and payment status. The conclusion may also be drawn that older benefi- ciaries are not so fortunate as all newly entitled beneficiaries in their occupational status : Gener- ally, smaller proportions of older beneficiaries were craftsmen or operatives and larger propor- tions were in service or household work or were laborers.
Beneficiaries who had stopped work by the time of the ‘interview were considerably more likely to have been wage and salary workers in their longest jobs than to have been self-
,
10 SOCIAL SECURITY

TABLE %-Most important reason for leaving last job among older and all beneficiaries who are not employed, by benefit-payment status and sex: Percentage distribution of persons initially entitled to retired-worker benefits, for older beneficiaries, July 196% June 1970 awards, and for all beneficiaries, July 1969June 1970 awards
- Ben&-payment status
-
-- All beneficiaries Older beneficiaries
Payable I Postponed Payable
Reason for leaving last job - I Postponed
iomen Total --
Men
23 4 __-
100 100 --
f ? 31 13
1: 1:
21 27
13 16
$ i 3
“i 40 1
1: 2: - - - - - - - - - - - - -
14 _ _ _ _ - _ :
b 2
‘0.6 percent. c
Total rota1 Men lromel Total Men Vomen
62 24
100
48
“E! 21
21
1: 2 1
9
1:
x
:
641 214 267 Total number (in thousands) ____________________.
Total percent ____________________---------------.
Health reasons-----------.--------------------------. Sick, disabled ____________________-----------------. Accident, injury ____________________--------------. Generally poor health ____________________---------.
Job-related reasons ____________________--------------. Corn Job Iscontmued. ____________________-------------. CT
ulsory retirement age ____________________---.
Laid off, fired ______________________________________ Quit work, dissatistled ____________________--------.
Private ressons ____________________------------------. To receive social security or pension benefits..-.-. Reached retirement age ____________________-------. Wanted to retire ____________________--------------. Wanted new job ____________________--------------. Family or personal ____________________------------. Miscellaneous..-.-..------------------------------.
Not reporting on reason ____________________---------.
1 Not computed because base less than 2,000.
employed. The wage and salary workers were much more likely to have been skilled blue-collar workers. Older beneficiaries who were no longer employed when they were interviewed were, how- ever, clearly less well off in their occupational status than all new beneficiaries who had stopped working at that time.
rules or conditions relating to their work, most said that their jobs had been discontinued. Job- related reasons were less frequently given, how- ever, than were the private or personal reasons cited by 30 percent of the older beneficiaries. Only in this category of reasons is there a sig- nificant difference related to sex. Women are much more likely than men to have left their last job for family reasons. Older women, how- ever, are less likely than all newly entitled wo- men to have offered family reasons as the im- petus to leaving work ; for the older women private reasons are less important and health reasons are more important.
Nonemployed Beneficiaries’ Reasons for leaving Last Job
Each nonemployed respondent was asked the most important reason for leaving his last job. Since the nonemployed older beneficiaries with postponed benefits constitute a very small group, estimates for them are not reliable. One signifi- cant difference from those with payable benefits appears: Those with postponed awards are more likely to have left their last job because they reached a compulsory retirement age (table 8).
Among older beneficiaries with payable bene- fits, health problems were the most significant reason for stopping work; most of the 45 percent who left work for health reasons became sick or disabled or experienced generally bad or deterio- rating health. Rarely was accident or injury mentioned. Of the 21 percent who left because of
Implications
Although older beneficiaries with payable bene- fits were as subject to work limitations as all those with payable benefits, they were more likely to have been working at the time of the survey. Of the 41 percent still working as wage and salary employees, half were relatively un- skilled and dependent upon blue-collar work of low status. Those no longer working who had been wage and salary workers were more likely to have held white-collar or skilled blue-collar
BULLETIN, JULY 1973 11

jobs. Older beneficiaries generally had lower oc- range between $80 and $150. Only 15 percent had cupational status than did all beneficiaries. minimal PIA’s between $64 and $80 (table 9).
The data suggest the strong possibility of some Those with payable benefits are not so fortu- interplay between little education, poor work nate with regard to PIA levels. Nearly one-half history, economic need, and insufficient under- (48 percent) had PIA’s at the statutory mini- standing of program regulations. Indeed, among mum of $64 ; 29 percent were in the middle range older beneficiaries-and perhaps especially among ($80~$150). Only 13 percent were at the upper those who continued to work in low-status oc- end-$150 or more. cupations after becoming entitled to payable Among older beneficiaries, PIA amounts show benefits-larger proportions than of all bene- little variation related to sex, unlike those for the ficiaries had only a grade-school education or total group of newly entitled persons, among less and were of minority races. The significant whom benefit levels are very definitely related proportion still working seems to indicate that, to sex. Women in the later group tend to have despite the receipt of social security benefits, con- lower PIA’s than do men, as might be expected. tinued earnings were not only possible but neces- In general, older beneficiaries are more heavily sary for the older group. Some may have realized concentrated at the lower PIA levels, but the before becoming entitled that they would have differences are smaller for women than for men. to supplement benefits with earnings and might The proportion of men with PIA’s of $150 or well have put off filing a claim because they were more was about one-third as large among those concerned over the restrictions on earnings re- who became entitled after age 65 to payable bene- sulting from the earnings test. fits as among those entitled at or before age 65.
Those who had stopped work, given their oc- Among older beneficiaries a very small group cupational distribution, might be somewhat more -those aged 72 before 1969 but without sufficient likely to have second pensions, higher primary quarters t.of coverage to be fully insured-were insurance amounts, and better education and to entitled to a flat-rate benefit ($46 in 196%‘70), have been better informed of social security pro- less than the statutory minimum for fully insured visions through their places of work. That a status. This benefit is payable under the transi- number of these persons had continued to work tional insured-status provisions, and persons beyond age 65 to earn requisite quarters of cov- receiving it constitute only 3 percent of the older erage is also likely. Those who continued work- beneficiaries with payable benefits. ing in good and interesting jobs may have felt no impetus to apply for retirement benefits.
Second Pension Receipt or Expectation
LEVEL OF RETIREMENT BENEFITS
Primary Insurance Ainount
The primary insurance amount (PIA) payable to a retired worker at age 65, based on the level and duration of past covered earnings, is indi- cative of his economic status upon retiring- both directly, as far as social security benefits are concerned, and indirectly as a reflection of his work history.
Close to 50 percent of the older beneficiaries with postponed awards had PIA’s of $150 a month or more, expressed at 1970 levels. Another large group, 38 percent, had PIA’s in the middle
Among late claimants with postponed bene- fits, 39 percent of the men and 29 percent of the women were receiving or expecting a pension in addition to their social security benefit. About one-half were receiving and one-half expecting such additional benefits. Among those who were receiving second pensions at the time of the sur- vey, most were getting them from former public employment or railroad work. Only about one- fourth received second pensions from jobs in the private sector. By contrast, for most of those who were still expecting benefits from second pen- sions, private employment was the principal source.
Among those with payable benefits, 45 percent of the men and 19 percent of the women were receiving or expecting second pensions. Most of
12 SOCIAL SECURITY

TABLE I).-Primary insurance amount and second-pension status of older and all beneficiaries, by benefit-payment status and sex: Percentage distribution of penons initially entitled to retired-worker benefits, for older beneficiaries, July 1968-June 1970 awards, and for all beneficiaries, July 1969-June 1970 awards
Beneflt-payment status \
Primary insurance amount and second-pension status
Older beneflclaries All berm5 Li Fries
Payable Postponed Payable Postponed
Total Men Women Total I I
Men Women Total Men Women Total Men Women
Total number (in thousands) _____________ :. _______ 30
Total percent...--.----.-.----------------------- 100 ,-
w3.00 ---------_-_--_--___---------------: ----______ 64.00 ----_-__________________________________------- 4; 34X-79.90 _________________-_----------------------- 30.00-114.90 ________________---_--------------------- 115.00-149.90. _______________________________________ :; 130.00-133.90 ________________________________________ 134.00 or more.......-.----..----------------------- :
I- I-
Totslpereent----.--.--.-.----------------------- 100
Receiving or expecting _____________________________ Receiving........--_-----------------------------
;t
Private--..-.--.-------------------*----------- Public-...-.._--------------------------------- 2:
Railroad-...-....--.------------------------- Federal Government * ________________________ :: State and local government __________________
Public and private _____________________________ !i Er r;;kyeg ________________________________________
8 2
----__-_-_.__-______-------------------- Public..---......-..--------------------------- :
Not receiving or expecting _________________________ 67
* 0.6 percent or less.
Primary insurance amount at 1970 levels
42 1 33 1 23
109
-
I
--
-
100 I 100 I loo I 100
these men and women were actually getting the cause they tend to be more substantial than asset pensions at the time of the survey. Again, pub- income and more permanent than earnings, Re- lic programs dominated as the source, particularly lating PIA levels to receipt or expectation of for men, who were most likely to have such bene- second pensions brings the economic status of fits from employment with the Federal Govern- older beneficiaries into sharper focus and makes ment or railroads. comparisons with all beneficiaries easier.
Pension expectation is confined mostly to those with postponed awards. Older beneficiaries re- ceiving second pensions differ from all the newly entitled with respect to pension source. A far smaller proportion of the older beneficiaries re- ceiving second pensions receive them from pri- vate sources. Among all beneficiaries receiving a pension in addition to a social security benefit, the private sector predominates as the source, re- gardless of payment status.
Differences in second-pension receipt and ex- pectation are related not only to sex and payment status but also to PIA level.2 Differences with respect to sex are confined mostly to those newly entitled persons whose PIA’s are less than $115. Within this group-the largest among older bene- ficiaries-men are far more likely than women to be receiving or expecting benefits from second pensions (tables 10 and 11). The differences between men and women disappear as PIA’s in- crease above the $115 level. The likelihood of
Relationships Between PIA Amounts and Second- Pension Status
Social security benefits and second pensions are the major sources of income in retirement be-
6UUElIN, JULY 1979
*Includes a small prc -
rtlon with military reth Fen
100 loo -~
42 43 :i 19
4 ‘i (‘1 1
; ;
(I)24 2: ‘: 17
,@3 5:
lent pension.
2 The PIA intervals for older benetlciaries with post- poned awards are larger than the intervals for those with payable benefits. This difference results from the difficulty in finding adequate estimation bases for the former group because of its small initial size, without ohscuring interesting variations in second-pension re- ceipt and expectation.
13

TABLE lO.-Second-pension status, by sex and primary insurance amount for older and all beneficiaries entitled to postponed benefits: Percentage distribution of persons initially entitled to retired-worker benefits, for older beneficiaries, July 196%June 1970 awards, and for all beneficiaries, July 1969-June 1970 awards 1
Second-pension status
Primary insurance amount (at 1970 levels,) for those entitled to postponed benefits
Men Women
Total / ;;f;; / “;:;:$- / $,?$$e Total / $;;f, / 3$$- / $?z;e
Total number (in thousands) ._---__________________
Total percent.....--..-...--------------------------
Receiving or expecting ______-______-____________________ Receivmg.-_-_---_------------------------------------
Privste.-..-..-..-..-------------------------------- Public----------.-----------------------------------
Railroad.-.---.----------------------------------- Federal Government 8 ____________________________ &ate or local government. ________________________
Pubhc and private __________________________________ Erpecting.-...-...-.---------------------------------
Prlvate-.-.-.--..-.--------------------------------- Public ____________________-------.------------------
Not receiving or expecting.-..-.-----.------------------
l-
Total number (in thousands) _______________________ 272
Totalpercent..-...--------------------------------- 100
Recking or expecting __________________________________ 43 Receiving ________________________________________-----
Private.-.....---...-.--..-.------------------------ :i Public ________________________________________------
Rairoad.-.-..-...-------------------------------- i Federal Clovernment I____________________________ State or local government _________________________ ;
Public and private ______.___________________________ 1 Expecting ________________________________________----- 25
Private.---.--..-.---------------------------------- 17 Public-.--.------.----------------------------------
Not receiving or expecting ______________________________ 5::
1 Excludes those with transitional awards. * Not computed because base less than 2,000.
second pensions is greatest for both men
Older beneficiaries
5 3 7 8 2 3 4
100 100 100 100 100 100 100
ii :: 34 12
3; : : 9 ______._____ __________
18 2”
5- ____--______
‘: 1 __-_---_-_ !. --_-__-__- “-
4: 3
:2” 83 ;
22 18
6-i ‘$
28 38
100----- 100
All beneticlaries
206 96
100------- 100 ____-
ii 2 18 5 :
(9
4
(9 1
i’:
(4) ,“,
5: :: 61
*Includes a small proportion with I 4 0.5 percent or less.
and women in the lowest and the highest PIA cate- gories. Older men with payable benefits are more likely than are those with postponed benefits to have second pensions and to be receiving them, not expecting them. On the other hand, women with postponed benefits are more likely than are those with payable benefits to have second pensions.
Sources of second pensions vary with PIA level, reflecting in part the differences in sources for those who are receiving and those who are expecting them. Persons with postponed awards are more likely than those with payable benefits to have high PIA’s and still to be expecting rather than receiving second pension benefits. Moreover, their expected second pensions come mostly from private sector jobs. Persons with PIA’s below $115 are more likely to have or to expect their second pensions from the public sector. Older beneficiaries are at least as likely
ml
19 I 29 I 48
Uitary retirement pension.
to have second pensions as are all the newly en- titled but are much less likely to have high PIA’s, as the following tabulation shows.
Second-pension status and primary insurance amount
Total number (in thousands) ________________.
Total percent.--..--.--.-.-.-----------------.
Receiving or expecting second pension __________.. $64.00-79.94 ____________________-------.-------., 80.00-149.90~.~~~~~~~~~~~~~~~~~~~~~~~~~~~~~~~~~~. 150.00 or more. ____________________---.--------..
Not receiving or expecting second pension..-.---.. 364.OIHQ.QO ____________________----------------. SQ.OO-149.90 ____________________________________( 150.00 or more...--.-......-..------------------,
Newly entitled with payable benefits
Aged 66 and over %2%
Late claimants, including as they do relatively fewer persons wi& high PIA’s, are far less likely than are all beneficiaries to have their second
14 SOCIAL SECURITY

TABLE IL-Second-pension status, by sex and primary insurance amount for older and all beneficiaries entitled to payable benefits: Percentage distribution of persons initially entitled to retired-worker benefits, for older beneficiaries, July 196%June 1970 awards, and for all beneficiaries, July 1969-June 1970 awards 1
Becond-pension status
Total number (in thousands) _____________________
Totalpercent...---...-..-..--------.---r--.-.--.
Receiving or expecting ____________________----------. Receiving-..-..-..-------------------------,------.
Private.-------....-------------------.----.----. Public.-..-----.-.._-.----.-------------------.-.
Railroad-.-----_-_----._--_----.--------------. Federal Government 4 ____________________-----. State or local government ____________________-.
Public and private ____________________----------. Expecting ________________________________________-.
Private _____________ ____________________--------. Publlc-..--------...----------------------------.
Not receiving or expecting _________.____._____-.-----.
Total number (in thousands) _____________..______
Total percent ________.___________________________
Receiving or expecting _______________________________ Receivrng.-...-.-._-------------------------------~
Private-. ________________________________________ Public. __ ________________________________________
Railroad--....---.----------------------------. Federal Government ___________________________ State or local government ______________________
Public and private _______________________________ Expecting ________________________________________-.
Private..-.--...-...----------------------------- Public.-.--..-..-.-.-------.--------------------.
Not receiving or expecting ----________________________
r Excludes those with transitional awards. * Not computed because base less than 2,000.
Primary insurance amount (at 1970 levels) for those entitled to payable bene5ts
Older bene5ciaries
. 41 21 3 6 6 6 37 18 2 3 5 4 ---__-_____-----
100 100 100 100 100 100 100 100 100 100 100 100 ------__-----
47 34 45
% ti 2 :4" E
2 2 $1 : :: if
ii
2 _-*_____ --___-__ 59 ;i El 1; 6 1: 2: $1
(9 6 ; ::
': if '! 20 z : i 6 i I:)
(9 1 - _ _ - _ _ - -
i : : i A Qs $1 i z t
4 ('1 1 - _ - - _ _ -. 1 - - - - - - - -
; 2 -- _- P) -_-_.-
!- 15
1 -_-__--_ ____---- -.I’_‘--.. : :
1 __-___-_ (‘1 -____-__ ;
ND ------& 3; wm a; 6i
wsl w7, (‘i; (9 93 &Ii
; 65
All beneficiaries
42 24
--G----- 100 --
i: 2”:
3: 2;
:;
:
1%
1 :
pensions from private sources. Despite their low PIA levels, they are much more likely than the total group to have the comparatively lucrative Federal or railroad pensions.
CONCLUSION
Late claimants who have been awarded pay- able benefits constitute four-fifths of all late claimants. Any attempt to understand their late entitlement to retired-worker benefits must be guided by the crucial differences observed in economic status. When classified by economic status-as indicated by the relation of PIA and second-pension status-only a few notable differ- ences can be observed, mostly in,terms of second- pension status (tables 12 and 13). In comparison with persons having second pensions, those with- out second pensions are more likely to include
103 38 103 73 ----
100 100 100 100 ----
g” - : : :: 1
i : 4” ‘i
t ! i :, : 1 1 4
';I
bi I:,
(9 2 (9 4
-----___
'"'93 92 t :
91
a u.5 percent or less. 4 Includes a small proportion with military retirement pension.
63
100
individuals with minimal education, members of minority races, and persons who became entitled to hospital benefits 2 or more years before they claimed retired-worker benefits. These distinc- tions, without a more clearly defined context, cannot readily, or perhaps even usefully, be re- lated to the reasons for late entitlement. When the implications of the key differences in eco- nomic status are elaborated, however, the causes of late entitlement are made clearer.
One-third of the late claimants with payable benefits have second pensions, and therefore, though most of them have low PIA’s, they are not likely to be included among the depressed and poverty-stricken of the country ; they may have health and other problems but they are also likely to have the resources to compensate. Most of these beneficiaries do not suffer the disadvan- tages stemming from illiteracy. Moreover, their working lives have provided reasonable security,
BULLETIN, JULY 1973 15

TABLE lZ-Selected characteristics, by second-pension status, sex, and primary insurance amount for older beneficiaries entitled to payable benefits: Percentage distribution of persons initially entitled to retired-worker benefits, July 196%June 1970 awards
I Primary insurance amount (at 1970 levels) for those entitled to payable beneEts -
.- No second pension With second pension 1
Characteristic T T Men Women Women 7- -7 -
. $ 01
--
--
--
-
64.00- 79.90
10
80.00- : mart
12
Total
31
$30.00- jr more
14
Total
20
$50.01 ir mon rota1 tso.oo
I more Total
--
-- --
-.
-
Total number (in thousands) _________________.___ 22
Total percent...------.-------------------------- 100 100 100 100
73 27 1
46
:t 25 9
41 69
Race: ~~:~-.:--:----------------------------------------
_- _- ____----________-_______________________ ;: Other....-..-....-..------------------------------- 4
Education: Less than 6 years ___________ 2 _______________________ Less than 3 years ___________________________________ i: 8 years..--.-..--.--..------------------------------ 1; Less than 12 years __________________________________ ~~~~~i~-y~~::~~:~~:~:::::::::::::~:~:~:::~~::~~:~ ::::
! ltlyears or more.--..-..-...--..-------------------- Not reportlng on education _________________________
1;
Work limitations: Nolimitations....-....-..-.-.--...---------------- With limitations ___________________________________
Cannot work _____________________________________ Can work-..--.---.-..---------------------------
Not reporting on IimitatIons _______________________ Employment status:
Ernployed.-.....-.-.------------------------------ Not employed ______________________________________
1 Includes those receiving or expecting second pensions. z 0.5 percent of less.
position at retirement, are their ability to work and the rate of their continued employment after becoming entitled. These points lead to the con- clusion that for persons with second pensions a major factor in their late entitlement mas un- willingness to commit themselves in any way to retirement until they were ready to retire from work either fully or partly. For them, earlier entitlement, even to postponed awards, may have carried with it unwanted implications of their coming to an end of their effective, active lives and the acceptance of the condition of being old before they needed to do so. For older benefi- ciaries with second pensions, one motivating force behind late entitlement appears to be the association of social security benefits with retire- ment into old age.
Two-thirds of the late claimants with payable benefits have no second pensions: only one-eighth of those without second pensions have PIA’s of $150 or more and more than one-half have low PIA’s. With other sources of income excluded, what emerges is the picture of a population that for the most part is, and problably has been for some years, economically pressed if not in actual penury. Many had been dependent upon low paid or ,unsteady work or both-situations that imply
continuity, and probably also a context that would militate against the sense of isolation and any overwhelming lack of incentive.
For many of them, late entitlement was likely to have resulted from their need or desire to earn quarters of coverage to secure hospital or retirement benefits or both after retiring from Federal or other jobs not covered by the social security program. The work undertaken-to earn quarters of coverage may have interested them or entailed a commitment on their part to achieve a particular goal, so that they worked beyond the point at which they had acquired sufficient quar- ters for fully insured status. Those with private pensions may have continued working also out of interest, other type of commitment, or to secure a pension based on some set minimum number of years with the firm. For them, entitlement to social security benefits may not have been a pressing matter.
As noted before, many had still to earn quar- ters of coverage for fully insured status. For these persons, late entitlement must be consid- ered not so much as entitlement of the elderly but rather as entitlement delayed by active and fully employed persons. Of particular interest, in view of their age and relatively secure financial
16 SOCIAL SECURITY
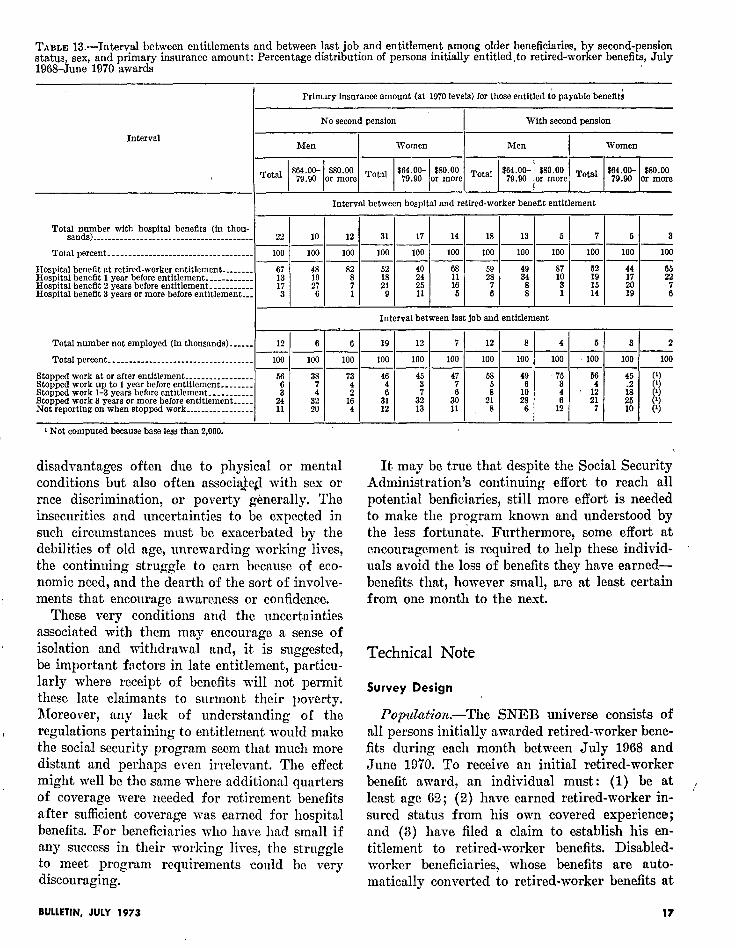
TABLE 13.-Interval between entitlements and between last job and entitlement among older beneficiaries, by second-pension status, sex, and primary insurance amount: Percentage distribution of persons initially entitled,to retired-worker benefits, July 196%June 1970 awards
Primary insurance amount (at 1970 levels) for those entitled tb payable benefit;
Interval
Interval between hospital and retired-worker benoflt entitlement
Total number with hospital benefits (in thou- sands)....-------.--------.--------.---------- 22 10 12 31 17 14 18 13 6 7 6 3
ypp-___------ Total percent.-.--------------------------------- 100 100 100 100 100 100 100 100 100 100 100 100
----------- Hospital beneflt at retired-worker entitlement-.------ 67 Hospital benefit 1 year before entitlement ____________
Hospital benefit 2 years before entitlement.----------
;; 48 82 52 :: 68 69 2 87 62 44 65
8 ;: 28 ‘i :i 2 22
Hospital benefit 3 years or more before entitlement.-- 3 7 25 8’ f3 i 1 9 11 1 14 19
I Interval betmreen last job and entitlement
Total number not employed (in thousands)-.-... 12 6 6 19 12 7 12 8 4 S 3 2 ------------
Total percent ____________________________________ 100 100 100 100 100 100 100 100 100 ” 100 100 100 ---___--------
Stopped work at or after entitlement _________________ Stopped work up to 1 year before entitlement..------ 5; 38 73 46 45 ‘i 66 2 I:] 4’ t i
3 “: “i 49 6
Stopped work l-3 years before entitlement ___________ Stopped work 3 years or more before entitlemenLv.-
Not reporting on when stopwd work ___._____________ ;y
’ ii 16 31 : ;;
4 12 12 7
1 Not computed because base less than 2,000.
disadvantages often due to physical or mental conditions but also often nssociaiegl with sex or race discrimination, or poverty generally. The insecurities and uncertaint.ies to be expected in such circumstances must be exacerbated by the debilities of old age, unrewarding working lives, the continuing struggle to earn because of eco- nomic need, and the dearth of the sort of involve- ments that encourage awareness or confidence.
These very conditions and the uncert,ainties associated with them may encourage a sense of isolation and withdrawal and, it is suggested, be important factors in late entitlement, particu- larly where receipt of benefits will not permit these late claimants to surmont their poverty. Moreover, any lack of understanding of the regulations pertaining to entitlement would make the social security program seem that much more distant and perhaps even irrelevant. The effect might well be the same where additional quarters of coverage were needed for retirement benefits after sufficient coverage Tvas earned for hospital benefits. For beneficiaries who have had small if any success in their working lives, the struggle to meet program requirements could be very discouraging.
It, may be true that despite the Social Security Administration’s continuing effort to reach all potential benficiaries, still more effort is needed to make the program known and understood by the less fortunate. Furthermore, some effort at encouragement is required to help these individ- uals avoid the loss of benefits they have earned- benefits that, however small, are at least certain from one month to the next.
Technical Note
Survey Design
Population.-The SNEB universe consists of all persons initially awarded retired-worker bene- fits during each month between July 1968 and June 1970. To receive an initial retired-worker benefit award, an individual must : (1) be at ! least age 62 ; (2) have earned retired-worker in- sured status from his own covered experience; and (3) have filed a claim to establish his en- titlement to retired-worker benefits. Disabled- worker beneficiaries, whose benefits are auto- matically converted to retired-worker benefits at
BULLETIN, JULY 1973 17

age 65, as well as persons entitled to.special age- 72 monthly cash payments, are excluded from the SNEB universe.
These three mailings yielded about a 75-percent response. The second and third mailings were omitted for the December 1969 sample to avoid overlap with the 1970 decennial census.
Sampb design.-The sample for SNEB was selected by means of a two-stage design. The first stage was the selection of a single primary samp- ling unit (PSU) from each of 100 strata by appropriate probability procedures. The selection of the PSU’s was made by the Bureau of the Census as one of several combinations of the basic 35’7 PSU designs l of the Current Popula- tion Survey. Each PSU comprises a single county or group of counties (town or group of towns in the New England States). Twenty-one of the PSU’s used in the first stage consist of the coun- ties comprising the 21 largest metropolitan areas. Each of these,self-representing PSU’s is identical to its stratum. The remaining metropolitan areas were grouped in 33 strata, and one PSU (a single metropolitan area) was selected from each stratum. Remaining counties not in metropolitan areas were grouped into 46 strata, and one PSU was selected to represent each such stratum.
Starting with July 1969, mail responses were screened clerically for completeness of response to income questions. About two-thirds of the incomplete income reports were rectified by tele- phone follow-up. The remainder were included in the personal interview follow-up. This follow- up was conducted at the end of each calendar quarter: It included, in addition to all respond- ents whose incomplete income reports were not corrected by telephone, a 50-percent random sam- ple of persons who did not return the question- naires or whose questionnaires were returned by the post office as undeliverable. (For the De- cember 1969 sample, only a 25-percent random sample of nonrespondents was selected for per- sonal interview.) Nonresponse cases selected for personal interview were weighted to include cases not chosen for the follow-up sample.
The second stage of the sampling process was the monthly selection of new beneficiaries to whom questionnaires would be mailed. These are individuals who had been awarded retired- worker benefits for the first time during the preceding month and who resided in a sample PSU.
Sample size.-The size of the SNEB sample was originally set at about 3,200 cases per month, or 1 in 27 of the persons receiving retired-worker benefit awards each month. From July through December 1969 the sample was reduced to about 1,500 cases per month.
* Noninterview adjustment.-The personal inter- view follow-up produced an effective responsd rate of about 92 percent for the July 1968Jund. 1970 period, after allowing for the weighting of the follow-up cases (table I). To meet the min- imum acceptance criteria for an adequate re- sponse, the person had to indicate his employ- ment status. If he was not employed, he had to give a reason why he left his former job. The 8 percent who did not provide an adequate re-
TABLE I.-Response before and after personal interview follow-up, July 1968June 1970 1
T
Status of the questionnaire
Before personal interview
follow-up ’
After personal interview follow-up a
Data collection.-Questionnaires were mailed to persons in the sample by the end of the month following their benefit awards. A second ques- tionnaire was mailed to those persons who did not respond to the first mailing within 2 weeks. A third questionnaire was sent by certified mail to those who did not respond within 4 weeks.
‘iit? Per- cent
--
Total sample ____________________---.
Questionnaires with adequate response... Questionneires without adequate re-
sponse. _____--_----_--___-----------. Undeliverable. ________________________ Deceased-.--...-.--.-----------------. Refusal ________________________ _______. Failed quahty check.-. _______________. Miscellaneous. ____________________---.
Questionmures not returned ____________.
70,661 100 __- 54,339 77
4,;;; 6 1
466 (‘1 1,472 1,197 i
“‘17
“h:?- Per- cent.
--
70,661 100
64,695 92
5,436 8 153 670
4,:;; IS 6
4”s:
1 For details on th’e Current Population Survey samp- ling procedures, a description of PSU’s stratification, and selection of first-stage units, see the Bureau of the Census, The Current Population Suruc~--A Report of Methodology, Technical Paper h’umher 7.
1 Doei not reflect telephone and personal interview follow-up of inadequate income response for the sznple period July-December 1969.
* After B maximum of three mailings for all months except December 1969, for which there was a single maihng.
8 Undeliverable and nonresponse sample cases are weighted to include cases not chosen for the follow-up sample.
4 Less than 0.5 percent.
18 SOCIAL SECURITY

sponse include 6 percent who refused to partici- pate in the survey.
In order to represent the nonrespondents, the originally assigned weights were adjusted by multiplying them by the reciprocal of the re- sponse ratio. To allow for possible variation in response rates, this adjustment was made for 12 sex, residence, age-at-entitlement, and pay- ment-status groups separately for each calendar quarter of data. -
Sampling Variability
Since the SNEB estimates are based on a sam- ple, they may differ from the figures that would have been obtained if every person initially awarded retired-worker benefits from July 1968 to June 1970 were included in the survey. In this survey, as in others, the results are also subject to errors due to response and nonreporting.
The standard error measures the sampling variability of estimates-that is, the variations that occur by chance simply because a sample of the population rather than the population as a whole is surveyed. The chances are about 68 out of 100 that an estimate from the sample would differ by less than the standard error from the results based on the same procedures for the entire population. The chances are about 95 out of 100 that the differences would be less than twice the standard error.
Estimated percentages.-A measure of preci- sion for an estimated percentage is provided by a confidence interval. For example, the values that lie two standard errors above and below the estimated percentage form a 95-percent confi- dence interval. The population value of interest is said to lie within this interval with 95-percent confidence.
The standard error of an estimated percentage depends on the size of the percentage and the size of its base. Table II presents rough approxi- mations of standard errors of estimated percent- ages for the entire period of the SNEB. Linear interpolation applied to the base or the percent- age or both may be used to calculate the value of a standard error not specifically shown. For example :
In table 5, of the 15,000 men with postponed bene- fits (among the older beneficiaries) 13 percent had
finished high school. From table II, the approximate standard error is 2.1 percent. With 95percent con- fidence we say that the proportion of older men with postponed benefits who finished high school is be- tween 8.8 and 17.2 percent.
Differences between two independent percent- ages.-Before reporting that two percentages are in fact different, some measure of assurance that this conclusion is correci is needed. Generally, the conclusion that there is a difference will be drawn if it can be done with 95-percent confi- dence. It is understood that such a conclusion may be wrong only about 5 percent of the time. To compare two independent percentages to de- termine if the difference between them is statis- tically significant, the standard error of the difference is estimated by taking the square root of the sum of the squares of the standard error of each of the percentages. For example:
In table 5, among older beneficiaries with postponed benefits, 23 percent of the 8,000 women finished high school and 13 percent of the 15,000 men did so. The approximate standard errors of the two per- centages are, respectively, 3.5 percent and 2.1 per- cent. The sum of th#e squares of the two standard errors is 16.66, and the square root is 4.08, which is the standard error of the difference. The percentage- point difference between the proportions of older men and women who finished high school is 10 percent. Since this is greater than twice the stand- ard error of the difference, it is concluded with 95-percent confidence that the two proportions are different.
Editing for age at entitlement.-The pro- portion of respondents who became entitled to social security benefits at age 66 or later is small. To provide larger bases for estimation, data for those persons who were aged 66 or older at en- titlement in each of the four SNEB sample periods were combined. The editing procedures
TABLE II.-Approximations of standard errors of estimated percentages for the total SNEB sample, July 1968AJune 1970
Estimated percentages
2,000 _____._____ 2.4 3.7 3,000 __--_-_____ 4,000 ___________ :*; 6,000. _._-.._.__ 1:6 10,000 . . . . . .._._ 1.1 25,000 _______.__ :*i 50,000 ..-_._..__
:: :7
100,000 _--._____ .3 .5
290,000 __..._.__ 300,000 __-______ :i ::
BULLETIN, JULY 1973 19

employed resulted in two minor changes in SNEB data. One change relates to the original decisions on how to divide the SNEB population by payment status at award and the other to a minor error in the editing of the data to show age at entitlement.
First, with respect to the decision on how to divide the population, all those with full post- poned awards were included in one group regard- less of age at entitlement, since the vast majority were aged 65 at entitlement. Therefore, for this report, tiersons with full postponed awards at age 66 or later had then to be culled from the group of all with postponed awards. Those with full postponed awards constitute about one-third of all beneficiaries; of this group, only about 3 percent were aged 66 or older at entitlement.
The second point relates to a change in the original SNEB specifications for age at entitle-
ment, the object of which had been to distinguish beneficiaries entitled to payable benefits at age 65 from those entitled to payable benefits at age 66 or later. The original editing ignored the small group of beneficiaries aged 64 years and 11 months who were born on the first of the month. This group was left with those aged 66 or older at entitlement when they should have been in- cluded with those entitled at age 65. Entitlement in the preceding month for those born on the first of the month-that is, entitlement with the age group that is 1 calendar month older-is established administrative procedure (section 2306 of the 1969 edition of the Social Security Handbook). Correcting this error reduced the number of persons entitled to payable benefits at age 66 or later, in favor of those entitled at age 65, by about 6 percent or approximately 5,000 persons for all four SNEB sample periods.
20 SOCIAL SECURITY