Embed Size (px)
Citation preview
UNLV Theses, Dissertations, Professional Papers, and Capstones
May 2017
Late Cretaceous Extensional Collapse of the Southern Cordillera: Late Cretaceous Extensional Collapse of the Southern Cordillera:
Evidence from the Bristol and Granite Mountains, SE California Evidence from the Bristol and Granite Mountains, SE California
Lee Hess University of Nevada, Las Vegas
Follow this and additional works at: https://digitalscholarship.unlv.edu/thesesdissertations
Part of the Geology Commons
Repository Citation Repository Citation Hess, Lee, "Late Cretaceous Extensional Collapse of the Southern Cordillera: Evidence from the Bristol and Granite Mountains, SE California" (2017). UNLV Theses, Dissertations, Professional Papers, and Capstones. 2984. http://dx.doi.org/10.34917/10985930
This Thesis is protected by copyright and/or related rights. It has been brought to you by Digital Scholarship@UNLV with permission from the rights-holder(s). You are free to use this Thesis in any way that is permitted by the copyright and related rights legislation that applies to your use. For other uses you need to obtain permission from the rights-holder(s) directly, unless additional rights are indicated by a Creative Commons license in the record and/or on the work itself. This Thesis has been accepted for inclusion in UNLV Theses, Dissertations, Professional Papers, and Capstones by an authorized administrator of Digital Scholarship@UNLV. For more information, please contact [email protected].
LATE CRETACEOUS EXTENSIONAL COLLAPSE OF THE
SOUTHERN CORDILLERA: EVIDENCE FROM THE BRISTOL
AND GRANITE MOUNTAINS, SE CALIFORNIA
By
Lee T. Hess
B.S. - Geology Idaho State University
2011
A thesis submitted in partial fulfillment of the requirements for the
Master of Science - Geology
Department of Geosciences College of Sciences
The Graduate College
University of Nevada, Las Vegas May 2017

ii
Copyright 2017 by Lee Thomas Hess
All Rights Reserved
ii
Thesis Approval
The Graduate College
The University of Nevada, Las Vegas
May 24, 2017
This thesis prepared by
Lee T. Hess
entitled
Late Cretaceous Extensional Collapse of the Southern Cordillera: Evidence from the
Bristol and Granite Mountains, SE California
is approved in partial fulfillment of the requirements for the degree of
Master of Science – Geology
Department of Geosciences
Michael L. Wells, Ph.D. Kathryn Hausbeck Korgan, Ph.D. Examination Committee Chair Graduate College Interim Dean
Terry Spell, Ph.D. Examination Committee Member
Wanda Taylor, Ph.D. Examination Committee Member
Dave Miller, Ph.D. Examination Committee Member
Dennis Bazylinski, Ph.D. Graduate College Faculty Representative
iii
ABSTRACT
Demonstrating the regional extent of Late Cretaceous extensional collapse of western
North America’s southern Cordillera is important to understanding the tectonic evolution of the
Sevier-Laramide orogens, and the geodynamics of ancient and modern orogens and
synconvergent extension. Documenting Late Cretaceous extension in the southern Cordillera
requires looking through the extensive overprint by Cenozoic structures. Late Cretaceous
extension in the eastern Mojave region has been inferred from geochronology and
thermochronology studies, which document Late Cretaceous cooling of Mesozoic granitoid rocks,
some of which were emplaced in the middle crust. Cooling histories from these rocks have also
been interpreted to be a result of lithospheric refrigeration, as well as erosional exhumation during
the Laramide. New data from this study, combined with results from other studies, demonstrate
that Late Cretaceous extension and exhumation of mid-crustal rocks was a major event in the
southern Cordillera. A newly described (herein) mylonitic shear zone in the Bristol Mountains
records a top-to-the-SW, down-dip, non-coaxial sense of shear. Furthermore, microstructural
analysis indicates the shear zone recorded deformation temperatures at upper greenschist to lower
amphibolite conditions (~350 to ~550 ˚C). Low-temperature overprint suggests progressive
denudation of the shear zone into shallow crustal levels. U/Pb geochronology and 40Ar/39Ar
thermochronology demonstrate that Cretaceous plutons were emplaced at ~75 Ma and cooled
below K-feldspar MDD small domain closure temperatures by ~65 Ma. MDD modeling of K-
feldspar from plutonic rocks show that following ductile shearing and rapid cooling, rocks
continued to cool at rates of ~22 ˚C/m.y (footwall) and ~16 ˚C/m.y. (shear zone) Mylonitic
deformation in the Bristol Mountains is bracketed from ~75 Ma to 65 Ma. Kinematic indicators
from the Granite Mountains shear zones show a top-to-the-NW, down-dip, non-coaxial sense of
iv
shear. Distinct banding of dynamically recrystallized quartz and feldspar suggests the shear zone
recorded deformation temperatures in the lower amphibolite facies (~400 to ~600˚C).
Furthermore, U/Pb geochronology and 40Ar/39Ar thermochronology indicate that Cretaceous
plutons were emplaced from ~80 Ma to ~75 Ma and were rapidly cooled through K-feldspar MDD
closure temperatures by ~66 Ma. MDD modeling of K-feldpsar, within the footwall, suggest
that Cretaceous plutons cooled at rates ranging from ~16 to 67 ˚C/m.y. Mylonitic deformation
in the Granite Mountains is bracketed from ~80 Ma to 66 Ma. Data from the Bristol and Granite
mountains indicate ductile shear zones unequivocally document extensional collapse of the Sevier
retroarc in the Late Cretaceous. We advocate the removal of the North American lithospheric
mantle as the root cause for synconvergent extension in the southern Cordillera as it best fits the
geologic constraints. The process of delamination is considered the most viable mechanism for
removal of the mantle lithosphere, leading to crustal anatexis, peraluminuous magmatism, and
extensional collapse of the southern Cordillera, which was synchronous with continued contraction
in the Sevier fold-thrust belt as well as the newly developed Laramide deformational belts.
v
ACKNOWLEDGMENTS Most of all I would like to thank Dr. Michael L. Wells for setting me up with this amazing
project. His resources have made everything here possible and his patience for my many myopic
questions and the sharing of his vast knowledge is hugely appreciated. Dr. Wells has taught me
more about western North America Cordilleran geology than I ever thought possible. His
enthusiasm and excitement in the field has shaped me as the field geologist I am today. Also, I
owe a huge thanks to David M. Miller for taking time out of his busy schedule and serving on my
committee. His valuable insight on geology of the southern Cordillera has strengthened this
research project substantially. That said, all my committee members deserve a huge amount of
gratitude for their patience and attention to detail through the editing process.
Kathy Zanetti at the NIGL has helped me hugely in so many ways, without her and Dr.
Terry Spell this project would not have been possible. Also, Dr. Minghua Ren at the EMIL
deserves a gigantic thank you for helping me set-up and run the CL detector on the SEM, so we
could obtain publication-quality zircon images. I am also very grateful to Dr. Martin Wong from
Colgate University for helping figure out Multiple Domain Diffusion modeling, and showing me
Arvert, a Mac friendly modeling software. The lab technicians at the Arizona LaserChron lab at
the University of Arizona deserve acknowledgment for putting up with my many unintelligent
questions and late night foul-ups on the LA-ICP-MS.
Several field assistants I have employed over my project merit a huge thank you; Chris
Wing, Dr. Arya Udry, Chad Crotty, and Will Joseph you were great to have in the field, and were
great sports on the heinous hikes we endured. Dr. Arya Udry – you deserve the biggest thank you
of all! Lastly, I must give recognition to Red Rock Canyon and all the classic rocks climbs therein.
This place and all its greatness has let me grow as a person more than I would have ever imagined,
and has given me much mental support over the years of living in Las Vegas.
vi
TABLE OF CONTENTS ABSTRACT ……………………………………………………………………………………..iii ACKNOWLEDGMENTS………………………………………………………………….……..v LIST OF FIGURES……………………………………………………………………………...vii 1. INTRODUCTION……………………………………………………………………….……1 2. GEOLOGIC BACKGROUND………………………………………………..………………4
2.1 Sevier-Laramide Orogenies...…………………………...………………………………...4 2.2 Basin and Range Extension...……………………...……………………………………...8 2.3 Eastern California Shear Zone…...…………………………...………………………….10 2.4 Eastern Mojave Desert…………………………………………………………………...11
2.4.1 Granite and Bristol Mountains…………………………………………………...12 3. METHODS...………………………………………………………………………………...15
3.1 Sampling Approach……………………………………………………………………...15 3.2 Analytical Techniques…………………………………………………………………...16
3.2.1 Mineral Separation and Characterization………………………………………...16 3.2.2 U/Pb Zircon Geochronology……………………………………………………..18 3.2.3 40Ar/39Ar Thermochronology…………………………………………………….19 3.2.4 Structural Analysis…………………………………………………………….....21
4. RESULTS..…………………………………………………………………………………..22 4.1 Bull Canyon Fault – Mapping and Structural Analysis………………………………….22
4.1.1 Footwall Geology………………………………………………………………...26 4.1.2 Hanging Wall (Upper Plate) Geology……………………………………………30
4.2 Bristol Mountains………………………………………………………………………..30 4.2.1 Geologic Mapping……………………………………………………………….30 4.2.2 Mylonitic Shear Zone……………………………………………………………31
4.3 U/Pb Geochronology…………………………………………………………………….39 4.3.1 Bristol Mountains………………………………………………………………..39 4.3.2 Granite Mountains……………………………………………………………….40
4.4 Ar/Ar Thermochronology………………………………………………………………..47 4.4.1 Bristol Mountains………………………………………………………………..47 4.4.2 Granite Mountains……………………………………………………………….54
4.5 Reconstructed T-t profiles………………………………………………………………..60 4.5.1 Previous Results – Granite Mountains…………………………………………...64
5. SUMMARY AND DISCUSSION...………………………………………………...……….67 5.1 Mechanisms of Cooling in the Eastern Mojave Desert……………………...…………..67 5.2 Age of Extensional Deformation in the Granite Mountains………………………..……68
5.2.1 Miocene Inheritance of Late Cretaceous Fabric in the Granite Mountains…...…72 5.3 Age of Bristol Mountain Shear Zone………………………...…………………………..73 5.4 Tectonic Evolution and Displacement of the Bristol and Granite Mountains…………...76
5.4.1 Discrepancy between Shear Zone Geometries and Transport Directions...……..76 5.4.2 Temporal Kinematic Switch in Extension and Exhumation…………………….77
5.5 Late Cretaceous Unroofing in the East Mojave Desert……………………………….....81 5.6 Causative Mechanisms for Exhumation and a Collapsing Orogen in the Late
Cretaceous………………………………………………………………………………..82 6. CONCLUSION…………………………………………………………………….………...85
vii
APPENDIX A - U/Pb Geochronology Data Tables……………………………………………..86 APPENDIX B - 40Ar/39Ar Isotopic Analyses Result Tables…………………………………...110 REFERENCES…………………………………………………………………………………127 VITAE………………………………………………………………………………………….134
LIST OF FIGURES Figure 1. Simplified tectonic map of western North America…………….………………………5 Figure 2. (A) Simplified geologic map of southeastern California and Mojave Desert. Black box indicates location of Bristol and Granite. Modified from Wells et al. (2005). (B) Simplified geologic maps of the Bristol and Granite Mountains. ………….………………………..14 Figure 3. Geologic map and structural data for Granite Mountains and BCF……………………..24 Figure 4. Field pictures of the Bull Canyon Fault along the base of the Granite Mountains ……..25 Figure 5. Kinematic indicators from oriented thin sections from the Granite Mountains shear zone………………………………………………………………………………………27 Figure 6. Photomicrographs showing microstructures and deformation mechanisms from the Granite Mountains shear zone …………………………………………………………...29 Figure 7. Geologic map and structural data for the Bristol Mountains …………………………..32 Figure 8. Field picture of the Bristol Mountains, looking SSE …………………………………..33 Figure 9. Field photographs of mylonitic shear zone rocks in Bristol Mountains ………………34 Figure 10. Kinematic indicators from the Bristol Mountains shear zone ………………………..36 Figure 11. Deformation mechanisms from the Bristol Mountains shear zone ………………...…37 Figure 12. U/Pb zircon plots for the Bristol Mountains plutons …………………………………40 Figure 13. CL images of single zircon crystals from the Granite Mountains ……………………42 Figure 14. U/Pb zircon plots for the Granite Mountains plutons …………………………….44-45 Figure 15. 40Ar/39Ar apparent age spectra for biotite and muscovite from the Bristol Mountains …………………………………........................................................................................48 Figure 16. 40Ar/39Ar apparent age spectra for K-feldspar from the Bristol Mountains ………….50 Figure 17. MDD modeling results for sample BM16…………………………………………….52 Figure 18. MDD modeling results for sample BM18…………………………………………….53 Figure 19. 40Ar/39Ar apparent age spectrum for biotite and hornblende from the Granite Mountains ……………………………………………………………………………………………54 Figure 20. 40Ar/39Ar apparent age spectra for K-feldspar from the Granite Mountains …………56 Figure 21. MDD modeling results for sample GM7……………………………………………...58 Figure 22. MDD modeling results for sample GM6……………………………………………...59 Figure 23. Reconstructed T-t profiles for Late Cretaceous plutons in the Granite Mountains ….61 Figure 24. Reconstructed T-t profile for Late Cretaceous plutons in the Bristol Mountains.……62 Figure 25. Reconstructed T-t profiles for Late Cretaceous plutons and Jurassic leucocratic pluton from the Granite Mountains …………..………………………………………………….65 Figure 26. Apparent 40Ar/39Ar K-feldspar age spectra for Granite Mountains plutons ………….68 Figure 27. Synoptic diagram showing reconstructed temperature-time profiles for samples transecting the Granite Mountains from SE to NW, coupled with deformation temperatures from microstructures …………………………………………………………………….70

viii
Figure 28. Synoptic diagram showing reconstructed temperature-time profiles for rocks in the Bristol Mountains coupled with deformation temperatures from microstructures ……………………………………………………………………………………………73 Figure 29. Proposed tectonic model for the development and evolution of the Bristol and Granite Mountains ………………………………………………………………………………..78 Figure 30. Simplified tectonic illustration showing removal of the lithospheric mantle beneath the North American plate via delamination…………………………………………………..83
1
1. INTRODUCTION
Late Cretaceous orogenic collapse and exhumation of mid-to-lower crustal rocks have been
recognized along the retroarc of the Sevier orogenic belt, but its geographic distribution and causes
are still poorly understood due to overprinting by mid-Cenozoic structures, alternative mechanisms
proposed to explain Late Cretaceous cooling ages, and a variety of potential geodynamic drivers
(Carl et al., 1991; Dumitru et al., 1991; Hodges and Walker, 1992; George and Dokka, 1994;
Applegate and Hodges, 1995; Saleeby, 2003; Wells et al., 2005; Wells and Hoisch, 2008; Wells et
al., 2012) (Figure 1). Understanding the cause, extent, and timing of synorogenic extension,
exhumation, and cooling of mid-crustal rocks in the southern Cordillera is the focus of this study.
Several mechanisms have been invoked to explain Late Cretaceous cooling ages across the eastern
(Foster et al., 1992; Wells and Hoisch, 2008), western Mojave Desert (Miller and Morton, 1980;
Jacobson, 1990) and adjacent arc (George and Dokka, 1994; Grove et al., 2003a; Saleeby et al.,
2007). These include: erosional exhumation (George and Dokka, 1994; Grove et al., 2003a),
refrigeration of the North American lithosphere (Dumitru et al., 1991), and gravity-driven
extensional collapse (Hodges and Walker, 1992; Saleeby, 2003; Wells et al., 2005; Wells and
Hoisch, 2008). Rapid cooling of mid-crustal peraluminous granitoid rocks has been documented
across the eastern Mojave region, from the Old Woman Mountains in the south to the New York
Mountains to the north, and is interpreted as being a result of extensional exhumation (Foster et
al., 1989; Foster et al., 1992; McCaffrey et al., 1999; Beyene, 2000; Kula, 2002; Wells et al., 2002;
Wells et al., 2005), although structures of Late Cretaceous age are cryptic. Additionally, George
and Dokka (1994) and Grove and others (2003a) document rapid cooling of the southern magmatic
arc region in the Peninsular Ranges, which they attribute to uplift during Laramide tectonics and
subsequent erosional exhumation. Saleeby (2003) has
2
proposed that cooling and upper-plate extension in the southern Sierra Nevada batholith and adjacent
western Mojave region resulted from underthrusting of schists due to Laramide flat-slab subduction
and slab segmentation. Furthermore, Dumitru et al. (1991) suggested there is no need for extension
or exhumation to explain the cooling ages in the southern Cordillera, and concluded that lithospheric
refrigeration of the North American plate is a plausible explanation for the observed cooling ages.
Lithospheric refrigeration is interpreted to be a result of replacing hot asthenosphere beneath the
North American plate with a cold oceanic plate. Detailed studies linking footwall thermochronology
to geologic structures are needed to further resolve the extent and driving mechanisms for Late
Cretaceous synconvergent extension.
The cause and extent of synconvergent extension in the Late Cretaceous, which led to the
initial piecemeal collapse of the Sevier retroarc, is debated among researchers. Extension in the
Late Cretaceous was synchronous with active shortening along the Sevier fold-thrust belt (SFTB) of
Utah, Idaho, and Wyoming, as well as the nascent Laramide province. The southern SFTB was
effectively inactive by ~90 Ma, and is broadly coincident with the cessation of arc magmatism
(DeCelles et al., 2009, DeCelles and Graham, 2015). Although it is recognized that synconvergent
extension is partly caused by lateral gradients in gravitational buoyancy forces stored within the
lithosphere, resulting from horizontal gradients in crustal thickness, density and topography (e.g.,
Jones et al., 1998; Sonder and Jones, 1999), the mechanisms giving rise to an increase in
gravitational potential energy and the role of rheological weakening are debated. Increases in
buoyancy forces can be driven by several mechanisms, e.g., crustal thickening and uplift during
orogenesis including underplating in the interior of orogenic wedges (Platt, 1986; Molnar and
Chen, 1988), delamination of a dense lithospheric root from the overriding plate causing isostatic
rebound (Houseman et al., 1981; England and Houseman, 1989) or similarly, subduction erosion
3
of dense lithosphere during low-angle subduction (Saleeby, 2003; Liu et al., 2010). Although
gravitational forces are important as driving forces for extension, the mechanisms that produce
environments where gravitational forces exceed horizontal compressional forces and crustal
strength are not fully understood.
The Granite and Bristol mountains are plutonic complexes comprised of mid-crustal Jurassic
and Cretaceous granitoid rocks, located near the southern end of the Sevier orogenic belt in
southeast California (Figures 1 & 2). The Granite and Bristol mountains lie within the Mojave Block
and Laramide deformational corridor in southern California, an area greatly affected by subduction
erosion, schist underplating, Cenozoic extension, and dextral shearing associated with the Eastern
California shear zone. Previous geobarometry and thermochronology studies in the Granite
Mountains indicate mid-crustal (4.5 kbar) crystallization of Late Cretaceous granites followed by
rapid cooling to temperatures below ~150 ˚C during the Late Cretaceous which was attributed
to extensional exhumation (Kula, 2002). However, extensional structures responsible for the Late
Cretaceous exhumation were not previously identified (Kula, 2002). The only documented structure
responsible for exhumation is the Neogene Bull Canyon Fault (BCF), which wraps around the
northwestern margin of the range and dips ~40˚ to the NW with brittle striae trending to the NW
(Howard et al., 1987, this study). The age of the BCF is poorly constrained by geological
relationships, with the fault apparently cutting Quaternary-Tertiary gravels and Tertiary mega breccia
in the hanging wall (Howard et al., 1987; Miller et al., 1992). The BCF is demarked by well-
developed cataclastic to ultracataclastic rocks and associated highly fractured and cleaved Jurassic
diorite and granite (Howard et al., 1987).
This research will present new geologic mapping, structural orientation data, microstructural
analysis, geochronology, and thermochronology from the Bristol and Granite mountains of the
4
Mojave Desert in southeast California. These data show that the rapid cooling of mid- crustal plutons
in the Bristol and Granite mountains was a result of unroofing by extensional shearing in mylonitic
rocks and record a Late Cretaceous unroofing event responsible for partial exhumation of plutonic
rocks. Furthermore, results from the Bristol Mountains constrain the geometry, kinematics, and age
of a previously undocumented shear zone. Mapping of the BCF in the Granite Mountains shows that
Cenozo ic detachment faulting reactivated a Late Cretaceous extensional shear zone, and excised,
overprinted, and/or displaced most evidence for Late Cretaceous extension. The discontinuous
mylonitic belt in the footwall of the BCF is interpreted to be the base of the structure(s) responsible
for Late Cretaceous cooling and unroofing in the Granite Mountains, first recognized by Kula (2002).
Data from the Bristol and Granite mountains are consistent with other Late Cretaceous cooling
signatures in the Mojave Desert, as well as the Great Basin. Therefore, these observations are most
consistent with a single orogen-wide mechanism that explains Late Cretaceous rapid cooling and
exhumation. Although erosional exhumation and lithospheric refrigeration may be locally important,
following Wells and Hoisch (2008), we hypothesis that the cause of extension along the axis of the
earlier contractionally thickened lithosphere is widespread delamination of a dense lithospheric root
from the North American plate at ~75 Ma, which subsequently caused isostatic uplift of the orogen
and gravity-driven collapse. Demonstrating extensional structures of Late Cretaceous age is
fundamental to understanding the geodynamics of synconvergent extension and, furthermore, the
incipient collapse of the North American Cordillera.
2. GEOLOGIC BACKGROUND
2.1 Sevier-Laramide Orogenies
5
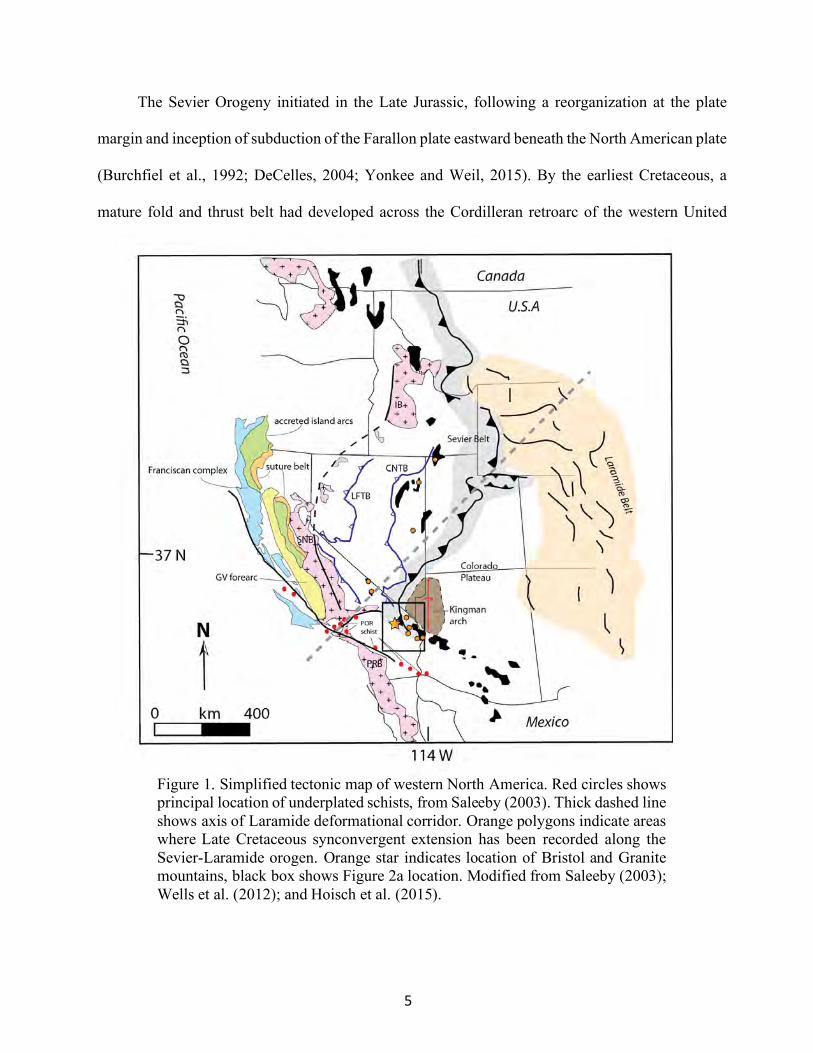
The Sevier Orogeny initiated in the Late Jurassic, following a reorganization at the plate
margin and inception of subduction of the Farallon plate eastward beneath the North American plate
(Burchfiel et al., 1992; DeCelles, 2004; Yonkee and Weil, 2015). By the earliest Cretaceous, a
mature fold and thrust belt had developed across the Cordilleran retroarc of the western United
Figure 1. Simplified tectonic map of western North America. Red circles shows principal location of underplated schists, from Saleeby (2003). Thick dashed line shows axis of Laramide deformational corridor. Orange polygons indicate areas where Late Cretaceous synconvergent extension has been recorded along the Sevier-Laramide orogen. Orange star indicates location of Bristol and Granite mountains, black box shows Figure 2a location. Modified from Saleeby (2003); Wells et al. (2012); and Hoisch et al. (2015).
6
States and Canada (Figure 1) (Burchfiel et al., 1992; DeCelles, 2004; Yonkee and Weil, 2015).
Continued contraction and thickening of continental crust eventually led to an unstable orogen and
by the Late Cretaceous, incipient extensional collapse was taking place, resulting in the rapid
exhumation of mid-crustal rocks in the Sevier retroarc (Hodges and Walker, 1992; Miller et al.,
1995; Wells et al., 2005; Wells and Hoisch, 2008; Wells et al., 2012). It is hypothesized that
collapse of the Sevier orogen is partially due to the development of a dense root beneath the North
American continent, which delaminated from the lithospheric mantle causing an isostatic response
and uplift of a high orogenic plateau (Coney and Harms, 1984; DeCelles, 2004; Wells et al., 2005;
Wells and Hoisch, 2008; Druschke et al., 2011; Ernst, 2010; Snell et al., 2013). The high plateau
became gravitationally unstable, leading to internal extensional deformation (Jones et al., 1998;
Sonders and Jones, 1999; Wells and Hoisch, 2008; DeCelles et al., 2009; Wells et al., 2012). The
Sevier fold-thrust belt and associated Mesozoic intrusive rocks intersect within the Mojave
Desert, where the Proterozoic-Paleozoic passive margin sedimentary wedge was crosscut by the
Mesozoic magmatic arc.
At approximately 80 Ma, the Farallon plate began to change geometry to flat-slab
subduction, marking the transition to the Laramide orogeny, which is characterized by thick-
skinned deformation. An increase in convergence rate and subduction of a more buoyant oceanic
plateau – a counterpart or conjugate to the Hess-Shatsky rise (Livaccari et al., 1981; Henderson et
al., 1984; Barth and Scheiderman; 1996; Saleeby, 2003; Liu et al., 2008; Liu et al., 2010) – led to a
shallowing in the subduction angle of the Farallon plate. Laramide deformation is demarked by
basement cored uplifted arches which are separated by broad basins (Yonkee and Weil, 2015),
which extends from southern Montana to northern Arizona and New Mexico, defining a
deformational belt much further inland than the SFTB. The change to Laramide style deformation
effectively shut-off asthenospheric flow beneath the western margin of the North American plate,
7
leading to a cessation in arc magmatism in the Sierra Nevada and Mojave region (Saleeby, 2003).
Laramide tectonics in the Mojave region also led to underthrusting of schists with Franciscan
affinities, westward impingement of the arc by top-W thrusting and large scale detachment faulting,
which produced a highly oblique tilted crustal section with ~9 kbar rocks exhumed in the
southernmost Sierra Batholith (Saleeby, 2003). Cooling ages of underplated schists vary from older
(~88 Ma) in the west to younger (~67 Ma) in the east (Saleeby et al., 2007). Additionally, detrital
zircon ages of the Franciscan-type sediments follow a similar spatial pattern (Jacobson and Dawson,
1995; Jacobson et al., 1996; Grove et al., 2003; Jacobson et al., 2011). Detrital as well as cooling
ages farther east, specifically in western Arizona, are much younger (~60 Ma) than ages observed
in plutonic rocks across eastern Mojave Desert (Jacobson et al., 1988; Jacobson, 1990; Jacobson
and Dawson, 1995; Jacobson et al., 1996; Grove et al., 2003; Jacobson et al., 2011). This
observation further contradicts the idea of a refrigeration effect being responsible for cooling of
crustal rocks across the Mojave Desert - schists were underplated after the cooling event recorded
in the Mojave, which requires cooling caused by extensional and erosional exhumation. Basal
traction and end-loading of the North American plate propagated deformation inboard from the plate
margin for ~1,500 km, disrupting the Sevier foreland (Saleeby, 2003; Yonkee and Weil, 2015)
(Figure 1). Furthermore, as the more buoyant subducted large igneous province (LIP) propagated
eastward, dynamic topographic responses are predicted from geodynamic modeling to have
occurred at both the leading and trailing end of the LIP, causing initial subsidence followed by
uplift (Liu et al., 2010). The Kingman arch of southern Nevada and northwestern Arizona is an
uplift of Laramide age (Beard and Faulds, 2010) that led to a highland in the southern Cordillera,
east of the Sevier FTB (Figure 1). Paleozoic and Mesozoic rocks were subsequently eroded and
deposited along the
8
Colorado Plateau in Late Cretaceous-Eocene time, with remnant deposits represented in the “rim
gravels” (e.g., Young and Hartman, 2014). The signature unconformity throughout the Kingman
arch is Proterozoic basement rocks overlain by Miocene sedimentary and volcanic rocks (Faulds et
al., 2001). Beard and Faulds (2010) postulate that uplift of the Kingman arch postdates intrusion of 70
Ma peraluminous granites in the region. Evidence of the high Kingman arch in the Late Cretaceous
– early Palaeocene and subsequent stripping suggests erosion of the southern Cordillera was likely
a significant contributor to exhumation post-70 Ma.
2.2 Basin and Range Extension
The Laramide orogeny persisted until ~50 Ma when post-orogenic collapse of
structural highlands and areas of gravitationally instability initiated. Eocene post-orogenic collapse
of the North American Cordillera is partly due to the Farallon plate “peeling away” from the
North American plate, allowing compressional forces to relax and gravitational potential energy
stored in the crustal welt to drive extension (Humphreys, 1995; Sonder and Jones, 1999). The
Cordilleran contractional belt began orogenic collapse immediately following Laramide
deformation, with a time-gap of ~ 1-5 m.y., and is partly coeval with the development of the
Cordilleran metamorphic core complexes (Coney and Harms, 1984; Constensius, 1992). Removal
of the Farallon plate, whether by slab rollback or density-driven foundering, eventually led to the
development of the Basin and Range province, and allowed for renewed asthenospheric flow
beneath the hydrated North American plate. Renewed asthenosphere flow led to thermal
weakening of the North American lithosphere and widespread bimodal volcanism to disperse
across western North America (Constensius, 1992; Humphreys, 1995; Dickinson, 2002; Copeland
et al., 2017). Volcanism and extension swept from the north and south, respectively, and
converged in the central Basin and Range in southern Nevada by ~15 Ma.
9
The Basin and Range is a physiographic province which is spatially and temporally divided
into three subprovinces, based on differences in extensional histories and structural styles
(Wernicke, 1990). The subprovines correlate with differences in evolving plate dynamics (Sonder
and Jones, 1999). Extension in the northern Basin and Range (NBR) initiated at ~48 Ma in Idaho
and Wyoming and subsequently stepped southwestward. The NBR is characterized by high
elevation, high heat flow, and extensively thinned crust (Sonder and Jones, 1999). Magmatism and
extension in the NBR is postulated to be related to buckling and roll-back of the Farallon plate and
tracks the position of the foundering slab beneath North America (Humphreys, 1995). In contrast,
within the southern Basin and Range (SBR), extension and magmatism initiated at ~28 Ma. SBR is
the least active subprovince in the Basin and Range physiographic province with the lowest surface
elevations and heat flow (Sonder and Jones, 1999). Extension in the SBR swept from the ESE to
the WNW, temporally. Deformation and magmatism is associated with an evolving plate margin at
~28 Ma. The interaction of the mid-oceanic spreading ridge between the Pacific and Farallon plates
with the North American plate margin created the Mendocino and Rivera triple junctions.
Subduction of the Farallon side of the mid-oceanic ridge led to a slab window beneath the North
American plate and the newly formed triple junctions migrated northward and southward, allowing
compression to relax and widespread extension to occur in the SBR until ~16 Ma (Dickson and
Snyder, 1979; Sonder and Jones, 1999). Extension began to slow in the SBR as the Mendocino
triple junction migrated northward. Extension and magmatism initiated in the central Basin and
Range (CBR) at ~16 Ma and swept from east to west, temporally. The CBR has the highest local
relief, high local heat flow and marks a transition between the NBR and SBR. Furthermore, the
CBR marks the area of greatest extension in the Basin and Range and is extending the area between
the rigid Sierra Nevada and Colorado Plateau blocks (Sonder and Jones, 1999). The Mojave
block, Bristol and Granite mountains are greatly affected by CBR deformation. The Bull Canyon
10
detachment fault of the Granite Mountains is a low-angle normal fault associated with CBR
extension.
2.3 Eastern California Shear Zone
The Eastern California shear zone (ECSZ) is a deformational belt chiefly comprising NW
striking right-lateral strike-slip faults that propagate North America-Pacific transform motion
across the Mojave block to the southern Walker Lane belt (WLB) in the western Great Basin (Dokka
and Travis, 1990; Faulds and Henry, 2008; Miller, 2017). At ~30 Ma, deformation at the plate
margin evolved from an Andean-type subduction margin to a transform dominated margin, due to
the interaction of the Pacific - Farallon ridge with the North American plate margin and the
northward and southward migration of the Mendocino and Rivera triple junctions, respectively
(Atwater, 1970; Atwater and Stock, 1998). As the Mendocino triple junction migrated northward,
some of the strain was partitioned to the east side of the Sierra Nevada block, transecting the
Mojave Desert to join the San Andreas fault system to the south and forming the incipient ECSZ
and WLB (Faulds and Henry, 2008). The ECSZ is kinematically linked with the San Andreas fault
system and is defined by a ~150 km wide belt south of the Garlock Fault (Figure 1). The ECSZ is
responsible for ~65 km of right lateral displacement from the Miocene to Quaternary (Faulds and
Henry, 2008). To the north, the WLB is accommodating dextral motion of the rigid magmatic arc
(Sierra Nevada microplate) with respect to the Basin and Range Province. Deformation of the WLB
terminates coincidently in the southern Cascade region near the Mendocino triple junction,
suggesting a causative link with the San Andreas system and plate boundary motion (Faulds et al.,
2005). Geodetic data suggest these deformational belts are presently accommodating ~20% of
right-lateral motion between the North American and Pacific plates (Hammond and Thatcher,
2007).
11
The ECSZ greatly disrupts the Mojave Desert with significant right-lateral motion (Miller,
2017). The Bristol-Granite Mountain Fault Zone (BGMFZ) is thought to be the northeastern-most
segment of the ECSZ, and structurally dissects the Bristol and Granite mountains. Lease et al.
(2009) indicate a minimum dextral offset of ~19 km, post-18 Ma, along the BGMFZ by using
paleovalley reconstructions and age constraints from the Peach Springs Tuff. Furthermore, Dokka
and Travis (1990a) proposed a 21.5 km offset across the BGMFZ based on strain compatibility
kinematic models. Miller (1993) and Howard and Miller (1992) proposed a 0-10 km offset based
on offset of east-trending rhyolite flows. New constraints from gravity and aeromagnetic data
suggest the BGMFZ and Soda-Avawatz fault, a northern strand of the BGMFZ, accommodate 9-
15 km of right-lateral offset post-18 Ma (Langenheim and Miller, 2017). Reconstruction of this
fault is crucial to understanding the geologic evolution of the Bristol and Granite mountains.
2.4 Eastern Mojave Desert
The Eastern Mojave Desert is a region with numerous Mesozoic contractional structures,
Mesozoic and Cenozoic extensional features, and extensive Mesozoic magmatic arc rocks and
Cenozoic bimodal volcanic rocks (Burchfiel and Davis, 1981; Foster et al., 1990; Glazner et al.,
1994). The Mojave region sits at the crossroads of the SFTB and the Mesozoic magmatic arc. Many
of the Late Cretaceous plutons within the eastern Mojave display textures and cooling signatures
consistent with syn-extensional emplacement and subsequent exhumation. Furthermore, many
ductile extensional shear zones within this region record the partial denudation and unroofing of mid-
crustal rocks to shallow crustal levels during the Late Cretaceous. The timing and kinematics of Late
Cretaceous extension in the Mojave are consistent with data and observations from the Bristol and
Granite mountains.
12
2.4.1 Granite and Bristol Mountains
The Granite Mountains are a domal plutonic complex comprosed mostly of mid-crustal
Jurassic and Cretaceous igneous rocks with small roof pendants present at higher elevations (Figure
2b) (Howard et al., 1987). Roof pendant rocks are marbles and calcsilicate rocks with small zones of
skarn alteration, possibly correlating to the Monte Cristo Formation (Mississippian) and the Bird
Spring Formation (Pennsylvanian to Permian) in the nearby Providence Mountains (Howard et
al., 1987). The Mesozoic plutonic rocks range in composition from diorite to granodiorite and
porphyritic monzogranite (Howard et al., 1987; Young et al., 1991). Kula (2002) used Al-in-
hornblende geobarometry on Late Cretaceous plutonic rocks in the Granite Mountains to show 4-
4.5 kbar emplacement pressures corresponding to mid-crustal depths. The presence of Paleozoic
roof pendants within mid-crustal plutons, adjacent to an unmetamorphosed upper crustal Paleozoic
section in the Providence Mountains, suggests pre-intrusive structural burial of the Granite
Mountain strata. Kula (2002), using 40Ar/39Ar hornblende and K-feldspar thermochronology, also
documented a geologically rapid cooling event in the Late Cretaceous, which was attributed to
extensional exhumation, though structures responsible for exhumation were not recognized. The
Bull Canyon Fault (BCF), the only exhumational structure previously recognized in the Granite
Mountains, is exposed along the northern and northwestern base of the Granite Mountains (Figure
2b). The BCF is a Neogene (?) normal fault, dipping away from the range at ~40˚NW, demarked
by zones of intense brecciation, highly fractured diorite and leucogranite, and well developed orange
to red cataclastic and ultracataclastic fault rocks. Rocks in the immediate footwall of the BCF are
highly chloritized Jurassic plutonic rocks, Geologic mapping of the Bristol Mountains, to the
NW, indicates plutonic lithologies are similar to those in the Granite Mountains, ranging in
composition from diorite to granodiorite and granite. A large mylonitic shear zone is present along
the west and southwest portions of the mountain range. U/Pb dating of zircon (this study) indicates
Cretaceous and Jurassic plutons were emplaced synchronously with plutons in the Granite
13
Mountains. 40Ar/39Ar thermochronology on mica and K-feldspar (this study) in the Bristol
Mountains demonstrates Late-Cretaceous plutons underwent a rapid cooling event, coeval with
cooling in the Granite Mountains.
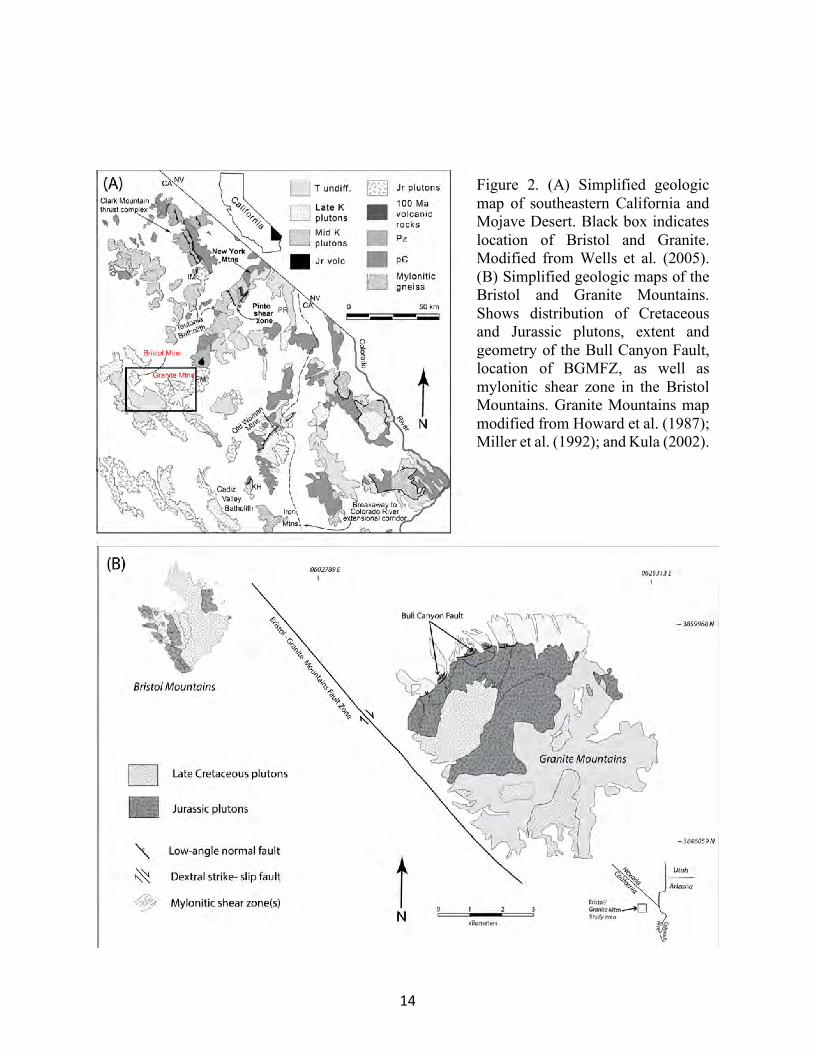
The BGMFZ, a dextral strike-slip fault that strikes NW and dips ~70-80˚ NE, separates the
Bristol Mountains to the west and the Granite Mountains to the east (Figure 2b) (Howard et al.,
1987). The BGMFZ plays an important role in displacing the Granite Mountains from the Bristol
Mountains, though the significance is poorly understood. It is considered herein that the paleovalley
reconstruction estimate of Lease et al. (2009) is unreliable. New data from geophysical data indicate
a 9-15 km offset (Langenheim and Miller, 2017). The magnitude of offset across the BGMFZ is
important in reconstructing where the Bristol Mountains lay relative to the Granite Mountains; we
adopt the conservative 9-15 estimate of Langenheim and Miller (2017).
14
Figure 2. (A) Simplified geologic map of southeastern California and Mojave Desert. Black box indicates location of Bristol and Granite. Modified from Wells et al. (2005). (B) Simplified geologic maps of the Bristol and Granite Mountains. Shows distribution of Cretaceous and Jurassic plutons, extent and geometry of the Bull Canyon Fault, location of BGMFZ, as well as mylonitic shear zone in the Bristol Mountains. Granite Mountains map modified from Howard et al. (1987); Miller et al. (1992); and Kula (2002).
15
3. METHODS
This study addresses the fundamental hypothesis that the ductile mylonitic shear fabrics
present in the Granite and Bristol mountains record Late Cretaceous extensional deformation,
which resulted from widespread collapse of the Sevier retroarc. Furthermore, it is hypothesized
that the BCF was reactivated in the Cenozoic and obscured the Late Cretaceous extensional shear
zone. To test these hypotheses, the following research questions were addressed: (1) What are the
emplacement ages and thermal histories for the Cretaceous and Jurassic plutons spanning the
footwall of the shear zones present in the Granite Mountains and Bristol Mountains? (2) What are
kinematics for the mylonitic rocks, and are they similar? (3) What is the age of mylonitic
shearing as constrained by deformation temperatures and thermal histories of footwall rocks? (4)
What is the relationship between the BCF and the mylonitic fabrics in the immediate footwall?
3.1 Sampling Approach
To address the emplacement and thermal histories of the Cretaceous and Jurassic
plutons, one sampling transect was performed across each mountain range. For the Granite
Mountains, we build off the study of Kula (2002), who presented U/Pb zircon, 40Ar/39Ar
hornblende and K- feldspar, and Al-in-hornblende barometric data along a NE-SW transect.
The transect for the current study trends SE-NW, parallel to the transport direction of the
mylonitic shear zone and BCF, and utilizes the central sample from the transect of Kula
(2002). This study added two additional sampling locations (GM6 and GM7), for which we
analyzed zircon for U/Pb crystallization ages, as well as hornblende (one sample), biotite, and
K-feldspar for 40Ar/39Ar thermochronology. Furthermore, we determined improved U/Pb zircon
ages for Cretaceous plutons sampled by Kula (2002), utilizing advances in U/Pb LA-ICP-MS
analysis, to refine emplacement and crystallization ages used to construct T-t profiles.
Moreover, two additional samples, a diorite (GM5) and leucogranite pluton (GM138) (Figure 3),
16
were collected for U/Pb zircon ages to address the timing of emplacement for Jurassic plutons.
The new data, along with those presented in Kula (2002), provide substantial constraints on the
overall emplacement and thermal histories across the footwall of the mylonitic shear zone and
BCF of the Granite Mountains. In the Bristol Mountains, three samples (BM16, BM17,
BM18/13) were collected along a SW-NE transect, spanning the footwall and shear zone parallel
to transport direction. On this transect, one sample was analyzed for a zircon U/Pb age, and four
micas and two K-feldspars were analyzed for 40Ar/39Ar thermochronology. Additionally, two
samples, not on the transect, were sampled from a Cretaceous (BM9) and Jurassic pluton (BM4)
for zircon U/Pb ages, as well as a mica cooling age from the Cretaceous pluton to obtain
preliminary data from the range (Figure 7). To constrain deformation temperatures and
kinematics of ductilely deformed mylonitic rocks, multiple oriented samples were collected from
the shear zone(s). Samples were collected along strike, spanning the length of the exposed shear
zone(s).
3.2 Analytical Techniques
3.2.1 Mineral Separation and Characterization
Mineral separates were prepared at UNLV’s rock preparation and mineral separation labs.
Rocks samples collected from the field were crushed using a Badger crusher to reduce rocks to
chip sized fragments. Chips were then pulverized using a disk mill. Pulverized material was seived
to segregate mineral fraction sizes. A sieve stack of varying nominal sieve size opening, ranging
from 354 microns to 44 microns, was used. Minerals were chosen from different size fractions
based on degree of complete disaggregation (e.g. monomineralic grains) and mineral freshness.
For zircon separation, approximately 2.5 kg of sample from the 44-354-micron size fraction
were washed on a wifley table to separate minerals by density. Minerals in the last (heavies) cup
17
were then dried and a hand magnet was used to remove magnetite and any metal shavings from
the crushing process. Methylene iodide - a heavy liquid with specific gravity (S.G.) of 3.32
– was used to sink zircons and float minerals with S.G. less than 3.32. After heavy liquids
separation and washing, the sample was further separated using a Frantz isodynamic magnetic
separator. Samples are run through the Frantz at varying amperages and varying tilts of the sample
tray to completely remove all magnetic materials from the non-magnetic zircons. Final sample
purification (>99%) is done under a binocular microscope by hand picking non-zircons out of the
sample with tweezers and small needles. Approximately 100 grains were selected for analysis for
each sample.
To separate hornblende, a sieved size fraction ranging from 177 to 250 microns was extracted
from the pulverized material. Sample was then magnetically separated using hand magnetics and
Frantz magnetic separator to remove most magnetic material and reduce sample size. Following
this step, a heavy liquids separation step was used; methylene iodide (S.G. 3.32) was diluted to an
S.G. of 3.1 to sink hornblende and float other minerals with S.G. values less than 3.1 (e.g. quartz,
feldspar, and mica). Additional Frantz magnetic separation was used to further purify hornblende.
Final purification was done using a binocular microscope to produce 150-300 mg of mineral
separate.
To separate biotite and muscovite, sample size fractions ranging from 177 to 250 microns
were used. A simple “paper shake” technique was used to separate mica. A small amount of sample
was placed on a sheet of white computer paper; the sample was then agitated back and forth until
quartz and feldspar rolled off the paper leaving behind mica. Mica commonly forms sheets with
high surface area and surface tension allowing for the mineral to stick to the paper while other
grains roll off. Following the paper shake technique, a Frantz magnetic separation step was used
18
to remove any mica from feldspar and quartz that made it through the paper shake. Final sample
was purified by hand picking out grains with impurities or inclusions to produce approximately
150-200 mg of mineral concentrate.
Potassium feldspar (K-feldspar) was separated from size fraction ranging from 177 to 250
microns. An initial Frantz magnetic separation step was used to reduce sample size and remove
magnetics. Bromoform – a heavy liquid with a specific gravity of 2.85 – was used to separate K-
feldspar. K-feldspar has a specific gravity of 2.5-2.6. Bromoform was diluted with acetone to an
S.G. of ~2.61, to sink quartz and suspend plagioclase while leaving K-feldspar floating in the
heavy liquid column. K-feldspar was run through the Frantz magnetic separator at high
amperages (~ 2.2-2.5 A) to remove grains with magnetic inclusions. Final separation was done
using a binocular microscope and tweezers. Only K-feldspar grains that appeared glassy (not
milky) were hand-picked for final analysis. Approximately 150-300 mg was collected for final
analysis.
3.2.2 U/Pb Zircon Geochronology
The U/Pb system is a robust dating system, which utilizes the decay of U-Th to Pb to
isotopically date zircons. U and Th decay to stable Pb isotopes at a specific half-life which is used
to determine ages. These are: 238U to 206Pb with a half-life of 4.468 Ga, 235U to 207Pb with a half-
life of 704 Ma, and 232Th to 208Pb with a half-life of 14.01 Ga. Primarily three isotopic ratios are
measured to determine ages: 238U/206Pb, 235U/207Pb, and 207Pb/206Pb. When 238U/206Pb and
235U/207Pb yield the same age, the sample is concordant, thus it preserved a closed system and is
ideal for determining the age of a zircon crystal. When 238U/206Pb and 235U/207Pb ages are varying,
the sample is discordant and either has been subjected to an open system resulting in Pb loss or
contains a component of older, inherited, material; these analyses are rejected from the final age
19
calculation. Typically, with igneous zircons, rims of crystals are analyzed to determine the
crystallization age whereas cores of crystals are analyzed to determine if the zircon is inherited
from an older source.
Zircon U/Pb analyses were conducted at the Arizona LaserChron Center housed at the
University of Arizona. A Thermo-Finnigan Element2 single collector-inductively coupled
plasma-mass spectrometer (SC-ICP-MS) was used to analyze U/Pb isotopic ratios. The following
parameters are summarized from Gehrels (2010) and Ibanez et al. (2015) Table 1. The Element2
uses an Analyte G2 laser ablation system which utilizes a 193nm ArF excimer producing a 20-
micron beam size and 30-micron pit depths. The energy fluence and attenuation are 7 J/cm2 and
8%, respectively. Laser ablation repetition rate is 7 Hz with 560 pulses. The Element2 mass
spectrometer runs at 1200 W forwarding power with low mass resolutions.
Prior to analysis on the Element2 SC-ICP-MS single zircon grains were mounted with
standards of known ages. Approximately 50-60 zircon (unknowns) were mounted in rows.
Subsequent to drying and setting of epoxy in mount, detailed cathodo-luminescence (CL) images
of the sample were taken. CL images capture the detail of oscillatory zoning in zircons, which
enables identification of zircon cores and aids in spot selection. Approximately 50-75 spots of
rims and cores, identified from the CL images, are set into the operating program and the sample
is analyzed. A sample with 75 spot analyses takes approximately 2 hours to run. Data is then
reduced using an in-house python code and EGcalc macro program. Concordia diagrams and
best-fit age plots are generated using Isoplot.
3.2.3 40Ar/39Ar Thermochronology
40Ar/39Ar thermochronology is a proxy isotopic dating system developed from the K/Ar
system; it is a robust system used to solve a variety geological problems from crystallization ages
20
of young volcanic rocks to cooling histories of plutonic rocks (McDougall and Harrison, 1999).
The K/Ar system is a radiogenic decay process of 40K to 40Ar with a half-life of 1.2480 Byr. For
40Ar/39Ar geochronology, samples must be irradiated by neutrons from a nuclear reactor to
convert stable 39K to radiogenic 39Ar. After irradiation at a nuclear reactor the sample is loaded
into a mass spectrometer and heated with a resistance furnace in a stepwise fashion to release
gases from the crystal lattice. Step heating allows for several analyses per sample, usually 13-15,
which in turn yields insight to the argon distribution throughout the sample. For example, heating
steps typically start at 660 ˚C and heat until fusion at 1,400 ˚C. At lower temperatures (initial
steps), atmospheric gases that entered the lattice, usually through weathering and alteration, are
released, these data can usually be rejected from the final age calculation. At higher temperatures,
the step heating technique begins to liberate radiogenic gases which developed through
radioactive decay and geologic processes. These steps usually yield similar ages and are plotted
on an age spectrum plot. Samples that meet the plateau age restrictions usually yield the most
reliable ages, with the lowest errors. For a sample to meet the plateau age restrictions, four or
more consecutive heating steps, which release at least 50% of the total 39Ar, must correspondence
in age at 2 sigma uncertainties.
All sample were irradiated at the OSU TRIGA Reactor in Corvallis, OR and analyzed at the
University of Nevada, Las Vegas in the Nevada Isotope Geochronology Labratory (NIGL) on the
MAP 215-50 mass spectrometer. This is a low background and high sensitivity machine and is
equipped with a triple collector assembly, Faraday cup, and a standard electron multiplier.
Additionally, the MAP 215-50 runs a 4K cryogenic pump which separates noble gases. A
quadrapole mass spectrometer is used for measuring gases prior to sample admission.
Nominal closure temperatures used in this study are 500 ± 50 ˚C for hornblende, 425 ± 25
21
˚C for muscovite, and 325 ± 50 ˚C for biotite (McDougall and Harrison, 1999; Harrison et al.,
2009). Modeling of K-feldspar gas release, following the MDD theory and techniques described
in Lovera et al., 1989; Lovera, 1992; Lovera et al., 1993; and Lovera et al., 2002, yield a
continuous cooling history for the temperature interval 300˚C to 150˚C. Computer programs
provided by Zietler (1993) were used to model domain size and distribution and diffusion kinetics
(SizeExtractor), as well as inversion modeling (Arvert) of age spectra to obtain continuous
cooling curves.
3.2.4 Structural Analysis
To constrain lithologic distributions as well as the extent and geometry of the mylonitic
shear zone in the Bristol Mountains, geologic mapping was performed at the 1:24,000 scale across
the range. Structural measurements were collected from mylonitic rocks (foliation and lineations)
to constrain geometry as well as general hanging-wall transport direction of the shear zone.
Furthermore, multiple oriented samples were collected from the shear zone for detailed kinematic
and microstructural analyses. Thin sections were cut from oriented samples and analyzed using
traditional petrographic techniques. Kinematic indicators such as sigmoidal grains (mica fish),
shear bands of dynamically recrystallized minerals, and grains with strain shadows were used to
determine overall shear sense. Microstructures were studied to constrain deformation mechanisms.
Specifically, the mechanisms of dynamic recrystallization of quartz and feldspar grains were
assessed to constrain deformation temperatures, assuming average geologic strain rates. Three
regimes of dynamic quartz recrystallization have been demonstrated to indicate deformation
temperatures (Guillope and Poirier, 1979; Poirier and Guillope, 1979; Cahn, 1983; Urai et al.,
1986; Drury and Urai, 1990; Hirth and Tullis, 1992; Stipp et al., 2002), and are as follows: bulging
recrystallization (BLG), regime 1, which is indicative of low deformation temperatures (280-
22
400˚C); subgrain rotation recrystallization (SGR), regime 2, is characterized by intermediate
deformation temperatures (400-500˚C); and grain boundary migration recrystallization (GBM), or
regime 3, occurs at high deformation temperatures (~500˚C). Constraining the temperatures of
deformation from the mylonitic shear zone also provides insight into the timing of deformation
by coupling isotope geochronology and thermochronology with deformation mechanisms.
To address the structural significance of the BCF and its role in exhuming the Granite
Mountains and displacing the Bristol Mountains to the NW, as well as its relationship to the ductile
shear fabrics present in the immediate footwall, the BCF was mapped systematically at a 1:12,000
scale and a detailed structural analysis of the fault zone was performed. Brittle striations and fault
surfaces were measured along the brittle cap of the BCF, and compared with measurements of
foliations and lineations within the mylonitic fabrics in the immediate footwall of the BCF. All
measurements were plotted on equal area stereographic projections using software Stereonet 9.
Oriented samples were collected from the mylonitic shear zone to determine kinematics and
deformation mechanisms, using the same techniques as discussed above.
4. RESULTS
4.1 Bull Canyon Fault – Mapping and Structural Analysis
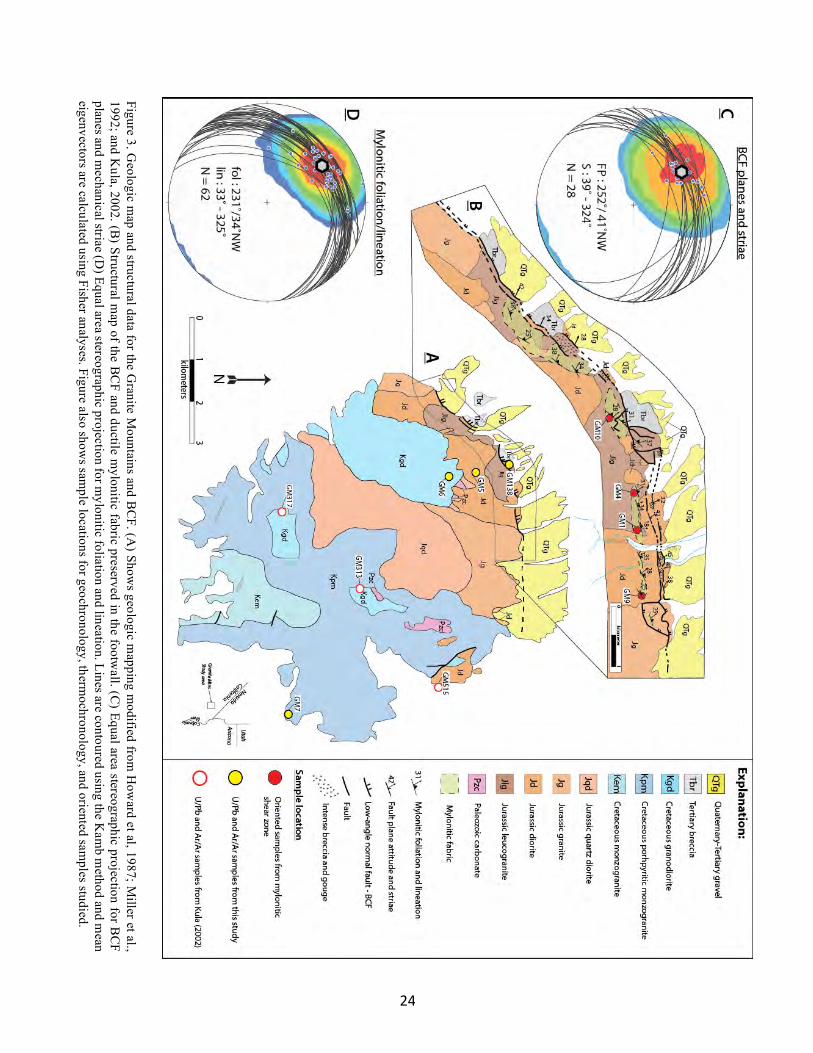
The BCF is exposed along the northern and northwestern base of the Granite Mountains,
and forms an arcuate shape dipping NW away from the range (Figure 3a-b). It is demarked by
zones of intense brecciation, highly fractured granitoid rocks, and well developed orange to red
cataclasite and ultracataclasite (Figure 4). Structural measurements of the BCF show an average
fault plane strike of 252˚ and dip of 41˚NW (Figure 3c). Furthermore, mechanical transport
direction indicators such as slickensides and grooves and mullions, were measured to determine
overall direction of hanging-wall transport. Average trend of kinematic indicators demonstrates
23
a hanging-wall transport direction of 324˚ and plunge of 39˚ (Figure 3c). The age of the BCF is
poorly constrained by cross-cutting relations with undated Tertiary gravel and breccia units, as
well as the regional framework of extension in the Southern Basin and Range; the fault is
thought to be Neogene in age. Tertiary gravel deposits and Tertiary landslide breccia units are
interpreted as deposits formed during the final exhumation of the Granite Mountains in the
Miocene (Howard et al., 1987).
24
Figure 3. Geologic m
ap and structural data for the Granite M
ountains and BC
F. (A) Show
s geologic mapping m
odified from H
oward et al, 1987; M
iller et al., 1992; and K
ula, 2002. (B) Structural m
ap of the BC
F and ductile mylonitic fabric preserved in the footw
all. (C) Equal area stereographic projection for B
CF
planes and mechanical striae (D
) Equal area stereographic projection for mylonitic foliation and lineation. Lines are contoured using the K
amb m
ethod and mean
eigenvectors are calculated using Fisher analyses. Figure also shows sam
ple locations for geochronology, thermochronology, and oriented sam
ples studied.
25
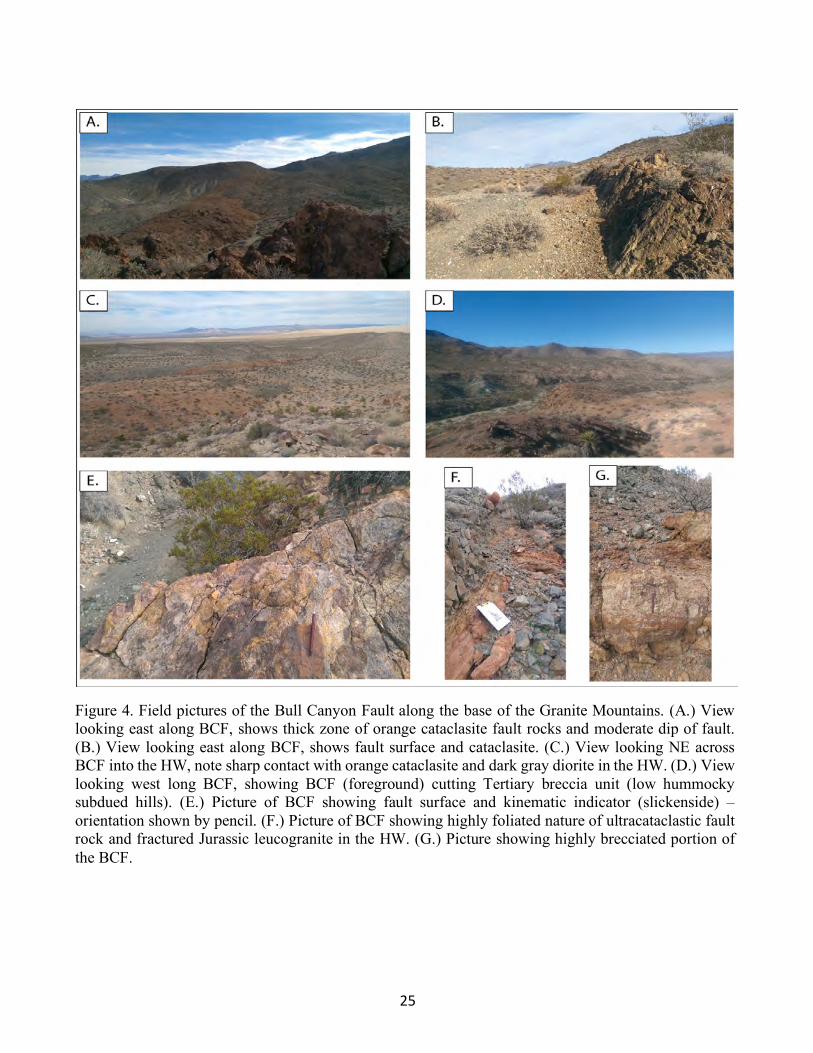
Figure 4. Field pictures of the Bull Canyon Fault along the base of the Granite Mountains. (A.) View looking east along BCF, shows thick zone of orange cataclasite fault rocks and moderate dip of fault. (B.) View looking east along BCF, shows fault surface and cataclasite. (C.) View looking NE across BCF into the HW, note sharp contact with orange cataclasite and dark gray diorite in the HW. (D.) View looking west long BCF, showing BCF (foreground) cutting Tertiary breccia unit (low hummocky subdued hills). (E.) Picture of BCF showing fault surface and kinematic indicator (slickenside) – orientation shown by pencil. (F.) Picture of BCF showing highly foliated nature of ultracataclastic fault rock and fractured Jurassic leucogranite in the HW. (G.) Picture showing highly brecciated portion of the BCF.
26
4.1.1 Footwall Geology
Rocks in the footwall of the BCF, in the northwestern Granite Mountains, are Jurassic
leucogranites, granites, and diorites. These plutonic rocks are generally highly chloritized adjacent
to the BCF, due to low-grade alteration. Solid-state mylonitic fabrics occur discontinuously
throughout the immediate footwall of the BCF, dominantly developed in Jurassic leucogranite,
including leucocratic sills within dioritic plutons. Structural measurements of localized mylonitic
fabrics show a similar geometry and kinematics to the brittle-cap and principal slip-plane of the
BCF. Mylonitically deformed rocks represent a structural thickness of ~500 m, below which
Jurassic and Cretaceous granitoids are undeformed, preserving magmatic contacts, textures, and
fabrics. Jurassic dioritic plutons show highly complex magma mixing textures and “spider-web
dikes”, indicating the Cretaceous plutonic suite intruded immediately below or adjacent to the
Jurassic suite, causing complex interactions and magmatic processes to occur.
Mylonitic fabrics in the footwall of the BCF form a discontinuous belt of outcrops
displaying solid-state shearing, and locally show chloritization and alteration due to BCF
deformation. Structural measurements of mylonitic fabrics show an average foliation surface of
231˚ and dip of 34˚NW (Figure 3d). Trend and plunge of stretching lineations give an average
transport direction of 325˚ and plunge of 33˚ (Figure 3d). Figure 3b shows sample locations for
photomicrographs and samples discussed below.
The deformational style of mylonitic shear zones is best demonstrated by a detailed
kinematic study of oriented thin sections, as well as observations at the outcrop and hand-sample
scale.Kinematic indicators from thin sections unequivocally demonstrate top-to-the-NW, non-
coaxial, down-dip sense of shear. Kinematic indicators include shear bands of dynamically
recrystallized quartz with oblique grain shape fabric – with foliation defining S-C planes (Figure
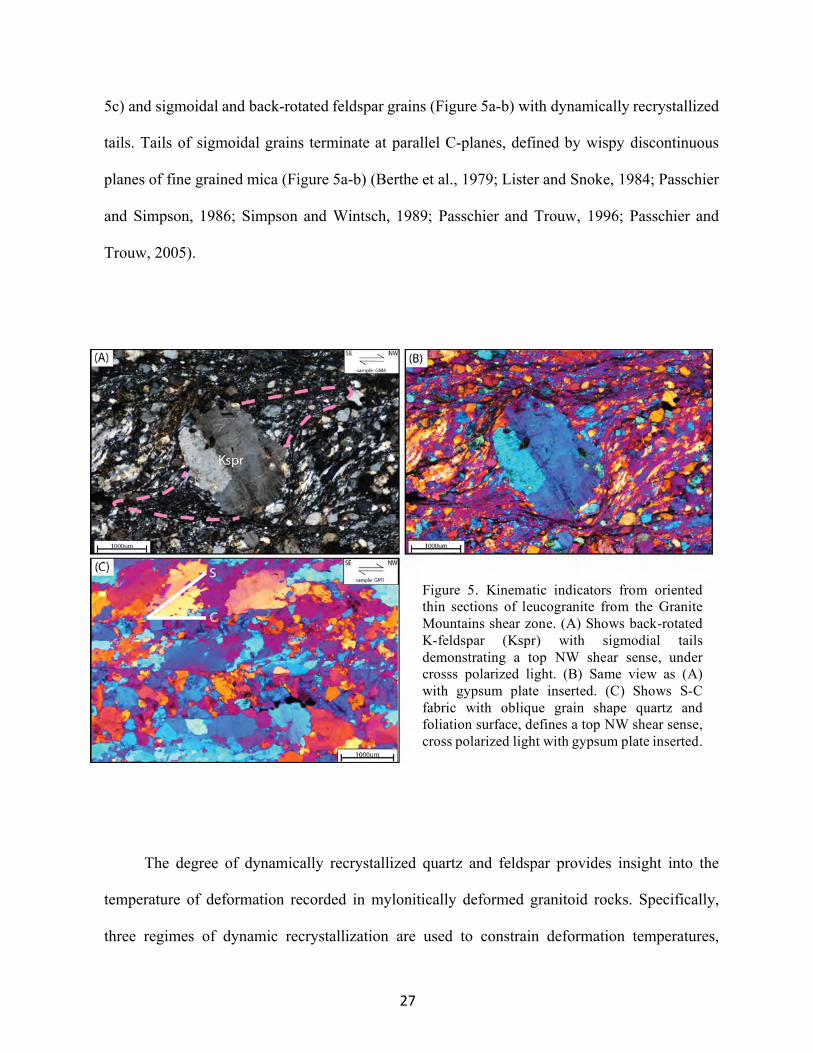
27
5c) and sigmoidal and back-rotated feldspar grains (Figure 5a-b) with dynamically recrystallized
tails. Tails of sigmoidal grains terminate at parallel C-planes, defined by wispy discontinuous
planes of fine grained mica (Figure 5a-b) (Berthe et al., 1979; Lister and Snoke, 1984; Passchier
and Simpson, 1986; Simpson and Wintsch, 1989; Passchier and Trouw, 1996; Passchier and
Trouw, 2005).
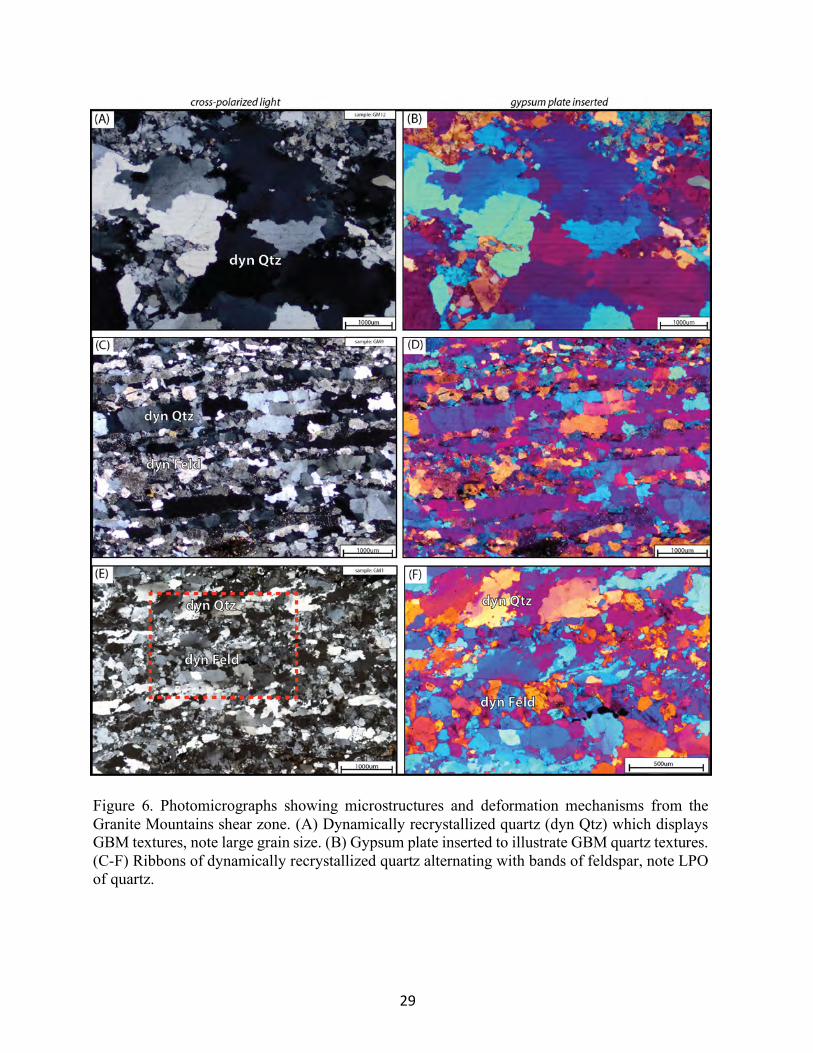
The degree of dynamically recrystallized quartz and feldspar provides insight into the
temperature of deformation recorded in mylonitically deformed granitoid rocks. Specifically,
three regimes of dynamic recrystallization are used to constrain deformation temperatures,
Figure 5. Kinematic indicators from oriented thin sections of leucogranite from the Granite Mountains shear zone. (A) Shows back-rotated K-feldspar (Kspr) with sigmodial tails demonstrating a top NW shear sense, under crosss polarized light. (B) Same view as (A) with gypsum plate inserted. (C) Shows S-C fabric with oblique grain shape quartz and foliation surface, defines a top NW shear sense, cross polarized light with gypsum plate inserted.
28
discussed above. Microstructures from mylonites in the footwall of the BCF demonstrate shearing
took place at upper greenschist to lower amphibolite facies conditions, and show that early higher
temperature microstructures have been overprinted by a lower-grade, lower greenschist
temperature conditions likely associated with either BCF deformation or progressive unroofing
of the shear zone in the Late Cretaceous. Grain-size reduction is evident throughout the shear zone
(Figure 6). Incipient gneissic fabric is evident in mylonite samples, segregating quartz and
feldspar into distinct bands (Figure 6). Quartz bands display consistent grain boundary migration
(GBM) recrystallization textures (Figure 6), correlating to regime 3 from Hirth and Tullis (1992)
and Stipp et al. (2002). GBM recrystallization textures for quartz constrain deformation
temperatures to 500˚C or greater. Plastic behavior and dynamic recrystallization of feldspar is
indicative of high deformation temperatures. BLG recrystallization of feldspar is commonly
observed at temperatures ranging from ~400 – 600 ˚C and SGR is common from ~500 – 550 ˚C
(Figure 6) (Simpson, 1985; Gapais, 1989; Pryer, 1993; FitzGerald and Stunitz, 1993; Singleton
and Moser, 2012). K-feldspar bands commonly show a sub-grain rotation (SRG)
recrystallization texture (regime 2) further constraining deformation temperatures to ~550˚C
(Figure 6) (Simpson, 1985; Gapais, 1989; Pryer, 1993; FitzGerald and Stunitz, 1993).
29
Figure 6. Photomicrographs showing microstructures and deformation mechanisms from the Granite Mountains shear zone. (A) Dynamically recrystallized quartz (dyn Qtz) which displays GBM textures, note large grain size. (B) Gypsum plate inserted to illustrate GBM quartz textures. (C-F) Ribbons of dynamically recrystallized quartz alternating with bands of feldspar, note LPO of quartz.
30
4.1.2 Hanging Wall (Upper Plate) Geology
Rocks in the hanging wall (HW) of the BCF are comprised of Quaternary-Tertiary gravel
(QTg) deposits, Tertiary breccia (Tbr) units, and Jurassic diorite (Jd) with zones of intense gouge
development, brecciation, and fracturing adjacent to the BCF. QTg fans are comprised of gravel
to boulder sized clasts with lithologies consistent with plutonic lithologies present in the Granite
Mountains. QTg units are assumed to be large fan deposits shed from the Granite Mountains
during the final exhumational stages associated with the BCF. It is interpreted that they lie in fault
contact with the BCF. However, ambiguous field relations allow for an alternative that at least
the youngest parts of the deposits overlapped the BCF at one point and have since been eroded.
Tbr units crop out in the immediate HW of the BCF locally and form low-hummocky topography
with wide ranges of lithologies and colors resembling a melange. Large blocks of highly
fractured plutonic rocks comprise the unit, though lithologies are indistinguishable. These are
interpreted to be large slide blocks coming from the top of the Granite Mountains during Miocene
extension and exhumation. Jurassic diorite that is in direct contact with the BCF is highly fractured
with zones of breccia and gouge.
4.2 Bristol Mountains
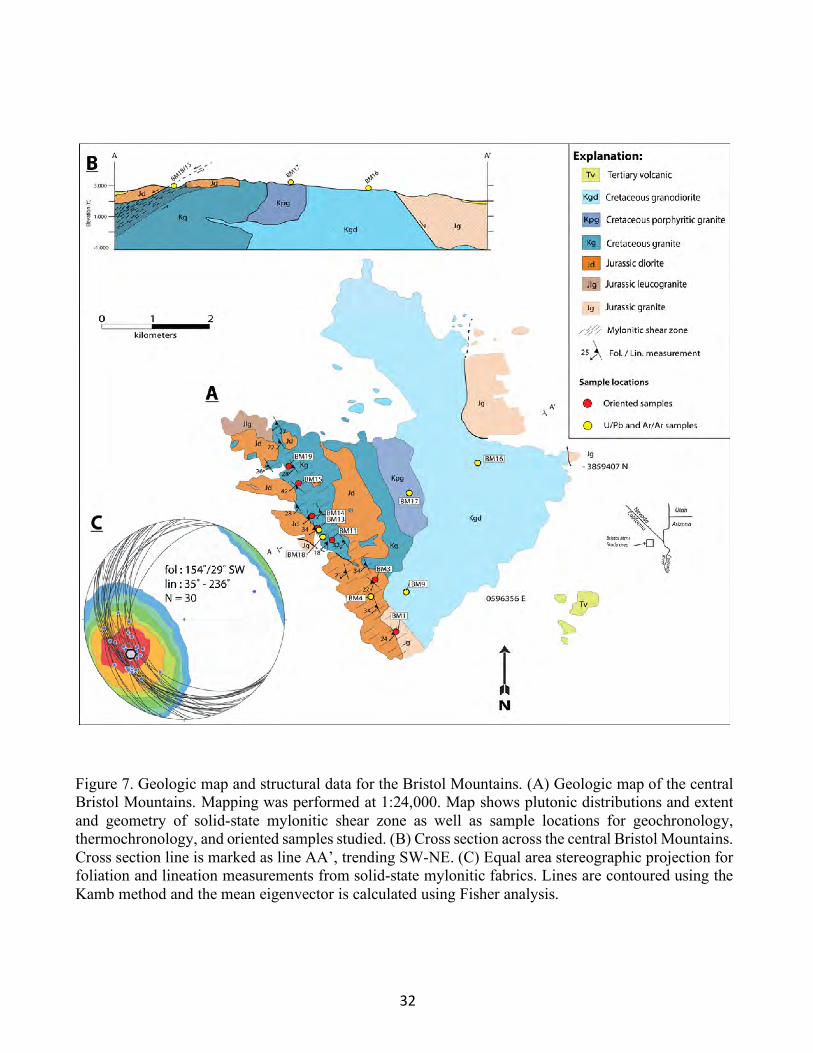
4.2.1 Geologic Mapping
Geologic mapping was performed across a portion of the central Bristol Mountains at
1:24,000. Mapping demonstrates that plutonic lithologies are similar to those in the Granite
Mountains (Figure 7a), though subtle phase variations do exist between plutons. Plutonic units
include a large Cretaceous granodiorite pluton composed of quartz, feldspar and biotite - this
pluton comprises most of the mapped area (Kgd) and forms large rounded, highly weathered and
31
crumbly outcrops. Immediately west and north of Kgd is a more porphyritic phase (Kpg), with K-
feldspar phenocrysts ranging in size from 0.5 – 2 cm; Kpg is much more resistant than Kgd, and
forms steeper slopes with large boulders that are highly varnished, and holds up the highest peaks
in the range. A large Cretaceous granitic pluton overlies Kpg in the central and western portions
of the range (Kg). This unit is distinguished from Kgd and Kpg by the presence of salmon
colored equigranular K-feldspar phenocrysts, ranging in size from 0.8 – 1 cm, and the noticeable
low percent (<5%) of biotite, as compared to Kgd. Kg weathers as large sheets parallel to the
mylonitic foliation and is highly varnished and resistant. Jurassic diorite (Jd) lies along the western
flank of the range. In the NW portion of the map area the diorite is in shear-zone contact with the
highly-deformed Kg, and is undeformed. To the SSE the Jd pluton is mylonitically deformed and
is in intrusive contact with Jg and Kgd (Figure 7a). The Jd pluton caps Kg to the east, and
resembles a large sill-like intrusion (Figure 7b and 8).
4.2.2 Mylonitic Shear Zone
A solid-state, high-strain, mylonitic shear zone is mapped in the western and southern
portion of the range, deforming all units, and most notably Kg (Figure 7a). The shear zone deforms
Jd in the south, demonstrating high strain fabrics and S>L textures. Moving NW, mylonitic
deformation is most prevalent in unit Kg. Deformation within Kg displays variable protomylonite
to ultramylonite textures. Predominately, the highest strain observed is partitioned into more
quartz-rich sills within Kg, displaying elongated quartz grains with high aspect ratios. Moreover,
strain is highest at the western-most upper margin of the shear zone where Kg is in contact with
32
Figure 7. Geologic map and structural data for the Bristol Mountains. (A) Geologic map of the central Bristol Mountains. Mapping was performed at 1:24,000. Map shows plutonic distributions and extent and geometry of solid-state mylonitic shear zone as well as sample locations for geochronology, thermochronology, and oriented samples studied. (B) Cross section across the central Bristol Mountains. Cross section line is marked as line AA’, trending SW-NE. (C) Equal area stereographic projection for foliation and lineation measurements from solid-state mylonitic fabrics. Lines are contoured using the Kamb method and the mean eigenvector is calculated using Fisher analysis.
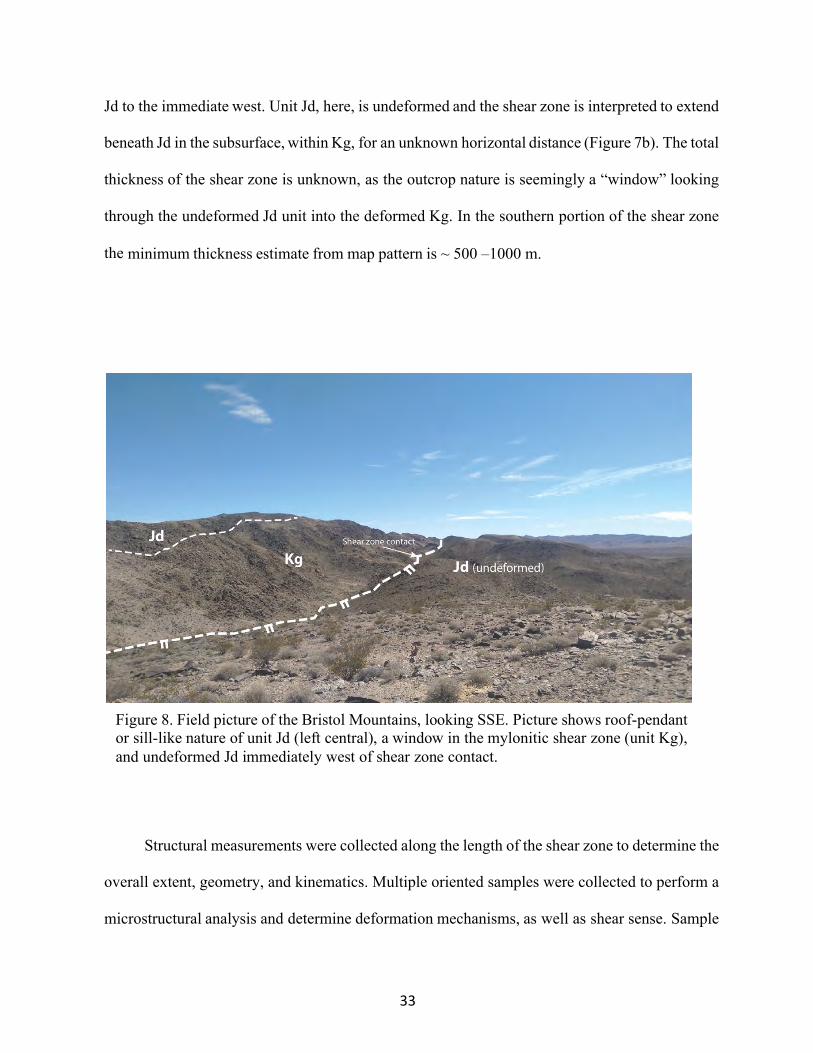
33
Jd to the immediate west. Unit Jd, here, is undeformed and the shear zone is interpreted to extend
beneath Jd in the subsurface, within Kg, for an unknown horizontal distance (Figure 7b). The total
thickness of the shear zone is unknown, as the outcrop nature is seemingly a “window” looking
through the undeformed Jd unit into the deformed Kg. In the southern portion of the shear zone
the minimum thickness estimate from map pattern is ~ 500 –1000 m.
Structural measurements were collected along the length of the shear zone to determine the
overall extent, geometry, and kinematics. Multiple oriented samples were collected to perform a
microstructural analysis and determine deformation mechanisms, as well as shear sense. Sample
Figure 8. Field picture of the Bristol Mountains, looking SSE. Picture shows roof-pendant or sill-like nature of unit Jd (left central), a window in the mylonitic shear zone (unit Kg), and undeformed Jd immediately west of shear zone contact.
34
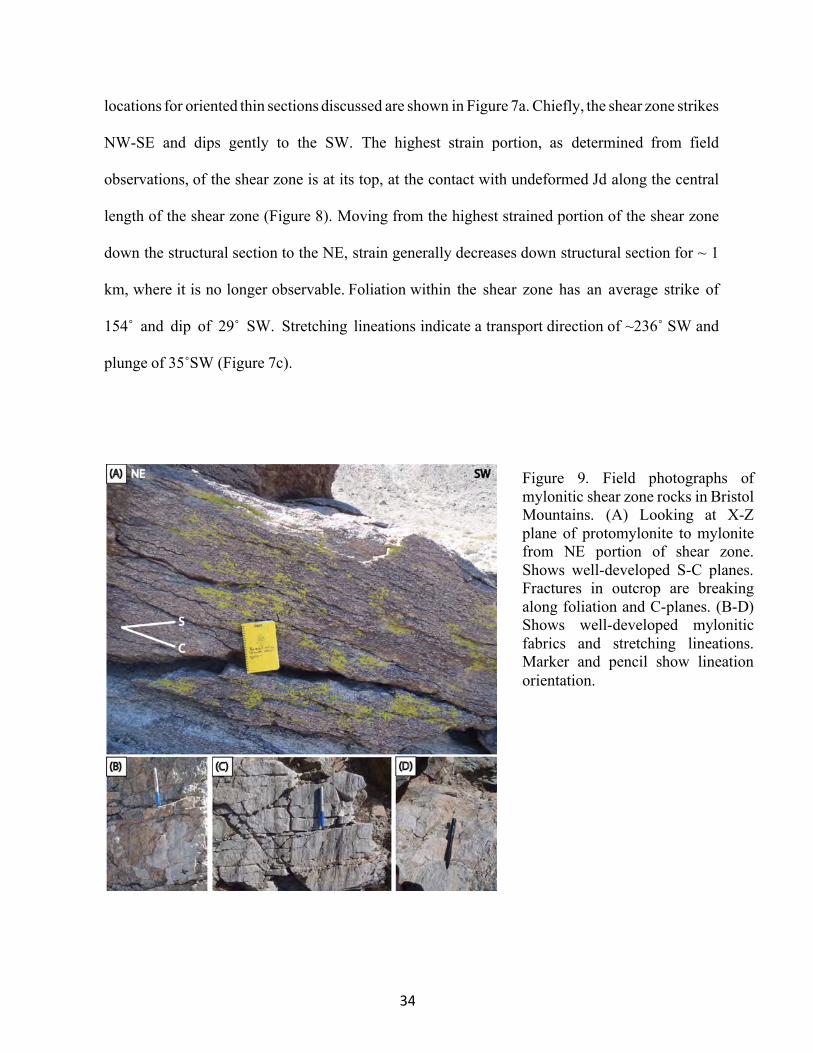
locations for oriented thin sections discussed are shown in Figure 7a. Chiefly, the shear zone strikes
NW-SE and dips gently to the SW. The highest strain portion, as determined from field
observations, of the shear zone is at its top, at the contact with undeformed Jd along the central
length of the shear zone (Figure 8). Moving from the highest strained portion of the shear zone
down the structural section to the NE, strain generally decreases down structural section for ~ 1
km, where it is no longer observable. Foliation within the shear zone has an average strike of
154˚ and dip of 29˚ SW. Stretching lineations indicate a transport direction of ~236˚ SW and
plunge of 35˚SW (Figure 7c).
Figure 9. Field photographs of mylonitic shear zone rocks in Bristol Mountains. (A) Looking at X-Z plane of protomylonite to mylonite from NE portion of shear zone. Shows well-developed S-C planes. Fractures in outcrop are breaking along foliation and C-planes. (B-D) Shows well-developed mylonitic fabrics and stretching lineations. Marker and pencil show lineation orientation.
35
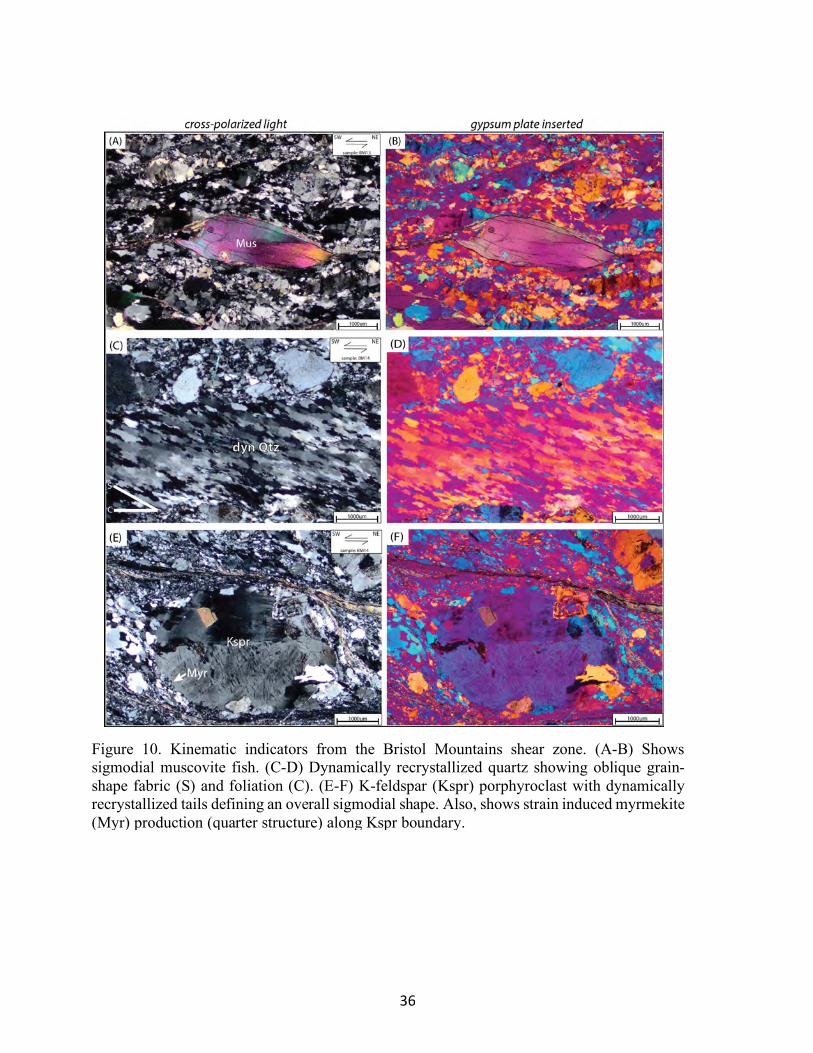
Kinematic indicators are abundant throughout the shear zone, and unequivocally
demonstrate non-coaxial shearing with a top-to-the-SW down-dip sense of shear. Kinematic
indicators include myrmekite quarter structures (Figure 10e-f), dynamically recrystallized quartz
ribbons with oblique grain shape fabrics (Figure 10c-d), sigmodial muscovite fish (Figure 10a-
b), feldspar porphyroclasts with sigmoidal tails (Figure 13e-f), as well as well-developed S-C
fabrics (Figure 9a) (Berthe et al., 1979; Lister and Snoke, 1984; Passchier and Simpson, 1986;
Simpson and Wintsch, 1989; Passchier and Trouw, 2005).
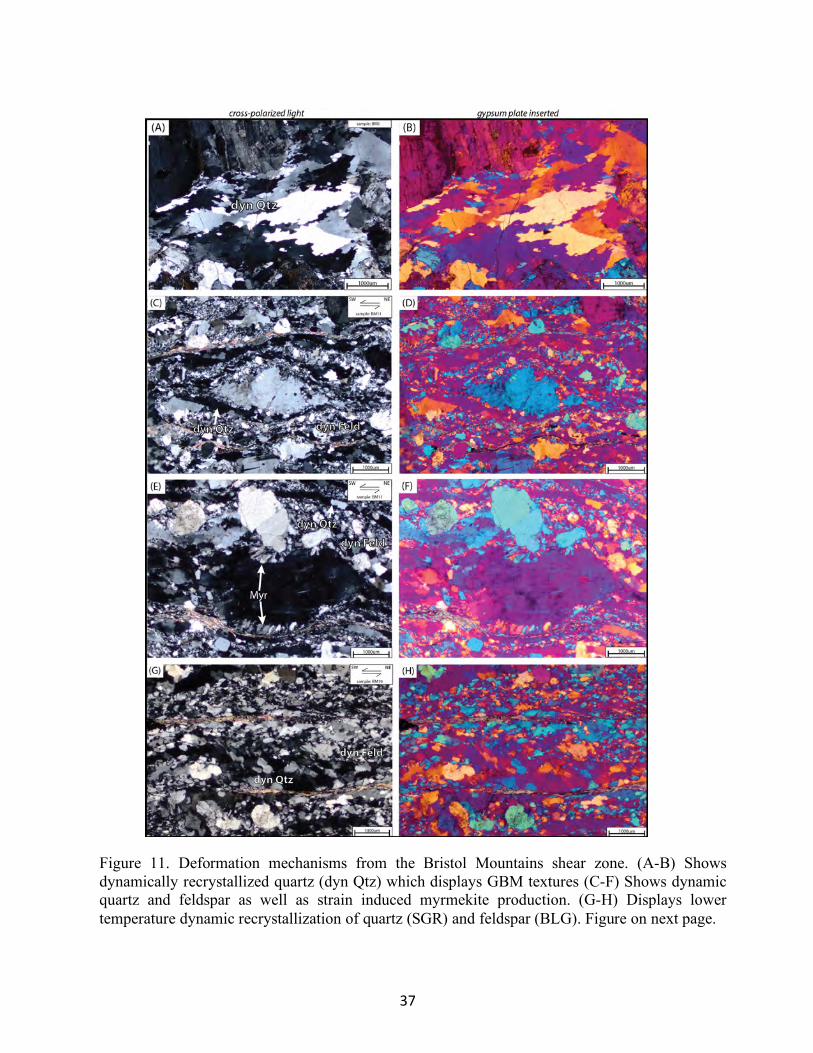
Deformation mechanisms were studied from microstructures, specifically, the degree and
style of dynamically recrystallized quartz and feldspar, to determine the temperature of
deformation. Deformation mechanisms indicate plastic deformation occurring from upper
greenschist to lower amphibolite facies conditions. K-feldspar shows dynamic recrystallization
throughout the shear zone, specifically around tails of porphyoclasts. Furthermore, strain-induced
myrmekite is evident along K-feldspar porphyroclast boundaries. Grain boundary migration
recrystallization of quartz is apparent in every sample studied, indicating deformation occurred at
temperatures in the range of 450-550˚C. Plastic deformation of K-feldspar may indicate
deformation temperatures likely exceeded 500-550˚C (Figure 11) (Simpson, 1985; Simpson and
Wintsch, 1989; Gapais, 1989; Pryer, 1993; FitzGerald and Stunitz, 1993).
36
Figure 10. Kinematic indicators from the Bristol Mountains shear zone. (A-B) Shows sigmodial muscovite fish. (C-D) Dynamically recrystallized quartz showing oblique grain-shape fabric (S) and foliation (C). (E-F) K-feldspar (Kspr) porphyroclast with dynamically recrystallized tails defining an overall sigmodial shape. Also, shows strain induced myrmekite (Myr) production (quarter structure) along Kspr boundary.
37
Figure 11. Deformation mechanisms from the Bristol Mountains shear zone. (A-B) Shows dynamically recrystallized quartz (dyn Qtz) which displays GBM textures (C-F) Shows dynamic quartz and feldspar as well as strain induced myrmekite production. (G-H) Displays lower temperature dynamic recrystallization of quartz (SGR) and feldspar (BLG). Figure on next page.
38
4.3 U/Pb Geochronology
Three samples from the Bristol Mountains were collected for zircon U/Pb geochronology
to constrain crystallization ages for Jurassic (BM4) and Cretaceous (BM9 and BM18) plutons
(Figure 7). Additionally, seven samples were analyzed from the Granite Mountains for zircon U/Pb
analyses. Three of the samples were reanalyzed from the sampling transect of Kula (2002) -
(GM515 (NE), GM313 (Central), and GM317 (SW)) - to increase the accuracy and precision of
the earlier analyses. For example, Kula (2002) reported zircon ages younger than hornblende
40Ar/39Ar cooling ages, motivating the refinement of crystallization ages, reported here. Four new
samples were analyzed in this study; two from Cretaceous plutons on a sampling transect from SE
to NW (GM7(SE) and GM6(NW)), parallel to the transport direction of the BCF and mylonitic
shear fabrics, and two from Jurassic rocks including a dioritic pluton (GM5) and a leucogranitic
pluton (GM138) (Figure 3). The Jurassic leucogranite sample was previously analyzed by Kula
(unpublished) for K-feldspar thermochronology, which showed a very different cooling history
than Cretaceous plutons. These data are reported below at 2 sigma uncertainties.
4.3.1 Bristol Mountains
Samples BM4, BM9, and BM18 from the Bristol Mountains were analyzed for zircon U/Pb
geochronology to obtain crystallization ages for Cretaceous and Jurassic plutons. Sample locations
are shown in Figure 12. The Jurassic pluton analyzed yielded an age of ~157 Ma and showed no
inheritance or core and zoning textures. Cretaceous plutons yielded indistinguishable ages of ~75
Ma and both samples showed cores and detailed zoning textures. Cretaceous plutons show
inherited cores ranging from Early Cretaceous and Late-to-Middle Jurassic ages and some
Cambrian and Precambrian core ages.
39
Sample BM9 targeted a Cretaceous granodiorite pluton, mapped as Kgd, and yielded thirty-
two spot analyses from crystal rims, ranging in age from 72.3-82.5 Ma and a weighted mean
206Pb/238U age of 75.68±1.3 Ma (Figure 12a), with a 95% confidence and MSWD of
1.09. Additionally, eighteen inherited cores were analyzed in this sample of mostly Early
Cretaceous and Mid-to-Late Jurassic ages, with two core ages of 527.1±12.4 Ma and
1709.5±12.8 Ma. The inherited core ages are consistent with surrounding country rock ages as
well as basement rock ages. Sample BM-18 was collected from a Cretaceous (Kg) pluton located
within the mylonitic shear zone in the western portion of the range. Forty-six spot analyses were
obtained from crystal rims and cores. Twenty-six rim analyses yielded a weighted mean
206Pb/238U age of 75.55±1.2 Ma with a 98% confidence and an MSWD of 1.08 (Figure 12b).
The remaining twenty core analyses yielded inheritance ages from Early Cretaceous to Mid-
to-Late Jurassic, and two ages at 1085.7±14.1 Ma and 1097.8±22.1 Ma. The inherited core
ages are consistent with surrounding country rock ages as well as basement rock ages. Sample
BM4 targeted a Jurassic dioritic pluton, mapped as Jd, and yielded a weighted mean 206Pb/238U
age of 157.3±1.7 Ma (Figure 12c). Fifty- six spot analyses were obtained from this sample with
ages ranging from 148-168 Ma, yielding the mean 206Pb/238U age with 95% confidence and
an MSWD of 1.19. No inherited cores were found in this sample.
4.3.2 Granite Mountains
Seven samples were analyzed from the Granite Mountains to obtain crystallization ages for
Cretaceous and Jurassic plutons. Three samples were reanalyzed from Kula (2002) – GM515 (NE),
GM313 (Central), and GM317 (SW) - and four additional samples were analyzed (GM7 (SE),
GM6 (NW), GM5, and GM138) for this study. Results presented below are at 2 sigma errors.
Sample locations are shown in Figure 3.
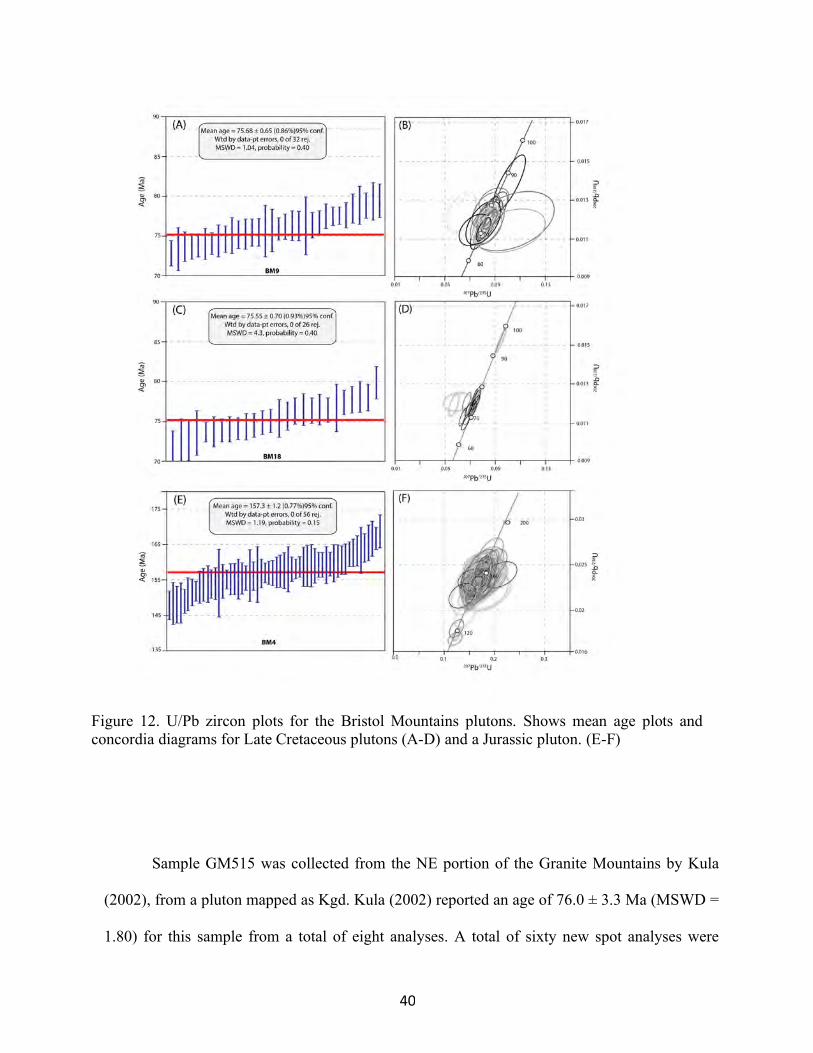
40
Sample GM515 was collected from the NE portion of the Granite Mountains by Kula
(2002), from a pluton mapped as Kgd. Kula (2002) reported an age of 76.0 ± 3.3 Ma (MSWD =
1.80) for this sample from a total of eight analyses. A total of sixty new spot analyses were
Figure 12. U/Pb zircon plots for the Bristol Mountains plutons. Shows mean age plots and concordia diagrams for Late Cretaceous plutons (A-D) and a Jurassic pluton. (E-F)
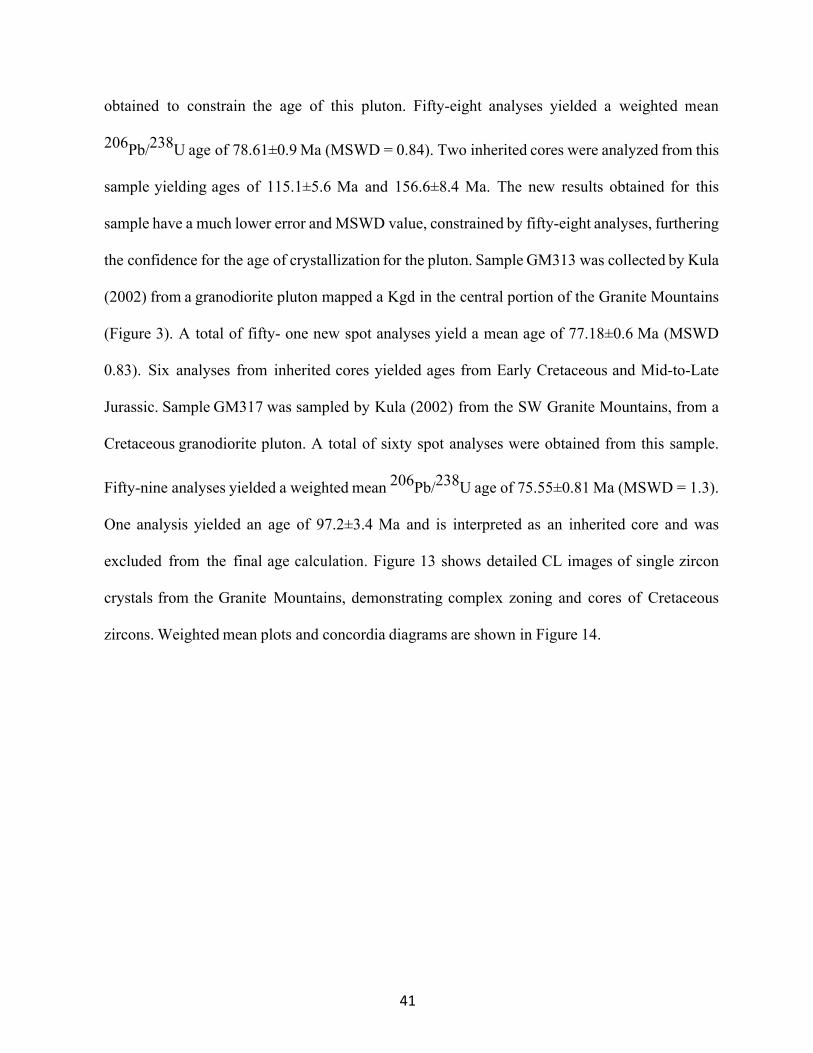
41
obtained to constrain the age of this pluton. Fifty-eight analyses yielded a weighted mean
206Pb/238U age of 78.61±0.9 Ma (MSWD = 0.84). Two inherited cores were analyzed from this
sample yielding ages of 115.1±5.6 Ma and 156.6±8.4 Ma. The new results obtained for this
sample have a much lower error and MSWD value, constrained by fifty-eight analyses, furthering
the confidence for the age of crystallization for the pluton. Sample GM313 was collected by Kula
(2002) from a granodiorite pluton mapped a Kgd in the central portion of the Granite Mountains
(Figure 3). A total of fifty- one new spot analyses yield a mean age of 77.18±0.6 Ma (MSWD
0.83). Six analyses from inherited cores yielded ages from Early Cretaceous and Mid-to-Late
Jurassic. Sample GM317 was sampled by Kula (2002) from the SW Granite Mountains, from a
Cretaceous granodiorite pluton. A total of sixty spot analyses were obtained from this sample.
Fifty-nine analyses yielded a weighted mean 206Pb/238U age of 75.55±0.81 Ma (MSWD = 1.3).
One analysis yielded an age of 97.2±3.4 Ma and is interpreted as an inherited core and was
excluded from the final age calculation. Figure 13 shows detailed CL images of single zircon
crystals from the Granite Mountains, demonstrating complex zoning and cores of Cretaceous
zircons. Weighted mean plots and concordia diagrams are shown in Figure 14.
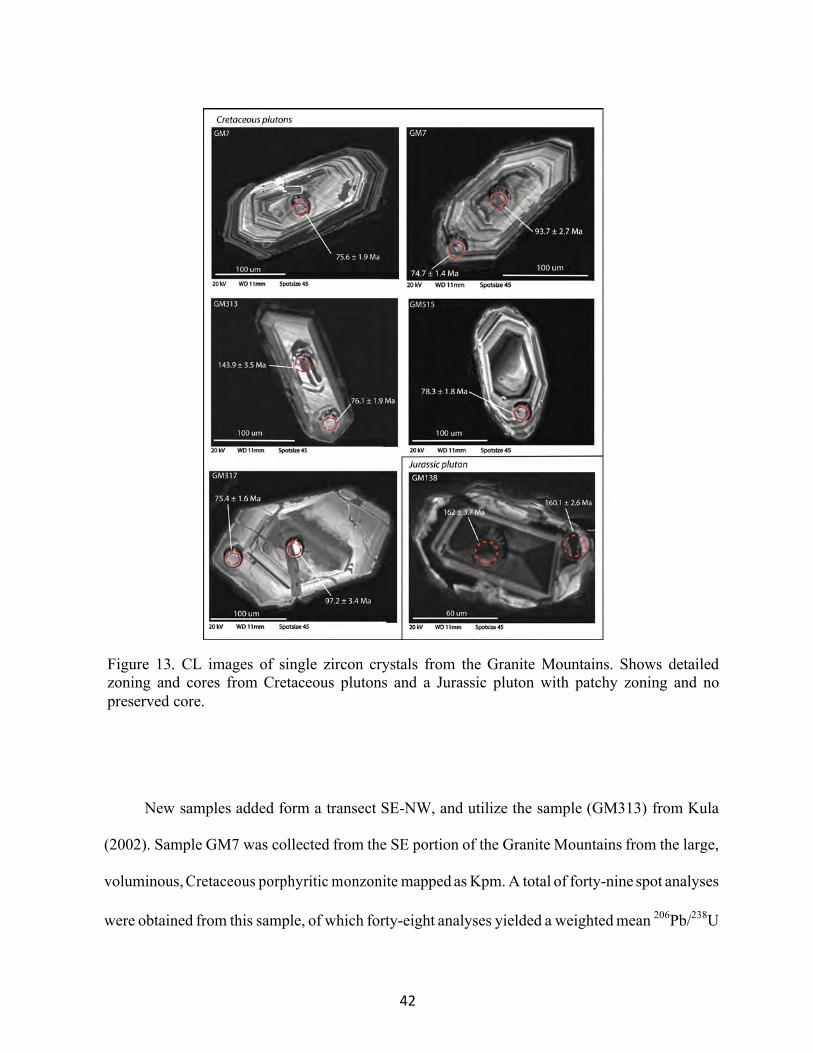
42
New samples added form a transect SE-NW, and utilize the sample (GM313) from Kula
(2002). Sample GM7 was collected from the SE portion of the Granite Mountains from the large,
voluminous, Cretaceous porphyritic monzonite mapped as Kpm. A total of forty-nine spot analyses
were obtained from this sample, of which forty-eight analyses yielded a weighted mean 206Pb/238U
Figure 13. CL images of single zircon crystals from the Granite Mountains. Shows detailed zoning and cores from Cretaceous plutons and a Jurassic pluton with patchy zoning and no preserved core.
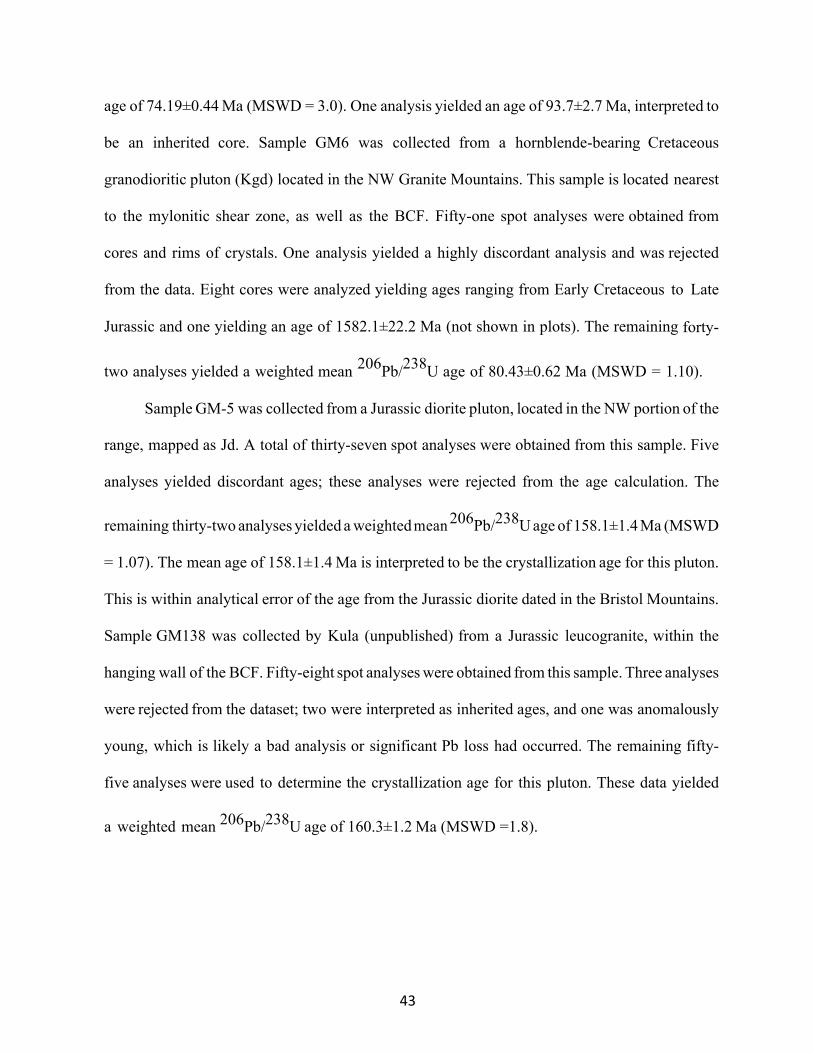
43
age of 74.19±0.44 Ma (MSWD = 3.0). One analysis yielded an age of 93.7±2.7 Ma, interpreted to
be an inherited core. Sample GM6 was collected from a hornblende-bearing Cretaceous
granodioritic pluton (Kgd) located in the NW Granite Mountains. This sample is located nearest
to the mylonitic shear zone, as well as the BCF. Fifty-one spot analyses were obtained from
cores and rims of crystals. One analysis yielded a highly discordant analysis and was rejected
from the data. Eight cores were analyzed yielding ages ranging from Early Cretaceous to Late
Jurassic and one yielding an age of 1582.1±22.2 Ma (not shown in plots). The remaining forty-
two analyses yielded a weighted mean 206Pb/238U age of 80.43±0.62 Ma (MSWD = 1.10).
Sample GM-5 was collected from a Jurassic diorite pluton, located in the NW portion of the
range, mapped as Jd. A total of thirty-seven spot analyses were obtained from this sample. Five
analyses yielded discordant ages; these analyses were rejected from the age calculation. The
remaining thirty-two analyses yielded a weighted mean 206Pb/238U age of 158.1±1.4 Ma (MSWD
= 1.07). The mean age of 158.1±1.4 Ma is interpreted to be the crystallization age for this pluton.
This is within analytical error of the age from the Jurassic diorite dated in the Bristol Mountains.
Sample GM138 was collected by Kula (unpublished) from a Jurassic leucogranite, within the
hanging wall of the BCF. Fifty-eight spot analyses were obtained from this sample. Three analyses
were rejected from the dataset; two were interpreted as inherited ages, and one was anomalously
young, which is likely a bad analysis or significant Pb loss had occurred. The remaining fifty-
five analyses were used to determine the crystallization age for this pluton. These data yielded
a weighted mean 206Pb/238U age of 160.3±1.2 Ma (MSWD =1.8).
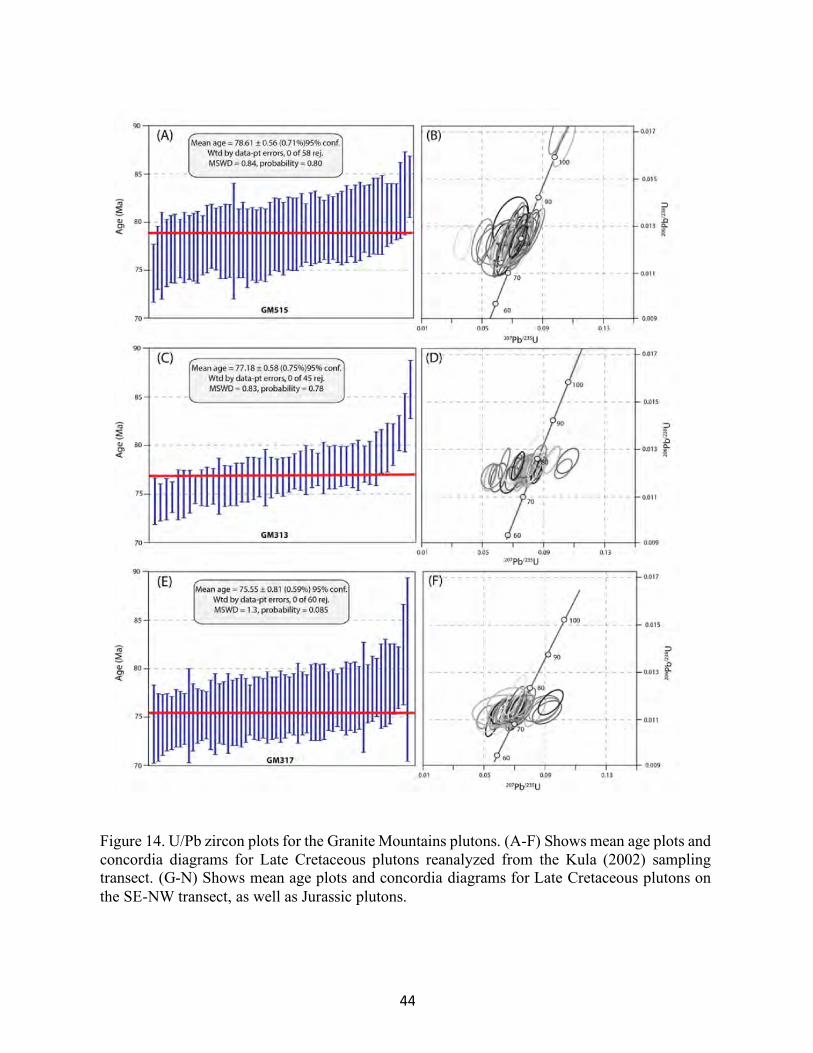
44
Figure 14. U/Pb zircon plots for the Granite Mountains plutons. (A-F) Shows mean age plots and concordia diagrams for Late Cretaceous plutons reanalyzed from the Kula (2002) sampling transect. (G-N) Shows mean age plots and concordia diagrams for Late Cretaceous plutons on the SE-NW transect, as well as Jurassic plutons.
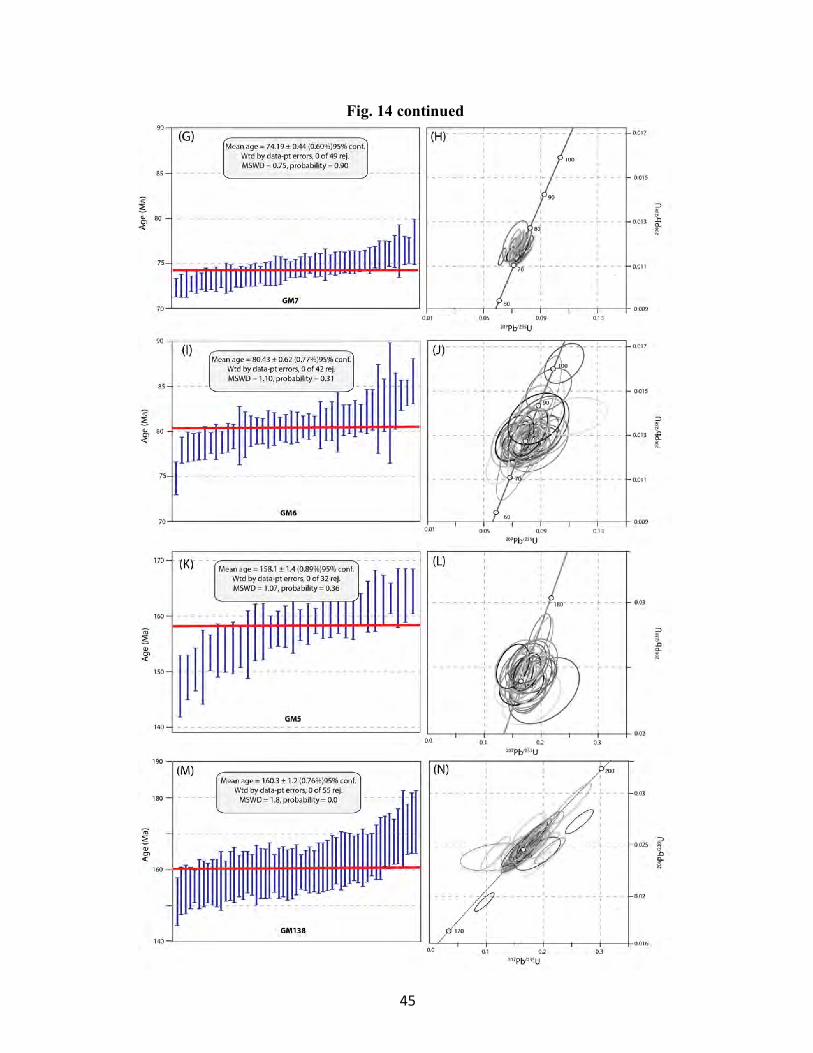
45
Fig. 14 continued
46
4.4 40Ar/39Ar Thermochronology
Five samples from the Bristol Mountains were collected from the footwall and from within
the mylonitic shear zone for 40Ar/39Ar thermochronology analyses. Samples were collected on a
transect parallel to transport direction of the shear zone, spanning the footwall on spacing intervals
of ~1 km. Sample locations are shown in Figure 7. From the five samples we analyzed four biotite,
one muscovite, and two K-feldspar separates to determine thermal histories of Cretaceous plutons.
Additionally, two samples from the Granite Mountains were collected for 40Ar/39Ar
thermochronology to build off the dataset of Kula (2002). Kula (2002) presented hornblende and
K-feldspar analyses from three locations across the Granites Mountains on a NE-SW sampling
transect. This study utilized the central sample of Kula (2002) to assess the cooling history along
a sampling transect that is parallel to the BCF and shear zone transport direction. From the two
additional samples in the Granite Mountains, one hornblende, two biotite, and two K-feldspar
separates were analyzed.
4.4.1 Bristol Mountains
Muscovite and Biotite
Four biotite (B) and one muscovite (M) were sampled from the Bristol Mountains transect,
and are reported below. Biotite in the four samples are of magmatic origin, being a dominant rock
forming mineral. Muscovite bearing rocks were only found within highest strain mylonite to
ultra-mylonite along the western boundary of the shear zone.
Sample BM16 yielded a pseudo-plateau biotite age of 73.65±0.35 Ma, for steps 2-8, and a total
gas age of 72.46 ± 0.24 Ma (Figure 15a). Sample BM17 yielded a preferred biotite age of
73.37±0.44 Ma, and a total gas age of 72.55±0.24 Ma. This sample did not meet the requirements
for a plateau age. Step 10 yielded a slightly older age than steps 2-9 and 11-14. Removing steps
47
1 and 10 yields the preferred age (Figure 15b). Biotite sample BM18 from the mapped Kg unit
is located within the mylonitic shear zone, adjacent to the sample BM13. This sample yielded a
total gas age of 75.17±0.07 Ma. Steps 1 and 2, as well as step 12 yielded low argon release.
Steps 3 through 11, with >90% 40Ar release, were used to determine a preferred age of
74.97±0.22 Ma (Figure 15c). This age is within analytical error of the U/Pb zircon crystallization
age. Sample BM9 yielded a preferred biotite age of 71.94±0.24 Ma, and a total gas age of
71.23±0.24 Ma. Step 9 yielded a slightly younger age than steps 2-8 and 10-14 making this
sample fail the plateau age constraints. Step 1 and 9 were removed to obtain the preferred age
for this sample (Figure 15d). Muscovite from sample BM13, from within the shear zone, yielded
a plateau age of 72.57±0.80 Ma, from steps 1-13 (Figure 15e). This sample yielded a slightly
higher error despite the well- constrained plateau age, due to decreased mass spectrometer
sensitivity at the time of analysis. The muscovite plateau age of 72.57±0.80 Ma, from sample
BM13 is interpreted to be best age for cooling for this pluton. As it is unlikely to expect significant
differences in cooling over such short distances, we regard sample BM18 biotite to be affected by
excess Ar.
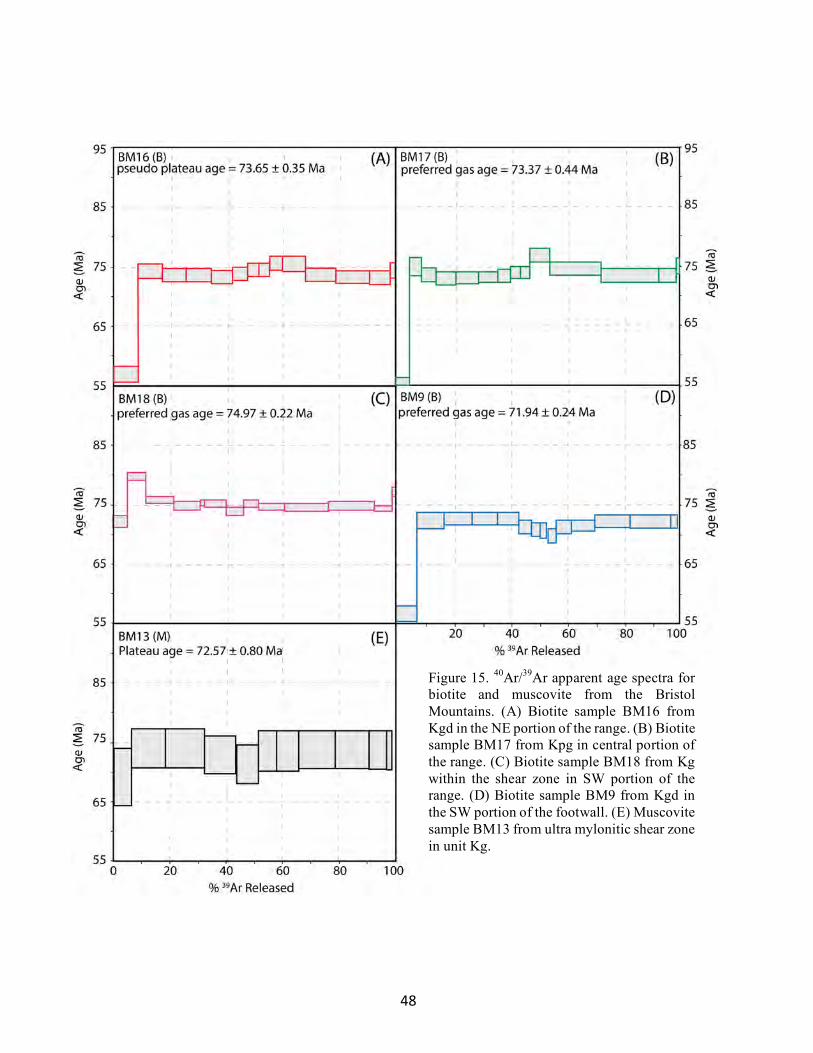
48
Figure 15. 40Ar/39Ar apparent age spectra for biotite and muscovite from the Bristol Mountains. (A) Biotite sample BM16 from Kgd in the NE portion of the range. (B) Biotite sample BM17 from Kpg in central portion of the range. (C) Biotite sample BM18 from Kg within the shear zone in SW portion of the range. (D) Biotite sample BM9 from Kgd in the SW portion of the footwall. (E) Muscovite sample BM13 from ultra mylonitic shear zone in unit Kg.
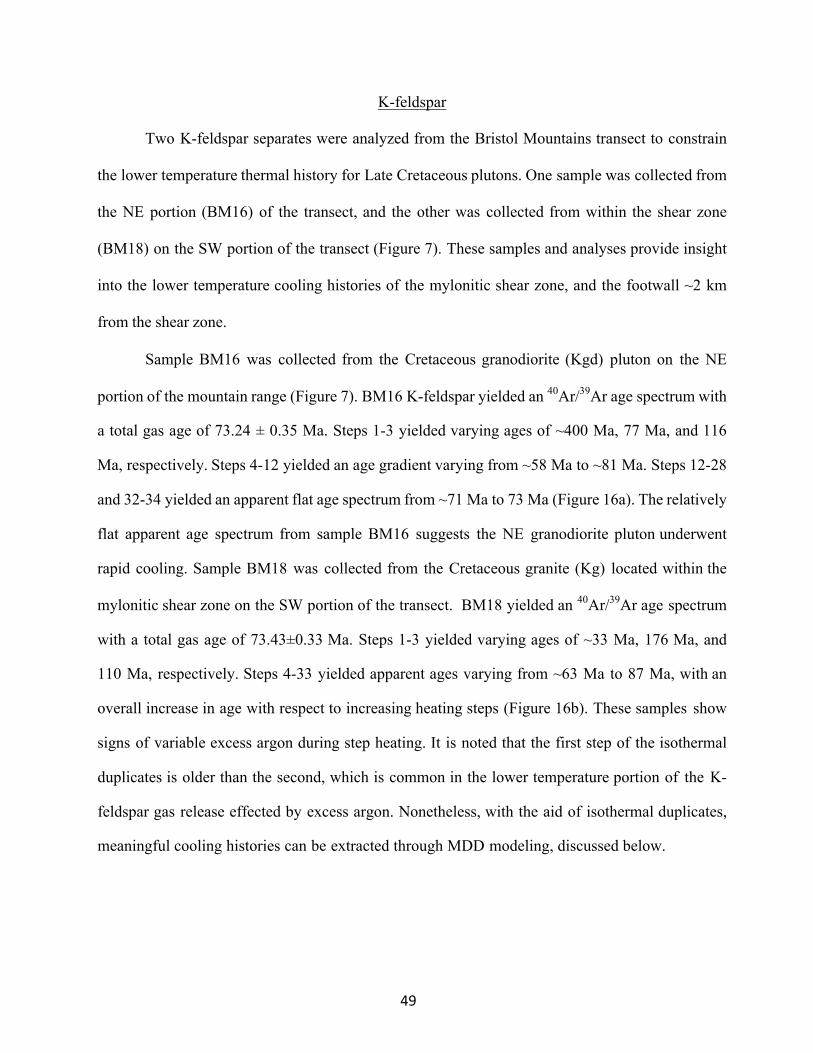
49
K-feldspar
Two K-feldspar separates were analyzed from the Bristol Mountains transect to constrain
the lower temperature thermal history for Late Cretaceous plutons. One sample was collected from
the NE portion (BM16) of the transect, and the other was collected from within the shear zone
(BM18) on the SW portion of the transect (Figure 7). These samples and analyses provide insight
into the lower temperature cooling histories of the mylonitic shear zone, and the footwall ~2 km
from the shear zone.
Sample BM16 was collected from the Cretaceous granodiorite (Kgd) pluton on the NE
portion of the mountain range (Figure 7). BM16 K-feldspar yielded an 40Ar/39Ar age spectrum with
a total gas age of 73.24 ± 0.35 Ma. Steps 1-3 yielded varying ages of ~400 Ma, 77 Ma, and 116
Ma, respectively. Steps 4-12 yielded an age gradient varying from ~58 Ma to ~81 Ma. Steps 12-28
and 32-34 yielded an apparent flat age spectrum from ~71 Ma to 73 Ma (Figure 16a). The relatively
flat apparent age spectrum from sample BM16 suggests the NE granodiorite pluton underwent
rapid cooling. Sample BM18 was collected from the Cretaceous granite (Kg) located within the
mylonitic shear zone on the SW portion of the transect. BM18 yielded an 40Ar/39Ar age spectrum
with a total gas age of 73.43±0.33 Ma. Steps 1-3 yielded varying ages of ~33 Ma, 176 Ma, and
110 Ma, respectively. Steps 4-33 yielded apparent ages varying from ~63 Ma to 87 Ma, with an
overall increase in age with respect to increasing heating steps (Figure 16b). These samples show
signs of variable excess argon during step heating. It is noted that the first step of the isothermal
duplicates is older than the second, which is common in the lower temperature portion of the K-
feldspar gas release effected by excess argon. Nonetheless, with the aid of isothermal duplicates,
meaningful cooling histories can be extracted through MDD modeling, discussed below.
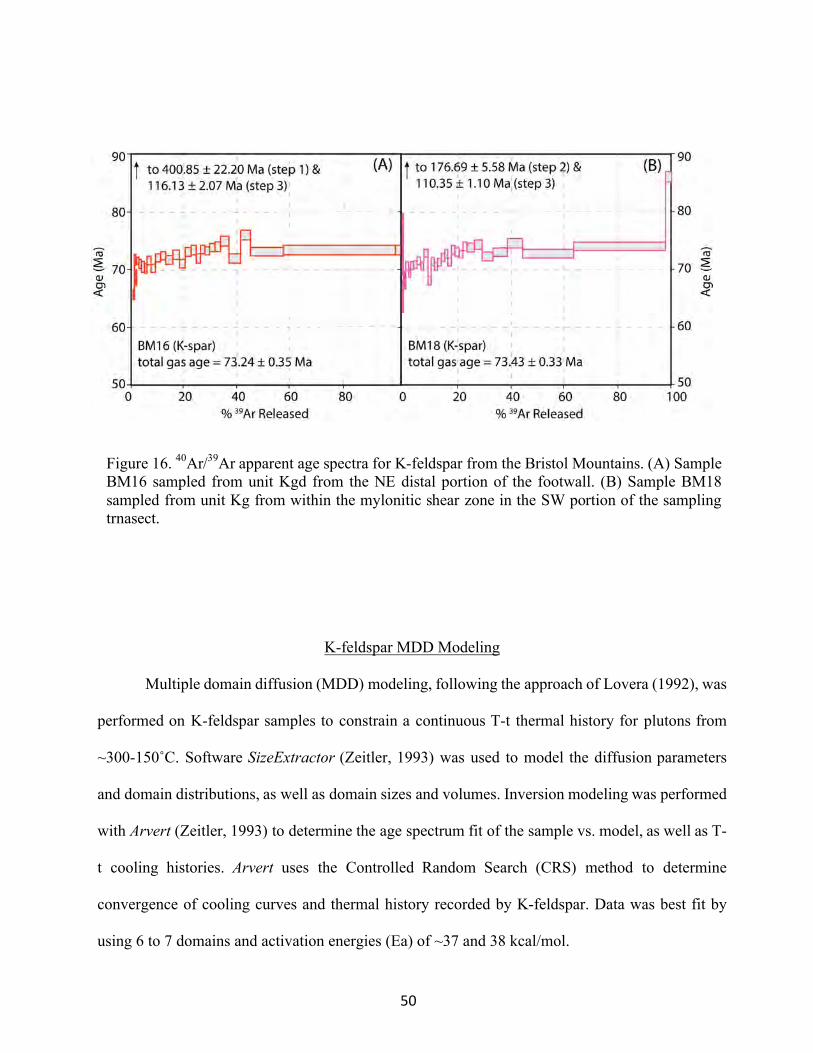
50
K-feldspar MDD Modeling
Multiple domain diffusion (MDD) modeling, following the approach of Lovera (1992), was
performed on K-feldspar samples to constrain a continuous T-t thermal history for plutons from
~300-150˚C. Software SizeExtractor (Zeitler, 1993) was used to model the diffusion parameters
and domain distributions, as well as domain sizes and volumes. Inversion modeling was performed
with Arvert (Zeitler, 1993) to determine the age spectrum fit of the sample vs. model, as well as T-
t cooling histories. Arvert uses the Controlled Random Search (CRS) method to determine
convergence of cooling curves and thermal history recorded by K-feldspar. Data was best fit by
using 6 to 7 domains and activation energies (Ea) of ~37 and 38 kcal/mol.
Figure 16. 40Ar/39Ar apparent age spectra for K-feldspar from the Bristol Mountains. (A) Sample BM16 sampled from unit Kgd from the NE distal portion of the footwall. (B) Sample BM18 sampled from unit Kg from within the mylonitic shear zone in the SW portion of the sampling trnasect.
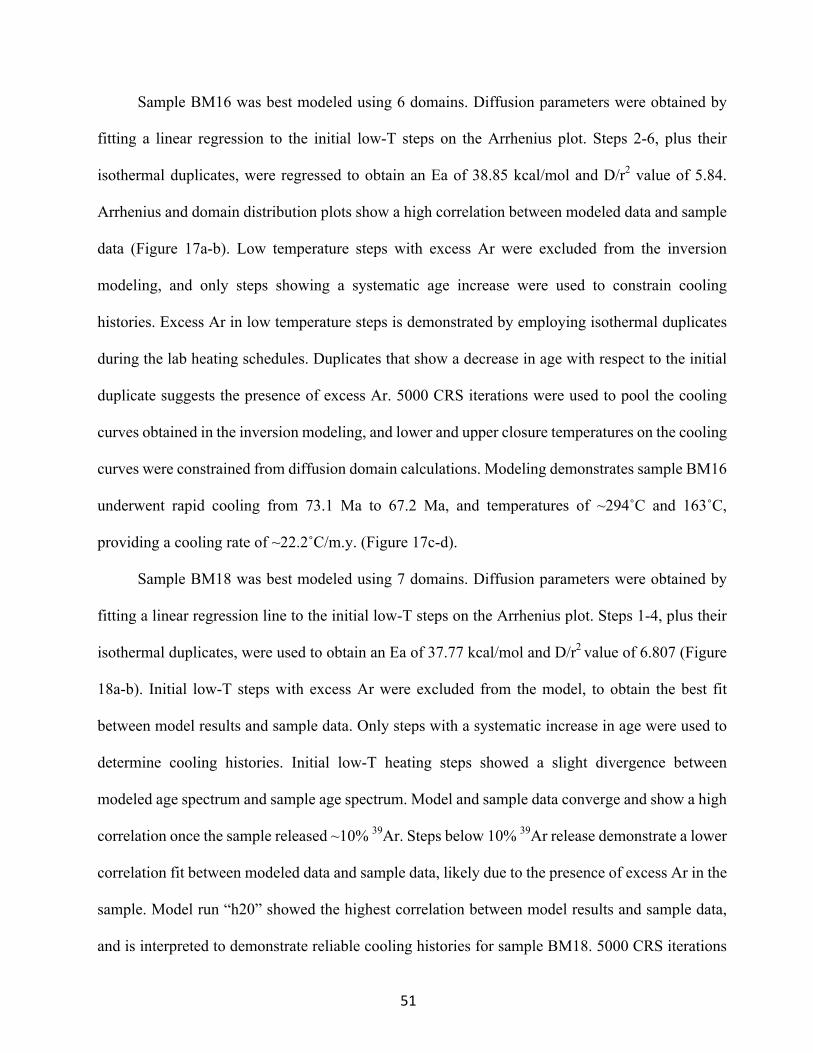
51
Sample BM16 was best modeled using 6 domains. Diffusion parameters were obtained by
fitting a linear regression to the initial low-T steps on the Arrhenius plot. Steps 2-6, plus their
isothermal duplicates, were regressed to obtain an Ea of 38.85 kcal/mol and D/r2 value of 5.84.
Arrhenius and domain distribution plots show a high correlation between modeled data and sample
data (Figure 17a-b). Low temperature steps with excess Ar were excluded from the inversion
modeling, and only steps showing a systematic age increase were used to constrain cooling
histories. Excess Ar in low temperature steps is demonstrated by employing isothermal duplicates
during the lab heating schedules. Duplicates that show a decrease in age with respect to the initial
duplicate suggests the presence of excess Ar. 5000 CRS iterations were used to pool the cooling
curves obtained in the inversion modeling, and lower and upper closure temperatures on the cooling
curves were constrained from diffusion domain calculations. Modeling demonstrates sample BM16
underwent rapid cooling from 73.1 Ma to 67.2 Ma, and temperatures of ~294˚C and 163˚C,
providing a cooling rate of ~22.2˚C/m.y. (Figure 17c-d).
Sample BM18 was best modeled using 7 domains. Diffusion parameters were obtained by
fitting a linear regression line to the initial low-T steps on the Arrhenius plot. Steps 1-4, plus their
isothermal duplicates, were used to obtain an Ea of 37.77 kcal/mol and D/r2 value of 6.807 (Figure
18a-b). Initial low-T steps with excess Ar were excluded from the model, to obtain the best fit
between model results and sample data. Only steps with a systematic increase in age were used to
determine cooling histories. Initial low-T heating steps showed a slight divergence between
modeled age spectrum and sample age spectrum. Model and sample data converge and show a high
correlation once the sample released ~10% 39Ar. Steps below 10% 39Ar release demonstrate a lower
correlation fit between modeled data and sample data, likely due to the presence of excess Ar in the
sample. Model run “h20” showed the highest correlation between model results and sample data,
and is interpreted to demonstrate reliable cooling histories for sample BM18. 5000 CRS iterations
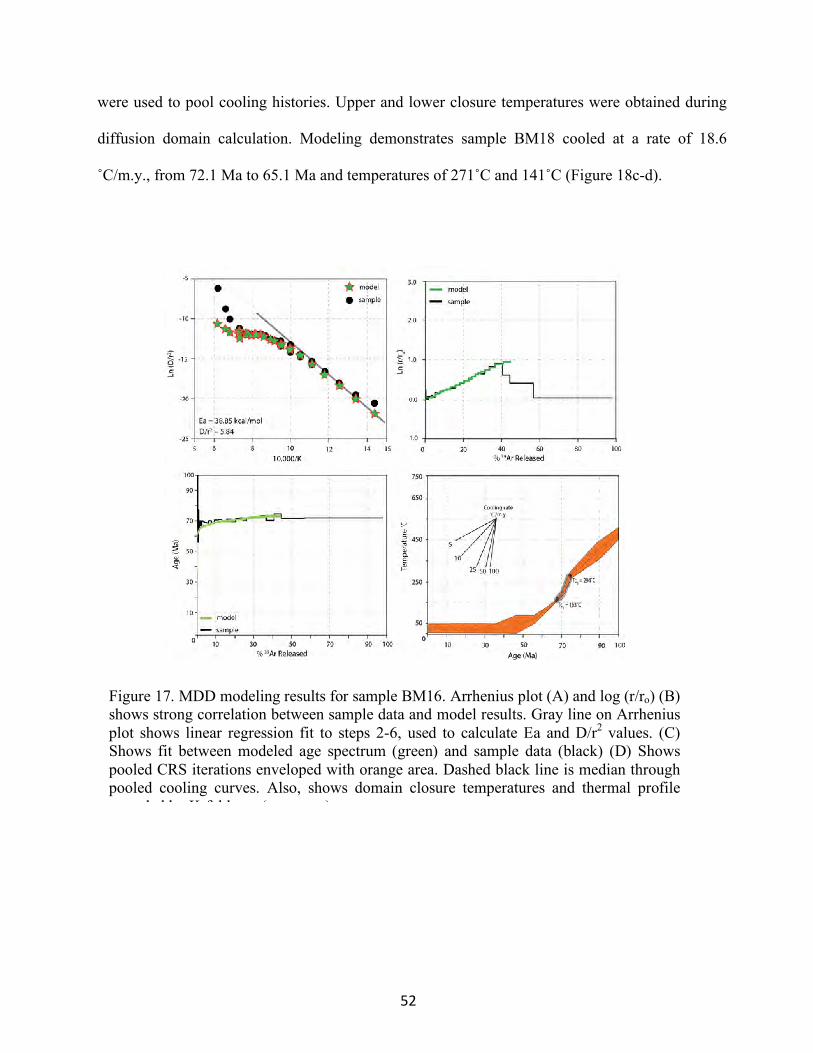
52
were used to pool cooling histories. Upper and lower closure temperatures were obtained during
diffusion domain calculation. Modeling demonstrates sample BM18 cooled at a rate of 18.6
˚C/m.y., from 72.1 Ma to 65.1 Ma and temperatures of 271˚C and 141˚C (Figure 18c-d).
Figure 17. MDD modeling results for sample BM16. Arrhenius plot (A) and log (r/ro) (B) shows strong correlation between sample data and model results. Gray line on Arrhenius plot shows linear regression fit to steps 2-6, used to calculate Ea and D/r2 values. (C) Shows fit between modeled age spectrum (green) and sample data (black) (D) Shows pooled CRS iterations enveloped with orange area. Dashed black line is median through pooled cooling curves. Also, shows domain closure temperatures and thermal profile recorded by K-feldpsar (gray area).
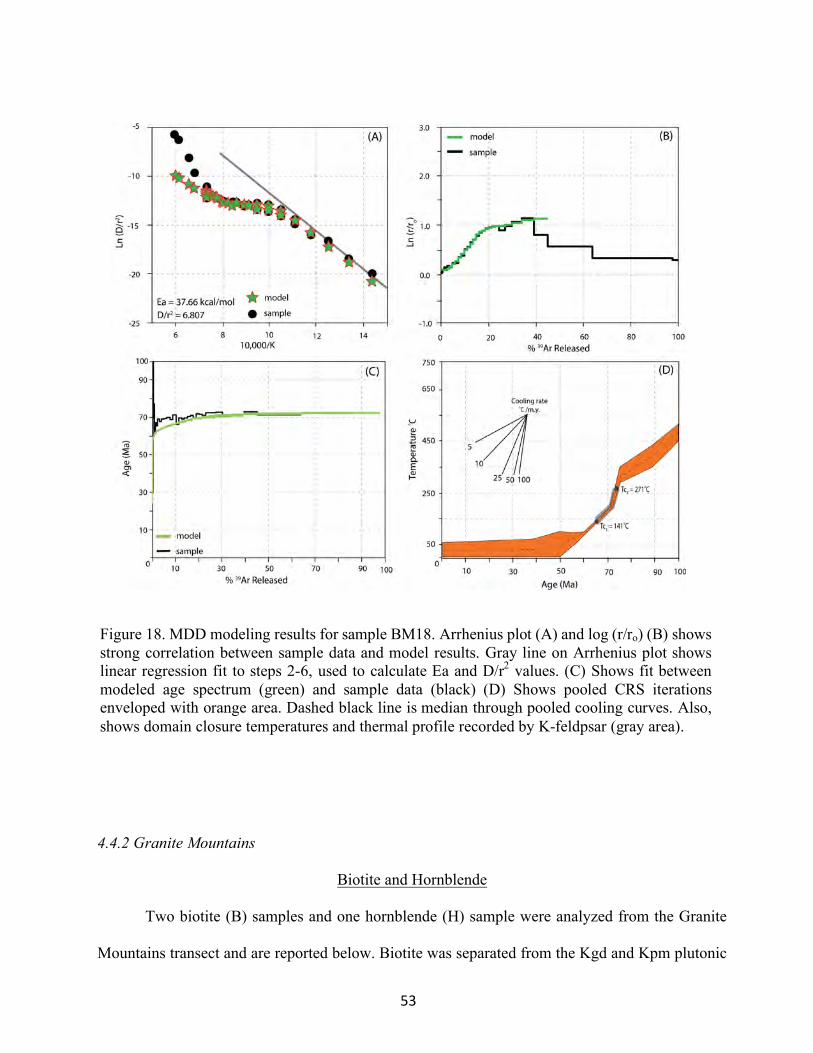
53
4.4.2 Granite Mountains
Biotite and Hornblende
Two biotite (B) samples and one hornblende (H) sample were analyzed from the Granite
Mountains transect and are reported below. Biotite was separated from the Kgd and Kpm plutonic
Figure 18. MDD modeling results for sample BM18. Arrhenius plot (A) and log (r/ro) (B) shows strong correlation between sample data and model results. Gray line on Arrhenius plot shows linear regression fit to steps 2-6, used to calculate Ea and D/r2 values. (C) Shows fit between modeled age spectrum (green) and sample data (black) (D) Shows pooled CRS iterations enveloped with orange area. Dashed black line is median through pooled cooling curves. Also, shows domain closure temperatures and thermal profile recorded by K-feldpsar (gray area).
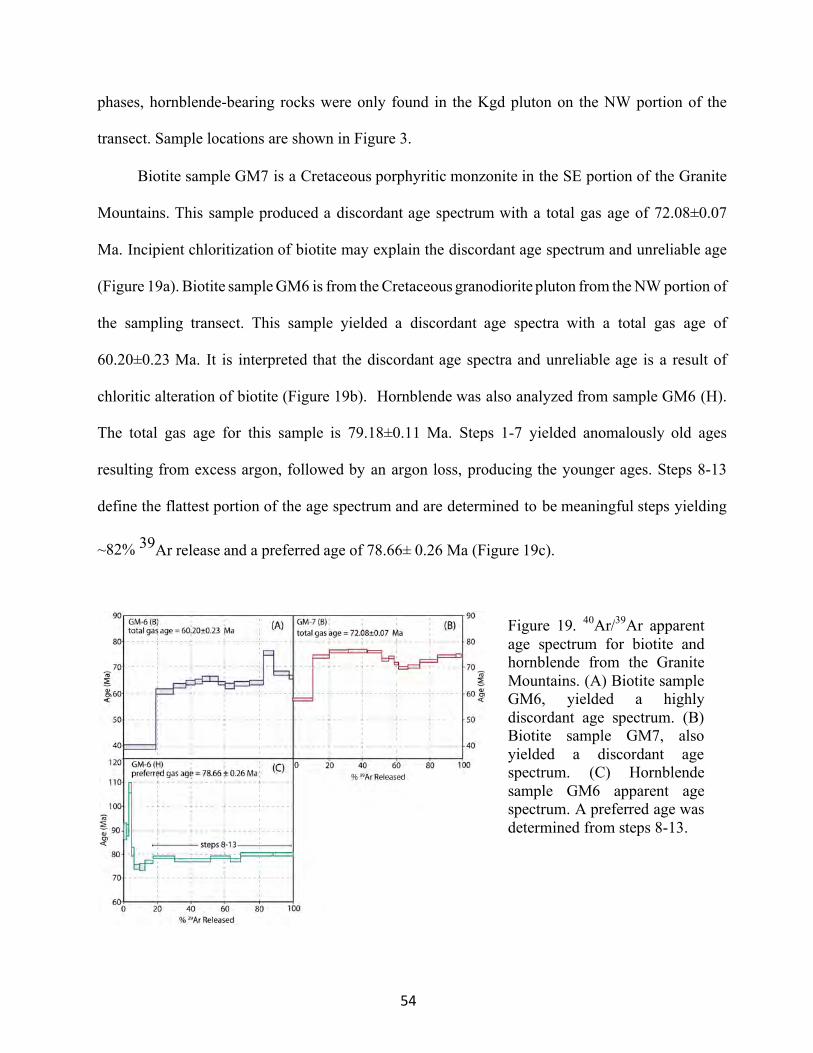
54
phases, hornblende-bearing rocks were only found in the Kgd pluton on the NW portion of the
transect. Sample locations are shown in Figure 3.
Biotite sample GM7 is a Cretaceous porphyritic monzonite in the SE portion of the Granite
Mountains. This sample produced a discordant age spectrum with a total gas age of 72.08±0.07
Ma. Incipient chloritization of biotite may explain the discordant age spectrum and unreliable age
(Figure 19a). Biotite sample GM6 is from the Cretaceous granodiorite pluton from the NW portion of
the sampling transect. This sample yielded a discordant age spectra with a total gas age of
60.20±0.23 Ma. It is interpreted that the discordant age spectra and unreliable age is a result of
chloritic alteration of biotite (Figure 19b). Hornblende was also analyzed from sample GM6 (H).
The total gas age for this sample is 79.18±0.11 Ma. Steps 1-7 yielded anomalously old ages
resulting from excess argon, followed by an argon loss, producing the younger ages. Steps 8-13
define the flattest portion of the age spectrum and are determined to be meaningful steps yielding
~82% 39Ar release and a preferred age of 78.66± 0.26 Ma (Figure 19c).
Figure 19. 40Ar/39Ar apparent age spectrum for biotite and hornblende from the Granite Mountains. (A) Biotite sample GM6, yielded a highly discordant age spectrum. (B) Biotite sample GM7, also yielded a discordant age spectrum. (C) Hornblende sample GM6 apparent age spectrum. A preferred age was determined from steps 8-13.
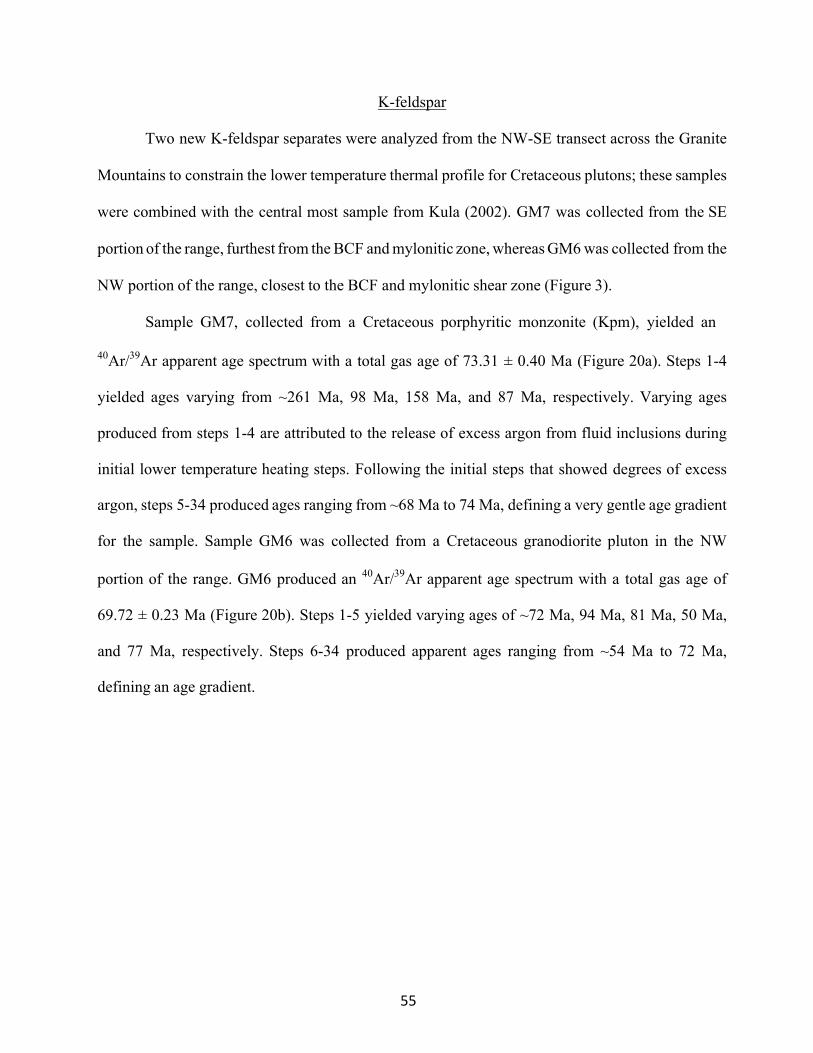
55
K-feldspar
Two new K-feldspar separates were analyzed from the NW-SE transect across the Granite
Mountains to constrain the lower temperature thermal profile for Cretaceous plutons; these samples
were combined with the central most sample from Kula (2002). GM7 was collected from the SE
portion of the range, furthest from the BCF and mylonitic zone, whereas GM6 was collected from the
NW portion of the range, closest to the BCF and mylonitic shear zone (Figure 3).
Sample GM7, collected from a Cretaceous porphyritic monzonite (Kpm), yielded an
40Ar/39Ar apparent age spectrum with a total gas age of 73.31 ± 0.40 Ma (Figure 20a). Steps 1-4
yielded ages varying from ~261 Ma, 98 Ma, 158 Ma, and 87 Ma, respectively. Varying ages
produced from steps 1-4 are attributed to the release of excess argon from fluid inclusions during
initial lower temperature heating steps. Following the initial steps that showed degrees of excess
argon, steps 5-34 produced ages ranging from ~68 Ma to 74 Ma, defining a very gentle age gradient
for the sample. Sample GM6 was collected from a Cretaceous granodiorite pluton in the NW
portion of the range. GM6 produced an 40Ar/39Ar apparent age spectrum with a total gas age of
69.72 ± 0.23 Ma (Figure 20b). Steps 1-5 yielded varying ages of ~72 Ma, 94 Ma, 81 Ma, 50 Ma,
and 77 Ma, respectively. Steps 6-34 produced apparent ages ranging from ~54 Ma to 72 Ma,
defining an age gradient.
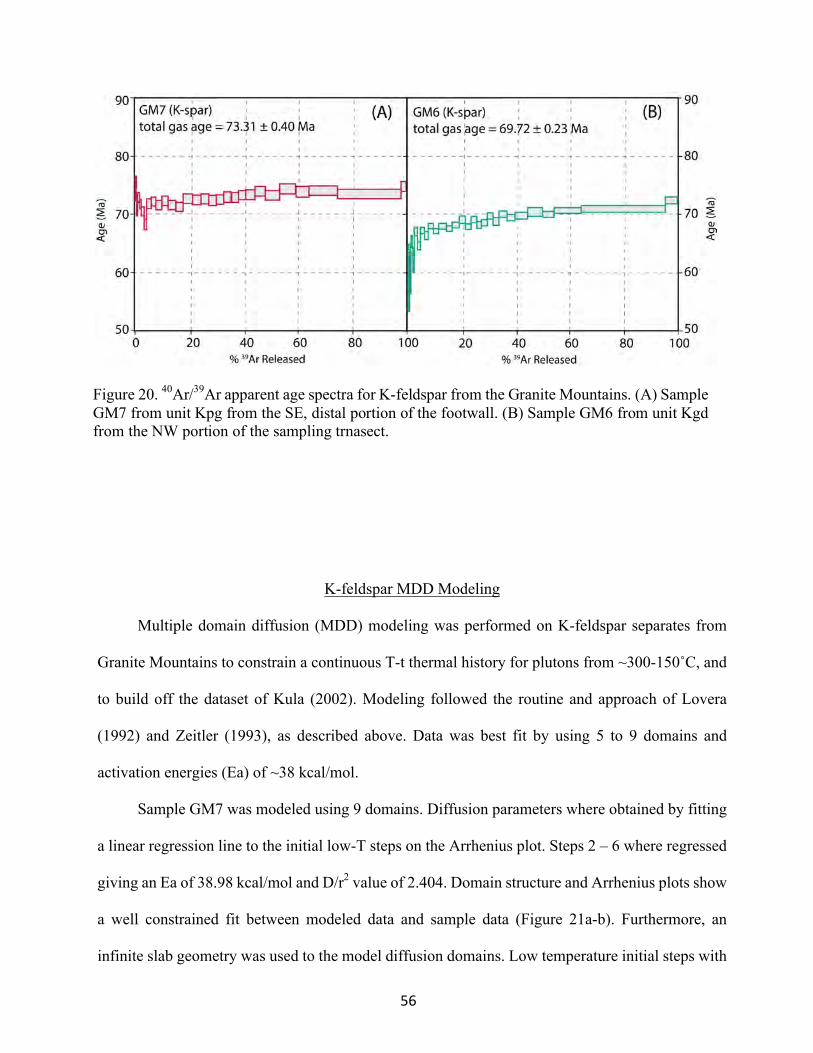
56
K-feldspar MDD Modeling
Multiple domain diffusion (MDD) modeling was performed on K-feldspar separates from
Granite Mountains to constrain a continuous T-t thermal history for plutons from ~300-150˚C, and
to build off the dataset of Kula (2002). Modeling followed the routine and approach of Lovera
(1992) and Zeitler (1993), as described above. Data was best fit by using 5 to 9 domains and
activation energies (Ea) of ~38 kcal/mol.
Sample GM7 was modeled using 9 domains. Diffusion parameters where obtained by fitting
a linear regression line to the initial low-T steps on the Arrhenius plot. Steps 2 – 6 where regressed
giving an Ea of 38.98 kcal/mol and D/r2 value of 2.404. Domain structure and Arrhenius plots show
a well constrained fit between modeled data and sample data (Figure 21a-b). Furthermore, an
infinite slab geometry was used to the model diffusion domains. Low temperature initial steps with
Figure 20. 40Ar/39Ar apparent age spectra for K-feldspar from the Granite Mountains. (A) Sample GM7 from unit Kpg from the SE, distal portion of the footwall. (B) Sample GM6 from unit Kgd from the NW portion of the sampling trnasect.
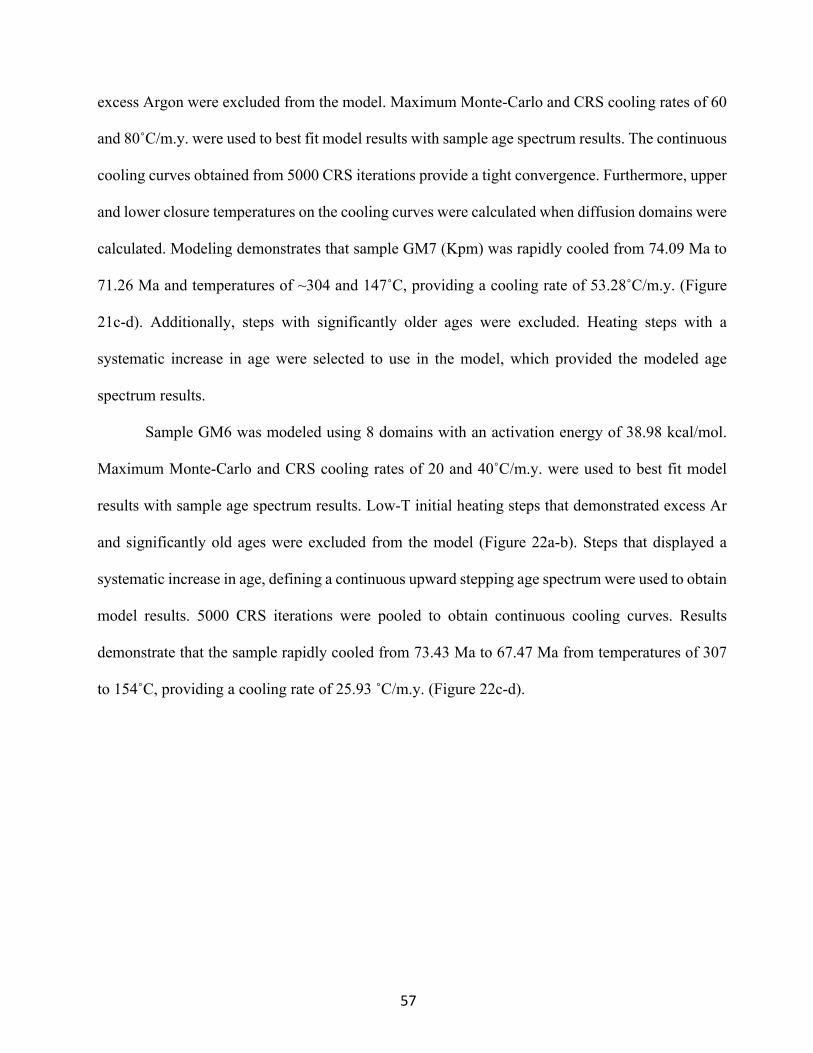
57
excess Argon were excluded from the model. Maximum Monte-Carlo and CRS cooling rates of 60
and 80˚C/m.y. were used to best fit model results with sample age spectrum results. The continuous
cooling curves obtained from 5000 CRS iterations provide a tight convergence. Furthermore, upper
and lower closure temperatures on the cooling curves were calculated when diffusion domains were
calculated. Modeling demonstrates that sample GM7 (Kpm) was rapidly cooled from 74.09 Ma to
71.26 Ma and temperatures of ~304 and 147˚C, providing a cooling rate of 53.28˚C/m.y. (Figure
21c-d). Additionally, steps with significantly older ages were excluded. Heating steps with a
systematic increase in age were selected to use in the model, which provided the modeled age
spectrum results.
Sample GM6 was modeled using 8 domains with an activation energy of 38.98 kcal/mol.
Maximum Monte-Carlo and CRS cooling rates of 20 and 40˚C/m.y. were used to best fit model
results with sample age spectrum results. Low-T initial heating steps that demonstrated excess Ar
and significantly old ages were excluded from the model (Figure 22a-b). Steps that displayed a
systematic increase in age, defining a continuous upward stepping age spectrum were used to obtain
model results. 5000 CRS iterations were pooled to obtain continuous cooling curves. Results
demonstrate that the sample rapidly cooled from 73.43 Ma to 67.47 Ma from temperatures of 307
to 154˚C, providing a cooling rate of 25.93 ˚C/m.y. (Figure 22c-d).
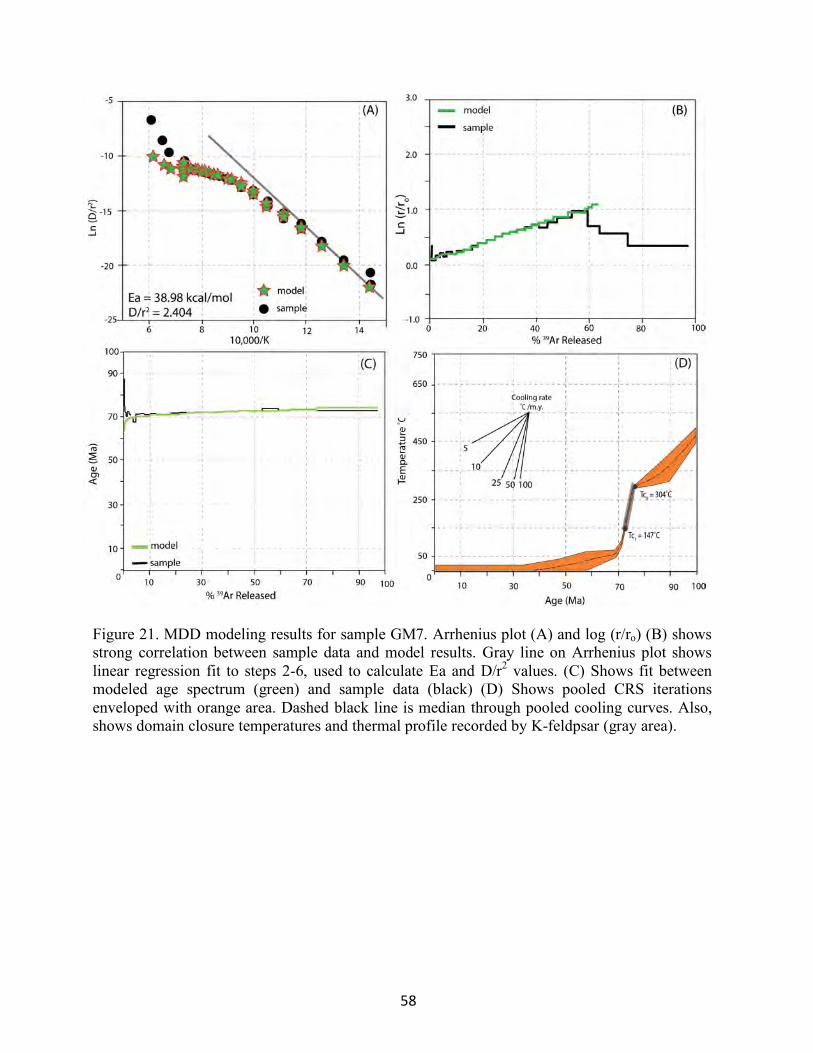
58
Figure 21. MDD modeling results for sample GM7. Arrhenius plot (A) and log (r/ro) (B) shows strong correlation between sample data and model results. Gray line on Arrhenius plot shows linear regression fit to steps 2-6, used to calculate Ea and D/r2 values. (C) Shows fit between modeled age spectrum (green) and sample data (black) (D) Shows pooled CRS iterations enveloped with orange area. Dashed black line is median through pooled cooling curves. Also, shows domain closure temperatures and thermal profile recorded by K-feldpsar (gray area).
59
4.5 Reconstructed T-t profiles
U/Pb zircon geochronology, 40Ar/39Ar thermochronology, and Multiple Domain Diffusion
modeling of K-feldspar provide insight into the temperature-time thermal histories of plutonic rocks
from crystallization at ~750 ˚C through K-feldspar small domain closure temperatures of ~150
Figure 22. MDD modeling results for sample GM6. Arrhenius plot (A) and log (r/ro) (B) shows strong correlation between sample data and model results. Gray line on Arrhenius plot shows linear regression fit to steps 2-6, used to calculate Ea and D/r2 values. (C) Shows fit between modeled age spectrum (green) and sample data (black) (D) Shows pooled CRS iterations enveloped with orange area. Dashed black line is median through pooled cooling curves. Also, shows domain closure temperatures and thermal profile recorded by K-feldpsar (gray area).
60
˚C. Furthermore, cooling rates can be inferred between T-t points and through continuous cooling
curves of modeled K-feldspar. Thus, T-t cooling curves can be reconstructed.
For the Granite Mountains, this study adds two new reconstructed T-t profiles (GM6 and
GM7), which, combined with the central most sample from Kula (2002) provides a NW-SE
transect. Sample GM7 from the SE portion of the Granite Mountains yielded a U/Pb zircon
crystallization age of 74.19 ± 0.93 Ma. GM7 yielded a discordant biotite age spectrum and we
don’t use it in cooling history construction. MDD modeling of K-feldspar indicates GM7 continued
to cool rapidly from 74.09 Ma to 71.26 Ma, from ~304 ˚C to 147 ˚C. Modeled MDD cooling curves
indicate a cooling rate of 53 ˚C/m.y. Additionally, the cooling rate from emplacement temperatures
through lower K-feldspar MDD closure temperatures is ~204 ˚C/m.y. (Figure 23a). The U/Pb
crystallization age and upper MDD K-feldspar age are all concordant for the sample, suggesting
almost instantaneous cooling from ~750 ˚C to ~300 ˚C. This is likely due to very rapid denudation
of the pluton during extension or emplacement at very shallow crustal levels followed by rapid
thermal equilibration with the surrounding country rock, and is interpreted herein to be an artifact
of both. Given the younger age and position within the Granite Mountains, and the fact that this
74 Ma pluton crystallized while the older Late Cretaceous plutons were undergoing rapid cooling,
this pluton was likely emplaced during extension and rapid exhumation into shallow crustal levels
followed by continued cooling and exhumation.
Sample GM6 is from the NW Granite Mountains and is closest to the mylonitic shear zone
and the BCF. GM6 yielded a zircon crystallization age of 80.43 ± 0.97 Ma and a hornblende
preferred age of 78.66 ± 0.26 Ma, indicating the pluton cooled at a rate of ~141˚C/m.y. from
emplacement through ~500 ˚C. The biotite analysis yielded a highly-disrupted age spectra, with
most steps yielding ages not consistent with the hornblende and K-feldspar analyses, and is not
considered in the T-t reconstruction. Sample GM6 cooled from 78.66 Ma to 73.43 Ma at a rate of
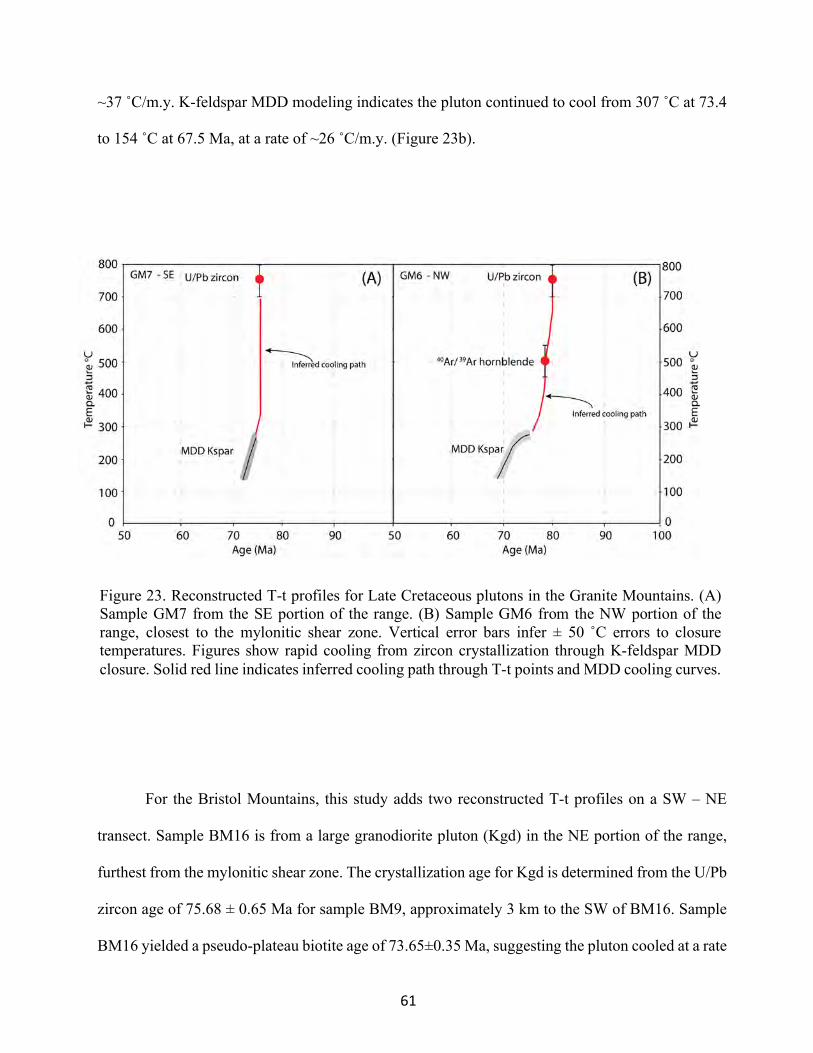
61
~37 ˚C/m.y. K-feldspar MDD modeling indicates the pluton continued to cool from 307 ˚C at 73.4
to 154 ˚C at 67.5 Ma, at a rate of ~26 ˚C/m.y. (Figure 23b).
For the Bristol Mountains, this study adds two reconstructed T-t profiles on a SW – NE
transect. Sample BM16 is from a large granodiorite pluton (Kgd) in the NE portion of the range,
furthest from the mylonitic shear zone. The crystallization age for Kgd is determined from the U/Pb
zircon age of 75.68 ± 0.65 Ma for sample BM9, approximately 3 km to the SW of BM16. Sample
BM16 yielded a pseudo-plateau biotite age of 73.65±0.35 Ma, suggesting the pluton cooled at a rate
Figure 23. Reconstructed T-t profiles for Late Cretaceous plutons in the Granite Mountains. (A) Sample GM7 from the SE portion of the range. (B) Sample GM6 from the NW portion of the range, closest to the mylonitic shear zone. Vertical error bars infer ± 50 ˚C errors to closure temperatures. Figures show rapid cooling from zircon crystallization through K-feldspar MDD closure. Solid red line indicates inferred cooling path through T-t points and MDD cooling curves.
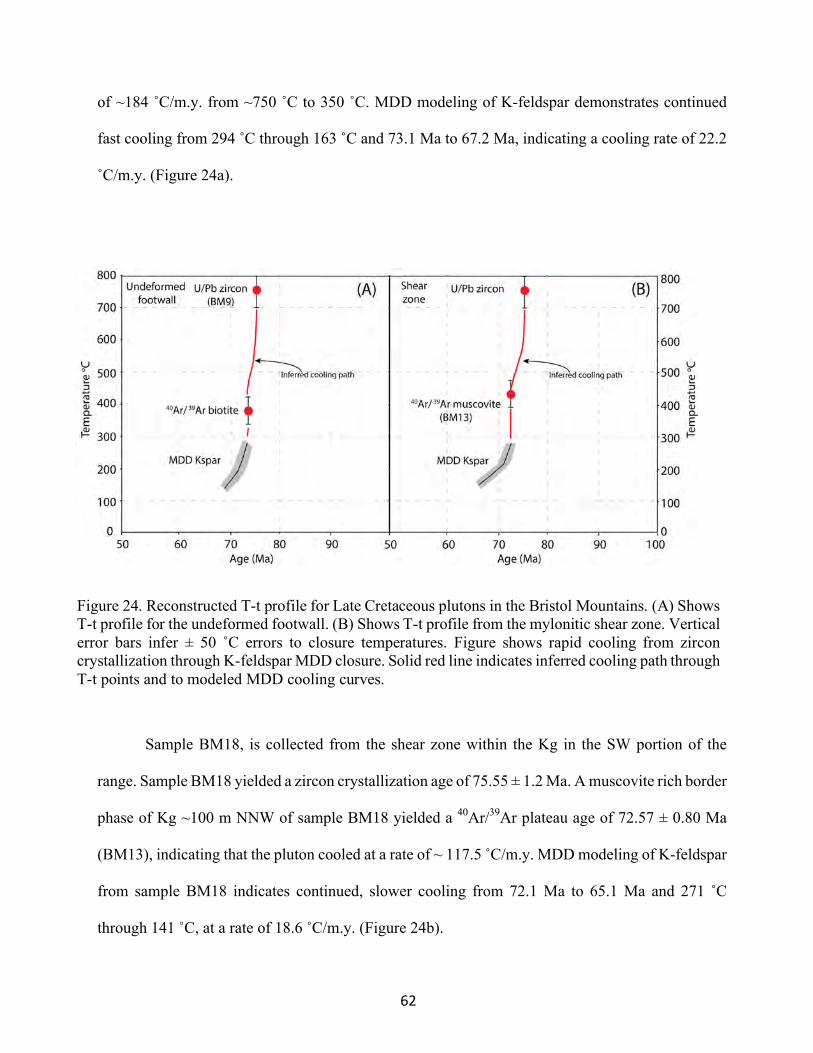
62
of ~184 ˚C/m.y. from ~750 ˚C to 350 ˚C. MDD modeling of K-feldspar demonstrates continued
fast cooling from 294 ˚C through 163 ˚C and 73.1 Ma to 67.2 Ma, indicating a cooling rate of 22.2
˚C/m.y. (Figure 24a).
Sample BM18, is collected from the shear zone within the Kg in the SW portion of the
range. Sample BM18 yielded a zircon crystallization age of 75.55 ± 1.2 Ma. A muscovite rich border
phase of Kg ~100 m NNW of sample BM18 yielded a 40Ar/39Ar plateau age of 72.57 ± 0.80 Ma
(BM13), indicating that the pluton cooled at a rate of ~ 117.5 ˚C/m.y. MDD modeling of K-feldspar
from sample BM18 indicates continued, slower cooling from 72.1 Ma to 65.1 Ma and 271 ˚C
through 141 ˚C, at a rate of 18.6 ˚C/m.y. (Figure 24b).
Figure 24. Reconstructed T-t profile for Late Cretaceous plutons in the Bristol Mountains. (A) Shows T-t profile for the undeformed footwall. (B) Shows T-t profile from the mylonitic shear zone. Vertical error bars infer ± 50 ˚C errors to closure temperatures. Figure shows rapid cooling from zircon crystallization through K-feldspar MDD closure. Solid red line indicates inferred cooling path through T-t points and to modeled MDD cooling curves.
63
4.5.1 Previous Results – Granite Mountains
Kula (2002) performed U/Pb geochronology, 40Ar/39Ar and U-Th/He thermochronology, as
well as Al-in-hornblende geobarometry on a SW-NE sampling transect of Cretaceous plutonic rocks
across the Granite Mountains, and on a single sample from a Jurassic pluton in the Providence
Mountains to the NE. The goal of the study was to constrain thermal profiles, as well as
emplacement depths for Jurassic and Cretaceous plutons across the transect, to address whether the
Granite Mountains represented a tilted crustal block. Al-in-hornblende geobarometry performed by
Kula (2002) indicate that Late Cretaceous plutons across the range were emplaced at similar depths,
with pressures from ~4.0 to 4.89 kbar, suggesting deep burial of the entire range and not showing
evidence for significant tilting. These pressures correspond to depths ranging from 14.5 to 17 km
in the Late Cretaceous (see Table 1 from Kula, 2002).
Here, we summarize the reconstructed temperature-time (T-t) profiles and geobarometry
results from Kula (2002), integrating the new U/Pb zircon age constraints. The SW monzogranite
sample (GM317) was reanalyzed for zircon U/Pb crystallization age and yielded an age of
75.55±0.81 Ma. U/Pb zircon (this study) and 40Ar/39Ar hornblende (74.80±0.42 Ma; Kula, 2002)
yield indistinguishable ages, demonstrating rapid cooling from zircon crystallization through the
hornblende closure temperature of ~500˚C. Following hornblende closure, sample GM317
experienced slower but still rapid cooling from ~75 Ma (500˚C) to 71 Ma (300˚C), yielding a
cooling rate of ~49˚C/m.y. K-feldspar MDD modeling indicates that from 71 to 69.1 Ma the pluton
cooled at a rate of ~63˚C/m.y. After rapid cooling in the Late Cretaceous, the pluton underwent
very slow cooling until the Miocene, as indicated by a (U-Th)/He apatite age of ~23.6 Ma (Figure
25).
Reanalysis of the central granodiorite sample (GM313) from Kula (2002) yields a U/Pb
zircon crystallization age of 77.18±0.86 Ma, which combined with the prior hornblende plateau age
64
of 76.46±0.53 Ma (Kula, 2002) indicates this pluton cooled rapidly following crystallization.
Between ~76.5 Ma and 71.6 Ma the pluton cooled at a rate of ~60˚C/m.y. through ~293˚C. K-
feldspar MDD data demonstrate further cooling from ~293-157˚C, from 71.6 to 67.3 Ma at a rate
of ~32˚C/m.y. The pluton experienced a period of slow cooling from 67 to 40 Ma, as demonstrated
by a U-Th/He apatite age of ~40.2 Ma (Figure 25).
The NE quartz monzonite sample (GM515) from Kula (2002) was reanalyzed for zircon
U/Pb age, yielding an age of 78.61±0.9 Ma. Zircon analysis from this study and the hornblende age
determined from Kula (2002) of 76.57±0.9 Ma, indicates this pluton experience geologically rapid
cooling after intrusion. Very rapid cooling from 500 ˚C through ~251 ˚C occurred after initial
cooling, at a rate of 67˚C/m.y. (Kula, 2002). K-feldspar data indicate a cooling interval ~251 to
145˚C occurred from 72.9 to 66.3 Ma, constraining a lower cooling rate of ~16˚C/m.y. (Kula, 2002).
An apatite age of ~21.2 Ma demonstrates this pluton underwent slow cooling from ~66 to 22 Ma,
at a rate 1.7˚C/m.y. (Kula, 2002) (Figure 25).
An additional K-feldspar, not reported in Kula (2002), was analyzed by Kula in the Granite
Mountains (Kula, personal communication), from a Jurassic leucogranite pluton (GM138) in the
NW portion of the mountains. Sample GM138 is in a horse block within the BCF. This pluton
yielded an age spectrum and K-feldspar MDD cooling history distinct from the surrounding
Cretaceous plutons, motivating the analysis of zircon crystallization age reported in this study.
Zircon U/Pb crystallization age and 40Ar/39Ar K-feldspar indicate this pluton underwent slow
cooling from ~160 to ~79 Ma at a rate of 4.9˚C/m.y. Additionally, K-feldspar MDD modeling
indicates a cooling rate of 4.3˚C/Ma from ~79 to ~40 Ma (Figure 25).
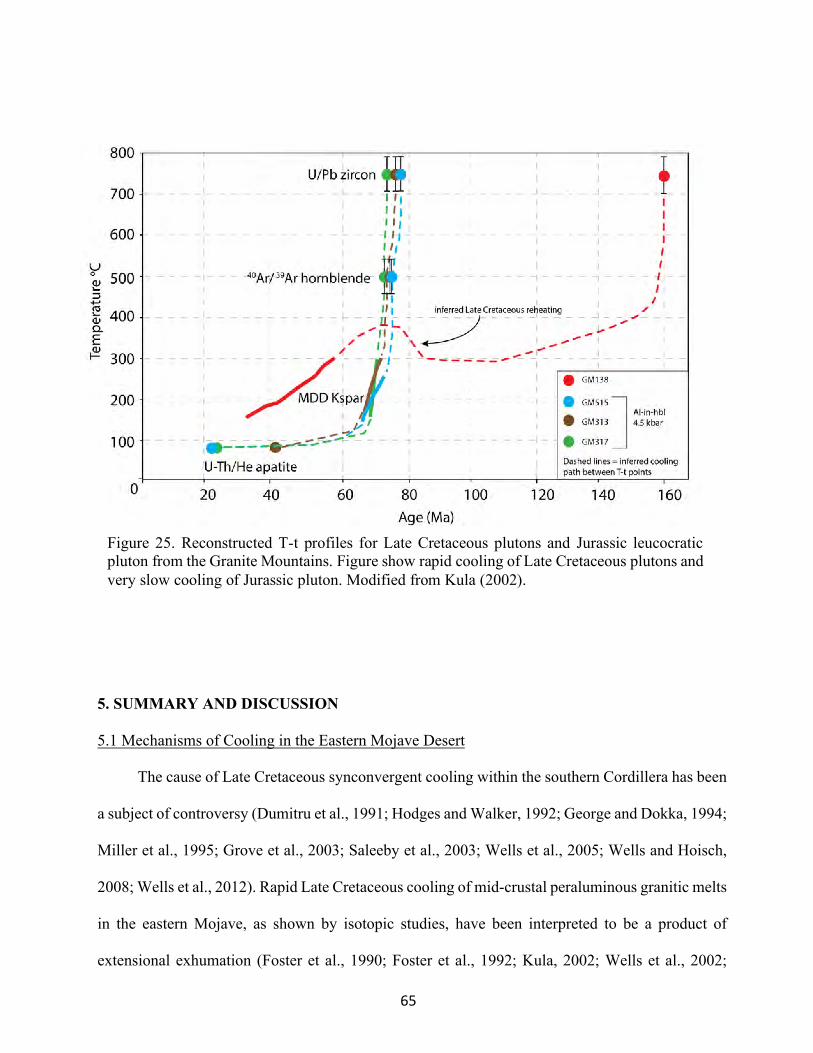
65
5. SUMMARY AND DISCUSSION
5.1 Mechanisms of Cooling in the Eastern Mojave Desert
The cause of Late Cretaceous synconvergent cooling within the southern Cordillera has been
a subject of controversy (Dumitru et al., 1991; Hodges and Walker, 1992; George and Dokka, 1994;
Miller et al., 1995; Grove et al., 2003; Saleeby et al., 2003; Wells et al., 2005; Wells and Hoisch,
2008; Wells et al., 2012). Rapid Late Cretaceous cooling of mid-crustal peraluminous granitic melts
in the eastern Mojave, as shown by isotopic studies, have been interpreted to be a product of
extensional exhumation (Foster et al., 1990; Foster et al., 1992; Kula, 2002; Wells et al., 2002;
Figure 25. Reconstructed T-t profiles for Late Cretaceous plutons and Jurassic leucocratic pluton from the Granite Mountains. Figure show rapid cooling of Late Cretaceous plutons and very slow cooling of Jurassic pluton. Modified from Kula (2002).
66
Wells et al., 2005). Cooling signatures in the southern Cordillera have also been attributed to a
refrigeration effect, which is a manifestation of the Farallon plate flattening beneath North America
and replacing hot asthenosphere with a cold oceanic slab (Dumitru et al., 1992; Jacobson et al.,
1996; Saleeby, 2003). In contrast, cooling of Cretaceous plutons in the Peninsular Range of
southern California has been attributed to erosional exhumation (George and Dokka, 1994; Grove
et al., 2003a). Erosion-induced cooling is also predicted over the Kingman arch, east of the Bristol
and Granite mountains, a paleo-structural high in the California-Nevada-Arizona border region
during the latest Cretaceous to earliest Paleocene (Beard and Faulds, 2010; Young and Hartman,
2014). Uplift was manifest by erosional stripping of Paleozoic and Mesozoic rocks, suggesting that
erosional exhumation was likely a major event post-70 Ma. The timing and geographic extent of
the Kingman arch is poorly understood, and may be a result of Laramide-style end-loading of the
North American plate, basal traction, dynamic uplift following passage of the subducted oceanic
plateau (Liu et al., 2010), or isostatic uplift due to delamination (Wells and Hoisch, 2008).
Other mechanisms explaining Late Cretaceous cooling and exhumation are deliberated
herein. For example, erosional exhumation is considered to have aided in exhumation of mid-crustal
rocks in the latest Cretaceous to early Paleocene. Evidence for the structurally high Kingman arch
in the latest Cretaceous to early Paleocene and subsequent stripping of Paleozoic and Mesozoic
rocks suggests erosion of the southern Cordillera was significant at the time following the wake of
the subducted oceanic plateau. Additionally, lithospheric refrigeration of the eastern Mojave region,
during the Late Cretaceous, is considered trifling. Lithospheric refrigeration may have local effects
and may contribute to the slowing of cooling rates once the leading edge of flat-slab subduction
passed the east Mojave Block sector, but is not considered to be causative mechanism for the
observed rapid cooling. These mechanisms do not alone explain the rapid and region Late
Cretaceous cooling of mid-crustal rocks. The observed rapid cooling therefore requires extensional
67
exhumation, and is postulated to be the major contributor to exhumation and cooling during the
Late Cretaceous, which was trailed by continued exhumation via erosional stripping during the
latest Cretaceous to early Paleocene. The southern Cordillera experienced tectonic quiescence until
the Neogene, when Basin and Range and Eastern California Shear Zone tectonics began to evolve.
5.2 Age of Extensional Deformation in the Granite Mountains
The age of mylonitic deformation is best constrained by combining footwall cooling
histories with deformation temperatures recorded in the shear zone. Mylonitically deformed
granitoid rocks in the Granite Mountains form a discontinuous belt in the footwall of the Bull
Canyon Fault. Mylonitic fabrics are dominately preserved in Jurassic leucocratic plutons and sills
within dioritic plutons. Structural measurements demonstrate an overall geometry and transport
direction of 231˚/28˚NW and 324˚/31˚, respectively. Shear-sense indicators, at the thin-section
scale, consistently show a top-to-the-NW non-coaxial down-dip sense of shear. Geometry, transport
direction, and kinematic indicators suggest that the mylonitic shear zone demonstrates a normal
sense of motion. Microstructures from mylonitic rocks in the Granite Mountains record high
temperatures of deformation (~400 - 600˚C). Incipient gneissic banding is present across the shear
zone, displaying distinct bands of dynamically recrystallized quartz and feldspar. SGR of feldspar
is pervasive throughout the Granite Mountains shear zone suggesting that deformation occurred at
lower amphibolite facies conditions.
New and refined U/Pb geochronology and 40Ar/39Ar thermochronology from the Granite
Mountains indicate that mid-crustal Cretaceous plutons were rapidly cooled after emplacement,
whereas Jurassic rocks experienced slow cooling post emplacement through the Cretaceous. Kula
(2002) reports, from K-feldspar MDD modeling, that the studied plutons cooled through K-feldspar
closure temperatures by ~66 Ma at rates of ~63˚C/m.y., 32˚C/m.y., and 16˚C/m.y., and suggested
that fast cooling rates advocate tectonic exhumation as opposed to erosional exhumation. New
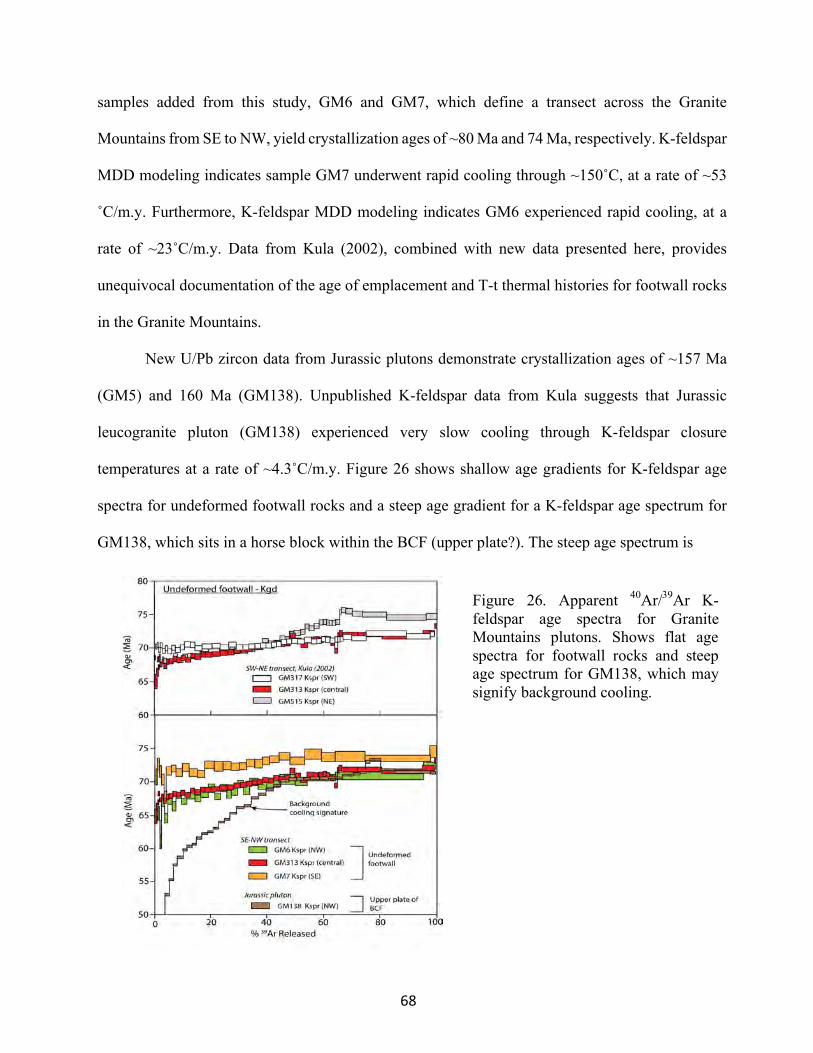
68
samples added from this study, GM6 and GM7, which define a transect across the Granite
Mountains from SE to NW, yield crystallization ages of ~80 Ma and 74 Ma, respectively. K-feldspar
MDD modeling indicates sample GM7 underwent rapid cooling through ~150˚C, at a rate of ~53
˚C/m.y. Furthermore, K-feldspar MDD modeling indicates GM6 experienced rapid cooling, at a
rate of ~23˚C/m.y. Data from Kula (2002), combined with new data presented here, provides
unequivocal documentation of the age of emplacement and T-t thermal histories for footwall rocks
in the Granite Mountains.
New U/Pb zircon data from Jurassic plutons demonstrate crystallization ages of ~157 Ma
(GM5) and 160 Ma (GM138). Unpublished K-feldspar data from Kula suggests that Jurassic
leucogranite pluton (GM138) experienced very slow cooling through K-feldspar closure
temperatures at a rate of ~4.3˚C/m.y. Figure 26 shows shallow age gradients for K-feldspar age
spectra for undeformed footwall rocks and a steep age gradient for a K-feldspar age spectrum for
GM138, which sits in a horse block within the BCF (upper plate?). The steep age spectrum is
Figure 26. Apparent 40Ar/39Ar K-feldspar age spectra for Granite Mountains plutons. Shows flat age spectra for footwall rocks and steep age spectrum for GM138, which may signify background cooling.
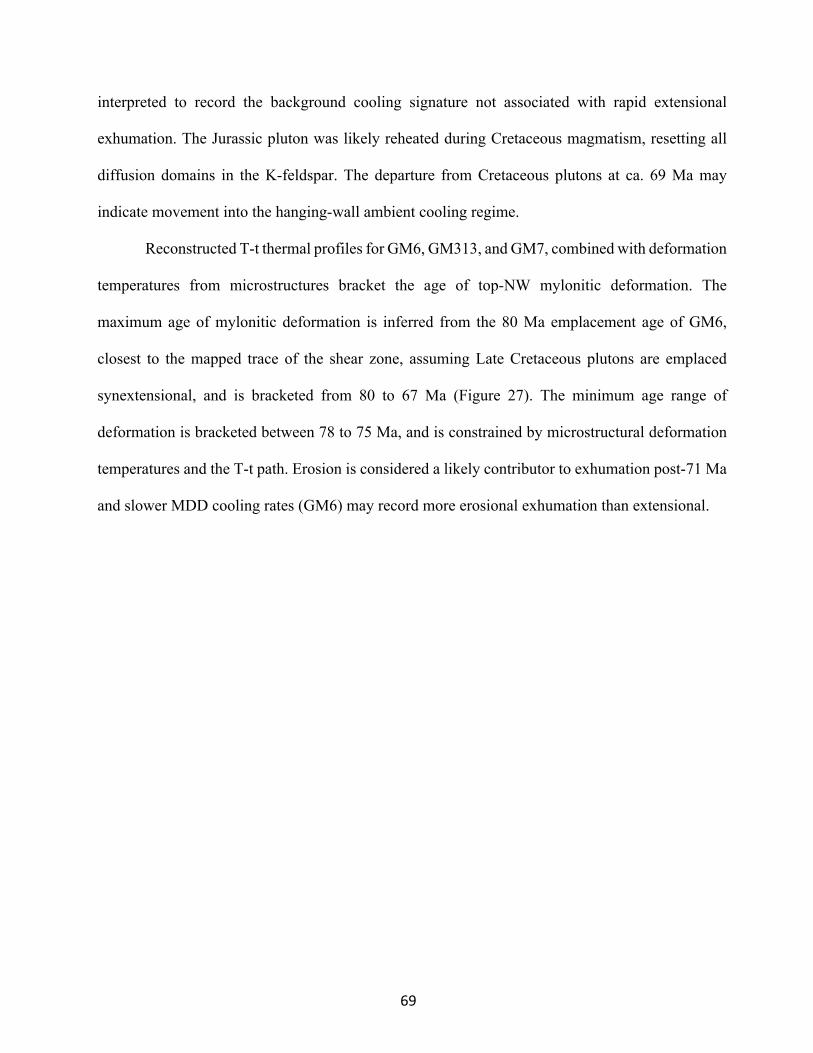
69
interpreted to record the background cooling signature not associated with rapid extensional
exhumation. The Jurassic pluton was likely reheated during Cretaceous magmatism, resetting all
diffusion domains in the K-feldspar. The departure from Cretaceous plutons at ca. 69 Ma may
indicate movement into the hanging-wall ambient cooling regime.
Reconstructed T-t thermal profiles for GM6, GM313, and GM7, combined with deformation
temperatures from microstructures bracket the age of top-NW mylonitic deformation. The
maximum age of mylonitic deformation is inferred from the 80 Ma emplacement age of GM6,
closest to the mapped trace of the shear zone, assuming Late Cretaceous plutons are emplaced
synextensional, and is bracketed from 80 to 67 Ma (Figure 27). The minimum age range of
deformation is bracketed between 78 to 75 Ma, and is constrained by microstructural deformation
temperatures and the T-t path. Erosion is considered a likely contributor to exhumation post-71 Ma
and slower MDD cooling rates (GM6) may record more erosional exhumation than extensional.
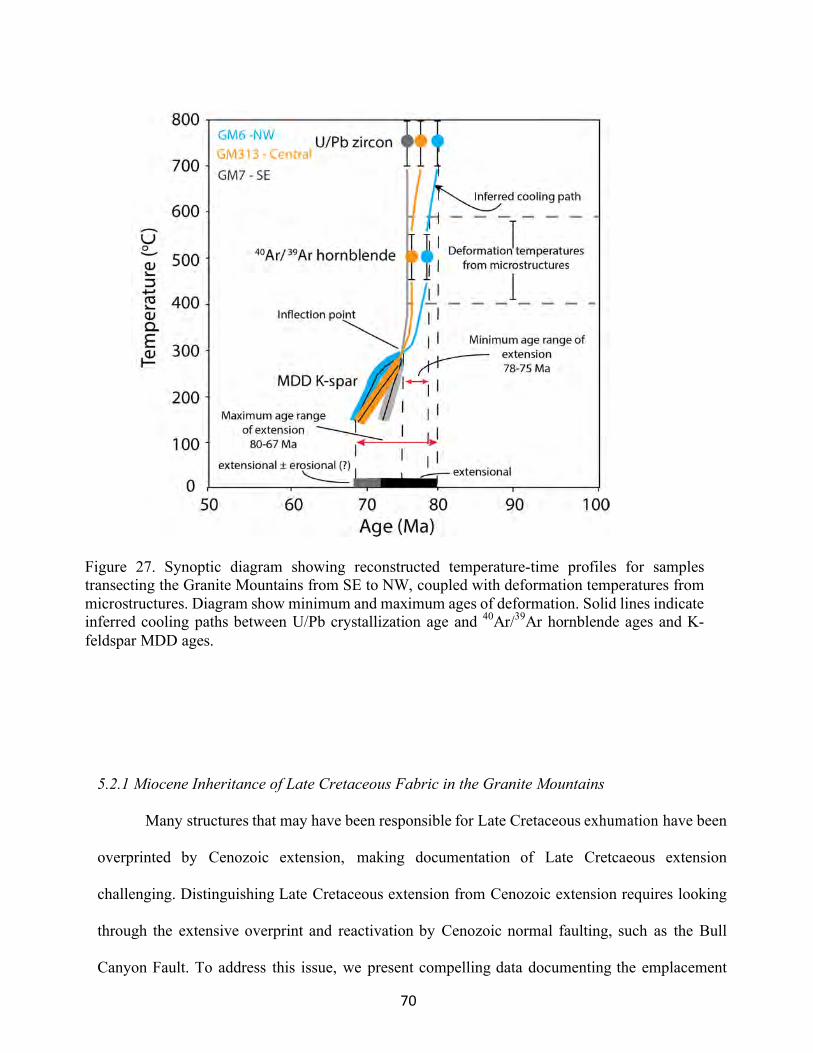
70
5.2.1 Miocene Inheritance of Late Cretaceous Fabric in the Granite Mountains
Many structures that may have been responsible for Late Cretaceous exhumation have been
overprinted by Cenozoic extension, making documentation of Late Cretcaeous extension
challenging. Distinguishing Late Cretaceous extension from Cenozoic extension requires looking
through the extensive overprint and reactivation by Cenozoic normal faulting, such as the Bull
Canyon Fault. To address this issue, we present compelling data documenting the emplacement
Figure 27. Synoptic diagram showing reconstructed temperature-time profiles for samples transecting the Granite Mountains from SE to NW, coupled with deformation temperatures from microstructures. Diagram show minimum and maximum ages of deformation. Solid lines indicate inferred cooling paths between U/Pb crystallization age and 40Ar/39Ar hornblende ages and K-feldspar MDD ages.
71
and thermal histories of plutonic rocks from the Granite Mountains, mylonitic shear zone
kinematics and geometries as well as microstructural deformation mechanisms to elucidate the age of
mylonitic deformation, and geometry and kinematics of the Bull Canyon fault. These data
provide unequivocal evidence linking Late Cretaceous cooling signatures of Cretaceous mid-
crustal granitoid rocks to Late Cretaceous extension and exhumation, and for later overprinting
and reactivatation by Miocene detachment faulting along the Bull Canyon fault.
The (BCF) is a low-angle normal fault, present along the northern margin of the Granite
Mountains, demonstrating brittle deformation (Howard et al., 1987). The age of the BCF is poorly
constrained from Tertiary gravel and breccia deposits that are cut by the BCF. The BCF has an
arcuate geometry with the average fault surface striking 252˚ and dipping 41˚NW; mechanical
striations indicate an average hanging-wall transport direction of 324˚ and a plunge of 39˚. The
arcuate shape of the BCF follows the average geometry of mylonitic foliation. Furthermore,
mechanical striations associated with the BCF are within statistical error of stretching lineations
associated with mylonitic deformation. The similar geometries and transport directions between the
BCF and mylonitic rocks suggests that the BCF likely inherited the architecture of the older
mylonitic shear zone, experiencing geometric and kinematic reactivation (e.g., Holdsworth et al.,
1997). Furthermore, the BCF largely excised and/or displaced most evidence of the shear zone from
the Granite Mountains.
5.3 Age of Bristol Mountain Shear Zone
The age of mylonitic deformation in the Bristol Mountains, similar to the Granite Mountains
mylonites, is best constrained by combining footwall and shear zone cooling histories with
deformation temperatures recorded in mylonitically deformed rocks. Shear zone geometry and
kinematics within the Bristol Mountains demonstrate a top-to-the-SW non-coaxial down-dip sense
of shear, indicating extensional deformation. Microstructural studies consistently show mid-to-
72
upper greenschist and lower amphibolite facies deformation conditions. Furthermore, deformation
lamellae are pervasive across the shear zone, and may suggest a progressive decrease in deformation
temperature during denudation of the shear zone. The presence of higher temperature
microstructures (feldspar SGR and quartz GBM), as well as lower temperature deformation
lamellae indicates that mylonitic rocks were deformed during decreasing temperature conditions
over the range of ~550-350 ̊C.
New U/Pb zircon crystallization ages and 40Ar/39Ar thermochronology from the Bristol
Mountains indicate Cretaceous plutons experienced rapid cooling after emplacement. U/Pb zircon
data indicate Cretaceous plutons were emplaced at ~750˚C by 75 Ma. Additionally, 40Ar/39Ar
thermochronology data from biotite and muscovite indicates plutons cooled very rapidly through
mica closure temperatures by ~72.5 Ma. The muscovite age of 72.5 Ma is interpreted to be the age
of peak deformation and time of most rapid cooling, followed by slower cooling through K-feldspar
closure temperatures with MDD modeled rates of ~22 and 16 ˚C/m.y. The rapid cooling observed
in Cretaceous plutons from the Bristol Mountains through upper MDD model ages is interpreted to
be associated with tectonic exhumation via extension. Solid-state deformation of Late Cretaceous
(75 Ma) plutons provides a maximum constraint on deformation. Furthermore, rapid cooling
through mica (biotite and muscovite) closure temperatures suggests plutons underwent rapid
cooling post-emplacement (~73-72 Ma).
Reconstructed T-t thermal profiles for the Bristol Mountains, coupled with deformation
temperatures place broad constraints on mylonitic deformation (Figure 28). A maximum age of
deformation is inferred from ~75 Ma to 65 Ma, using the U/Pb crystallization age of the
mylonitically deformed Kg pluton and the small domain K-feldspar closure temperatures from
MDD modeling as age brackets. The minimum age range of extensional deformation in the Bristol
Mountains is inferred from ~75 to 72.5 Ma. Slower cooling rates recorded in K-feldspar MDD may
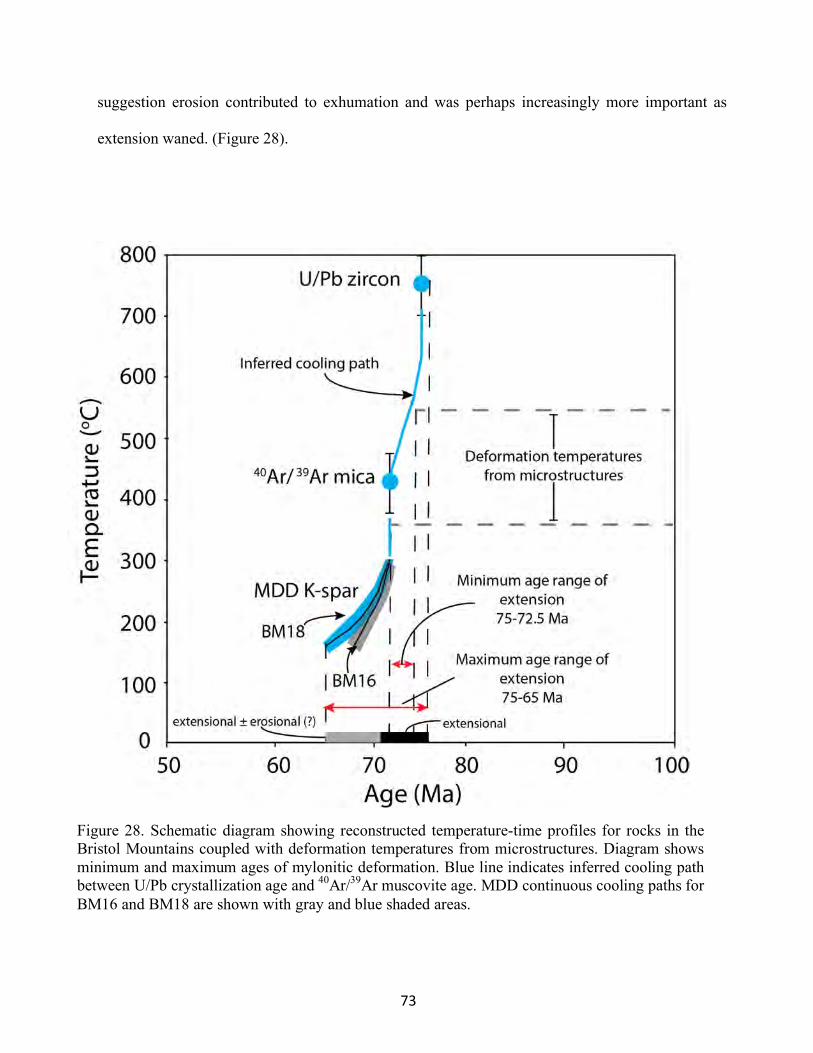
73
suggestion erosion contributed to exhumation and was perhaps increasingly more important as
extension waned. (Figure 28).
Figure 28. Schematic diagram showing reconstructed temperature-time profiles for rocks in the Bristol Mountains coupled with deformation temperatures from microstructures. Diagram shows minimum and maximum ages of mylonitic deformation. Blue line indicates inferred cooling path between U/Pb crystallization age and 40Ar/39Ar muscovite age. MDD continuous cooling paths for BM16 and BM18 are shown with gray and blue shaded areas.
74
5.4 Tectonic Evolution and Displacement of the Bristol and Granite Mountains
5.4.1 Discrepancy between Shear Zone Geometries and Transport Directions
Several possible scenarios may explain the differences in shear zone geometry and
kinematics between the Bristol and Granite mountains. Four scenarios are discussed herein to
explain the tectonic evolution and displacement of the Bristol and Granite mountains, leading to
the differences in shear zone geometries and kinematics. Firstly, during Miocene BCF deformation,
assuming the Bristol and Granite mountains had the same initial geometry and kinematics, there
was a hanging-wall vertical axis rotation, causing the Bristol Mountains and mylonitic fabrics
therein to rotate anticlockwise relative to the Granite Mountains. This model assumes that rocks of
the Bristol Mountains originated on top of or adjacent to the Granite Mountains prior to Cenozoic
faulting. The amount of hanging-wall rotation would be ~78˚ anticlockwise. This is a large amount
of HW rotation, considering the apparent slip (~4-6 km) associated with the BCF (Figure 29a).
Secondly, during displacement along the BGMFZ there was a vertical axis rotation across
the fault. In this scenario, it is assumed that the Bristol Mountains originated adjacent to the Granite
Mountains, and that progressive transport along the BGMFZ caused block rotation of the Bristol
Mountains, with respect to the Granite Mountains, to present day geographic orientations. Lease et
al. (2009), and others, suggest that there has been no net rotation across the BGMFZ. This model is
considered an unlikely cause for the misorientation of shear zone geometry and kinematics
between the Bristol and Granite Mountains (Figure 29b).
Thirdly, there has been no rotation of the shear zone(s), and the original geometries and
kinematics are preserved, though displaced along the BGMFZ. This scenario assumes that the
Bristol Mountains originated adjacent to the Granite Mountains prior to Cenozoic deformation, and
dextral separation
75
of the Bristol and Granite mountains would have taken place across the BGMFZ, with no net
rotation. In this model, after restoring the Bristol Mountains along the BGMFZ to within
geographic proximity of the Granite Mountains, the initial shear zone geometry would have formed
a highly curved and arcuate shape wrapping around the present-day Granite Mountains to the south,
where mylonitic shearing was top-to-the-SW. This scenario is considered likely, and removes the
need for large scale vertical axis rotation across faults (Figure 29c).
Lastly, it is possible that the shear zone(s) present in the Bristol and Granite mountains are
unrelated spatially, i.e., they were two different shear zones recording orthogonal kinematics and
geometries. The geometry and hanging-wall transport direction for the Bristol Mountain shear zone
are similar to those in the nearby Pinto shear zone in the New York Mountains (Wells et al., 2005).
Furthermore, it is likely that the Bristol Mountains shear zone is related spatially and temporally
to the East Mojave Fault proposed by Miller et al. (1996).
We consider the third and fourth scenarios as the most likely as the magnitudes of rotation
required for options one and two are significantly larger than what has been documented either in
extensional settings or in tectonic blocks within the Eastern California Shear Zone.
5.4.2 Temporal kinematic switch in exhumation
Plutons transecting the Granite Mountains demonstrate a spatial gradient in emplacement
ages, cooling rates, and in onset of cooling. Reconstructed cooling paths show an inflection point
with initial rapid cooling transitioning to slower cooling. Kula (2002) suggested a conjugate fault
system to explain the gradients in cooling rates and inflection points observed. Kula (2002) sampled
three locations transecting the Granite Mountains from NE – SW and noted that the NE sample was
emplaced and conductively cooled through hornblende closure temperatures the earliest (~78 Ma),
whereas the central and SW plutons were emplaced later and did not cool through hornblende
closure temperatures until ~74 Ma. This was interpreted as the NE sample being near a top-to-the-
76
NE normal fault in the vicinity of Granite Pass, active from ~76-74 Ma. Furthermore, a top-to-the-
NE normal fault, with the Granite Mountains in the footwall, would explain the juxtaposition of
deep-seated Granite Mountain plutons with shallowly emplaced plutons in the Providence
Mountains. Kula (2002) noted that the NE sample switched from initially fast cooling to slower
cooling at a distinct inflection point, whereas the SW sample continued to cool very rapidly. The
inflection in cooling across the Granite Mountains is interpreted as a tectonic switch from extension
along a top-to-the NE normal fault to extension along a top-to-the-SW normal fault. Kula (2002)
also concluded that bulk exhumation in the Late Cretaceous was likely associated with top-to-the-
SW faulting.
This study adds two new samples to the Granite Mountains forming a SE-NW transect,
which is parallel to the mylonitic transport direction preserved in the footwall of the BCF. The new
sampling transect also demonstrates a distinct gradient in cooling rates. The NW pluton, which
is closest to the NW mylonitic shear zone, was emplaced first (80 Ma) and cooled through
hornblende closure temperatures by ~78 Ma, whereas the central pluton (GM313) was emplaced
and cooled through hornblende temperatures by ~76 Ma. Emplacement and cooling ages suggests a
top-to-the-NW normal fault, active from the emplacement of the NW pluton at ~80 Ma through ~76
Ma, assuming plutons are synextensional. The sampling transect here also demonstrates an
inflection in T-t paths. Post ~74 Ma, the SE pluton cooled virtually instantaneously through upper
K-feldspar MDD closure temperatures. Whereas the central and NW plutons continued cooling at
slower and very similar rates, which may be suggestive of a kinematic switch in extension.
The Cretaceous plutons sampled on the Bristol Mountains sampling transect, parallel to the
mylonitic transport direction, yield indistinguishable emplacement ages. Mica cooling ages, while
complex in detail, are all broadly similar, indicating footwall cooling was nearly uniform through
~375 ˚C. K-feldspar MDD modeling suggests the pluton within the shear zone cooled slower and
77
later (~65 Ma), whereas the sample from the footwall to the NE cooled through K- feldspar closure
earlier (~67 Ma), which is expected to occur with a top-to-the-SW normal fault and progressive
exhumation of the hanging wall. If the shear zone present in the Bristol Mountains is restored for slip
along the BGMFZ to be adjacent to the Granite Mountains, the shear zone in the Bristol Mountains
may be responsible for the exhumation of the Granite Mountains plutons along a top-to-the-SW
normal fault proposed by Kula (2002). Figure 29c shows reconstruction of the Bristol Mountains
along the BGMFZ to lie adjacent to the Granite Mountains. Reconstructed T-t thermal profiles from
Kula (2002), and from this study, may indicate a polyphase history with kinematic switches in
extension direction from a top-to-the-NW extension active from ~80-76 Ma, to top-to-the-NE
extension active from ~76-74 Ma, and finally top-to-the-SW extension active from ~74-65 Ma
(Figure 29d).
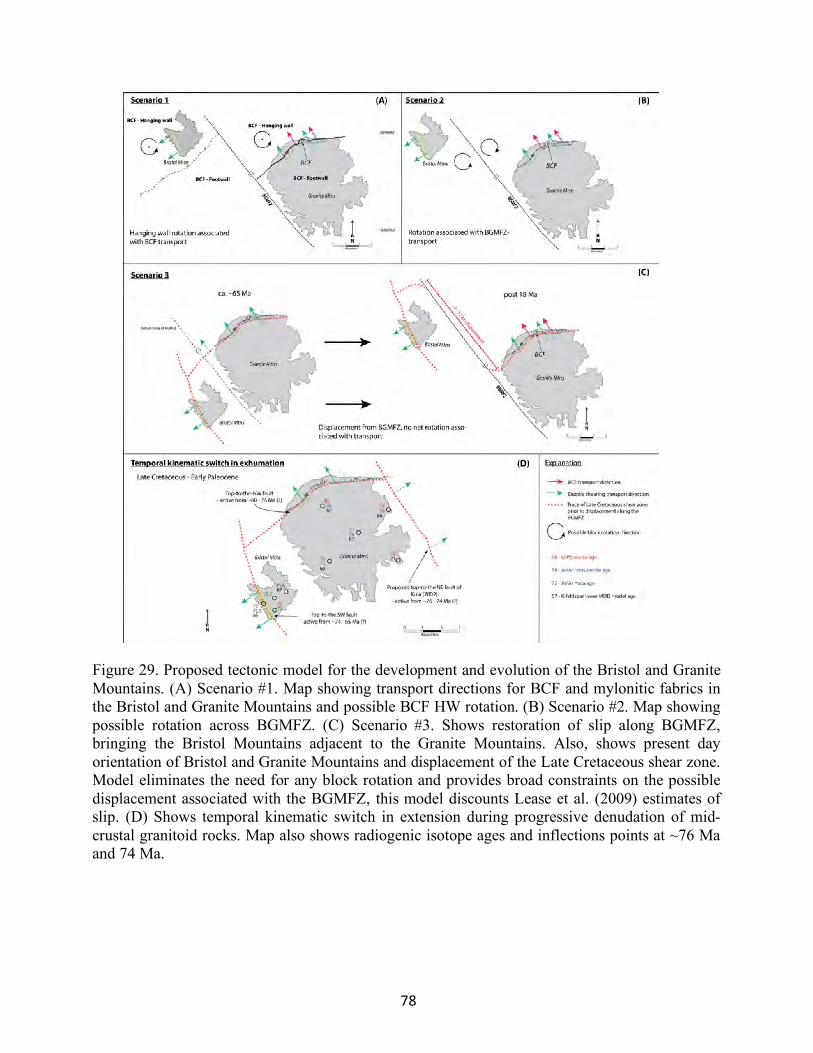
78
Figure 29. Proposed tectonic model for the development and evolution of the Bristol and Granite Mountains. (A) Scenario #1. Map showing transport directions for BCF and mylonitic fabrics in the Bristol and Granite Mountains and possible BCF HW rotation. (B) Scenario #2. Map showing possible rotation across BGMFZ. (C) Scenario #3. Shows restoration of slip along BGMFZ, bringing the Bristol Mountains adjacent to the Granite Mountains. Also, shows present day orientation of Bristol and Granite Mountains and displacement of the Late Cretaceous shear zone. Model eliminates the need for any block rotation and provides broad constraints on the possible displacement associated with the BGMFZ, this model discounts Lease et al. (2009) estimates of slip. (D) Shows temporal kinematic switch in extension during progressive denudation of mid-crustal granitoid rocks. Map also shows radiogenic isotope ages and inflections points at ~76 Ma and 74 Ma.
79
5.5 Late Cretaceous Unroofing in the East Mojave Desert
Three examples from the Mojave Desert are chosen herein to show similarity in timing and
kinematics for Late Cretaceous extension throughout the southwestern Cordillera: (1) the New
York Mountains; (2) the Old Woman Mountains; and (3) the Iron Mountains. (1) The New York
Mountains, located to the NE of the Granite Mountains (Figure 2a), are composed mainly of mid-
late Cretaceous plutonic rocks, Cretaceous metavolcanic rocks, Paleozoic metasedimentary rocks,
and Proterozoic basement gneisses (Burchfiel and Davis, 1977; Miller et al., 1991; Beyene, 2000;
Smith et al., 2003; Wells et al., 2005). The Pinto shear zone in the southern New York Mountains
records Late Cretaceous extension and rapid cooling of the Mid Hills Monzogranite. Kinematic
indicators within the Pinto shear zone show a top-to-the-SW down-dip shearing, consistent with
extensional deformation as opposed to shortening. Detailed 40Ar/39Ar thermochronology across
the footwall of the Pinto shear zone constrains deformation to 74-68 Ma (Wells et al., 2005). K-
feldspar MDD modeling indicates cooling of the footwall at a rate of 76-62˚C/m.y. (Wells et al., 2005). (2) The Old Woman Mountains, located to the ESE of the Granite Mountains (Figure 2a),
are composed of Paleozoic metasedimentary rocks, Proterozoic basement rocks, and Mesozoic
granitoid rocks. The Old Woman pluton exhibits synmagmatic and solid-state shearing interpreted as
recording extension (Foster et al., 1989; Foster et al., 1992 McCaffrey et al., 1999). U/Pb
geochronology and 40Ar/39Ar thermochronology indicates that the Old Woman pluton was
emplaced at 74 Ma and cooled below the apatite fission track closure temperature of ~100˚C by
66 Ma (Carl et al., 1991; Foster et al., 1992). (3) The Iron Mountains are located to the SSE of the
Granite Mountains (Figure 2a) and are composed of a Cretaceous sill complex, separated by
screens of Precambrian metasedimentary rocks, in the roof of the Cadiz Valley Batholith (Miller
and Howard, 1984). A Late Cretaceous porphyritic monzogranite (~ 75 Ma, Wells et al., 2002)
80
forms the main phase of the batholith. Within the sills and overlying metasedimentary rocks a thick
mylonitic shear zone with top-to-the-E kinematic indicators is present. 40Ar/39Ar cooling ages from
biotite within the footwall of the shear zone, coupled with emplacement ages, brackets extensional
deformation from 75 to 67 Ma. These data are temporally consistent with the Late Cretaceous
extension observed in the Bristol and Granite mountains, demonstrating that Late Cretaceous
extension was widespread across the Eastern Mojave region.
5.6 Causative Mechanisms for Exhumation and a Collapsing Orogen in the Late Cretaceous
Demonstrating the age and geographic extent of Late Cretaceous extension across the
North American Cordillera is crucial to understanding the possible causes, as well as developing a
robust geodynamic model for the Sevier and Laramide orogenies. Late Cretaceous cooling and
partial exhumation of mid-to-lower crustal rocks was a widespread event across the North
American Cordillera, from the Great Basin region to the SW Mojave Block (Hodges and Walker,
1992; Wells and Hoisch, 2008). Wells and others (2005) postulated that synconvergent extension
was the major contributor to exhumation, which was caused by an orogen-wide delamination event
of the North American lithospheric mantle. Geodynamical modeling by Liu et al. (2010) and others
suggest subduction of the oceanic plateau rooted to the Farallon plate caused wide spread dynamic
topographic responses. At the leading edge of the plateau, dynamic subsidence manifested in
response to the basaltic plateau undergoing eclogitization causing a draw-down of the upper plate
(Liu et al., 2010; Copeland et al., 2017). Furthermore, a dynamic uplift of the upper plate ensued
subsequent to the passage of the plateau. A dynamic uplift in the Laramide deformational corridor
and Mojave Block may have led to extension and exhumation during the latest Cretaceous to
earliest Paleocene, but does not explain Late Cretaceous extension in the Great Basin region.
Many studies, discussed previously, demonstrate Late Cretaceous extension was a major
event leading to the development and evolution of the southern Cordillera and Mojave region
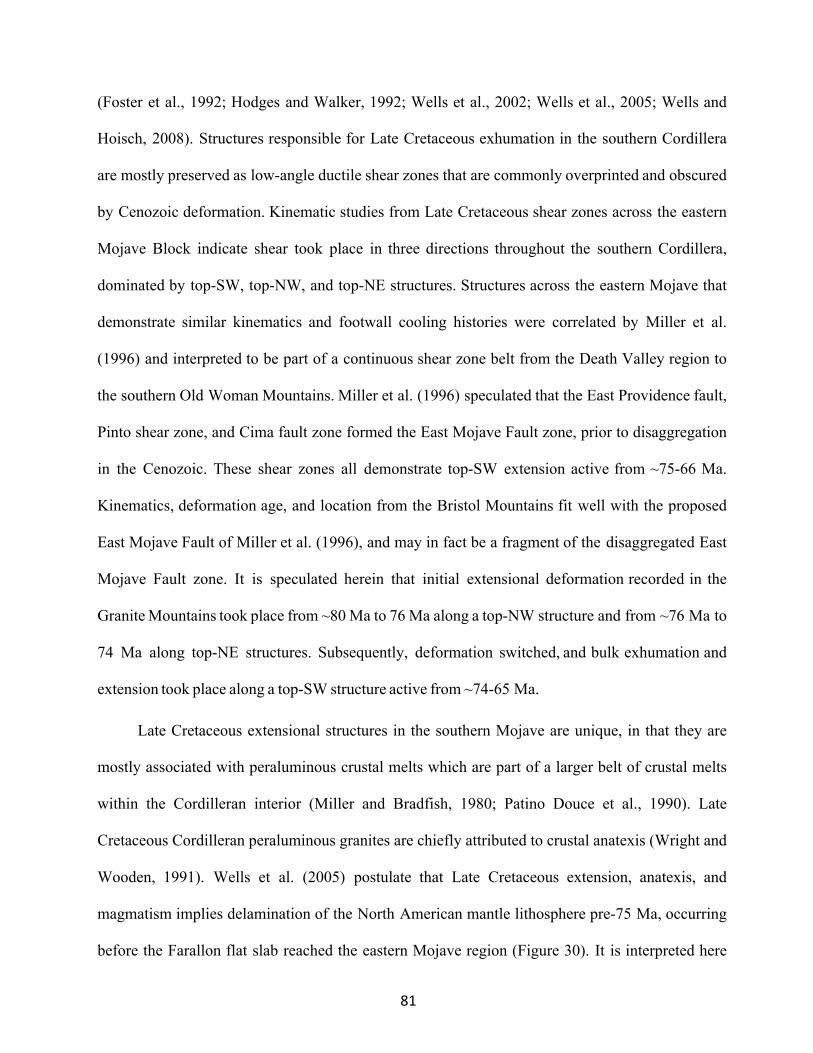
81
(Foster et al., 1992; Hodges and Walker, 1992; Wells et al., 2002; Wells et al., 2005; Wells and
Hoisch, 2008). Structures responsible for Late Cretaceous exhumation in the southern Cordillera
are mostly preserved as low-angle ductile shear zones that are commonly overprinted and obscured
by Cenozoic deformation. Kinematic studies from Late Cretaceous shear zones across the eastern
Mojave Block indicate shear took place in three directions throughout the southern Cordillera,
dominated by top-SW, top-NW, and top-NE structures. Structures across the eastern Mojave that
demonstrate similar kinematics and footwall cooling histories were correlated by Miller et al.
(1996) and interpreted to be part of a continuous shear zone belt from the Death Valley region to
the southern Old Woman Mountains. Miller et al. (1996) speculated that the East Providence fault,
Pinto shear zone, and Cima fault zone formed the East Mojave Fault zone, prior to disaggregation
in the Cenozoic. These shear zones all demonstrate top-SW extension active from ~75-66 Ma.
Kinematics, deformation age, and location from the Bristol Mountains fit well with the proposed
East Mojave Fault of Miller et al. (1996), and may in fact be a fragment of the disaggregated East
Mojave Fault zone. It is speculated herein that initial extensional deformation recorded in the
Granite Mountains took place from ~80 Ma to 76 Ma along a top-NW structure and from ~76 Ma to
74 Ma along top-NE structures. Subsequently, deformation switched, and bulk exhumation and
extension took place along a top-SW structure active from ~74-65 Ma.
Late Cretaceous extensional structures in the southern Mojave are unique, in that they are
mostly associated with peraluminous crustal melts which are part of a larger belt of crustal melts
within the Cordilleran interior (Miller and Bradfish, 1980; Patino Douce et al., 1990). Late
Cretaceous Cordilleran peraluminous granites are chiefly attributed to crustal anatexis (Wright and
Wooden, 1991). Wells et al. (2005) postulate that Late Cretaceous extension, anatexis, and
magmatism implies delamination of the North American mantle lithosphere pre-75 Ma, occurring
before the Farallon flat slab reached the eastern Mojave region (Figure 30). It is interpreted here
82
that removal of the mantle lithosphere played a key role in providing adequate conditions for crustal
anatexis to occur, leading to the production of Cordilleran-type peraluminuous granites.
Furthermore, removal of the mantle lithosphere promoted uplift of the orogen through isostatic
rebound, resulting in large variations in gravitational potential energy and highly unstable regions
within the crust. Crustal anatexis together with an increase in gravitational potential energy could
lead to extensional collapse. The cause for removal of the lithospheric mantle is debated.
Delamination of a thick root developed beneath the overthickened Sevier orogen is postulated as a
likely cause for removal of the mantle lithosphere (Wells et al., 2005; Wells and Hoisch, 2008; Wells
and Hoisch, 2012). Delamination is proposed to have occurred before the eastward migration of
the low-angle Farallon slab and development of the Laramide orogeny, and before the
asthenospheric wedge was effectively removed from beneath the North American plate (Wells et al.,
2005). Moreover, upwelling asthenospheric mantle after lithospheric removal would allow the
production of mafic melts and crustal anatexis to occur. This also allows room for the flattening
Farallon plate to couple with the overriding North American plate and begin to underplate Pelona-
Orocopia-Rand schist. Removal of the mantle lithosphere via delamination is considered a probable
cause for the Cordilleran-type magmatism and associated regional collapse of the Sevier orogen in
the Late Cretaceous.
83
6. CONCLUSION
New data from the Bristol and Granite mountains in southeastern California demonstrate
that ductile shear zones record crustal extension and rapid exhumation of mid-crustal rocks in the
Late Cretaceous. Geochronology and thermochronology show that footwall(s) rocks were rapidly
cooled from crystallization temperatures through lower temperature MDD K-feldspar model ages.
Kinematic indicators from the Bristol Mountains shear zone indicates a top-to-the-SW non-coaxial
downdip shear sense, and mylonitic fabric preserved in the Granite Mountains records top-to-the-
NW non-coaxial downdip shearing – indicating extensional deformation. Microstructural analyses
show deformation occurred at lower amphibolite to upper greenschist facies conditions.
Microstructures also indicate a lower temperature overprint, suggesting a progressive unroofing of
the shear zone during exhumation. Deformation temperatures coupled with geochronology and
Figure 30. Simplified tectonic illustration showing removal of the lithospheric mantle beneath the North American plate via delamination. Shows uplift and crustal melting associated with removal of the lithospheric mantle - supporting crustal anatexis, increased lateral variations in stored gravitational potential energy and development of synorogenic collapse. Modified from Wells et al. (2005).
84
thermochronology bracket the age of extensional deformation in the Granite Mountains from ~80 Ma to 66 Ma and from ~75 Ma to 65 Ma in the Bristol Mountains.
These data provide unequivocal evidence for extensional collapse of the Sevier orogen in the
Late Cretaceous. Moreover, removal of the mantle lithosphere during the Late Cretaceous is
seemingly the ubiquitous cause for synconvergent extension in the southern Cordillera. This study
supports the proposed delamination theory by Wells et al. (2005), Wells and Hoisch (2008), and
Wells and Hoisch (2012) as being the root mechanism for removal of the mantle lithosphere in
the Late Cretaceous, which led to crustal anatexis, peraluminuous magmatism, and extensional
collapse – synchronous with continued contraction in the Sevier FTB as well as the nascent Laramide
deformational belt to the north and south. Other mechanisms that explain exhumation and cooling
are also considered. Erosion may be an important contributor to exhumation post-70 Ma, based on
evidence for a highland (Kingman arch) existing in the southern Cordillera in the latest Cretaceous
which was subsequently erosionally denuded, producing a widespread sub-Tertiary unconformity
and shedding gravels onto the Colorado Plateau
Following Late Cretaceous extension, the southern Cordillera entered a period of tectonic
quiescence until the development of the southern Basin and Range and Eastern California Shear
Zone in the Neogene, which resulted in the final exhumation of the Bristol and Granite mountains.
Detailed structural measurements and field mapping show that the Miocene (?) Bull Canyon Fault
reactivated the top-to-the-NW Late Cretaceous extensional structure in the Granite Mountains. The
Bull Canyon Fault apparently inherited the architecture of the Late Cretaceous shear zone, likely
excising and/or displacing most of the earlier shear zone from the Granite Mountains. Restoration
of the Bristol Mountains along the Bristol-Granite Mountain fault zone, approximately 8-10 km,
would place the Bristol Mountains SW of the Granite Mountains; this configuration would allow
the Granite Mountains to be in the footwall of the top-to-the-SW shear zone present in the Bristol
85
Mountains, and may be responsible for the continued exhumation of the Granite Mountains from
~75-66 Ma. It is interpreted that incipient extension and exhumation took place a long the top-to-
the-NW structure present in the Granite Mountains from ~80-76 Ma, and continued extension
occurred along top-to-the-SW structures active from ~76-65 Ma. These data and observations from
the Bristol and Granite mountains provide key insight into the development and evolution of the
North American Cordillera, from the Late Jurassic to Quaternary deformation, and informs our
understanding of causitive mechanisms to explain regional Late Cretaceous cooling and
exhumation of mid-to-lower crustal rocks.
86
APPENDIX A
U/Pb Geochronology Data Tables
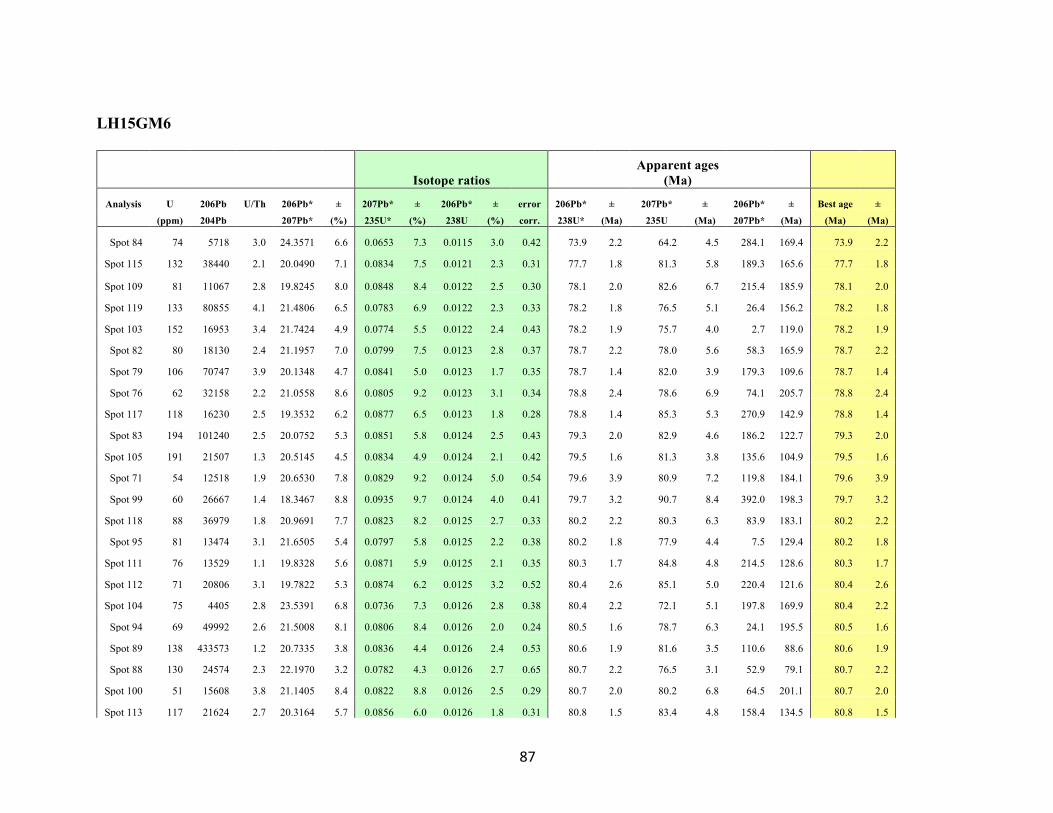
87
LH15GM6
Isotope ratios Apparent ages
(Ma)
Analysis U 206Pb U/Th 206Pb* ± 207Pb* ± 206Pb* ± error 206Pb* ± 207Pb* ± 206Pb* ± Best age ±
(ppm) 204Pb 207Pb* (%) 235U* (%) 238U (%) corr. 238U* (Ma) 235U (Ma) 207Pb* (Ma) (Ma) (Ma)
Spot 84 74 5718 3.0 24.3571 6.6 0.0653 7.3 0.0115 3.0 0.42 73.9 2.2 64.2 4.5 284.1 169.4 73.9 2.2
Spot 115 132 38440 2.1 20.0490 7.1 0.0834 7.5 0.0121 2.3 0.31 77.7 1.8 81.3 5.8 189.3 165.6 77.7 1.8
Spot 109 81 11067 2.8 19.8245 8.0 0.0848 8.4 0.0122 2.5 0.30 78.1 2.0 82.6 6.7 215.4 185.9 78.1 2.0
Spot 119 133 80855 4.1 21.4806 6.5 0.0783 6.9 0.0122 2.3 0.33 78.2 1.8 76.5 5.1 26.4 156.2 78.2 1.8
Spot 103 152 16953 3.4 21.7424 4.9 0.0774 5.5 0.0122 2.4 0.43 78.2 1.9 75.7 4.0 2.7 119.0 78.2 1.9
Spot 82 80 18130 2.4 21.1957 7.0 0.0799 7.5 0.0123 2.8 0.37 78.7 2.2 78.0 5.6 58.3 165.9 78.7 2.2
Spot 79 106 70747 3.9 20.1348 4.7 0.0841 5.0 0.0123 1.7 0.35 78.7 1.4 82.0 3.9 179.3 109.6 78.7 1.4
Spot 76 62 32158 2.2 21.0558 8.6 0.0805 9.2 0.0123 3.1 0.34 78.8 2.4 78.6 6.9 74.1 205.7 78.8 2.4
Spot 117 118 16230 2.5 19.3532 6.2 0.0877 6.5 0.0123 1.8 0.28 78.8 1.4 85.3 5.3 270.9 142.9 78.8 1.4
Spot 83 194 101240 2.5 20.0752 5.3 0.0851 5.8 0.0124 2.5 0.43 79.3 2.0 82.9 4.6 186.2 122.7 79.3 2.0
Spot 105 191 21507 1.3 20.5145 4.5 0.0834 4.9 0.0124 2.1 0.42 79.5 1.6 81.3 3.8 135.6 104.9 79.5 1.6
Spot 71 54 12518 1.9 20.6530 7.8 0.0829 9.2 0.0124 5.0 0.54 79.6 3.9 80.9 7.2 119.8 184.1 79.6 3.9
Spot 99 60 26667 1.4 18.3467 8.8 0.0935 9.7 0.0124 4.0 0.41 79.7 3.2 90.7 8.4 392.0 198.3 79.7 3.2
Spot 118 88 36979 1.8 20.9691 7.7 0.0823 8.2 0.0125 2.7 0.33 80.2 2.2 80.3 6.3 83.9 183.1 80.2 2.2
Spot 95 81 13474 3.1 21.6505 5.4 0.0797 5.8 0.0125 2.2 0.38 80.2 1.8 77.9 4.4 7.5 129.4 80.2 1.8
Spot 111 76 13529 1.1 19.8328 5.6 0.0871 5.9 0.0125 2.1 0.35 80.3 1.7 84.8 4.8 214.5 128.6 80.3 1.7
Spot 112 71 20806 3.1 19.7822 5.3 0.0874 6.2 0.0125 3.2 0.52 80.4 2.6 85.1 5.0 220.4 121.6 80.4 2.6
Spot 104 75 4405 2.8 23.5391 6.8 0.0736 7.3 0.0126 2.8 0.38 80.4 2.2 72.1 5.1 197.8 169.9 80.4 2.2
Spot 94 69 49992 2.6 21.5008 8.1 0.0806 8.4 0.0126 2.0 0.24 80.5 1.6 78.7 6.3 24.1 195.5 80.5 1.6
Spot 89 138 433573 1.2 20.7335 3.8 0.0836 4.4 0.0126 2.4 0.53 80.6 1.9 81.6 3.5 110.6 88.6 80.6 1.9
Spot 88 130 24574 2.3 22.1970 3.2 0.0782 4.3 0.0126 2.7 0.65 80.7 2.2 76.5 3.1 52.9 79.1 80.7 2.2
Spot 100 51 15608 3.8 21.1405 8.4 0.0822 8.8 0.0126 2.5 0.29 80.7 2.0 80.2 6.8 64.5 201.1 80.7 2.0
Spot 113 117 21624 2.7 20.3164 5.7 0.0856 6.0 0.0126 1.8 0.31 80.8 1.5 83.4 4.8 158.4 134.5 80.8 1.5
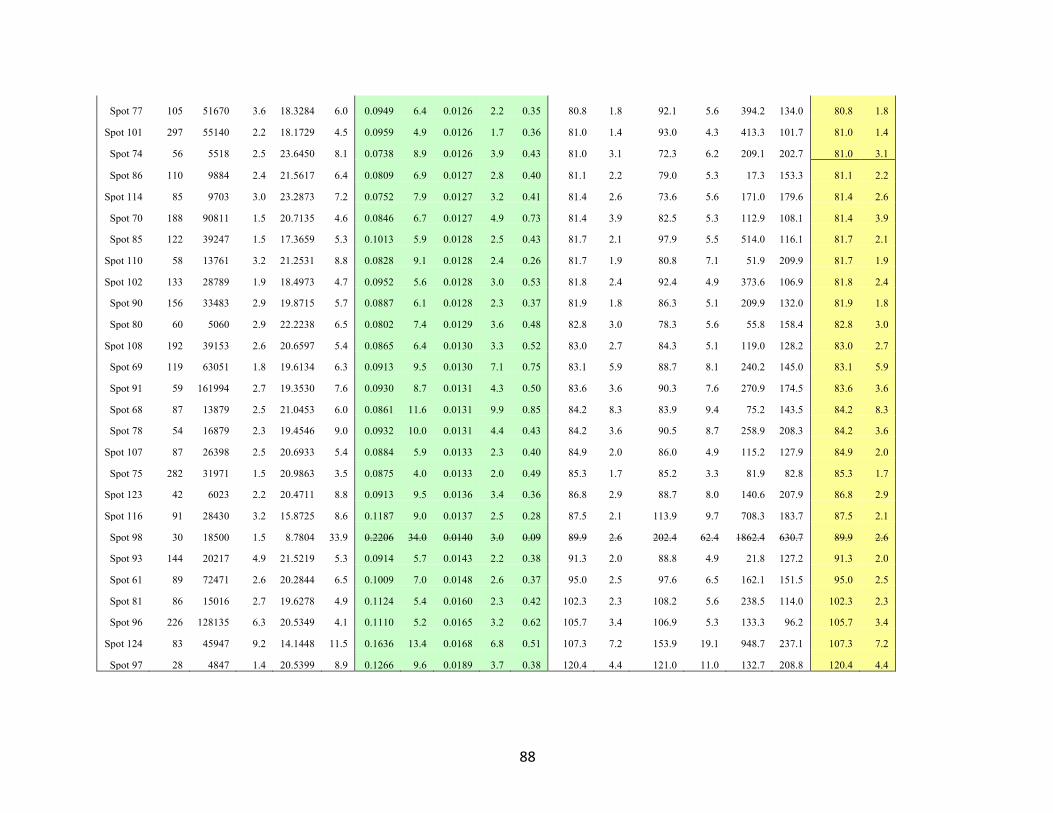
88
Spot 77 105 51670 3.6 18.3284 6.0 0.0949 6.4 0.0126 2.2 0.35 80.8 1.8 92.1 5.6 394.2 134.0 80.8 1.8
Spot 101 297 55140 2.2 18.1729 4.5 0.0959 4.9 0.0126 1.7 0.36 81.0 1.4 93.0 4.3 413.3 101.7 81.0 1.4
Spot 74 56 5518 2.5 23.6450 8.1 0.0738 8.9 0.0126 3.9 0.43 81.0 3.1 72.3 6.2 209.1 202.7 81.0 3.1
Spot 86 110 9884 2.4 21.5617 6.4 0.0809 6.9 0.0127 2.8 0.40 81.1 2.2 79.0 5.3 17.3 153.3 81.1 2.2
Spot 114 85 9703 3.0 23.2873 7.2 0.0752 7.9 0.0127 3.2 0.41 81.4 2.6 73.6 5.6 171.0 179.6 81.4 2.6
Spot 70 188 90811 1.5 20.7135 4.6 0.0846 6.7 0.0127 4.9 0.73 81.4 3.9 82.5 5.3 112.9 108.1 81.4 3.9
Spot 85 122 39247 1.5 17.3659 5.3 0.1013 5.9 0.0128 2.5 0.43 81.7 2.1 97.9 5.5 514.0 116.1 81.7 2.1
Spot 110 58 13761 3.2 21.2531 8.8 0.0828 9.1 0.0128 2.4 0.26 81.7 1.9 80.8 7.1 51.9 209.9 81.7 1.9
Spot 102 133 28789 1.9 18.4973 4.7 0.0952 5.6 0.0128 3.0 0.53 81.8 2.4 92.4 4.9 373.6 106.9 81.8 2.4
Spot 90 156 33483 2.9 19.8715 5.7 0.0887 6.1 0.0128 2.3 0.37 81.9 1.8 86.3 5.1 209.9 132.0 81.9 1.8
Spot 80 60 5060 2.9 22.2238 6.5 0.0802 7.4 0.0129 3.6 0.48 82.8 3.0 78.3 5.6 55.8 158.4 82.8 3.0
Spot 108 192 39153 2.6 20.6597 5.4 0.0865 6.4 0.0130 3.3 0.52 83.0 2.7 84.3 5.1 119.0 128.2 83.0 2.7
Spot 69 119 63051 1.8 19.6134 6.3 0.0913 9.5 0.0130 7.1 0.75 83.1 5.9 88.7 8.1 240.2 145.0 83.1 5.9
Spot 91 59 161994 2.7 19.3530 7.6 0.0930 8.7 0.0131 4.3 0.50 83.6 3.6 90.3 7.6 270.9 174.5 83.6 3.6
Spot 68 87 13879 2.5 21.0453 6.0 0.0861 11.6 0.0131 9.9 0.85 84.2 8.3 83.9 9.4 75.2 143.5 84.2 8.3
Spot 78 54 16879 2.3 19.4546 9.0 0.0932 10.0 0.0131 4.4 0.43 84.2 3.6 90.5 8.7 258.9 208.3 84.2 3.6
Spot 107 87 26398 2.5 20.6933 5.4 0.0884 5.9 0.0133 2.3 0.40 84.9 2.0 86.0 4.9 115.2 127.9 84.9 2.0
Spot 75 282 31971 1.5 20.9863 3.5 0.0875 4.0 0.0133 2.0 0.49 85.3 1.7 85.2 3.3 81.9 82.8 85.3 1.7
Spot 123 42 6023 2.2 20.4711 8.8 0.0913 9.5 0.0136 3.4 0.36 86.8 2.9 88.7 8.0 140.6 207.9 86.8 2.9
Spot 116 91 28430 3.2 15.8725 8.6 0.1187 9.0 0.0137 2.5 0.28 87.5 2.1 113.9 9.7 708.3 183.7 87.5 2.1
Spot 98 30 18500 1.5 8.7804 33.9 0.2206 34.0 0.0140 3.0 0.09 89.9 2.6 202.4 62.4 1862.4 630.7 89.9 2.6
Spot 93 144 20217 4.9 21.5219 5.3 0.0914 5.7 0.0143 2.2 0.38 91.3 2.0 88.8 4.9 21.8 127.2 91.3 2.0
Spot 61 89 72471 2.6 20.2844 6.5 0.1009 7.0 0.0148 2.6 0.37 95.0 2.5 97.6 6.5 162.1 151.5 95.0 2.5
Spot 81 86 15016 2.7 19.6278 4.9 0.1124 5.4 0.0160 2.3 0.42 102.3 2.3 108.2 5.6 238.5 114.0 102.3 2.3
Spot 96 226 128135 6.3 20.5349 4.1 0.1110 5.2 0.0165 3.2 0.62 105.7 3.4 106.9 5.3 133.3 96.2 105.7 3.4
Spot 124 83 45947 9.2 14.1448 11.5 0.1636 13.4 0.0168 6.8 0.51 107.3 7.2 153.9 19.1 948.7 237.1 107.3 7.2
Spot 97 28 4847 1.4 20.5399 8.9 0.1266 9.6 0.0189 3.7 0.38 120.4 4.4 121.0 11.0 132.7 208.8 120.4 4.4
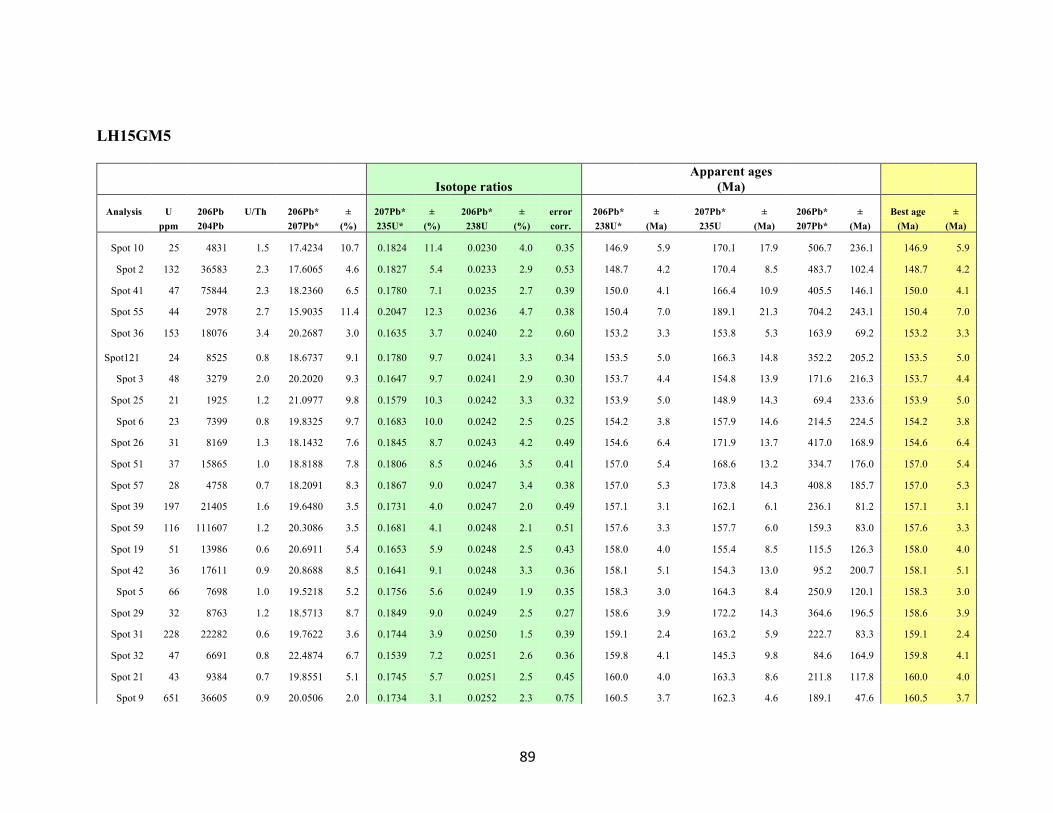
89
LH15GM5
Isotope ratios
Apparent ages (Ma)
Analysis U 206Pb U/Th 206Pb* ± 207Pb* ± 206Pb* ± error 206Pb* ± 207Pb* ± 206Pb* ± Best age ± ppm 204Pb 207Pb* (%) 235U* (%) 238U (%) corr. 238U* (Ma) 235U (Ma) 207Pb* (Ma) (Ma) (Ma)
Spot 10 25 4831 1.5 17.4234 10.7 0.1824 11.4 0.0230 4.0 0.35 146.9 5.9 170.1 17.9 506.7 236.1 146.9 5.9
Spot 2 132 36583 2.3 17.6065 4.6 0.1827 5.4 0.0233 2.9 0.53 148.7 4.2 170.4 8.5 483.7 102.4 148.7 4.2
Spot 41 47 75844 2.3 18.2360 6.5 0.1780 7.1 0.0235 2.7 0.39 150.0 4.1 166.4 10.9 405.5 146.1 150.0 4.1
Spot 55 44 2978 2.7 15.9035 11.4 0.2047 12.3 0.0236 4.7 0.38 150.4 7.0 189.1 21.3 704.2 243.1 150.4 7.0
Spot 36 153 18076 3.4 20.2687 3.0 0.1635 3.7 0.0240 2.2 0.60 153.2 3.3 153.8 5.3 163.9 69.2 153.2 3.3 Spot121 24 8525 0.8 18.6737 9.1 0.1780 9.7 0.0241 3.3 0.34 153.5 5.0 166.3 14.8 352.2 205.2 153.5 5.0
Spot 3 48 3279 2.0 20.2020 9.3 0.1647 9.7 0.0241 2.9 0.30 153.7 4.4 154.8 13.9 171.6 216.3 153.7 4.4
Spot 25 21 1925 1.2 21.0977 9.8 0.1579 10.3 0.0242 3.3 0.32 153.9 5.0 148.9 14.3 69.4 233.6 153.9 5.0
Spot 6 23 7399 0.8 19.8325 9.7 0.1683 10.0 0.0242 2.5 0.25 154.2 3.8 157.9 14.6 214.5 224.5 154.2 3.8
Spot 26 31 8169 1.3 18.1432 7.6 0.1845 8.7 0.0243 4.2 0.49 154.6 6.4 171.9 13.7 417.0 168.9 154.6 6.4
Spot 51 37 15865 1.0 18.8188 7.8 0.1806 8.5 0.0246 3.5 0.41 157.0 5.4 168.6 13.2 334.7 176.0 157.0 5.4
Spot 57 28 4758 0.7 18.2091 8.3 0.1867 9.0 0.0247 3.4 0.38 157.0 5.3 173.8 14.3 408.8 185.7 157.0 5.3
Spot 39 197 21405 1.6 19.6480 3.5 0.1731 4.0 0.0247 2.0 0.49 157.1 3.1 162.1 6.1 236.1 81.2 157.1 3.1
Spot 59 116 111607 1.2 20.3086 3.5 0.1681 4.1 0.0248 2.1 0.51 157.6 3.3 157.7 6.0 159.3 83.0 157.6 3.3
Spot 19 51 13986 0.6 20.6911 5.4 0.1653 5.9 0.0248 2.5 0.43 158.0 4.0 155.4 8.5 115.5 126.3 158.0 4.0
Spot 42 36 17611 0.9 20.8688 8.5 0.1641 9.1 0.0248 3.3 0.36 158.1 5.1 154.3 13.0 95.2 200.7 158.1 5.1
Spot 5 66 7698 1.0 19.5218 5.2 0.1756 5.6 0.0249 1.9 0.35 158.3 3.0 164.3 8.4 250.9 120.1 158.3 3.0
Spot 29 32 8763 1.2 18.5713 8.7 0.1849 9.0 0.0249 2.5 0.27 158.6 3.9 172.2 14.3 364.6 196.5 158.6 3.9
Spot 31 228 22282 0.6 19.7622 3.6 0.1744 3.9 0.0250 1.5 0.39 159.1 2.4 163.2 5.9 222.7 83.3 159.1 2.4
Spot 32 47 6691 0.8 22.4874 6.7 0.1539 7.2 0.0251 2.6 0.36 159.8 4.1 145.3 9.8 84.6 164.9 159.8 4.1
Spot 21 43 9384 0.7 19.8551 5.1 0.1745 5.7 0.0251 2.5 0.45 160.0 4.0 163.3 8.6 211.8 117.8 160.0 4.0
Spot 9 651 36605 0.9 20.0506 2.0 0.1734 3.1 0.0252 2.3 0.75 160.5 3.7 162.3 4.6 189.1 47.6 160.5 3.7
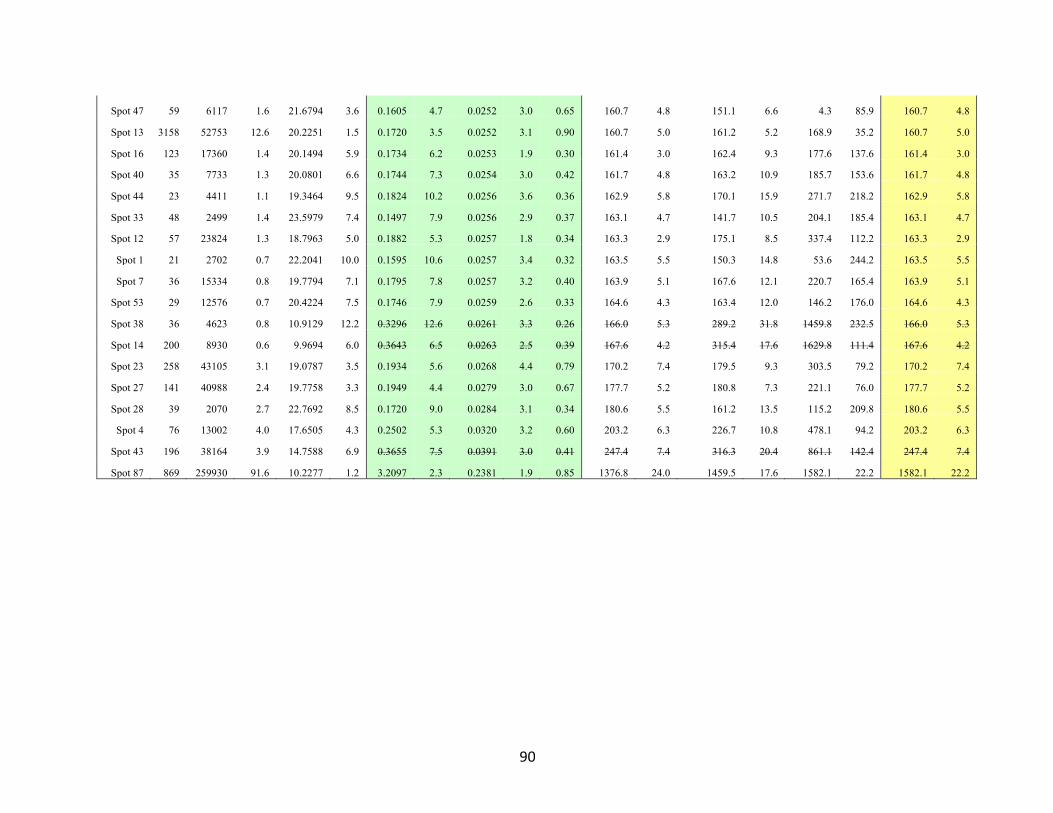
90
Spot 47 59 6117 1.6 21.6794 3.6 0.1605 4.7 0.0252 3.0 0.65 160.7 4.8 151.1 6.6 4.3 85.9 160.7 4.8
Spot 13 3158 52753 12.6 20.2251 1.5 0.1720 3.5 0.0252 3.1 0.90 160.7 5.0 161.2 5.2 168.9 35.2 160.7 5.0
Spot 16 123 17360 1.4 20.1494 5.9 0.1734 6.2 0.0253 1.9 0.30 161.4 3.0 162.4 9.3 177.6 137.6 161.4 3.0
Spot 40 35 7733 1.3 20.0801 6.6 0.1744 7.3 0.0254 3.0 0.42 161.7 4.8 163.2 10.9 185.7 153.6 161.7 4.8
Spot 44 23 4411 1.1 19.3464 9.5 0.1824 10.2 0.0256 3.6 0.36 162.9 5.8 170.1 15.9 271.7 218.2 162.9 5.8
Spot 33 48 2499 1.4 23.5979 7.4 0.1497 7.9 0.0256 2.9 0.37 163.1 4.7 141.7 10.5 204.1 185.4 163.1 4.7
Spot 12 57 23824 1.3 18.7963 5.0 0.1882 5.3 0.0257 1.8 0.34 163.3 2.9 175.1 8.5 337.4 112.2 163.3 2.9
Spot 1 21 2702 0.7 22.2041 10.0 0.1595 10.6 0.0257 3.4 0.32 163.5 5.5 150.3 14.8 53.6 244.2 163.5 5.5
Spot 7 36 15334 0.8 19.7794 7.1 0.1795 7.8 0.0257 3.2 0.40 163.9 5.1 167.6 12.1 220.7 165.4 163.9 5.1
Spot 53 29 12576 0.7 20.4224 7.5 0.1746 7.9 0.0259 2.6 0.33 164.6 4.3 163.4 12.0 146.2 176.0 164.6 4.3
Spot 38 36 4623 0.8 10.9129 12.2 0.3296 12.6 0.0261 3.3 0.26 166.0 5.3 289.2 31.8 1459.8 232.5 166.0 5.3
Spot 14 200 8930 0.6 9.9694 6.0 0.3643 6.5 0.0263 2.5 0.39 167.6 4.2 315.4 17.6 1629.8 111.4 167.6 4.2
Spot 23 258 43105 3.1 19.0787 3.5 0.1934 5.6 0.0268 4.4 0.79 170.2 7.4 179.5 9.3 303.5 79.2 170.2 7.4
Spot 27 141 40988 2.4 19.7758 3.3 0.1949 4.4 0.0279 3.0 0.67 177.7 5.2 180.8 7.3 221.1 76.0 177.7 5.2
Spot 28 39 2070 2.7 22.7692 8.5 0.1720 9.0 0.0284 3.1 0.34 180.6 5.5 161.2 13.5 115.2 209.8 180.6 5.5
Spot 4 76 13002 4.0 17.6505 4.3 0.2502 5.3 0.0320 3.2 0.60 203.2 6.3 226.7 10.8 478.1 94.2 203.2 6.3
Spot 43 196 38164 3.9 14.7588 6.9 0.3655 7.5 0.0391 3.0 0.41 247.4 7.4 316.3 20.4 861.1 142.4 247.4 7.4
Spot 87 869 259930 91.6 10.2277 1.2 3.2097 2.3 0.2381 1.9 0.85 1376.8 24.0 1459.5 17.6 1582.1 22.2 1582.1 22.2
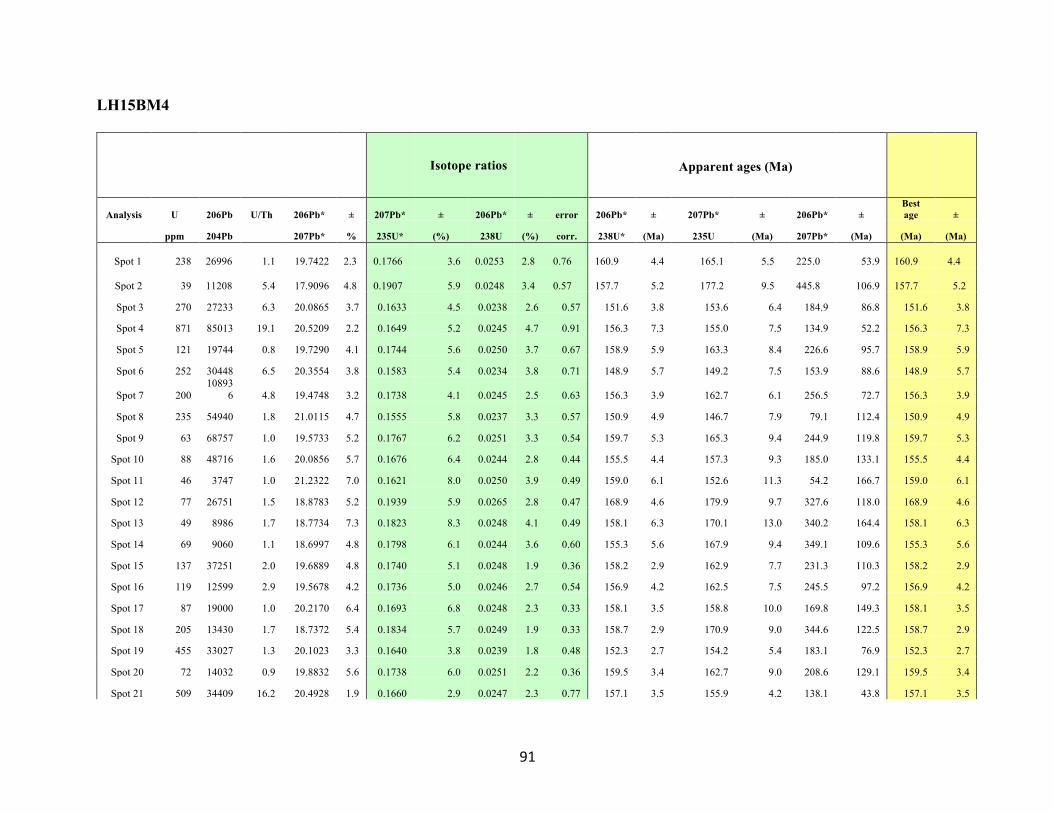
91
LH15BM4
Isotope ratios
Apparent ages (Ma)
Analysis U 206Pb U/Th 206Pb* ± 207Pb* ± 206Pb* ± error 206Pb* ± 207Pb* ± 206Pb* ± Best age ±
ppm 204Pb 207Pb* % 235U* (%) 238U (%) corr. 238U* (Ma) 235U (Ma) 207Pb* (Ma) (Ma) (Ma)
Spot 1 238 26996 1.1 19.7422 2.3 0.1766 3.6 0.0253 2.8 0.76 160.9 4.4 165.1 5.5 225.0 53.9 160.9 4.4 Spot 2 39 11208 5.4 17.9096 4.8 0.1907 5.9 0.0248 3.4 0.57 157.7 5.2 177.2 9.5 445.8 106.9 157.7 5.2
Spot 3 270 27233 6.3 20.0865 3.7 0.1633 4.5 0.0238 2.6 0.57 151.6 3.8 153.6 6.4 184.9 86.8 151.6 3.8
Spot 4 871 85013 19.1 20.5209 2.2 0.1649 5.2 0.0245 4.7 0.91 156.3 7.3 155.0 7.5 134.9 52.2 156.3 7.3
Spot 5 121 19744 0.8 19.7290 4.1 0.1744 5.6 0.0250 3.7 0.67 158.9 5.9 163.3 8.4 226.6 95.7 158.9 5.9
Spot 6 252 30448 6.5 20.3554 3.8 0.1583 5.4 0.0234 3.8 0.71 148.9 5.7 149.2 7.5 153.9 88.6 148.9 5.7
Spot 7 200 10893
6 4.8 19.4748 3.2 0.1738 4.1 0.0245 2.5 0.63 156.3 3.9 162.7 6.1 256.5 72.7 156.3 3.9
Spot 8 235 54940 1.8 21.0115 4.7 0.1555 5.8 0.0237 3.3 0.57 150.9 4.9 146.7 7.9 79.1 112.4 150.9 4.9
Spot 9 63 68757 1.0 19.5733 5.2 0.1767 6.2 0.0251 3.3 0.54 159.7 5.3 165.3 9.4 244.9 119.8 159.7 5.3
Spot 10 88 48716 1.6 20.0856 5.7 0.1676 6.4 0.0244 2.8 0.44 155.5 4.4 157.3 9.3 185.0 133.1 155.5 4.4
Spot 11 46 3747 1.0 21.2322 7.0 0.1621 8.0 0.0250 3.9 0.49 159.0 6.1 152.6 11.3 54.2 166.7 159.0 6.1
Spot 12 77 26751 1.5 18.8783 5.2 0.1939 5.9 0.0265 2.8 0.47 168.9 4.6 179.9 9.7 327.6 118.0 168.9 4.6
Spot 13 49 8986 1.7 18.7734 7.3 0.1823 8.3 0.0248 4.1 0.49 158.1 6.3 170.1 13.0 340.2 164.4 158.1 6.3
Spot 14 69 9060 1.1 18.6997 4.8 0.1798 6.1 0.0244 3.6 0.60 155.3 5.6 167.9 9.4 349.1 109.6 155.3 5.6
Spot 15 137 37251 2.0 19.6889 4.8 0.1740 5.1 0.0248 1.9 0.36 158.2 2.9 162.9 7.7 231.3 110.3 158.2 2.9
Spot 16 119 12599 2.9 19.5678 4.2 0.1736 5.0 0.0246 2.7 0.54 156.9 4.2 162.5 7.5 245.5 97.2 156.9 4.2
Spot 17 87 19000 1.0 20.2170 6.4 0.1693 6.8 0.0248 2.3 0.33 158.1 3.5 158.8 10.0 169.8 149.3 158.1 3.5
Spot 18 205 13430 1.7 18.7372 5.4 0.1834 5.7 0.0249 1.9 0.33 158.7 2.9 170.9 9.0 344.6 122.5 158.7 2.9
Spot 19 455 33027 1.3 20.1023 3.3 0.1640 3.8 0.0239 1.8 0.48 152.3 2.7 154.2 5.4 183.1 76.9 152.3 2.7
Spot 20 72 14032 0.9 19.8832 5.6 0.1738 6.0 0.0251 2.2 0.36 159.5 3.4 162.7 9.0 208.6 129.1 159.5 3.4
Spot 21 509 34409 16.2 20.4928 1.9 0.1660 2.9 0.0247 2.3 0.77 157.1 3.5 155.9 4.2 138.1 43.8 157.1 3.5
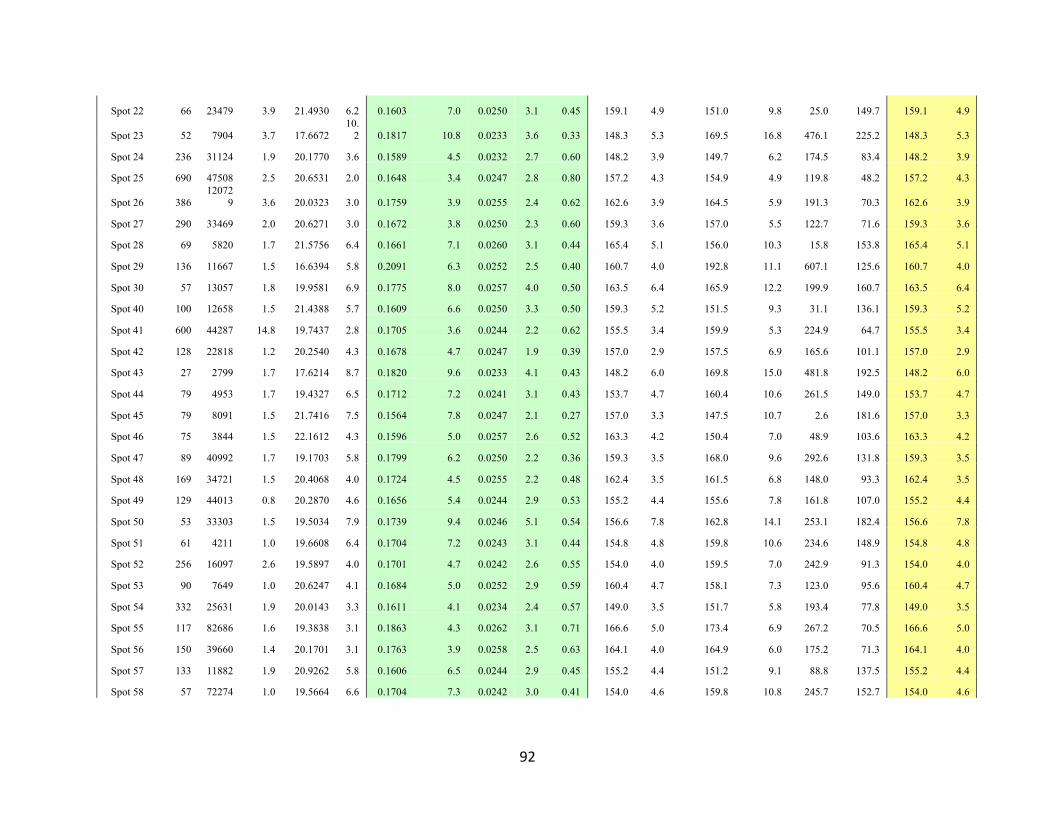
92
Spot 22 66 23479 3.9 21.4930 6.2 0.1603 7.0 0.0250 3.1 0.45 159.1 4.9 151.0 9.8 25.0 149.7 159.1 4.9
Spot 23 52 7904 3.7 17.6672 10.
2 0.1817 10.8 0.0233 3.6 0.33 148.3 5.3 169.5 16.8 476.1 225.2 148.3 5.3
Spot 24 236 31124 1.9 20.1770 3.6 0.1589 4.5 0.0232 2.7 0.60 148.2 3.9 149.7 6.2 174.5 83.4 148.2 3.9
Spot 25 690 47508 2.5 20.6531 2.0 0.1648 3.4 0.0247 2.8 0.80 157.2 4.3 154.9 4.9 119.8 48.2 157.2 4.3
Spot 26 386 12072
9 3.6 20.0323 3.0 0.1759 3.9 0.0255 2.4 0.62 162.6 3.9 164.5 5.9 191.3 70.3 162.6 3.9
Spot 27 290 33469 2.0 20.6271 3.0 0.1672 3.8 0.0250 2.3 0.60 159.3 3.6 157.0 5.5 122.7 71.6 159.3 3.6
Spot 28 69 5820 1.7 21.5756 6.4 0.1661 7.1 0.0260 3.1 0.44 165.4 5.1 156.0 10.3 15.8 153.8 165.4 5.1
Spot 29 136 11667 1.5 16.6394 5.8 0.2091 6.3 0.0252 2.5 0.40 160.7 4.0 192.8 11.1 607.1 125.6 160.7 4.0
Spot 30 57 13057 1.8 19.9581 6.9 0.1775 8.0 0.0257 4.0 0.50 163.5 6.4 165.9 12.2 199.9 160.7 163.5 6.4
Spot 40 100 12658 1.5 21.4388 5.7 0.1609 6.6 0.0250 3.3 0.50 159.3 5.2 151.5 9.3 31.1 136.1 159.3 5.2
Spot 41 600 44287 14.8 19.7437 2.8 0.1705 3.6 0.0244 2.2 0.62 155.5 3.4 159.9 5.3 224.9 64.7 155.5 3.4
Spot 42 128 22818 1.2 20.2540 4.3 0.1678 4.7 0.0247 1.9 0.39 157.0 2.9 157.5 6.9 165.6 101.1 157.0 2.9
Spot 43 27 2799 1.7 17.6214 8.7 0.1820 9.6 0.0233 4.1 0.43 148.2 6.0 169.8 15.0 481.8 192.5 148.2 6.0
Spot 44 79 4953 1.7 19.4327 6.5 0.1712 7.2 0.0241 3.1 0.43 153.7 4.7 160.4 10.6 261.5 149.0 153.7 4.7
Spot 45 79 8091 1.5 21.7416 7.5 0.1564 7.8 0.0247 2.1 0.27 157.0 3.3 147.5 10.7 2.6 181.6 157.0 3.3
Spot 46 75 3844 1.5 22.1612 4.3 0.1596 5.0 0.0257 2.6 0.52 163.3 4.2 150.4 7.0 48.9 103.6 163.3 4.2
Spot 47 89 40992 1.7 19.1703 5.8 0.1799 6.2 0.0250 2.2 0.36 159.3 3.5 168.0 9.6 292.6 131.8 159.3 3.5
Spot 48 169 34721 1.5 20.4068 4.0 0.1724 4.5 0.0255 2.2 0.48 162.4 3.5 161.5 6.8 148.0 93.3 162.4 3.5
Spot 49 129 44013 0.8 20.2870 4.6 0.1656 5.4 0.0244 2.9 0.53 155.2 4.4 155.6 7.8 161.8 107.0 155.2 4.4
Spot 50 53 33303 1.5 19.5034 7.9 0.1739 9.4 0.0246 5.1 0.54 156.6 7.8 162.8 14.1 253.1 182.4 156.6 7.8
Spot 51 61 4211 1.0 19.6608 6.4 0.1704 7.2 0.0243 3.1 0.44 154.8 4.8 159.8 10.6 234.6 148.9 154.8 4.8
Spot 52 256 16097 2.6 19.5897 4.0 0.1701 4.7 0.0242 2.6 0.55 154.0 4.0 159.5 7.0 242.9 91.3 154.0 4.0
Spot 53 90 7649 1.0 20.6247 4.1 0.1684 5.0 0.0252 2.9 0.59 160.4 4.7 158.1 7.3 123.0 95.6 160.4 4.7
Spot 54 332 25631 1.9 20.0143 3.3 0.1611 4.1 0.0234 2.4 0.57 149.0 3.5 151.7 5.8 193.4 77.8 149.0 3.5
Spot 55 117 82686 1.6 19.3838 3.1 0.1863 4.3 0.0262 3.1 0.71 166.6 5.0 173.4 6.9 267.2 70.5 166.6 5.0
Spot 56 150 39660 1.4 20.1701 3.1 0.1763 3.9 0.0258 2.5 0.63 164.1 4.0 164.9 6.0 175.2 71.3 164.1 4.0
Spot 57 133 11882 1.9 20.9262 5.8 0.1606 6.5 0.0244 2.9 0.45 155.2 4.4 151.2 9.1 88.8 137.5 155.2 4.4
Spot 58 57 72274 1.0 19.5664 6.6 0.1704 7.3 0.0242 3.0 0.41 154.0 4.6 159.8 10.8 245.7 152.7 154.0 4.6
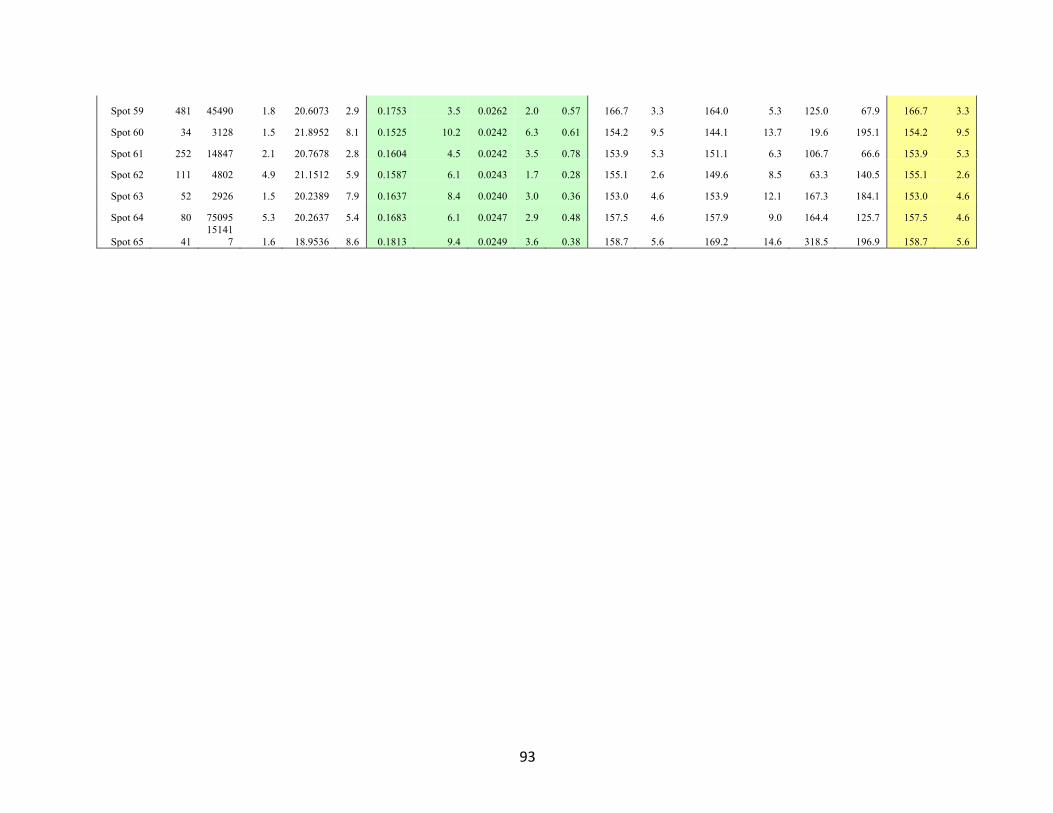
93
Spot 59 481 45490 1.8 20.6073 2.9 0.1753 3.5 0.0262 2.0 0.57 166.7 3.3 164.0 5.3 125.0 67.9 166.7 3.3
Spot 60 34 3128 1.5 21.8952 8.1 0.1525 10.2 0.0242 6.3 0.61 154.2 9.5 144.1 13.7 19.6 195.1 154.2 9.5
Spot 61 252 14847 2.1 20.7678 2.8 0.1604 4.5 0.0242 3.5 0.78 153.9 5.3 151.1 6.3 106.7 66.6 153.9 5.3
Spot 62 111 4802 4.9 21.1512 5.9 0.1587 6.1 0.0243 1.7 0.28 155.1 2.6 149.6 8.5 63.3 140.5 155.1 2.6
Spot 63 52 2926 1.5 20.2389 7.9 0.1637 8.4 0.0240 3.0 0.36 153.0 4.6 153.9 12.1 167.3 184.1 153.0 4.6
Spot 64 80 75095 5.3 20.2637 5.4 0.1683 6.1 0.0247 2.9 0.48 157.5 4.6 157.9 9.0 164.4 125.7 157.5 4.6
Spot 65 41 15141
7 1.6 18.9536 8.6 0.1813 9.4 0.0249 3.6 0.38 158.7 5.6 169.2 14.6 318.5 196.9 158.7 5.6
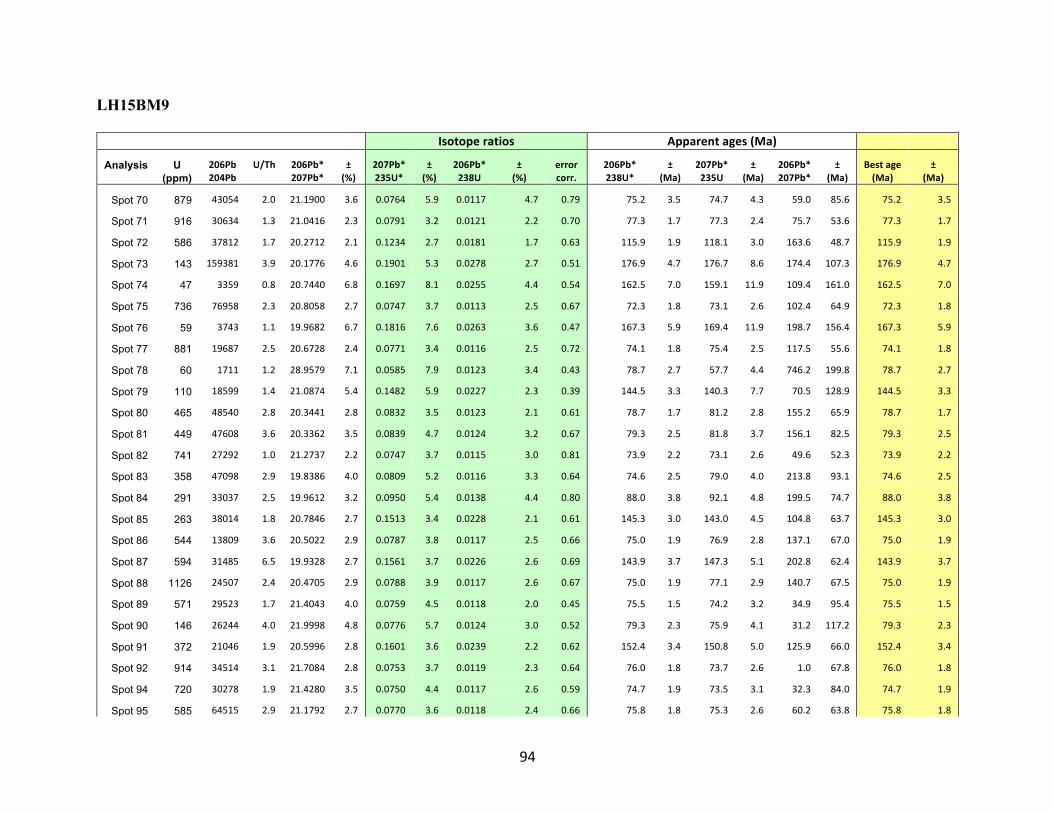
94
LH15BM9
Isotoperatios Apparentages(Ma)
Analysis U 206Pb U/Th 206Pb* ± 207Pb* ± 206Pb* ± error 206Pb* ± 207Pb* ± 206Pb* ± Bestage ± (ppm) 204Pb 207Pb* (%) 235U* (%) 238U (%) corr. 238U* (Ma) 235U (Ma) 207Pb* (Ma) (Ma) (Ma)
Spot 70 879 43054 2.0 21.1900 3.6 0.0764 5.9 0.0117 4.7 0.79 75.2 3.5 74.7 4.3 59.0 85.6 75.2 3.5
Spot 71 916 30634 1.3 21.0416 2.3 0.0791 3.2 0.0121 2.2 0.70 77.3 1.7 77.3 2.4 75.7 53.6 77.3 1.7
Spot 72 586 37812 1.7 20.2712 2.1 0.1234 2.7 0.0181 1.7 0.63 115.9 1.9 118.1 3.0 163.6 48.7 115.9 1.9
Spot 73 143 159381 3.9 20.1776 4.6 0.1901 5.3 0.0278 2.7 0.51 176.9 4.7 176.7 8.6 174.4 107.3 176.9 4.7
Spot 74 47 3359 0.8 20.7440 6.8 0.1697 8.1 0.0255 4.4 0.54 162.5 7.0 159.1 11.9 109.4 161.0 162.5 7.0
Spot 75 736 76958 2.3 20.8058 2.7 0.0747 3.7 0.0113 2.5 0.67 72.3 1.8 73.1 2.6 102.4 64.9 72.3 1.8
Spot 76 59 3743 1.1 19.9682 6.7 0.1816 7.6 0.0263 3.6 0.47 167.3 5.9 169.4 11.9 198.7 156.4 167.3 5.9
Spot 77 881 19687 2.5 20.6728 2.4 0.0771 3.4 0.0116 2.5 0.72 74.1 1.8 75.4 2.5 117.5 55.6 74.1 1.8
Spot 78 60 1711 1.2 28.9579 7.1 0.0585 7.9 0.0123 3.4 0.43 78.7 2.7 57.7 4.4 746.2 199.8 78.7 2.7
Spot 79 110 18599 1.4 21.0874 5.4 0.1482 5.9 0.0227 2.3 0.39 144.5 3.3 140.3 7.7 70.5 128.9 144.5 3.3
Spot 80 465 48540 2.8 20.3441 2.8 0.0832 3.5 0.0123 2.1 0.61 78.7 1.7 81.2 2.8 155.2 65.9 78.7 1.7
Spot 81 449 47608 3.6 20.3362 3.5 0.0839 4.7 0.0124 3.2 0.67 79.3 2.5 81.8 3.7 156.1 82.5 79.3 2.5
Spot 82 741 27292 1.0 21.2737 2.2 0.0747 3.7 0.0115 3.0 0.81 73.9 2.2 73.1 2.6 49.6 52.3 73.9 2.2
Spot 83 358 47098 2.9 19.8386 4.0 0.0809 5.2 0.0116 3.3 0.64 74.6 2.5 79.0 4.0 213.8 93.1 74.6 2.5
Spot 84 291 33037 2.5 19.9612 3.2 0.0950 5.4 0.0138 4.4 0.80 88.0 3.8 92.1 4.8 199.5 74.7 88.0 3.8
Spot 85 263 38014 1.8 20.7846 2.7 0.1513 3.4 0.0228 2.1 0.61 145.3 3.0 143.0 4.5 104.8 63.7 145.3 3.0
Spot 86 544 13809 3.6 20.5022 2.9 0.0787 3.8 0.0117 2.5 0.66 75.0 1.9 76.9 2.8 137.1 67.0 75.0 1.9
Spot 87 594 31485 6.5 19.9328 2.7 0.1561 3.7 0.0226 2.6 0.69 143.9 3.7 147.3 5.1 202.8 62.4 143.9 3.7
Spot 88 1126 24507 2.4 20.4705 2.9 0.0788 3.9 0.0117 2.6 0.67 75.0 1.9 77.1 2.9 140.7 67.5 75.0 1.9
Spot 89 571 29523 1.7 21.4043 4.0 0.0759 4.5 0.0118 2.0 0.45 75.5 1.5 74.2 3.2 34.9 95.4 75.5 1.5
Spot 90 146 26244 4.0 21.9998 4.8 0.0776 5.7 0.0124 3.0 0.52 79.3 2.3 75.9 4.1 31.2 117.2 79.3 2.3
Spot 91 372 21046 1.9 20.5996 2.8 0.1601 3.6 0.0239 2.2 0.62 152.4 3.4 150.8 5.0 125.9 66.0 152.4 3.4
Spot 92 914 34514 3.1 21.7084 2.8 0.0753 3.7 0.0119 2.3 0.64 76.0 1.8 73.7 2.6 1.0 67.8 76.0 1.8
Spot 94 720 30278 1.9 21.4280 3.5 0.0750 4.4 0.0117 2.6 0.59 74.7 1.9 73.5 3.1 32.3 84.0 74.7 1.9
Spot 95 585 64515 2.9 21.1792 2.7 0.0770 3.6 0.0118 2.4 0.66 75.8 1.8 75.3 2.6 60.2 63.8 75.8 1.8
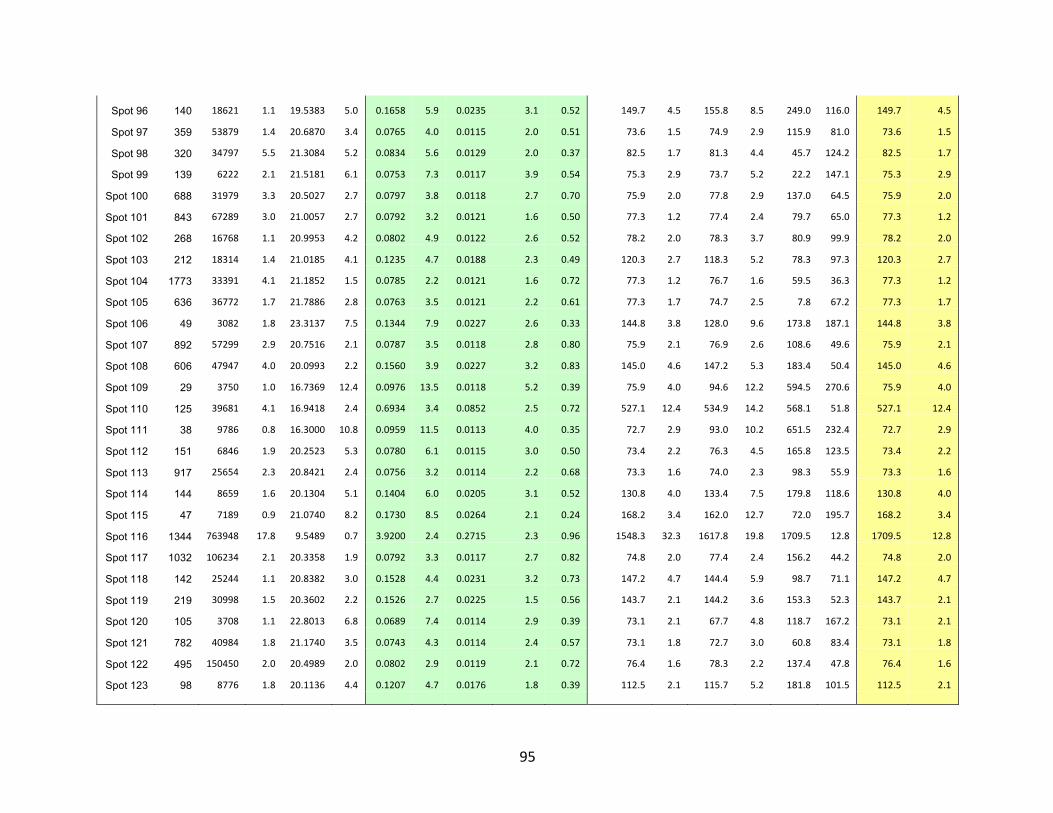
95
Spot 96 140 18621 1.1 19.5383 5.0 0.1658 5.9 0.0235 3.1 0.52 149.7 4.5 155.8 8.5 249.0 116.0 149.7 4.5
Spot 97 359 53879 1.4 20.6870 3.4 0.0765 4.0 0.0115 2.0 0.51 73.6 1.5 74.9 2.9 115.9 81.0 73.6 1.5
Spot 98 320 34797 5.5 21.3084 5.2 0.0834 5.6 0.0129 2.0 0.37 82.5 1.7 81.3 4.4 45.7 124.2 82.5 1.7
Spot 99 139 6222 2.1 21.5181 6.1 0.0753 7.3 0.0117 3.9 0.54 75.3 2.9 73.7 5.2 22.2 147.1 75.3 2.9
Spot 100 688 31979 3.3 20.5027 2.7 0.0797 3.8 0.0118 2.7 0.70 75.9 2.0 77.8 2.9 137.0 64.5 75.9 2.0
Spot 101 843 67289 3.0 21.0057 2.7 0.0792 3.2 0.0121 1.6 0.50 77.3 1.2 77.4 2.4 79.7 65.0 77.3 1.2
Spot 102 268 16768 1.1 20.9953 4.2 0.0802 4.9 0.0122 2.6 0.52 78.2 2.0 78.3 3.7 80.9 99.9 78.2 2.0
Spot 103 212 18314 1.4 21.0185 4.1 0.1235 4.7 0.0188 2.3 0.49 120.3 2.7 118.3 5.2 78.3 97.3 120.3 2.7
Spot 104 1773 33391 4.1 21.1852 1.5 0.0785 2.2 0.0121 1.6 0.72 77.3 1.2 76.7 1.6 59.5 36.3 77.3 1.2
Spot 105 636 36772 1.7 21.7886 2.8 0.0763 3.5 0.0121 2.2 0.61 77.3 1.7 74.7 2.5 7.8 67.2 77.3 1.7
Spot 106 49 3082 1.8 23.3137 7.5 0.1344 7.9 0.0227 2.6 0.33 144.8 3.8 128.0 9.6 173.8 187.1 144.8 3.8
Spot 107 892 57299 2.9 20.7516 2.1 0.0787 3.5 0.0118 2.8 0.80 75.9 2.1 76.9 2.6 108.6 49.6 75.9 2.1
Spot 108 606 47947 4.0 20.0993 2.2 0.1560 3.9 0.0227 3.2 0.83 145.0 4.6 147.2 5.3 183.4 50.4 145.0 4.6
Spot 109 29 3750 1.0 16.7369 12.4 0.0976 13.5 0.0118 5.2 0.39 75.9 4.0 94.6 12.2 594.5 270.6 75.9 4.0
Spot 110 125 39681 4.1 16.9418 2.4 0.6934 3.4 0.0852 2.5 0.72 527.1 12.4 534.9 14.2 568.1 51.8 527.1 12.4
Spot 111 38 9786 0.8 16.3000 10.8 0.0959 11.5 0.0113 4.0 0.35 72.7 2.9 93.0 10.2 651.5 232.4 72.7 2.9
Spot 112 151 6846 1.9 20.2523 5.3 0.0780 6.1 0.0115 3.0 0.50 73.4 2.2 76.3 4.5 165.8 123.5 73.4 2.2
Spot 113 917 25654 2.3 20.8421 2.4 0.0756 3.2 0.0114 2.2 0.68 73.3 1.6 74.0 2.3 98.3 55.9 73.3 1.6
Spot 114 144 8659 1.6 20.1304 5.1 0.1404 6.0 0.0205 3.1 0.52 130.8 4.0 133.4 7.5 179.8 118.6 130.8 4.0
Spot 115 47 7189 0.9 21.0740 8.2 0.1730 8.5 0.0264 2.1 0.24 168.2 3.4 162.0 12.7 72.0 195.7 168.2 3.4
Spot 116 1344 763948 17.8 9.5489 0.7 3.9200 2.4 0.2715 2.3 0.96 1548.3 32.3 1617.8 19.8 1709.5 12.8 1709.5 12.8
Spot 117 1032 106234 2.1 20.3358 1.9 0.0792 3.3 0.0117 2.7 0.82 74.8 2.0 77.4 2.4 156.2 44.2 74.8 2.0
Spot 118 142 25244 1.1 20.8382 3.0 0.1528 4.4 0.0231 3.2 0.73 147.2 4.7 144.4 5.9 98.7 71.1 147.2 4.7
Spot 119 219 30998 1.5 20.3602 2.2 0.1526 2.7 0.0225 1.5 0.56 143.7 2.1 144.2 3.6 153.3 52.3 143.7 2.1
Spot 120 105 3708 1.1 22.8013 6.8 0.0689 7.4 0.0114 2.9 0.39 73.1 2.1 67.7 4.8 118.7 167.2 73.1 2.1
Spot 121 782 40984 1.8 21.1740 3.5 0.0743 4.3 0.0114 2.4 0.57 73.1 1.8 72.7 3.0 60.8 83.4 73.1 1.8
Spot 122 495 150450 2.0 20.4989 2.0 0.0802 2.9 0.0119 2.1 0.72 76.4 1.6 78.3 2.2 137.4 47.8 76.4 1.6
Spot 123 98 8776 1.8 20.1136 4.4 0.1207 4.7 0.0176 1.8 0.39 112.5 2.1 115.7 5.2 181.8 101.5 112.5 2.1
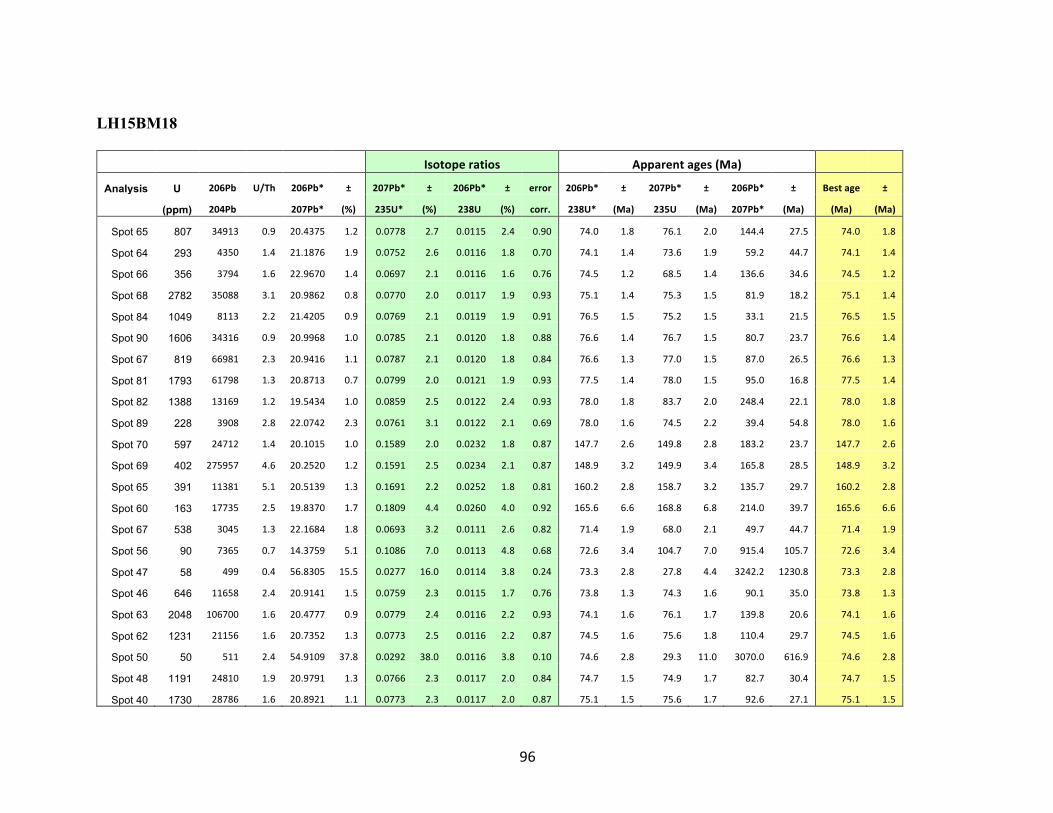
96
LH15BM18
Isotoperatios Apparentages(Ma)
Analysis U 206Pb U/Th 206Pb* ± 207Pb* ± 206Pb* ± error 206Pb* ± 207Pb* ± 206Pb* ± Bestage ±
(ppm) 204Pb 207Pb* (%) 235U* (%) 238U (%) corr. 238U* (Ma) 235U (Ma) 207Pb* (Ma) (Ma) (Ma)
Spot 65 807 34913 0.9 20.4375 1.2 0.0778 2.7 0.0115 2.4 0.90 74.0 1.8 76.1 2.0 144.4 27.5 74.0 1.8
Spot 64 293 4350 1.4 21.1876 1.9 0.0752 2.6 0.0116 1.8 0.70 74.1 1.4 73.6 1.9 59.2 44.7 74.1 1.4
Spot 66 356 3794 1.6 22.9670 1.4 0.0697 2.1 0.0116 1.6 0.76 74.5 1.2 68.5 1.4 136.6 34.6 74.5 1.2
Spot 68 2782 35088 3.1 20.9862 0.8 0.0770 2.0 0.0117 1.9 0.93 75.1 1.4 75.3 1.5 81.9 18.2 75.1 1.4
Spot 84 1049 8113 2.2 21.4205 0.9 0.0769 2.1 0.0119 1.9 0.91 76.5 1.5 75.2 1.5 33.1 21.5 76.5 1.5
Spot 90 1606 34316 0.9 20.9968 1.0 0.0785 2.1 0.0120 1.8 0.88 76.6 1.4 76.7 1.5 80.7 23.7 76.6 1.4
Spot 67 819 66981 2.3 20.9416 1.1 0.0787 2.1 0.0120 1.8 0.84 76.6 1.3 77.0 1.5 87.0 26.5 76.6 1.3
Spot 81 1793 61798 1.3 20.8713 0.7 0.0799 2.0 0.0121 1.9 0.93 77.5 1.4 78.0 1.5 95.0 16.8 77.5 1.4
Spot 82 1388 13169 1.2 19.5434 1.0 0.0859 2.5 0.0122 2.4 0.93 78.0 1.8 83.7 2.0 248.4 22.1 78.0 1.8
Spot 89 228 3908 2.8 22.0742 2.3 0.0761 3.1 0.0122 2.1 0.69 78.0 1.6 74.5 2.2 39.4 54.8 78.0 1.6
Spot 70 597 24712 1.4 20.1015 1.0 0.1589 2.0 0.0232 1.8 0.87 147.7 2.6 149.8 2.8 183.2 23.7 147.7 2.6
Spot 69 402 275957 4.6 20.2520 1.2 0.1591 2.5 0.0234 2.1 0.87 148.9 3.2 149.9 3.4 165.8 28.5 148.9 3.2
Spot 65 391 11381 5.1 20.5139 1.3 0.1691 2.2 0.0252 1.8 0.81 160.2 2.8 158.7 3.2 135.7 29.7 160.2 2.8
Spot 60 163 17735 2.5 19.8370 1.7 0.1809 4.4 0.0260 4.0 0.92 165.6 6.6 168.8 6.8 214.0 39.7 165.6 6.6
Spot 67 538 3045 1.3 22.1684 1.8 0.0693 3.2 0.0111 2.6 0.82 71.4 1.9 68.0 2.1 49.7 44.7 71.4 1.9
Spot 56 90 7365 0.7 14.3759 5.1 0.1086 7.0 0.0113 4.8 0.68 72.6 3.4 104.7 7.0 915.4 105.7 72.6 3.4
Spot 47 58 499 0.4 56.8305 15.5 0.0277 16.0 0.0114 3.8 0.24 73.3 2.8 27.8 4.4 3242.2 1230.8 73.3 2.8
Spot 46 646 11658 2.4 20.9141 1.5 0.0759 2.3 0.0115 1.7 0.76 73.8 1.3 74.3 1.6 90.1 35.0 73.8 1.3
Spot 63 2048 106700 1.6 20.4777 0.9 0.0779 2.4 0.0116 2.2 0.93 74.1 1.6 76.1 1.7 139.8 20.6 74.1 1.6
Spot 62 1231 21156 1.6 20.7352 1.3 0.0773 2.5 0.0116 2.2 0.87 74.5 1.6 75.6 1.8 110.4 29.7 74.5 1.6
Spot 50 50 511 2.4 54.9109 37.8 0.0292 38.0 0.0116 3.8 0.10 74.6 2.8 29.3 11.0 3070.0 616.9 74.6 2.8
Spot 48 1191 24810 1.9 20.9791 1.3 0.0766 2.3 0.0117 2.0 0.84 74.7 1.5 74.9 1.7 82.7 30.4 74.7 1.5
Spot 40 1730 28786 1.6 20.8921 1.1 0.0773 2.3 0.0117 2.0 0.87 75.1 1.5 75.6 1.7 92.6 27.1 75.1 1.5
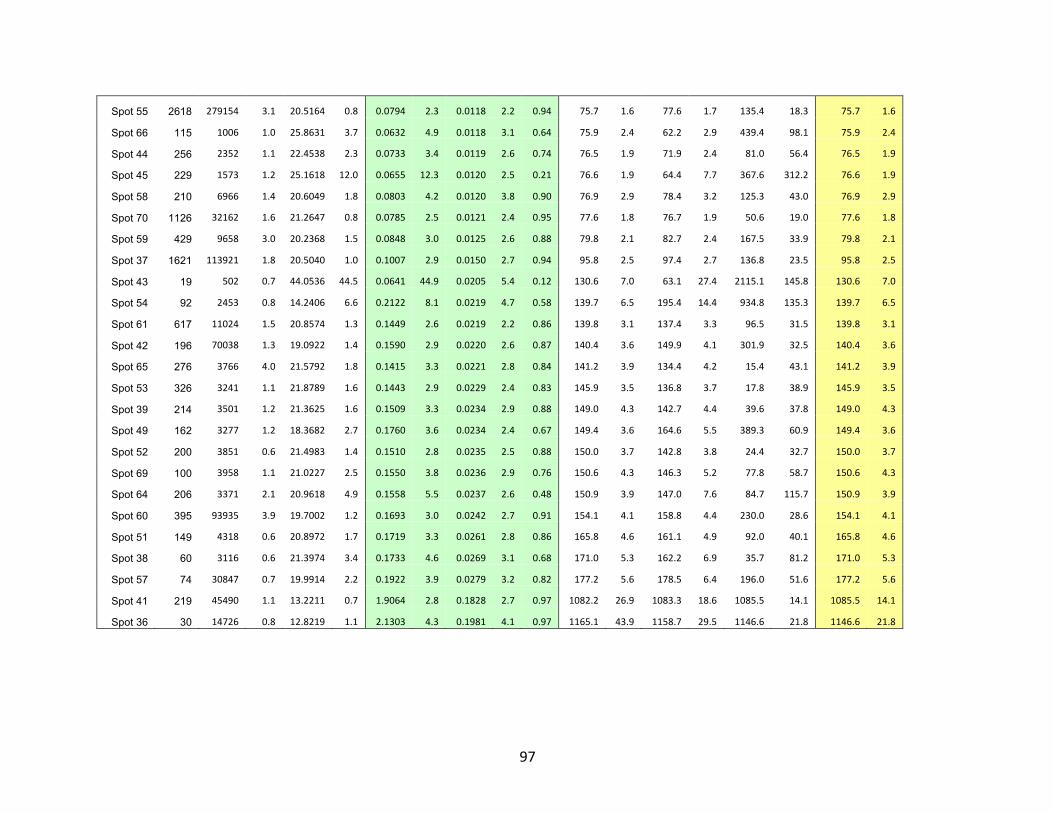
97
Spot 55 2618 279154 3.1 20.5164 0.8 0.0794 2.3 0.0118 2.2 0.94 75.7 1.6 77.6 1.7 135.4 18.3 75.7 1.6
Spot 66 115 1006 1.0 25.8631 3.7 0.0632 4.9 0.0118 3.1 0.64 75.9 2.4 62.2 2.9 439.4 98.1 75.9 2.4
Spot 44 256 2352 1.1 22.4538 2.3 0.0733 3.4 0.0119 2.6 0.74 76.5 1.9 71.9 2.4 81.0 56.4 76.5 1.9
Spot 45 229 1573 1.2 25.1618 12.0 0.0655 12.3 0.0120 2.5 0.21 76.6 1.9 64.4 7.7 367.6 312.2 76.6 1.9
Spot 58 210 6966 1.4 20.6049 1.8 0.0803 4.2 0.0120 3.8 0.90 76.9 2.9 78.4 3.2 125.3 43.0 76.9 2.9
Spot 70 1126 32162 1.6 21.2647 0.8 0.0785 2.5 0.0121 2.4 0.95 77.6 1.8 76.7 1.9 50.6 19.0 77.6 1.8
Spot 59 429 9658 3.0 20.2368 1.5 0.0848 3.0 0.0125 2.6 0.88 79.8 2.1 82.7 2.4 167.5 33.9 79.8 2.1
Spot 37 1621 113921 1.8 20.5040 1.0 0.1007 2.9 0.0150 2.7 0.94 95.8 2.5 97.4 2.7 136.8 23.5 95.8 2.5
Spot 43 19 502 0.7 44.0536 44.5 0.0641 44.9 0.0205 5.4 0.12 130.6 7.0 63.1 27.4 2115.1 145.8 130.6 7.0
Spot 54 92 2453 0.8 14.2406 6.6 0.2122 8.1 0.0219 4.7 0.58 139.7 6.5 195.4 14.4 934.8 135.3 139.7 6.5
Spot 61 617 11024 1.5 20.8574 1.3 0.1449 2.6 0.0219 2.2 0.86 139.8 3.1 137.4 3.3 96.5 31.5 139.8 3.1
Spot 42 196 70038 1.3 19.0922 1.4 0.1590 2.9 0.0220 2.6 0.87 140.4 3.6 149.9 4.1 301.9 32.5 140.4 3.6
Spot 65 276 3766 4.0 21.5792 1.8 0.1415 3.3 0.0221 2.8 0.84 141.2 3.9 134.4 4.2 15.4 43.1 141.2 3.9
Spot 53 326 3241 1.1 21.8789 1.6 0.1443 2.9 0.0229 2.4 0.83 145.9 3.5 136.8 3.7 17.8 38.9 145.9 3.5
Spot 39 214 3501 1.2 21.3625 1.6 0.1509 3.3 0.0234 2.9 0.88 149.0 4.3 142.7 4.4 39.6 37.8 149.0 4.3
Spot 49 162 3277 1.2 18.3682 2.7 0.1760 3.6 0.0234 2.4 0.67 149.4 3.6 164.6 5.5 389.3 60.9 149.4 3.6
Spot 52 200 3851 0.6 21.4983 1.4 0.1510 2.8 0.0235 2.5 0.88 150.0 3.7 142.8 3.8 24.4 32.7 150.0 3.7
Spot 69 100 3958 1.1 21.0227 2.5 0.1550 3.8 0.0236 2.9 0.76 150.6 4.3 146.3 5.2 77.8 58.7 150.6 4.3
Spot 64 206 3371 2.1 20.9618 4.9 0.1558 5.5 0.0237 2.6 0.48 150.9 3.9 147.0 7.6 84.7 115.7 150.9 3.9
Spot 60 395 93935 3.9 19.7002 1.2 0.1693 3.0 0.0242 2.7 0.91 154.1 4.1 158.8 4.4 230.0 28.6 154.1 4.1
Spot 51 149 4318 0.6 20.8972 1.7 0.1719 3.3 0.0261 2.8 0.86 165.8 4.6 161.1 4.9 92.0 40.1 165.8 4.6
Spot 38 60 3116 0.6 21.3974 3.4 0.1733 4.6 0.0269 3.1 0.68 171.0 5.3 162.2 6.9 35.7 81.2 171.0 5.3
Spot 57 74 30847 0.7 19.9914 2.2 0.1922 3.9 0.0279 3.2 0.82 177.2 5.6 178.5 6.4 196.0 51.6 177.2 5.6
Spot 41 219 45490 1.1 13.2211 0.7 1.9064 2.8 0.1828 2.7 0.97 1082.2 26.9 1083.3 18.6 1085.5 14.1 1085.5 14.1
Spot 36 30 14726 0.8 12.8219 1.1 2.1303 4.3 0.1981 4.1 0.97 1165.1 43.9 1158.7 29.5 1146.6 21.8 1146.6 21.8
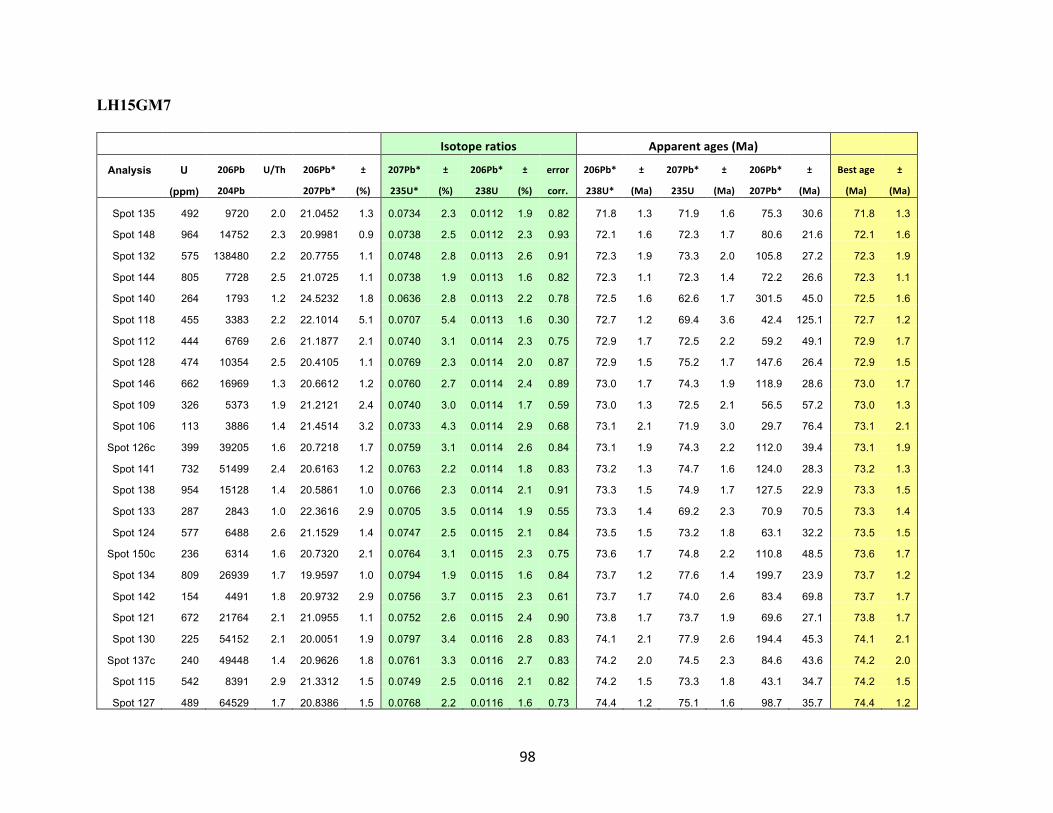
98
LH15GM7
Isotoperatios Apparentages(Ma)
Analysis U 206Pb U/Th 206Pb* ± 207Pb* ± 206Pb* ± error 206Pb* ± 207Pb* ± 206Pb* ± Bestage ±
(ppm) 204Pb 207Pb* (%) 235U* (%) 238U (%) corr. 238U* (Ma) 235U (Ma) 207Pb* (Ma) (Ma) (Ma)
Spot 135 492 9720 2.0 21.0452 1.3 0.0734 2.3 0.0112 1.9 0.82 71.8 1.3 71.9 1.6 75.3 30.6 71.8 1.3
Spot 148 964 14752 2.3 20.9981 0.9 0.0738 2.5 0.0112 2.3 0.93 72.1 1.6 72.3 1.7 80.6 21.6 72.1 1.6
Spot 132 575 138480 2.2 20.7755 1.1 0.0748 2.8 0.0113 2.6 0.91 72.3 1.9 73.3 2.0 105.8 27.2 72.3 1.9
Spot 144 805 7728 2.5 21.0725 1.1 0.0738 1.9 0.0113 1.6 0.82 72.3 1.1 72.3 1.4 72.2 26.6 72.3 1.1
Spot 140 264 1793 1.2 24.5232 1.8 0.0636 2.8 0.0113 2.2 0.78 72.5 1.6 62.6 1.7 301.5 45.0 72.5 1.6
Spot 118 455 3383 2.2 22.1014 5.1 0.0707 5.4 0.0113 1.6 0.30 72.7 1.2 69.4 3.6 42.4 125.1 72.7 1.2
Spot 112 444 6769 2.6 21.1877 2.1 0.0740 3.1 0.0114 2.3 0.75 72.9 1.7 72.5 2.2 59.2 49.1 72.9 1.7
Spot 128 474 10354 2.5 20.4105 1.1 0.0769 2.3 0.0114 2.0 0.87 72.9 1.5 75.2 1.7 147.6 26.4 72.9 1.5
Spot 146 662 16969 1.3 20.6612 1.2 0.0760 2.7 0.0114 2.4 0.89 73.0 1.7 74.3 1.9 118.9 28.6 73.0 1.7
Spot 109 326 5373 1.9 21.2121 2.4 0.0740 3.0 0.0114 1.7 0.59 73.0 1.3 72.5 2.1 56.5 57.2 73.0 1.3
Spot 106 113 3886 1.4 21.4514 3.2 0.0733 4.3 0.0114 2.9 0.68 73.1 2.1 71.9 3.0 29.7 76.4 73.1 2.1
Spot 126c 399 39205 1.6 20.7218 1.7 0.0759 3.1 0.0114 2.6 0.84 73.1 1.9 74.3 2.2 112.0 39.4 73.1 1.9
Spot 141 732 51499 2.4 20.6163 1.2 0.0763 2.2 0.0114 1.8 0.83 73.2 1.3 74.7 1.6 124.0 28.3 73.2 1.3
Spot 138 954 15128 1.4 20.5861 1.0 0.0766 2.3 0.0114 2.1 0.91 73.3 1.5 74.9 1.7 127.5 22.9 73.3 1.5
Spot 133 287 2843 1.0 22.3616 2.9 0.0705 3.5 0.0114 1.9 0.55 73.3 1.4 69.2 2.3 70.9 70.5 73.3 1.4
Spot 124 577 6488 2.6 21.1529 1.4 0.0747 2.5 0.0115 2.1 0.84 73.5 1.5 73.2 1.8 63.1 32.2 73.5 1.5
Spot 150c 236 6314 1.6 20.7320 2.1 0.0764 3.1 0.0115 2.3 0.75 73.6 1.7 74.8 2.2 110.8 48.5 73.6 1.7
Spot 134 809 26939 1.7 19.9597 1.0 0.0794 1.9 0.0115 1.6 0.84 73.7 1.2 77.6 1.4 199.7 23.9 73.7 1.2
Spot 142 154 4491 1.8 20.9732 2.9 0.0756 3.7 0.0115 2.3 0.61 73.7 1.7 74.0 2.6 83.4 69.8 73.7 1.7
Spot 121 672 21764 2.1 21.0955 1.1 0.0752 2.6 0.0115 2.4 0.90 73.8 1.7 73.7 1.9 69.6 27.1 73.8 1.7
Spot 130 225 54152 2.1 20.0051 1.9 0.0797 3.4 0.0116 2.8 0.83 74.1 2.1 77.9 2.6 194.4 45.3 74.1 2.1
Spot 137c 240 49448 1.4 20.9626 1.8 0.0761 3.3 0.0116 2.7 0.83 74.2 2.0 74.5 2.3 84.6 43.6 74.2 2.0
Spot 115 542 8391 2.9 21.3312 1.5 0.0749 2.5 0.0116 2.1 0.82 74.2 1.5 73.3 1.8 43.1 34.7 74.2 1.5
Spot 127 489 64529 1.7 20.8386 1.5 0.0768 2.2 0.0116 1.6 0.73 74.4 1.2 75.1 1.6 98.7 35.7 74.4 1.2
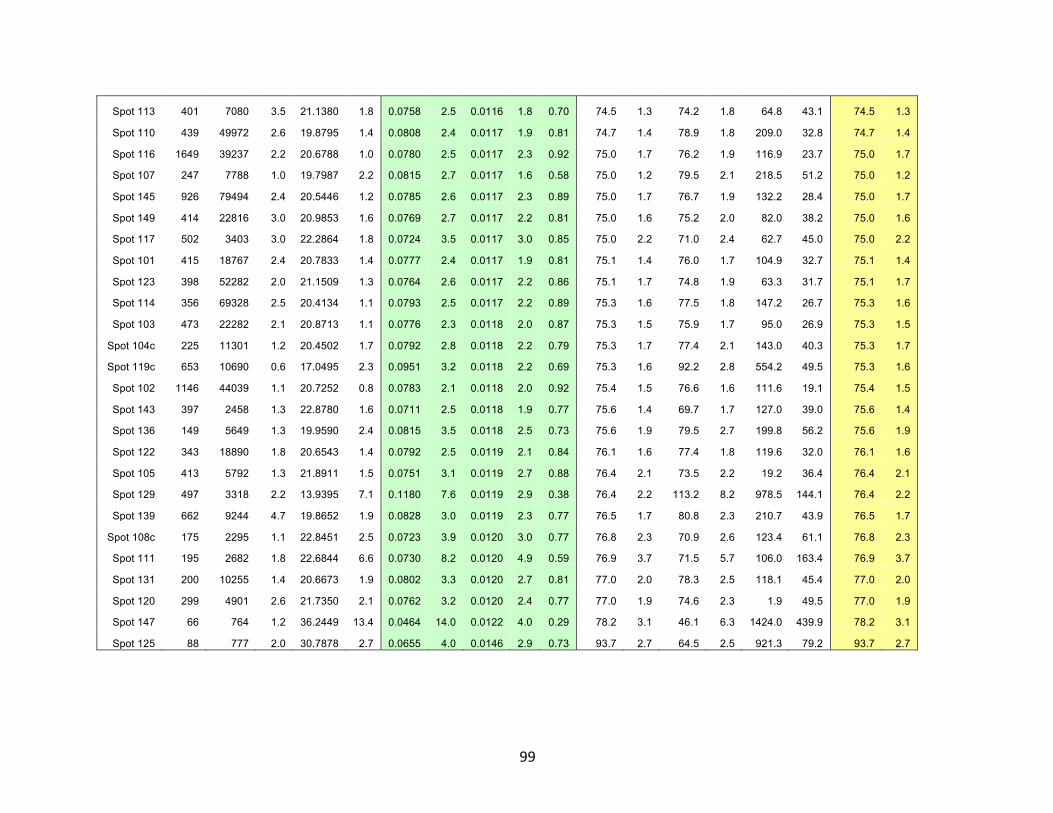
99
Spot 113 401 7080 3.5 21.1380 1.8 0.0758 2.5 0.0116 1.8 0.70 74.5 1.3 74.2 1.8 64.8 43.1 74.5 1.3
Spot 110 439 49972 2.6 19.8795 1.4 0.0808 2.4 0.0117 1.9 0.81 74.7 1.4 78.9 1.8 209.0 32.8 74.7 1.4
Spot 116 1649 39237 2.2 20.6788 1.0 0.0780 2.5 0.0117 2.3 0.92 75.0 1.7 76.2 1.9 116.9 23.7 75.0 1.7
Spot 107 247 7788 1.0 19.7987 2.2 0.0815 2.7 0.0117 1.6 0.58 75.0 1.2 79.5 2.1 218.5 51.2 75.0 1.2
Spot 145 926 79494 2.4 20.5446 1.2 0.0785 2.6 0.0117 2.3 0.89 75.0 1.7 76.7 1.9 132.2 28.4 75.0 1.7
Spot 149 414 22816 3.0 20.9853 1.6 0.0769 2.7 0.0117 2.2 0.81 75.0 1.6 75.2 2.0 82.0 38.2 75.0 1.6
Spot 117 502 3403 3.0 22.2864 1.8 0.0724 3.5 0.0117 3.0 0.85 75.0 2.2 71.0 2.4 62.7 45.0 75.0 2.2
Spot 101 415 18767 2.4 20.7833 1.4 0.0777 2.4 0.0117 1.9 0.81 75.1 1.4 76.0 1.7 104.9 32.7 75.1 1.4
Spot 123 398 52282 2.0 21.1509 1.3 0.0764 2.6 0.0117 2.2 0.86 75.1 1.7 74.8 1.9 63.3 31.7 75.1 1.7
Spot 114 356 69328 2.5 20.4134 1.1 0.0793 2.5 0.0117 2.2 0.89 75.3 1.6 77.5 1.8 147.2 26.7 75.3 1.6
Spot 103 473 22282 2.1 20.8713 1.1 0.0776 2.3 0.0118 2.0 0.87 75.3 1.5 75.9 1.7 95.0 26.9 75.3 1.5
Spot 104c 225 11301 1.2 20.4502 1.7 0.0792 2.8 0.0118 2.2 0.79 75.3 1.7 77.4 2.1 143.0 40.3 75.3 1.7
Spot 119c 653 10690 0.6 17.0495 2.3 0.0951 3.2 0.0118 2.2 0.69 75.3 1.6 92.2 2.8 554.2 49.5 75.3 1.6
Spot 102 1146 44039 1.1 20.7252 0.8 0.0783 2.1 0.0118 2.0 0.92 75.4 1.5 76.6 1.6 111.6 19.1 75.4 1.5
Spot 143 397 2458 1.3 22.8780 1.6 0.0711 2.5 0.0118 1.9 0.77 75.6 1.4 69.7 1.7 127.0 39.0 75.6 1.4
Spot 136 149 5649 1.3 19.9590 2.4 0.0815 3.5 0.0118 2.5 0.73 75.6 1.9 79.5 2.7 199.8 56.2 75.6 1.9
Spot 122 343 18890 1.8 20.6543 1.4 0.0792 2.5 0.0119 2.1 0.84 76.1 1.6 77.4 1.8 119.6 32.0 76.1 1.6
Spot 105 413 5792 1.3 21.8911 1.5 0.0751 3.1 0.0119 2.7 0.88 76.4 2.1 73.5 2.2 19.2 36.4 76.4 2.1
Spot 129 497 3318 2.2 13.9395 7.1 0.1180 7.6 0.0119 2.9 0.38 76.4 2.2 113.2 8.2 978.5 144.1 76.4 2.2
Spot 139 662 9244 4.7 19.8652 1.9 0.0828 3.0 0.0119 2.3 0.77 76.5 1.7 80.8 2.3 210.7 43.9 76.5 1.7
Spot 108c 175 2295 1.1 22.8451 2.5 0.0723 3.9 0.0120 3.0 0.77 76.8 2.3 70.9 2.6 123.4 61.1 76.8 2.3
Spot 111 195 2682 1.8 22.6844 6.6 0.0730 8.2 0.0120 4.9 0.59 76.9 3.7 71.5 5.7 106.0 163.4 76.9 3.7
Spot 131 200 10255 1.4 20.6673 1.9 0.0802 3.3 0.0120 2.7 0.81 77.0 2.0 78.3 2.5 118.1 45.4 77.0 2.0
Spot 120 299 4901 2.6 21.7350 2.1 0.0762 3.2 0.0120 2.4 0.77 77.0 1.9 74.6 2.3 1.9 49.5 77.0 1.9
Spot 147 66 764 1.2 36.2449 13.4 0.0464 14.0 0.0122 4.0 0.29 78.2 3.1 46.1 6.3 1424.0 439.9 78.2 3.1
Spot 125 88 777 2.0 30.7878 2.7 0.0655 4.0 0.0146 2.9 0.73 93.7 2.7 64.5 2.5 921.3 79.2 93.7 2.7
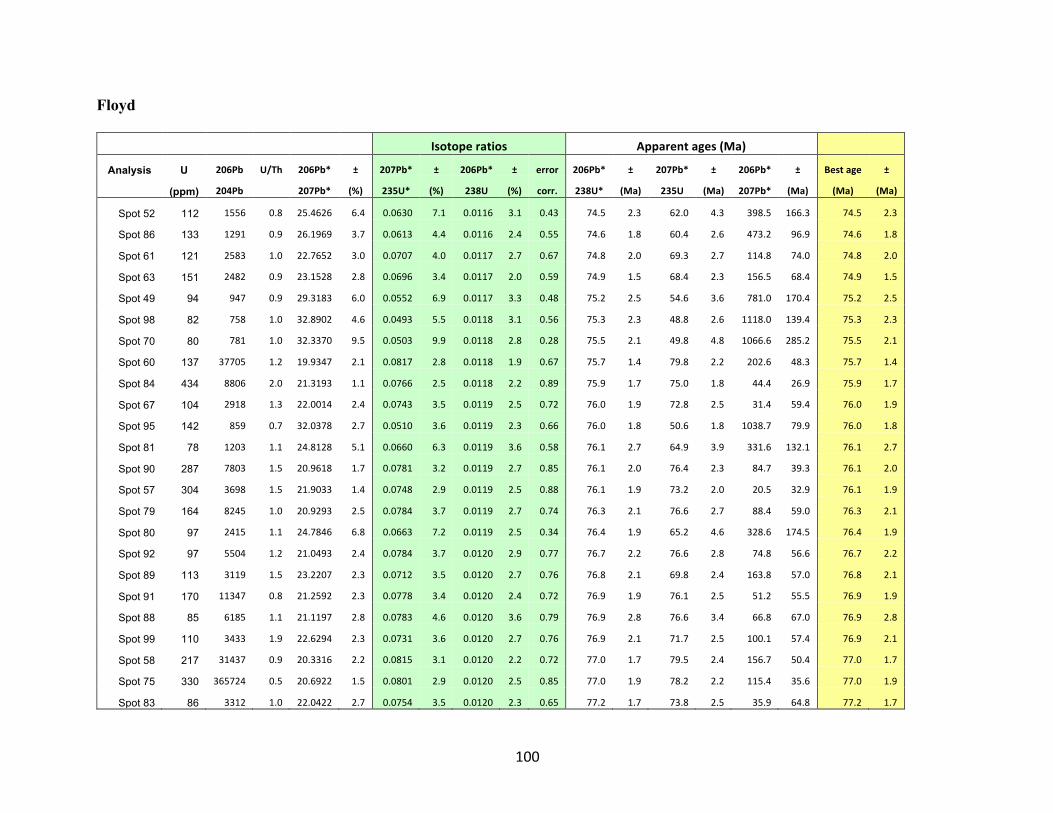
100
Floyd
Isotoperatios Apparentages(Ma)
Analysis U 206Pb U/Th 206Pb* ± 207Pb* ± 206Pb* ± error 206Pb* ± 207Pb* ± 206Pb* ± Bestage ±
(ppm) 204Pb 207Pb* (%) 235U* (%) 238U (%) corr. 238U* (Ma) 235U (Ma) 207Pb* (Ma) (Ma) (Ma)
Spot 52 112 1556 0.8 25.4626 6.4 0.0630 7.1 0.0116 3.1 0.43 74.5 2.3 62.0 4.3 398.5 166.3 74.5 2.3
Spot 86 133 1291 0.9 26.1969 3.7 0.0613 4.4 0.0116 2.4 0.55 74.6 1.8 60.4 2.6 473.2 96.9 74.6 1.8
Spot 61 121 2583 1.0 22.7652 3.0 0.0707 4.0 0.0117 2.7 0.67 74.8 2.0 69.3 2.7 114.8 74.0 74.8 2.0
Spot 63 151 2482 0.9 23.1528 2.8 0.0696 3.4 0.0117 2.0 0.59 74.9 1.5 68.4 2.3 156.5 68.4 74.9 1.5
Spot 49 94 947 0.9 29.3183 6.0 0.0552 6.9 0.0117 3.3 0.48 75.2 2.5 54.6 3.6 781.0 170.4 75.2 2.5
Spot 98 82 758 1.0 32.8902 4.6 0.0493 5.5 0.0118 3.1 0.56 75.3 2.3 48.8 2.6 1118.0 139.4 75.3 2.3
Spot 70 80 781 1.0 32.3370 9.5 0.0503 9.9 0.0118 2.8 0.28 75.5 2.1 49.8 4.8 1066.6 285.2 75.5 2.1
Spot 60 137 37705 1.2 19.9347 2.1 0.0817 2.8 0.0118 1.9 0.67 75.7 1.4 79.8 2.2 202.6 48.3 75.7 1.4
Spot 84 434 8806 2.0 21.3193 1.1 0.0766 2.5 0.0118 2.2 0.89 75.9 1.7 75.0 1.8 44.4 26.9 75.9 1.7
Spot 67 104 2918 1.3 22.0014 2.4 0.0743 3.5 0.0119 2.5 0.72 76.0 1.9 72.8 2.5 31.4 59.4 76.0 1.9
Spot 95 142 859 0.7 32.0378 2.7 0.0510 3.6 0.0119 2.3 0.66 76.0 1.8 50.6 1.8 1038.7 79.9 76.0 1.8
Spot 81 78 1203 1.1 24.8128 5.1 0.0660 6.3 0.0119 3.6 0.58 76.1 2.7 64.9 3.9 331.6 132.1 76.1 2.7
Spot 90 287 7803 1.5 20.9618 1.7 0.0781 3.2 0.0119 2.7 0.85 76.1 2.0 76.4 2.3 84.7 39.3 76.1 2.0
Spot 57 304 3698 1.5 21.9033 1.4 0.0748 2.9 0.0119 2.5 0.88 76.1 1.9 73.2 2.0 20.5 32.9 76.1 1.9
Spot 79 164 8245 1.0 20.9293 2.5 0.0784 3.7 0.0119 2.7 0.74 76.3 2.1 76.6 2.7 88.4 59.0 76.3 2.1
Spot 80 97 2415 1.1 24.7846 6.8 0.0663 7.2 0.0119 2.5 0.34 76.4 1.9 65.2 4.6 328.6 174.5 76.4 1.9
Spot 92 97 5504 1.2 21.0493 2.4 0.0784 3.7 0.0120 2.9 0.77 76.7 2.2 76.6 2.8 74.8 56.6 76.7 2.2
Spot 89 113 3119 1.5 23.2207 2.3 0.0712 3.5 0.0120 2.7 0.76 76.8 2.1 69.8 2.4 163.8 57.0 76.8 2.1
Spot 91 170 11347 0.8 21.2592 2.3 0.0778 3.4 0.0120 2.4 0.72 76.9 1.9 76.1 2.5 51.2 55.5 76.9 1.9
Spot 88 85 6185 1.1 21.1197 2.8 0.0783 4.6 0.0120 3.6 0.79 76.9 2.8 76.6 3.4 66.8 67.0 76.9 2.8
Spot 99 110 3433 1.9 22.6294 2.3 0.0731 3.6 0.0120 2.7 0.76 76.9 2.1 71.7 2.5 100.1 57.4 76.9 2.1
Spot 58 217 31437 0.9 20.3316 2.2 0.0815 3.1 0.0120 2.2 0.72 77.0 1.7 79.5 2.4 156.7 50.4 77.0 1.7
Spot 75 330 365724 0.5 20.6922 1.5 0.0801 2.9 0.0120 2.5 0.85 77.0 1.9 78.2 2.2 115.4 35.6 77.0 1.9
Spot 83 86 3312 1.0 22.0422 2.7 0.0754 3.5 0.0120 2.3 0.65 77.2 1.7 73.8 2.5 35.9 64.8 77.2 1.7
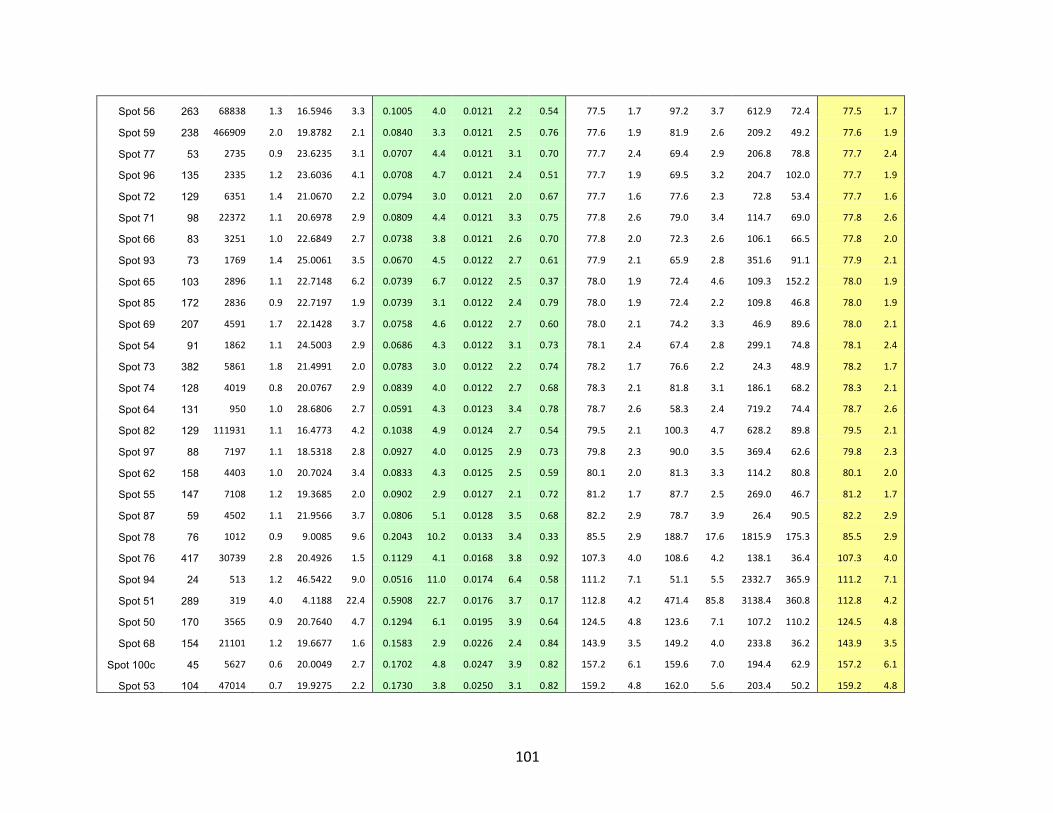
101
Spot 56 263 68838 1.3 16.5946 3.3 0.1005 4.0 0.0121 2.2 0.54 77.5 1.7 97.2 3.7 612.9 72.4 77.5 1.7
Spot 59 238 466909 2.0 19.8782 2.1 0.0840 3.3 0.0121 2.5 0.76 77.6 1.9 81.9 2.6 209.2 49.2 77.6 1.9
Spot 77 53 2735 0.9 23.6235 3.1 0.0707 4.4 0.0121 3.1 0.70 77.7 2.4 69.4 2.9 206.8 78.8 77.7 2.4
Spot 96 135 2335 1.2 23.6036 4.1 0.0708 4.7 0.0121 2.4 0.51 77.7 1.9 69.5 3.2 204.7 102.0 77.7 1.9
Spot 72 129 6351 1.4 21.0670 2.2 0.0794 3.0 0.0121 2.0 0.67 77.7 1.6 77.6 2.3 72.8 53.4 77.7 1.6
Spot 71 98 22372 1.1 20.6978 2.9 0.0809 4.4 0.0121 3.3 0.75 77.8 2.6 79.0 3.4 114.7 69.0 77.8 2.6
Spot 66 83 3251 1.0 22.6849 2.7 0.0738 3.8 0.0121 2.6 0.70 77.8 2.0 72.3 2.6 106.1 66.5 77.8 2.0
Spot 93 73 1769 1.4 25.0061 3.5 0.0670 4.5 0.0122 2.7 0.61 77.9 2.1 65.9 2.8 351.6 91.1 77.9 2.1
Spot 65 103 2896 1.1 22.7148 6.2 0.0739 6.7 0.0122 2.5 0.37 78.0 1.9 72.4 4.6 109.3 152.2 78.0 1.9
Spot 85 172 2836 0.9 22.7197 1.9 0.0739 3.1 0.0122 2.4 0.79 78.0 1.9 72.4 2.2 109.8 46.8 78.0 1.9
Spot 69 207 4591 1.7 22.1428 3.7 0.0758 4.6 0.0122 2.7 0.60 78.0 2.1 74.2 3.3 46.9 89.6 78.0 2.1
Spot 54 91 1862 1.1 24.5003 2.9 0.0686 4.3 0.0122 3.1 0.73 78.1 2.4 67.4 2.8 299.1 74.8 78.1 2.4
Spot 73 382 5861 1.8 21.4991 2.0 0.0783 3.0 0.0122 2.2 0.74 78.2 1.7 76.6 2.2 24.3 48.9 78.2 1.7
Spot 74 128 4019 0.8 20.0767 2.9 0.0839 4.0 0.0122 2.7 0.68 78.3 2.1 81.8 3.1 186.1 68.2 78.3 2.1
Spot 64 131 950 1.0 28.6806 2.7 0.0591 4.3 0.0123 3.4 0.78 78.7 2.6 58.3 2.4 719.2 74.4 78.7 2.6
Spot 82 129 111931 1.1 16.4773 4.2 0.1038 4.9 0.0124 2.7 0.54 79.5 2.1 100.3 4.7 628.2 89.8 79.5 2.1
Spot 97 88 7197 1.1 18.5318 2.8 0.0927 4.0 0.0125 2.9 0.73 79.8 2.3 90.0 3.5 369.4 62.6 79.8 2.3
Spot 62 158 4403 1.0 20.7024 3.4 0.0833 4.3 0.0125 2.5 0.59 80.1 2.0 81.3 3.3 114.2 80.8 80.1 2.0
Spot 55 147 7108 1.2 19.3685 2.0 0.0902 2.9 0.0127 2.1 0.72 81.2 1.7 87.7 2.5 269.0 46.7 81.2 1.7
Spot 87 59 4502 1.1 21.9566 3.7 0.0806 5.1 0.0128 3.5 0.68 82.2 2.9 78.7 3.9 26.4 90.5 82.2 2.9
Spot 78 76 1012 0.9 9.0085 9.6 0.2043 10.2 0.0133 3.4 0.33 85.5 2.9 188.7 17.6 1815.9 175.3 85.5 2.9
Spot 76 417 30739 2.8 20.4926 1.5 0.1129 4.1 0.0168 3.8 0.92 107.3 4.0 108.6 4.2 138.1 36.4 107.3 4.0
Spot 94 24 513 1.2 46.5422 9.0 0.0516 11.0 0.0174 6.4 0.58 111.2 7.1 51.1 5.5 2332.7 365.9 111.2 7.1
Spot 51 289 319 4.0 4.1188 22.4 0.5908 22.7 0.0176 3.7 0.17 112.8 4.2 471.4 85.8 3138.4 360.8 112.8 4.2
Spot 50 170 3565 0.9 20.7640 4.7 0.1294 6.1 0.0195 3.9 0.64 124.5 4.8 123.6 7.1 107.2 110.2 124.5 4.8
Spot 68 154 21101 1.2 19.6677 1.6 0.1583 2.9 0.0226 2.4 0.84 143.9 3.5 149.2 4.0 233.8 36.2 143.9 3.5
Spot 100c 45 5627 0.6 20.0049 2.7 0.1702 4.8 0.0247 3.9 0.82 157.2 6.1 159.6 7.0 194.4 62.9 157.2 6.1
Spot 53 104 47014 0.7 19.9275 2.2 0.1730 3.8 0.0250 3.1 0.82 159.2 4.8 162.0 5.6 203.4 50.2 159.2 4.8
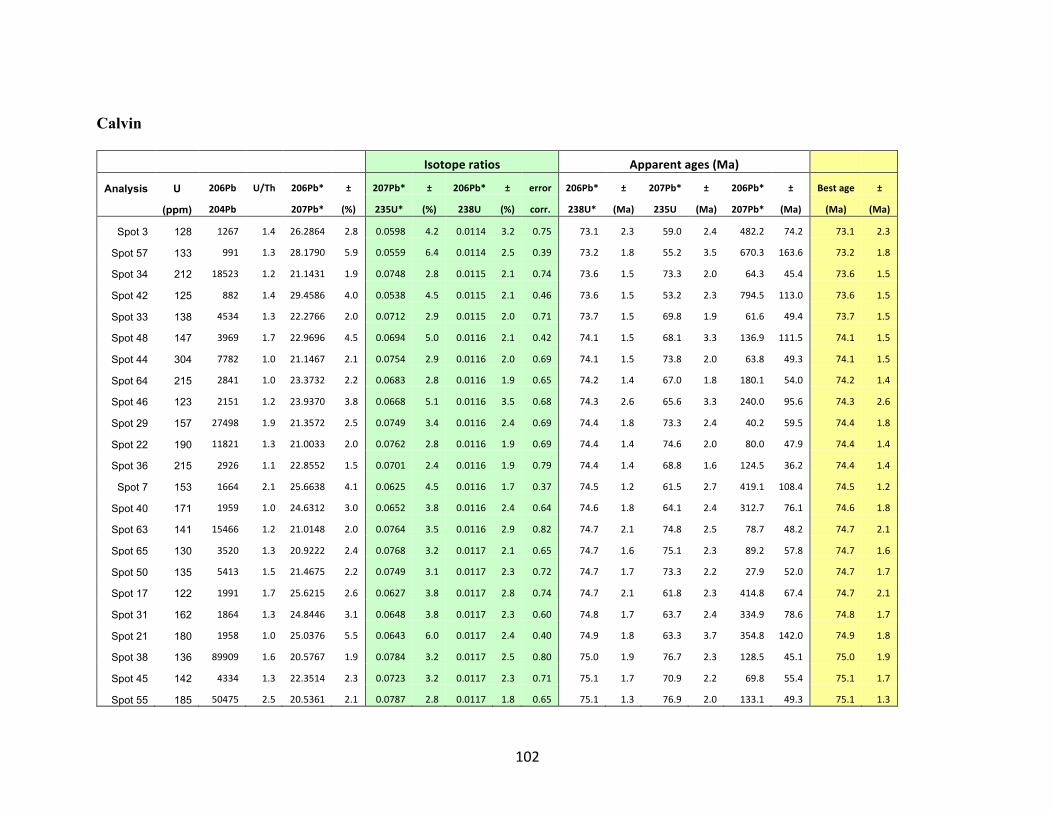
102
Calvin
Isotoperatios Apparentages(Ma)
Analysis U 206Pb U/Th 206Pb* ± 207Pb* ± 206Pb* ± error 206Pb* ± 207Pb* ± 206Pb* ± Bestage ±
(ppm) 204Pb 207Pb* (%) 235U* (%) 238U (%) corr. 238U* (Ma) 235U (Ma) 207Pb* (Ma) (Ma) (Ma)
Spot 3 128 1267 1.4 26.2864 2.8 0.0598 4.2 0.0114 3.2 0.75 73.1 2.3 59.0 2.4 482.2 74.2 73.1 2.3
Spot 57 133 991 1.3 28.1790 5.9 0.0559 6.4 0.0114 2.5 0.39 73.2 1.8 55.2 3.5 670.3 163.6 73.2 1.8
Spot 34 212 18523 1.2 21.1431 1.9 0.0748 2.8 0.0115 2.1 0.74 73.6 1.5 73.3 2.0 64.3 45.4 73.6 1.5
Spot 42 125 882 1.4 29.4586 4.0 0.0538 4.5 0.0115 2.1 0.46 73.6 1.5 53.2 2.3 794.5 113.0 73.6 1.5
Spot 33 138 4534 1.3 22.2766 2.0 0.0712 2.9 0.0115 2.0 0.71 73.7 1.5 69.8 1.9 61.6 49.4 73.7 1.5
Spot 48 147 3969 1.7 22.9696 4.5 0.0694 5.0 0.0116 2.1 0.42 74.1 1.5 68.1 3.3 136.9 111.5 74.1 1.5
Spot 44 304 7782 1.0 21.1467 2.1 0.0754 2.9 0.0116 2.0 0.69 74.1 1.5 73.8 2.0 63.8 49.3 74.1 1.5
Spot 64 215 2841 1.0 23.3732 2.2 0.0683 2.8 0.0116 1.9 0.65 74.2 1.4 67.0 1.8 180.1 54.0 74.2 1.4
Spot 46 123 2151 1.2 23.9370 3.8 0.0668 5.1 0.0116 3.5 0.68 74.3 2.6 65.6 3.3 240.0 95.6 74.3 2.6
Spot 29 157 27498 1.9 21.3572 2.5 0.0749 3.4 0.0116 2.4 0.69 74.4 1.8 73.3 2.4 40.2 59.5 74.4 1.8
Spot 22 190 11821 1.3 21.0033 2.0 0.0762 2.8 0.0116 1.9 0.69 74.4 1.4 74.6 2.0 80.0 47.9 74.4 1.4
Spot 36 215 2926 1.1 22.8552 1.5 0.0701 2.4 0.0116 1.9 0.79 74.4 1.4 68.8 1.6 124.5 36.2 74.4 1.4
Spot 7 153 1664 2.1 25.6638 4.1 0.0625 4.5 0.0116 1.7 0.37 74.5 1.2 61.5 2.7 419.1 108.4 74.5 1.2
Spot 40 171 1959 1.0 24.6312 3.0 0.0652 3.8 0.0116 2.4 0.64 74.6 1.8 64.1 2.4 312.7 76.1 74.6 1.8
Spot 63 141 15466 1.2 21.0148 2.0 0.0764 3.5 0.0116 2.9 0.82 74.7 2.1 74.8 2.5 78.7 48.2 74.7 2.1
Spot 65 130 3520 1.3 20.9222 2.4 0.0768 3.2 0.0117 2.1 0.65 74.7 1.6 75.1 2.3 89.2 57.8 74.7 1.6
Spot 50 135 5413 1.5 21.4675 2.2 0.0749 3.1 0.0117 2.3 0.72 74.7 1.7 73.3 2.2 27.9 52.0 74.7 1.7
Spot 17 122 1991 1.7 25.6215 2.6 0.0627 3.8 0.0117 2.8 0.74 74.7 2.1 61.8 2.3 414.8 67.4 74.7 2.1
Spot 31 162 1864 1.3 24.8446 3.1 0.0648 3.8 0.0117 2.3 0.60 74.8 1.7 63.7 2.4 334.9 78.6 74.8 1.7
Spot 21 180 1958 1.0 25.0376 5.5 0.0643 6.0 0.0117 2.4 0.40 74.9 1.8 63.3 3.7 354.8 142.0 74.9 1.8
Spot 38 136 89909 1.6 20.5767 1.9 0.0784 3.2 0.0117 2.5 0.80 75.0 1.9 76.7 2.3 128.5 45.1 75.0 1.9
Spot 45 142 4334 1.3 22.3514 2.3 0.0723 3.2 0.0117 2.3 0.71 75.1 1.7 70.9 2.2 69.8 55.4 75.1 1.7
Spot 55 185 50475 2.5 20.5361 2.1 0.0787 2.8 0.0117 1.8 0.65 75.1 1.3 76.9 2.0 133.1 49.3 75.1 1.3
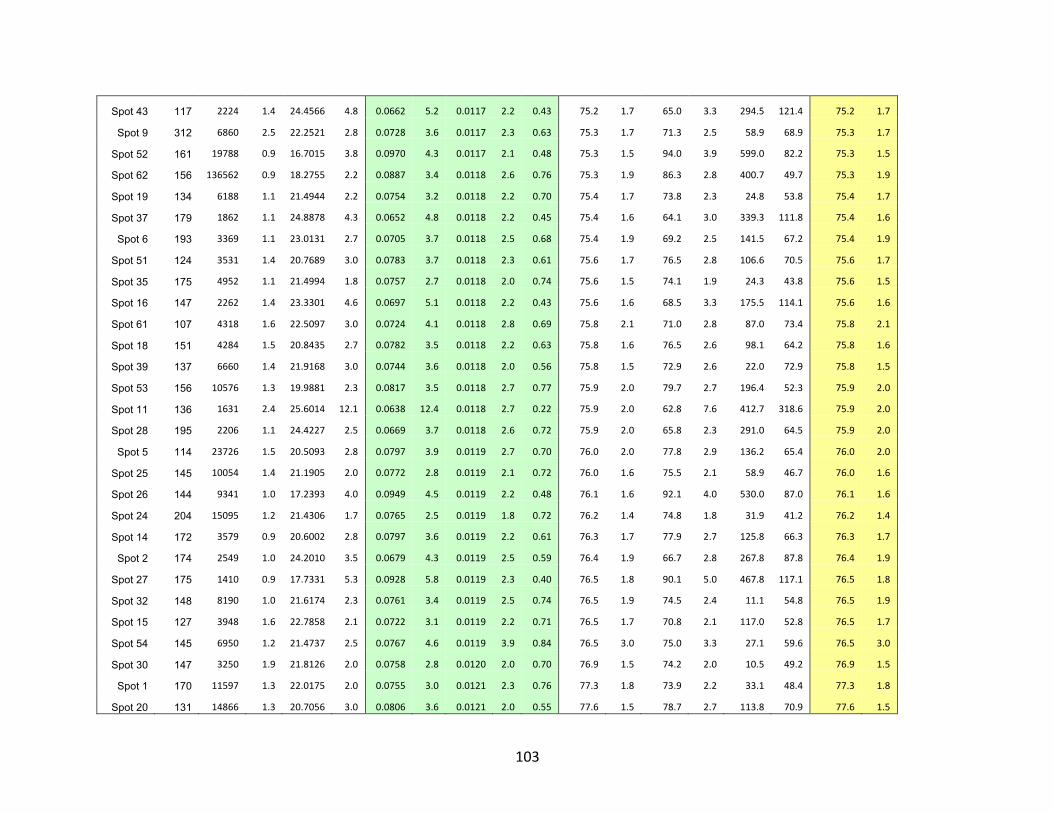
103
Spot 43 117 2224 1.4 24.4566 4.8 0.0662 5.2 0.0117 2.2 0.43 75.2 1.7 65.0 3.3 294.5 121.4 75.2 1.7
Spot 9 312 6860 2.5 22.2521 2.8 0.0728 3.6 0.0117 2.3 0.63 75.3 1.7 71.3 2.5 58.9 68.9 75.3 1.7
Spot 52 161 19788 0.9 16.7015 3.8 0.0970 4.3 0.0117 2.1 0.48 75.3 1.5 94.0 3.9 599.0 82.2 75.3 1.5
Spot 62 156 136562 0.9 18.2755 2.2 0.0887 3.4 0.0118 2.6 0.76 75.3 1.9 86.3 2.8 400.7 49.7 75.3 1.9
Spot 19 134 6188 1.1 21.4944 2.2 0.0754 3.2 0.0118 2.2 0.70 75.4 1.7 73.8 2.3 24.8 53.8 75.4 1.7
Spot 37 179 1862 1.1 24.8878 4.3 0.0652 4.8 0.0118 2.2 0.45 75.4 1.6 64.1 3.0 339.3 111.8 75.4 1.6
Spot 6 193 3369 1.1 23.0131 2.7 0.0705 3.7 0.0118 2.5 0.68 75.4 1.9 69.2 2.5 141.5 67.2 75.4 1.9
Spot 51 124 3531 1.4 20.7689 3.0 0.0783 3.7 0.0118 2.3 0.61 75.6 1.7 76.5 2.8 106.6 70.5 75.6 1.7
Spot 35 175 4952 1.1 21.4994 1.8 0.0757 2.7 0.0118 2.0 0.74 75.6 1.5 74.1 1.9 24.3 43.8 75.6 1.5
Spot 16 147 2262 1.4 23.3301 4.6 0.0697 5.1 0.0118 2.2 0.43 75.6 1.6 68.5 3.3 175.5 114.1 75.6 1.6
Spot 61 107 4318 1.6 22.5097 3.0 0.0724 4.1 0.0118 2.8 0.69 75.8 2.1 71.0 2.8 87.0 73.4 75.8 2.1
Spot 18 151 4284 1.5 20.8435 2.7 0.0782 3.5 0.0118 2.2 0.63 75.8 1.6 76.5 2.6 98.1 64.2 75.8 1.6
Spot 39 137 6660 1.4 21.9168 3.0 0.0744 3.6 0.0118 2.0 0.56 75.8 1.5 72.9 2.6 22.0 72.9 75.8 1.5
Spot 53 156 10576 1.3 19.9881 2.3 0.0817 3.5 0.0118 2.7 0.77 75.9 2.0 79.7 2.7 196.4 52.3 75.9 2.0
Spot 11 136 1631 2.4 25.6014 12.1 0.0638 12.4 0.0118 2.7 0.22 75.9 2.0 62.8 7.6 412.7 318.6 75.9 2.0
Spot 28 195 2206 1.1 24.4227 2.5 0.0669 3.7 0.0118 2.6 0.72 75.9 2.0 65.8 2.3 291.0 64.5 75.9 2.0
Spot 5 114 23726 1.5 20.5093 2.8 0.0797 3.9 0.0119 2.7 0.70 76.0 2.0 77.8 2.9 136.2 65.4 76.0 2.0
Spot 25 145 10054 1.4 21.1905 2.0 0.0772 2.8 0.0119 2.1 0.72 76.0 1.6 75.5 2.1 58.9 46.7 76.0 1.6
Spot 26 144 9341 1.0 17.2393 4.0 0.0949 4.5 0.0119 2.2 0.48 76.1 1.6 92.1 4.0 530.0 87.0 76.1 1.6
Spot 24 204 15095 1.2 21.4306 1.7 0.0765 2.5 0.0119 1.8 0.72 76.2 1.4 74.8 1.8 31.9 41.2 76.2 1.4
Spot 14 172 3579 0.9 20.6002 2.8 0.0797 3.6 0.0119 2.2 0.61 76.3 1.7 77.9 2.7 125.8 66.3 76.3 1.7
Spot 2 174 2549 1.0 24.2010 3.5 0.0679 4.3 0.0119 2.5 0.59 76.4 1.9 66.7 2.8 267.8 87.8 76.4 1.9
Spot 27 175 1410 0.9 17.7331 5.3 0.0928 5.8 0.0119 2.3 0.40 76.5 1.8 90.1 5.0 467.8 117.1 76.5 1.8
Spot 32 148 8190 1.0 21.6174 2.3 0.0761 3.4 0.0119 2.5 0.74 76.5 1.9 74.5 2.4 11.1 54.8 76.5 1.9
Spot 15 127 3948 1.6 22.7858 2.1 0.0722 3.1 0.0119 2.2 0.71 76.5 1.7 70.8 2.1 117.0 52.8 76.5 1.7
Spot 54 145 6950 1.2 21.4737 2.5 0.0767 4.6 0.0119 3.9 0.84 76.5 3.0 75.0 3.3 27.1 59.6 76.5 3.0
Spot 30 147 3250 1.9 21.8126 2.0 0.0758 2.8 0.0120 2.0 0.70 76.9 1.5 74.2 2.0 10.5 49.2 76.9 1.5
Spot 1 170 11597 1.3 22.0175 2.0 0.0755 3.0 0.0121 2.3 0.76 77.3 1.8 73.9 2.2 33.1 48.4 77.3 1.8
Spot 20 131 14866 1.3 20.7056 3.0 0.0806 3.6 0.0121 2.0 0.55 77.6 1.5 78.7 2.7 113.8 70.9 77.6 1.5
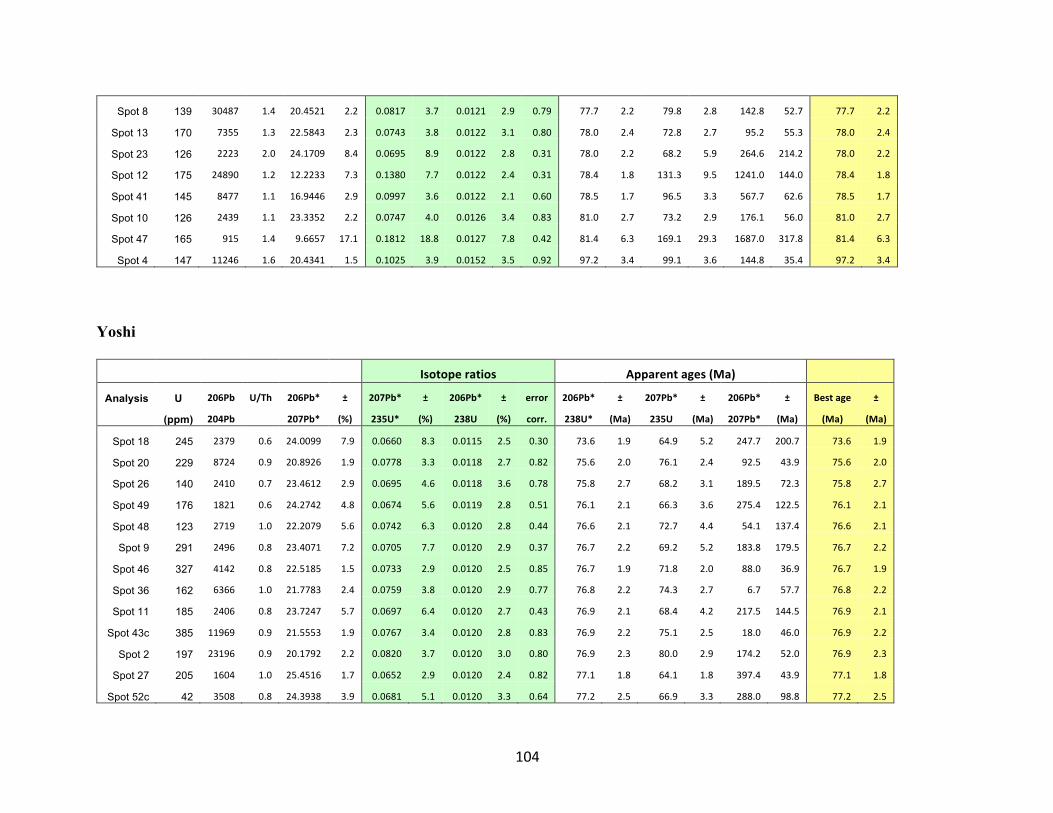
104
Spot 8 139 30487 1.4 20.4521 2.2 0.0817 3.7 0.0121 2.9 0.79 77.7 2.2 79.8 2.8 142.8 52.7 77.7 2.2
Spot 13 170 7355 1.3 22.5843 2.3 0.0743 3.8 0.0122 3.1 0.80 78.0 2.4 72.8 2.7 95.2 55.3 78.0 2.4
Spot 23 126 2223 2.0 24.1709 8.4 0.0695 8.9 0.0122 2.8 0.31 78.0 2.2 68.2 5.9 264.6 214.2 78.0 2.2
Spot 12 175 24890 1.2 12.2233 7.3 0.1380 7.7 0.0122 2.4 0.31 78.4 1.8 131.3 9.5 1241.0 144.0 78.4 1.8
Spot 41 145 8477 1.1 16.9446 2.9 0.0997 3.6 0.0122 2.1 0.60 78.5 1.7 96.5 3.3 567.7 62.6 78.5 1.7
Spot 10 126 2439 1.1 23.3352 2.2 0.0747 4.0 0.0126 3.4 0.83 81.0 2.7 73.2 2.9 176.1 56.0 81.0 2.7
Spot 47 165 915 1.4 9.6657 17.1 0.1812 18.8 0.0127 7.8 0.42 81.4 6.3 169.1 29.3 1687.0 317.8 81.4 6.3
Spot 4 147 11246 1.6 20.4341 1.5 0.1025 3.9 0.0152 3.5 0.92 97.2 3.4 99.1 3.6 144.8 35.4 97.2 3.4
Yoshi
Isotoperatios Apparentages(Ma)
Analysis U 206Pb U/Th 206Pb* ± 207Pb* ± 206Pb* ± error 206Pb* ± 207Pb* ± 206Pb* ± Bestage ±
(ppm) 204Pb 207Pb* (%) 235U* (%) 238U (%) corr. 238U* (Ma) 235U (Ma) 207Pb* (Ma) (Ma) (Ma)
Spot 18 245 2379 0.6 24.0099 7.9 0.0660 8.3 0.0115 2.5 0.30 73.6 1.9 64.9 5.2 247.7 200.7 73.6 1.9
Spot 20 229 8724 0.9 20.8926 1.9 0.0778 3.3 0.0118 2.7 0.82 75.6 2.0 76.1 2.4 92.5 43.9 75.6 2.0
Spot 26 140 2410 0.7 23.4612 2.9 0.0695 4.6 0.0118 3.6 0.78 75.8 2.7 68.2 3.1 189.5 72.3 75.8 2.7
Spot 49 176 1821 0.6 24.2742 4.8 0.0674 5.6 0.0119 2.8 0.51 76.1 2.1 66.3 3.6 275.4 122.5 76.1 2.1
Spot 48 123 2719 1.0 22.2079 5.6 0.0742 6.3 0.0120 2.8 0.44 76.6 2.1 72.7 4.4 54.1 137.4 76.6 2.1
Spot 9 291 2496 0.8 23.4071 7.2 0.0705 7.7 0.0120 2.9 0.37 76.7 2.2 69.2 5.2 183.8 179.5 76.7 2.2
Spot 46 327 4142 0.8 22.5185 1.5 0.0733 2.9 0.0120 2.5 0.85 76.7 1.9 71.8 2.0 88.0 36.9 76.7 1.9
Spot 36 162 6366 1.0 21.7783 2.4 0.0759 3.8 0.0120 2.9 0.77 76.8 2.2 74.3 2.7 6.7 57.7 76.8 2.2
Spot 11 185 2406 0.8 23.7247 5.7 0.0697 6.4 0.0120 2.7 0.43 76.9 2.1 68.4 4.2 217.5 144.5 76.9 2.1
Spot 43c 385 11969 0.9 21.5553 1.9 0.0767 3.4 0.0120 2.8 0.83 76.9 2.2 75.1 2.5 18.0 46.0 76.9 2.2
Spot 2 197 23196 0.9 20.1792 2.2 0.0820 3.7 0.0120 3.0 0.80 76.9 2.3 80.0 2.9 174.2 52.0 76.9 2.3
Spot 27 205 1604 1.0 25.4516 1.7 0.0652 2.9 0.0120 2.4 0.82 77.1 1.8 64.1 1.8 397.4 43.9 77.1 1.8
Spot 52c 42 3508 0.8 24.3938 3.9 0.0681 5.1 0.0120 3.3 0.64 77.2 2.5 66.9 3.3 288.0 98.8 77.2 2.5
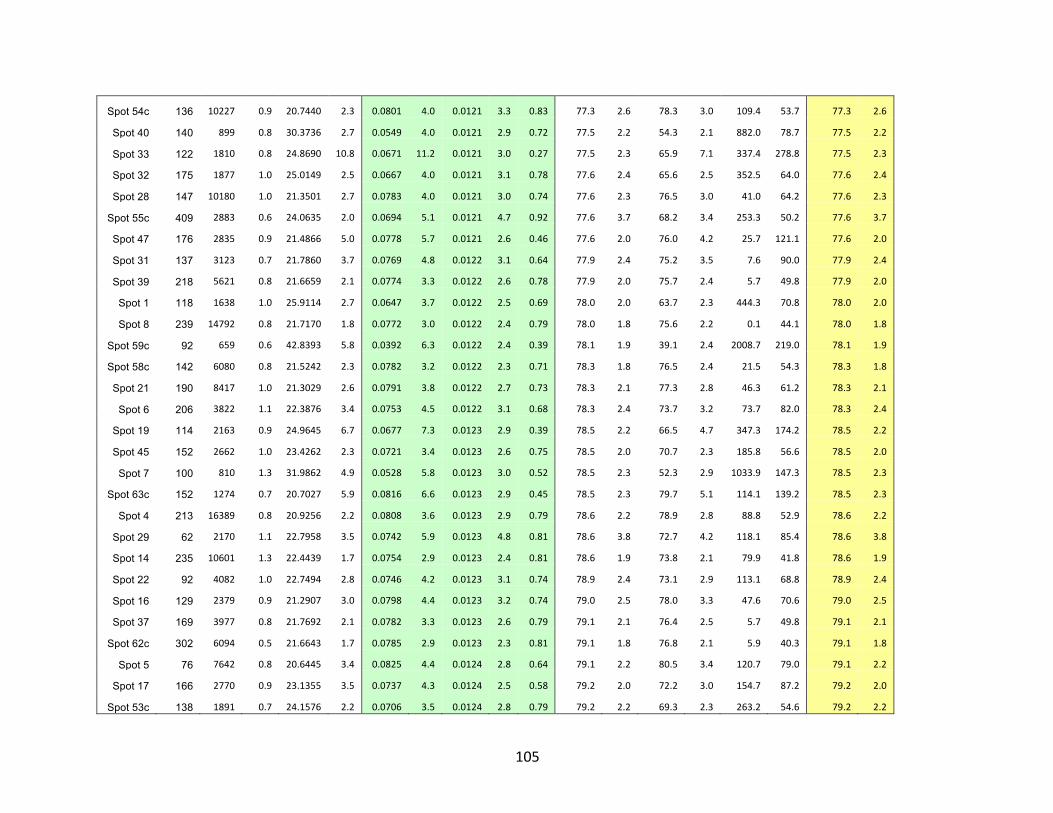
105
Spot 54c 136 10227 0.9 20.7440 2.3 0.0801 4.0 0.0121 3.3 0.83 77.3 2.6 78.3 3.0 109.4 53.7 77.3 2.6
Spot 40 140 899 0.8 30.3736 2.7 0.0549 4.0 0.0121 2.9 0.72 77.5 2.2 54.3 2.1 882.0 78.7 77.5 2.2
Spot 33 122 1810 0.8 24.8690 10.8 0.0671 11.2 0.0121 3.0 0.27 77.5 2.3 65.9 7.1 337.4 278.8 77.5 2.3
Spot 32 175 1877 1.0 25.0149 2.5 0.0667 4.0 0.0121 3.1 0.78 77.6 2.4 65.6 2.5 352.5 64.0 77.6 2.4
Spot 28 147 10180 1.0 21.3501 2.7 0.0783 4.0 0.0121 3.0 0.74 77.6 2.3 76.5 3.0 41.0 64.2 77.6 2.3
Spot 55c 409 2883 0.6 24.0635 2.0 0.0694 5.1 0.0121 4.7 0.92 77.6 3.7 68.2 3.4 253.3 50.2 77.6 3.7
Spot 47 176 2835 0.9 21.4866 5.0 0.0778 5.7 0.0121 2.6 0.46 77.6 2.0 76.0 4.2 25.7 121.1 77.6 2.0
Spot 31 137 3123 0.7 21.7860 3.7 0.0769 4.8 0.0122 3.1 0.64 77.9 2.4 75.2 3.5 7.6 90.0 77.9 2.4
Spot 39 218 5621 0.8 21.6659 2.1 0.0774 3.3 0.0122 2.6 0.78 77.9 2.0 75.7 2.4 5.7 49.8 77.9 2.0
Spot 1 118 1638 1.0 25.9114 2.7 0.0647 3.7 0.0122 2.5 0.69 78.0 2.0 63.7 2.3 444.3 70.8 78.0 2.0
Spot 8 239 14792 0.8 21.7170 1.8 0.0772 3.0 0.0122 2.4 0.79 78.0 1.8 75.6 2.2 0.1 44.1 78.0 1.8
Spot 59c 92 659 0.6 42.8393 5.8 0.0392 6.3 0.0122 2.4 0.39 78.1 1.9 39.1 2.4 2008.7 219.0 78.1 1.9
Spot 58c 142 6080 0.8 21.5242 2.3 0.0782 3.2 0.0122 2.3 0.71 78.3 1.8 76.5 2.4 21.5 54.3 78.3 1.8
Spot 21 190 8417 1.0 21.3029 2.6 0.0791 3.8 0.0122 2.7 0.73 78.3 2.1 77.3 2.8 46.3 61.2 78.3 2.1
Spot 6 206 3822 1.1 22.3876 3.4 0.0753 4.5 0.0122 3.1 0.68 78.3 2.4 73.7 3.2 73.7 82.0 78.3 2.4
Spot 19 114 2163 0.9 24.9645 6.7 0.0677 7.3 0.0123 2.9 0.39 78.5 2.2 66.5 4.7 347.3 174.2 78.5 2.2
Spot 45 152 2662 1.0 23.4262 2.3 0.0721 3.4 0.0123 2.6 0.75 78.5 2.0 70.7 2.3 185.8 56.6 78.5 2.0
Spot 7 100 810 1.3 31.9862 4.9 0.0528 5.8 0.0123 3.0 0.52 78.5 2.3 52.3 2.9 1033.9 147.3 78.5 2.3
Spot 63c 152 1274 0.7 20.7027 5.9 0.0816 6.6 0.0123 2.9 0.45 78.5 2.3 79.7 5.1 114.1 139.2 78.5 2.3
Spot 4 213 16389 0.8 20.9256 2.2 0.0808 3.6 0.0123 2.9 0.79 78.6 2.2 78.9 2.8 88.8 52.9 78.6 2.2
Spot 29 62 2170 1.1 22.7958 3.5 0.0742 5.9 0.0123 4.8 0.81 78.6 3.8 72.7 4.2 118.1 85.4 78.6 3.8
Spot 14 235 10601 1.3 22.4439 1.7 0.0754 2.9 0.0123 2.4 0.81 78.6 1.9 73.8 2.1 79.9 41.8 78.6 1.9
Spot 22 92 4082 1.0 22.7494 2.8 0.0746 4.2 0.0123 3.1 0.74 78.9 2.4 73.1 2.9 113.1 68.8 78.9 2.4
Spot 16 129 2379 0.9 21.2907 3.0 0.0798 4.4 0.0123 3.2 0.74 79.0 2.5 78.0 3.3 47.6 70.6 79.0 2.5
Spot 37 169 3977 0.8 21.7692 2.1 0.0782 3.3 0.0123 2.6 0.79 79.1 2.1 76.4 2.5 5.7 49.8 79.1 2.1
Spot 62c 302 6094 0.5 21.6643 1.7 0.0785 2.9 0.0123 2.3 0.81 79.1 1.8 76.8 2.1 5.9 40.3 79.1 1.8
Spot 5 76 7642 0.8 20.6445 3.4 0.0825 4.4 0.0124 2.8 0.64 79.1 2.2 80.5 3.4 120.7 79.0 79.1 2.2
Spot 17 166 2770 0.9 23.1355 3.5 0.0737 4.3 0.0124 2.5 0.58 79.2 2.0 72.2 3.0 154.7 87.2 79.2 2.0
Spot 53c 138 1891 0.7 24.1576 2.2 0.0706 3.5 0.0124 2.8 0.79 79.2 2.2 69.3 2.3 263.2 54.6 79.2 2.2
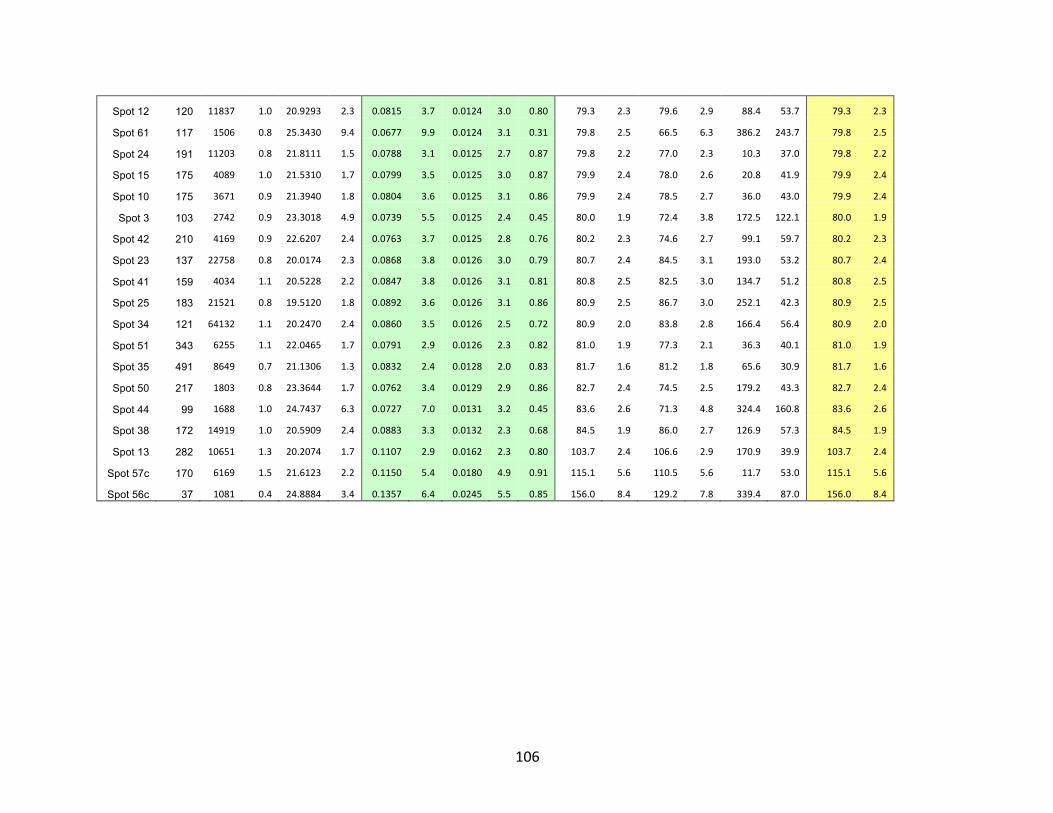
106
Spot 12 120 11837 1.0 20.9293 2.3 0.0815 3.7 0.0124 3.0 0.80 79.3 2.3 79.6 2.9 88.4 53.7 79.3 2.3
Spot 61 117 1506 0.8 25.3430 9.4 0.0677 9.9 0.0124 3.1 0.31 79.8 2.5 66.5 6.3 386.2 243.7 79.8 2.5
Spot 24 191 11203 0.8 21.8111 1.5 0.0788 3.1 0.0125 2.7 0.87 79.8 2.2 77.0 2.3 10.3 37.0 79.8 2.2
Spot 15 175 4089 1.0 21.5310 1.7 0.0799 3.5 0.0125 3.0 0.87 79.9 2.4 78.0 2.6 20.8 41.9 79.9 2.4
Spot 10 175 3671 0.9 21.3940 1.8 0.0804 3.6 0.0125 3.1 0.86 79.9 2.4 78.5 2.7 36.0 43.0 79.9 2.4
Spot 3 103 2742 0.9 23.3018 4.9 0.0739 5.5 0.0125 2.4 0.45 80.0 1.9 72.4 3.8 172.5 122.1 80.0 1.9
Spot 42 210 4169 0.9 22.6207 2.4 0.0763 3.7 0.0125 2.8 0.76 80.2 2.3 74.6 2.7 99.1 59.7 80.2 2.3
Spot 23 137 22758 0.8 20.0174 2.3 0.0868 3.8 0.0126 3.0 0.79 80.7 2.4 84.5 3.1 193.0 53.2 80.7 2.4
Spot 41 159 4034 1.1 20.5228 2.2 0.0847 3.8 0.0126 3.1 0.81 80.8 2.5 82.5 3.0 134.7 51.2 80.8 2.5
Spot 25 183 21521 0.8 19.5120 1.8 0.0892 3.6 0.0126 3.1 0.86 80.9 2.5 86.7 3.0 252.1 42.3 80.9 2.5
Spot 34 121 64132 1.1 20.2470 2.4 0.0860 3.5 0.0126 2.5 0.72 80.9 2.0 83.8 2.8 166.4 56.4 80.9 2.0
Spot 51 343 6255 1.1 22.0465 1.7 0.0791 2.9 0.0126 2.3 0.82 81.0 1.9 77.3 2.1 36.3 40.1 81.0 1.9
Spot 35 491 8649 0.7 21.1306 1.3 0.0832 2.4 0.0128 2.0 0.83 81.7 1.6 81.2 1.8 65.6 30.9 81.7 1.6
Spot 50 217 1803 0.8 23.3644 1.7 0.0762 3.4 0.0129 2.9 0.86 82.7 2.4 74.5 2.5 179.2 43.3 82.7 2.4
Spot 44 99 1688 1.0 24.7437 6.3 0.0727 7.0 0.0131 3.2 0.45 83.6 2.6 71.3 4.8 324.4 160.8 83.6 2.6
Spot 38 172 14919 1.0 20.5909 2.4 0.0883 3.3 0.0132 2.3 0.68 84.5 1.9 86.0 2.7 126.9 57.3 84.5 1.9
Spot 13 282 10651 1.3 20.2074 1.7 0.1107 2.9 0.0162 2.3 0.80 103.7 2.4 106.6 2.9 170.9 39.9 103.7 2.4
Spot 57c 170 6169 1.5 21.6123 2.2 0.1150 5.4 0.0180 4.9 0.91 115.1 5.6 110.5 5.6 11.7 53.0 115.1 5.6
Spot 56c 37 1081 0.4 24.8884 3.4 0.1357 6.4 0.0245 5.5 0.85 156.0 8.4 129.2 7.8 339.4 87.0 156.0 8.4
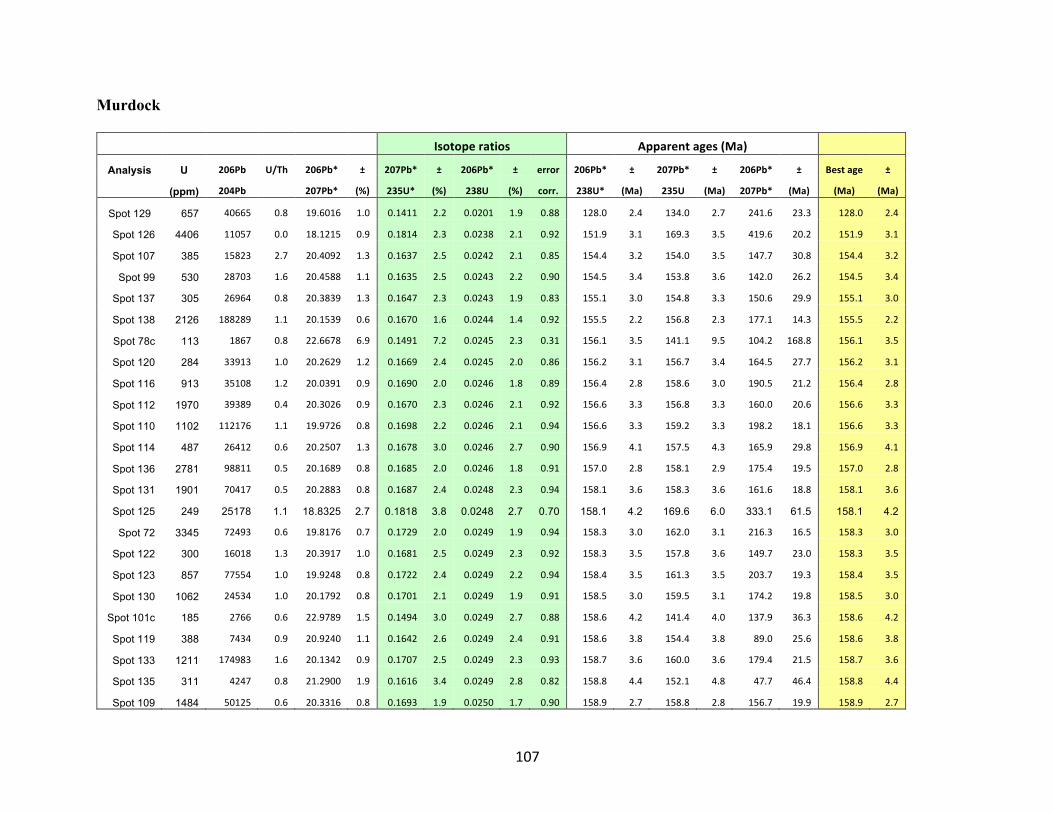
107
Murdock
Isotoperatios Apparentages(Ma)
Analysis U 206Pb U/Th 206Pb* ± 207Pb* ± 206Pb* ± error 206Pb* ± 207Pb* ± 206Pb* ± Bestage ±
(ppm) 204Pb 207Pb* (%) 235U* (%) 238U (%) corr. 238U* (Ma) 235U (Ma) 207Pb* (Ma) (Ma) (Ma)
Spot 129 657 40665 0.8 19.6016 1.0 0.1411 2.2 0.0201 1.9 0.88 128.0 2.4 134.0 2.7 241.6 23.3 128.0 2.4
Spot 126 4406 11057 0.0 18.1215 0.9 0.1814 2.3 0.0238 2.1 0.92 151.9 3.1 169.3 3.5 419.6 20.2 151.9 3.1
Spot 107 385 15823 2.7 20.4092 1.3 0.1637 2.5 0.0242 2.1 0.85 154.4 3.2 154.0 3.5 147.7 30.8 154.4 3.2
Spot 99 530 28703 1.6 20.4588 1.1 0.1635 2.5 0.0243 2.2 0.90 154.5 3.4 153.8 3.6 142.0 26.2 154.5 3.4
Spot 137 305 26964 0.8 20.3839 1.3 0.1647 2.3 0.0243 1.9 0.83 155.1 3.0 154.8 3.3 150.6 29.9 155.1 3.0
Spot 138 2126 188289 1.1 20.1539 0.6 0.1670 1.6 0.0244 1.4 0.92 155.5 2.2 156.8 2.3 177.1 14.3 155.5 2.2
Spot 78c 113 1867 0.8 22.6678 6.9 0.1491 7.2 0.0245 2.3 0.31 156.1 3.5 141.1 9.5 104.2 168.8 156.1 3.5
Spot 120 284 33913 1.0 20.2629 1.2 0.1669 2.4 0.0245 2.0 0.86 156.2 3.1 156.7 3.4 164.5 27.7 156.2 3.1
Spot 116 913 35108 1.2 20.0391 0.9 0.1690 2.0 0.0246 1.8 0.89 156.4 2.8 158.6 3.0 190.5 21.2 156.4 2.8
Spot 112 1970 39389 0.4 20.3026 0.9 0.1670 2.3 0.0246 2.1 0.92 156.6 3.3 156.8 3.3 160.0 20.6 156.6 3.3
Spot 110 1102 112176 1.1 19.9726 0.8 0.1698 2.2 0.0246 2.1 0.94 156.6 3.3 159.2 3.3 198.2 18.1 156.6 3.3
Spot 114 487 26412 0.6 20.2507 1.3 0.1678 3.0 0.0246 2.7 0.90 156.9 4.1 157.5 4.3 165.9 29.8 156.9 4.1
Spot 136 2781 98811 0.5 20.1689 0.8 0.1685 2.0 0.0246 1.8 0.91 157.0 2.8 158.1 2.9 175.4 19.5 157.0 2.8
Spot 131 1901 70417 0.5 20.2883 0.8 0.1687 2.4 0.0248 2.3 0.94 158.1 3.6 158.3 3.6 161.6 18.8 158.1 3.6
Spot 125 249 25178 1.1 18.8325 2.7 0.1818 3.8 0.0248 2.7 0.70 158.1 4.2 169.6 6.0 333.1 61.5 158.1 4.2
Spot 72 3345 72493 0.6 19.8176 0.7 0.1729 2.0 0.0249 1.9 0.94 158.3 3.0 162.0 3.1 216.3 16.5 158.3 3.0
Spot 122 300 16018 1.3 20.3917 1.0 0.1681 2.5 0.0249 2.3 0.92 158.3 3.5 157.8 3.6 149.7 23.0 158.3 3.5
Spot 123 857 77554 1.0 19.9248 0.8 0.1722 2.4 0.0249 2.2 0.94 158.4 3.5 161.3 3.5 203.7 19.3 158.4 3.5
Spot 130 1062 24534 1.0 20.1792 0.8 0.1701 2.1 0.0249 1.9 0.91 158.5 3.0 159.5 3.1 174.2 19.8 158.5 3.0
Spot 101c 185 2766 0.6 22.9789 1.5 0.1494 3.0 0.0249 2.7 0.88 158.6 4.2 141.4 4.0 137.9 36.3 158.6 4.2
Spot 119 388 7434 0.9 20.9240 1.1 0.1642 2.6 0.0249 2.4 0.91 158.6 3.8 154.4 3.8 89.0 25.6 158.6 3.8
Spot 133 1211 174983 1.6 20.1342 0.9 0.1707 2.5 0.0249 2.3 0.93 158.7 3.6 160.0 3.6 179.4 21.5 158.7 3.6
Spot 135 311 4247 0.8 21.2900 1.9 0.1616 3.4 0.0249 2.8 0.82 158.8 4.4 152.1 4.8 47.7 46.4 158.8 4.4
Spot 109 1484 50125 0.6 20.3316 0.8 0.1693 1.9 0.0250 1.7 0.90 158.9 2.7 158.8 2.8 156.7 19.9 158.9 2.7
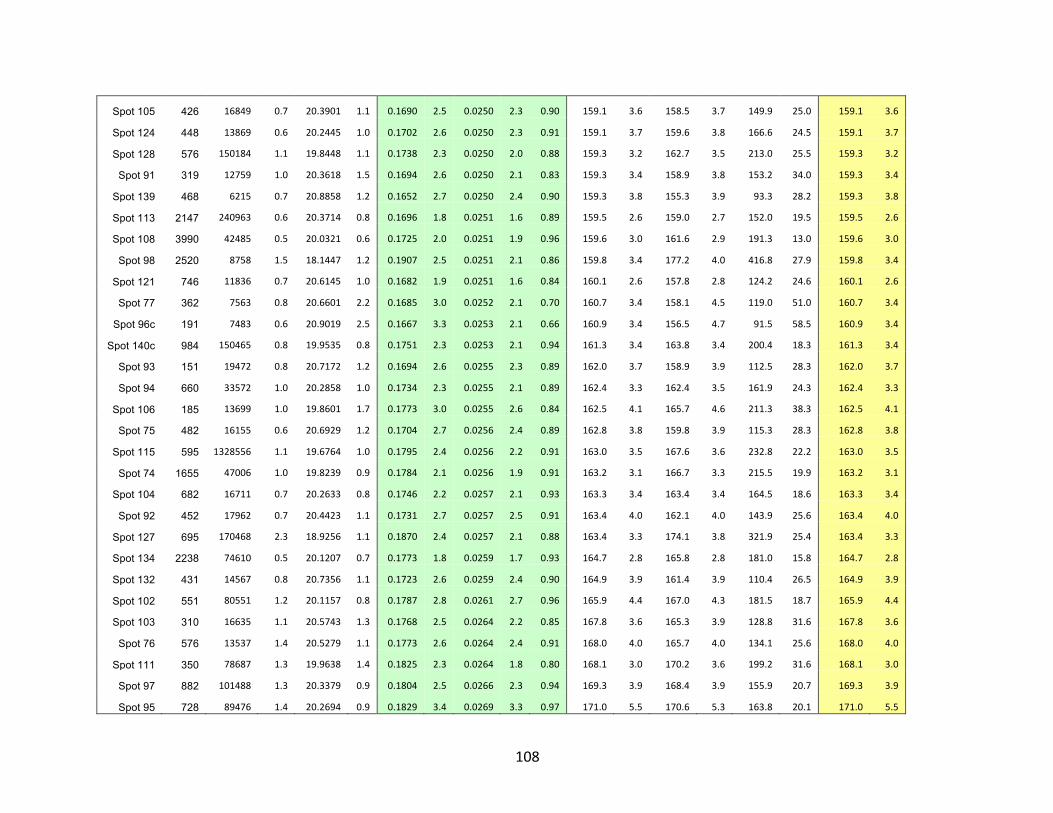
108
Spot 105 426 16849 0.7 20.3901 1.1 0.1690 2.5 0.0250 2.3 0.90 159.1 3.6 158.5 3.7 149.9 25.0 159.1 3.6
Spot 124 448 13869 0.6 20.2445 1.0 0.1702 2.6 0.0250 2.3 0.91 159.1 3.7 159.6 3.8 166.6 24.5 159.1 3.7
Spot 128 576 150184 1.1 19.8448 1.1 0.1738 2.3 0.0250 2.0 0.88 159.3 3.2 162.7 3.5 213.0 25.5 159.3 3.2
Spot 91 319 12759 1.0 20.3618 1.5 0.1694 2.6 0.0250 2.1 0.83 159.3 3.4 158.9 3.8 153.2 34.0 159.3 3.4
Spot 139 468 6215 0.7 20.8858 1.2 0.1652 2.7 0.0250 2.4 0.90 159.3 3.8 155.3 3.9 93.3 28.2 159.3 3.8
Spot 113 2147 240963 0.6 20.3714 0.8 0.1696 1.8 0.0251 1.6 0.89 159.5 2.6 159.0 2.7 152.0 19.5 159.5 2.6
Spot 108 3990 42485 0.5 20.0321 0.6 0.1725 2.0 0.0251 1.9 0.96 159.6 3.0 161.6 2.9 191.3 13.0 159.6 3.0
Spot 98 2520 8758 1.5 18.1447 1.2 0.1907 2.5 0.0251 2.1 0.86 159.8 3.4 177.2 4.0 416.8 27.9 159.8 3.4
Spot 121 746 11836 0.7 20.6145 1.0 0.1682 1.9 0.0251 1.6 0.84 160.1 2.6 157.8 2.8 124.2 24.6 160.1 2.6
Spot 77 362 7563 0.8 20.6601 2.2 0.1685 3.0 0.0252 2.1 0.70 160.7 3.4 158.1 4.5 119.0 51.0 160.7 3.4
Spot 96c 191 7483 0.6 20.9019 2.5 0.1667 3.3 0.0253 2.1 0.66 160.9 3.4 156.5 4.7 91.5 58.5 160.9 3.4
Spot 140c 984 150465 0.8 19.9535 0.8 0.1751 2.3 0.0253 2.1 0.94 161.3 3.4 163.8 3.4 200.4 18.3 161.3 3.4
Spot 93 151 19472 0.8 20.7172 1.2 0.1694 2.6 0.0255 2.3 0.89 162.0 3.7 158.9 3.9 112.5 28.3 162.0 3.7
Spot 94 660 33572 1.0 20.2858 1.0 0.1734 2.3 0.0255 2.1 0.89 162.4 3.3 162.4 3.5 161.9 24.3 162.4 3.3
Spot 106 185 13699 1.0 19.8601 1.7 0.1773 3.0 0.0255 2.6 0.84 162.5 4.1 165.7 4.6 211.3 38.3 162.5 4.1
Spot 75 482 16155 0.6 20.6929 1.2 0.1704 2.7 0.0256 2.4 0.89 162.8 3.8 159.8 3.9 115.3 28.3 162.8 3.8
Spot 115 595 1328556 1.1 19.6764 1.0 0.1795 2.4 0.0256 2.2 0.91 163.0 3.5 167.6 3.6 232.8 22.2 163.0 3.5
Spot 74 1655 47006 1.0 19.8239 0.9 0.1784 2.1 0.0256 1.9 0.91 163.2 3.1 166.7 3.3 215.5 19.9 163.2 3.1
Spot 104 682 16711 0.7 20.2633 0.8 0.1746 2.2 0.0257 2.1 0.93 163.3 3.4 163.4 3.4 164.5 18.6 163.3 3.4
Spot 92 452 17962 0.7 20.4423 1.1 0.1731 2.7 0.0257 2.5 0.91 163.4 4.0 162.1 4.0 143.9 25.6 163.4 4.0
Spot 127 695 170468 2.3 18.9256 1.1 0.1870 2.4 0.0257 2.1 0.88 163.4 3.3 174.1 3.8 321.9 25.4 163.4 3.3
Spot 134 2238 74610 0.5 20.1207 0.7 0.1773 1.8 0.0259 1.7 0.93 164.7 2.8 165.8 2.8 181.0 15.8 164.7 2.8
Spot 132 431 14567 0.8 20.7356 1.1 0.1723 2.6 0.0259 2.4 0.90 164.9 3.9 161.4 3.9 110.4 26.5 164.9 3.9
Spot 102 551 80551 1.2 20.1157 0.8 0.1787 2.8 0.0261 2.7 0.96 165.9 4.4 167.0 4.3 181.5 18.7 165.9 4.4
Spot 103 310 16635 1.1 20.5743 1.3 0.1768 2.5 0.0264 2.2 0.85 167.8 3.6 165.3 3.9 128.8 31.6 167.8 3.6
Spot 76 576 13537 1.4 20.5279 1.1 0.1773 2.6 0.0264 2.4 0.91 168.0 4.0 165.7 4.0 134.1 25.6 168.0 4.0
Spot 111 350 78687 1.3 19.9638 1.4 0.1825 2.3 0.0264 1.8 0.80 168.1 3.0 170.2 3.6 199.2 31.6 168.1 3.0
Spot 97 882 101488 1.3 20.3379 0.9 0.1804 2.5 0.0266 2.3 0.94 169.3 3.9 168.4 3.9 155.9 20.7 169.3 3.9
Spot 95 728 89476 1.4 20.2694 0.9 0.1829 3.4 0.0269 3.3 0.97 171.0 5.5 170.6 5.3 163.8 20.1 171.0 5.5
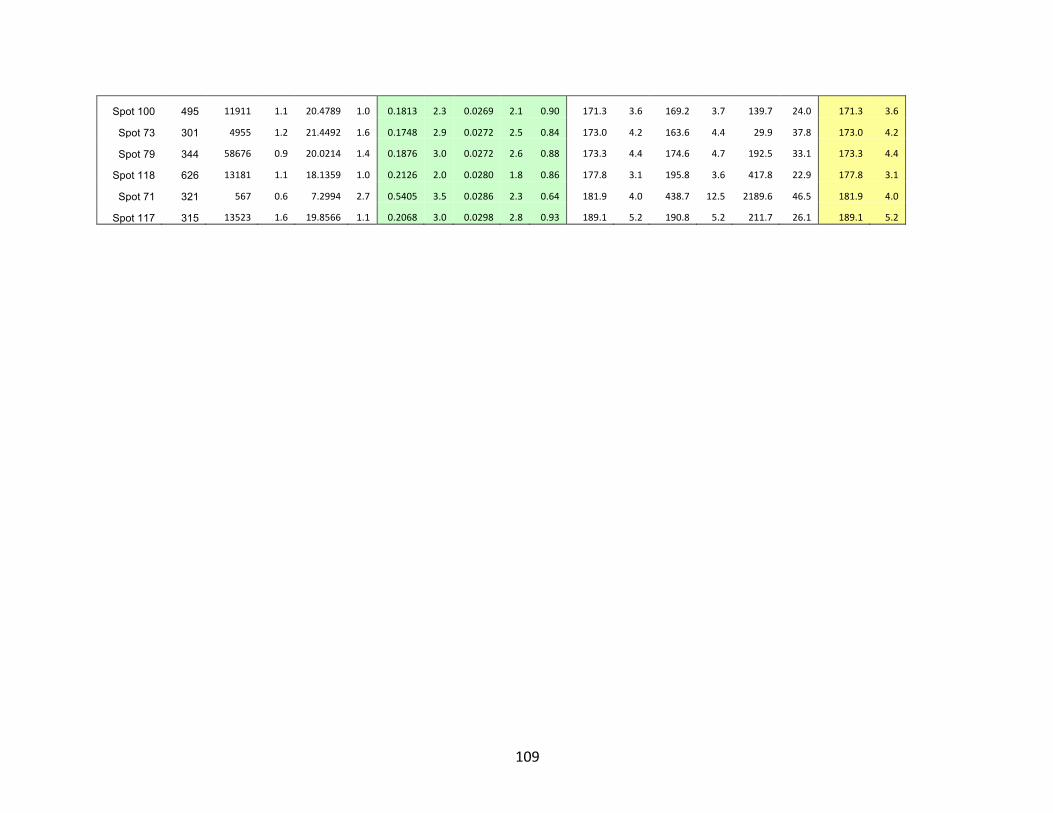
109
Spot 100 495 11911 1.1 20.4789 1.0 0.1813 2.3 0.0269 2.1 0.90 171.3 3.6 169.2 3.7 139.7 24.0 171.3 3.6
Spot 73 301 4955 1.2 21.4492 1.6 0.1748 2.9 0.0272 2.5 0.84 173.0 4.2 163.6 4.4 29.9 37.8 173.0 4.2
Spot 79 344 58676 0.9 20.0214 1.4 0.1876 3.0 0.0272 2.6 0.88 173.3 4.4 174.6 4.7 192.5 33.1 173.3 4.4
Spot 118 626 13181 1.1 18.1359 1.0 0.2126 2.0 0.0280 1.8 0.86 177.8 3.1 195.8 3.6 417.8 22.9 177.8 3.1
Spot 71 321 567 0.6 7.2994 2.7 0.5405 3.5 0.0286 2.3 0.64 181.9 4.0 438.7 12.5 2189.6 46.5 181.9 4.0
Spot 117 315 13523 1.6 19.8566 1.1 0.2068 3.0 0.0298 2.8 0.93 189.1 5.2 190.8 5.2 211.7 26.1 189.1 5.2
110
APPENDIX B
40Ar/39Ar Isotopic Analyses Result Tables
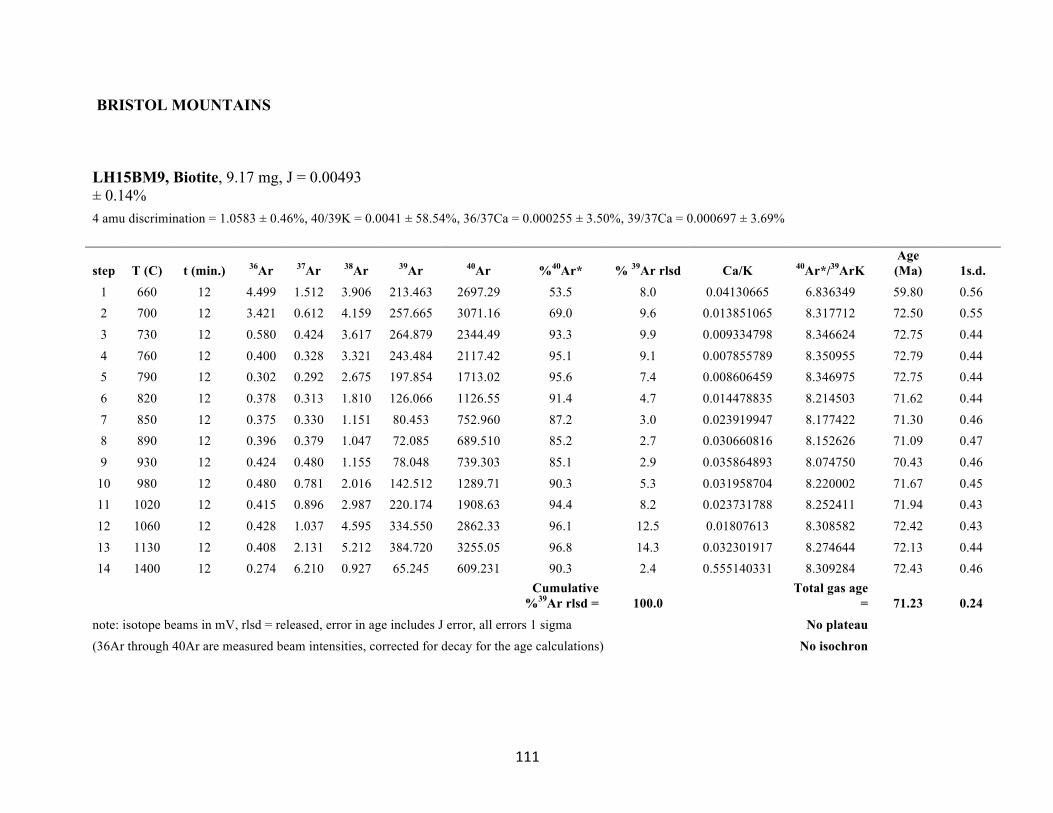
111
BRISTOL MOUNTAINS
LH15BM9, Biotite, 9.17 mg, J = 0.00493 ± 0.14% 4 amu discrimination = 1.0583 ± 0.46%, 40/39K = 0.0041 ± 58.54%, 36/37Ca = 0.000255 ± 3.50%, 39/37Ca = 0.000697 ± 3.69%
step T (C) t (min.) 36Ar 37Ar 38Ar 39Ar 40Ar %40Ar* % 39Ar rlsd Ca/K 40Ar*/39ArK Age (Ma) 1s.d.
1 660 12 4.499 1.512 3.906 213.463 2697.29 53.5 8.0 0.04130665 6.836349 59.80 0.56 2 700 12 3.421 0.612 4.159 257.665 3071.16 69.0 9.6 0.013851065 8.317712 72.50 0.55 3 730 12 0.580 0.424 3.617 264.879 2344.49 93.3 9.9 0.009334798 8.346624 72.75 0.44 4 760 12 0.400 0.328 3.321 243.484 2117.42 95.1 9.1 0.007855789 8.350955 72.79 0.44 5 790 12 0.302 0.292 2.675 197.854 1713.02 95.6 7.4 0.008606459 8.346975 72.75 0.44 6 820 12 0.378 0.313 1.810 126.066 1126.55 91.4 4.7 0.014478835 8.214503 71.62 0.44 7 850 12 0.375 0.330 1.151 80.453 752.960 87.2 3.0 0.023919947 8.177422 71.30 0.46 8 890 12 0.396 0.379 1.047 72.085 689.510 85.2 2.7 0.030660816 8.152626 71.09 0.47 9 930 12 0.424 0.480 1.155 78.048 739.303 85.1 2.9 0.035864893 8.074750 70.43 0.46
10 980 12 0.480 0.781 2.016 142.512 1289.71 90.3 5.3 0.031958704 8.220002 71.67 0.45 11 1020 12 0.415 0.896 2.987 220.174 1908.63 94.4 8.2 0.023731788 8.252411 71.94 0.43 12 1060 12 0.428 1.037 4.595 334.550 2862.33 96.1 12.5 0.01807613 8.308582 72.42 0.43 13 1130 12 0.408 2.131 5.212 384.720 3255.05 96.8 14.3 0.032301917 8.274644 72.13 0.44 14 1400 12 0.274 6.210 0.927 65.245 609.231 90.3 2.4 0.555140331 8.309284 72.43 0.46
Cumulative
%39Ar rlsd = 100.0 Total gas age
= 71.23 0.24 note: isotope beams in mV, rlsd = released, error in age includes J error, all errors 1 sigma No plateau (36Ar through 40Ar are measured beam intensities, corrected for decay for the age calculations) No isochron
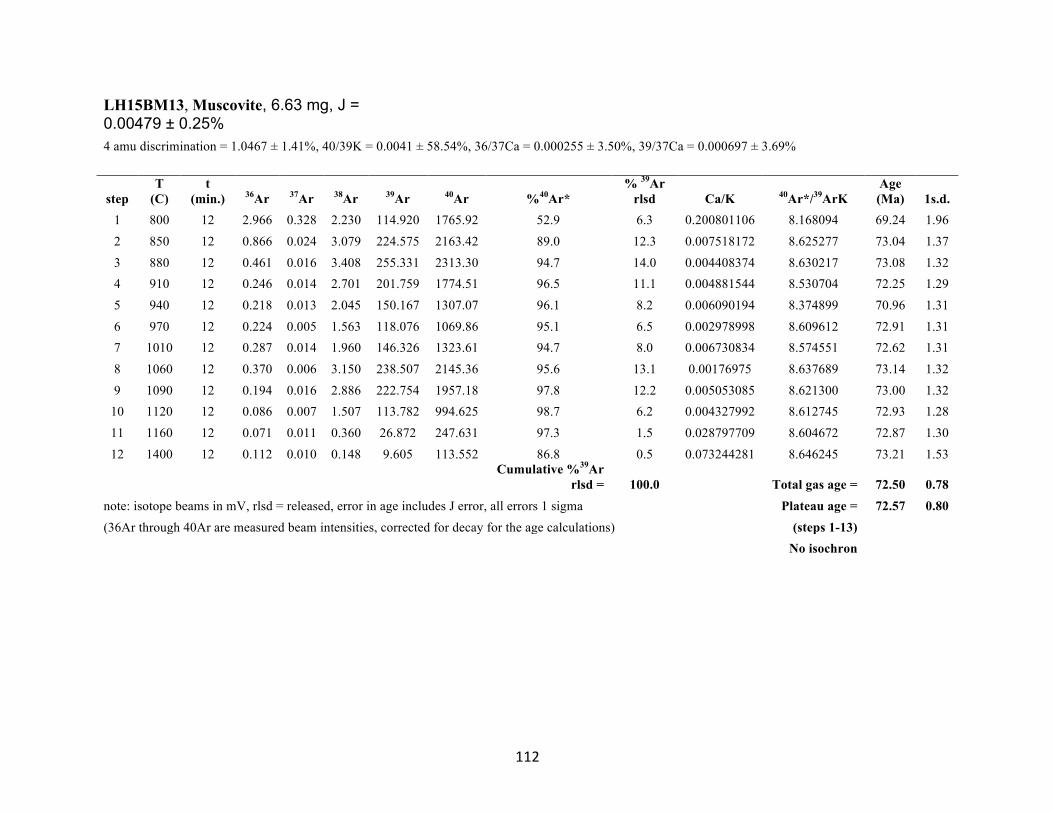
112
LH15BM13, Muscovite, 6.63 mg, J = 0.00479 ± 0.25% 4 amu discrimination = 1.0467 ± 1.41%, 40/39K = 0.0041 ± 58.54%, 36/37Ca = 0.000255 ± 3.50%, 39/37Ca = 0.000697 ± 3.69%
step T
(C) t
(min.) 36Ar 37Ar 38Ar 39Ar 40Ar %40Ar* % 39Ar
rlsd Ca/K 40Ar*/39ArK Age (Ma)
1s.d.
1 800 12 2.966 0.328 2.230 114.920 1765.92 52.9 6.3 0.200801106 8.168094 69.24 1.96 2 850 12 0.866 0.024 3.079 224.575 2163.42 89.0 12.3 0.007518172 8.625277 73.04 1.37 3 880 12 0.461 0.016 3.408 255.331 2313.30 94.7 14.0 0.004408374 8.630217 73.08 1.32 4 910 12 0.246 0.014 2.701 201.759 1774.51 96.5 11.1 0.004881544 8.530704 72.25 1.29 5 940 12 0.218 0.013 2.045 150.167 1307.07 96.1 8.2 0.006090194 8.374899 70.96 1.31 6 970 12 0.224 0.005 1.563 118.076 1069.86 95.1 6.5 0.002978998 8.609612 72.91 1.31 7 1010 12 0.287 0.014 1.960 146.326 1323.61 94.7 8.0 0.006730834 8.574551 72.62 1.31 8 1060 12 0.370 0.006 3.150 238.507 2145.36 95.6 13.1 0.00176975 8.637689 73.14 1.32 9 1090 12 0.194 0.016 2.886 222.754 1957.18 97.8 12.2 0.005053085 8.621300 73.00 1.32
10 1120 12 0.086 0.007 1.507 113.782 994.625 98.7 6.2 0.004327992 8.612745 72.93 1.28 11 1160 12 0.071 0.011 0.360 26.872 247.631 97.3 1.5 0.028797709 8.604672 72.87 1.30 12 1400 12 0.112 0.010 0.148 9.605 113.552 86.8 0.5 0.073244281 8.646245 73.21 1.53
Cumulative %39Ar
rlsd = 100.0 Total gas age = 72.50 0.78 note: isotope beams in mV, rlsd = released, error in age includes J error, all errors 1 sigma Plateau age = 72.57 0.80 (36Ar through 40Ar are measured beam intensities, corrected for decay for the age calculations) (steps 1-13) No isochron
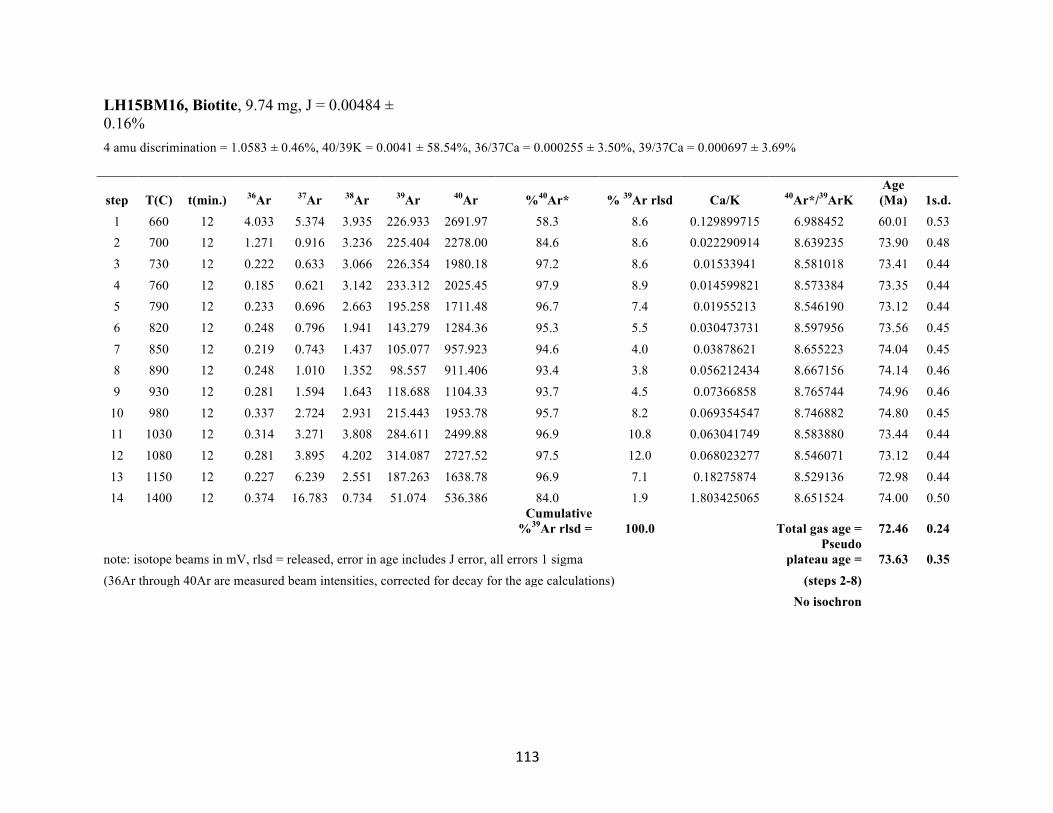
113
LH15BM16, Biotite, 9.74 mg, J = 0.00484 ± 0.16%
4 amu discrimination = 1.0583 ± 0.46%, 40/39K = 0.0041 ± 58.54%, 36/37Ca = 0.000255 ± 3.50%, 39/37Ca = 0.000697 ± 3.69%
step T(C) t(min.) 36Ar 37Ar 38Ar 39Ar 40Ar %40Ar* % 39Ar rlsd Ca/K 40Ar*/39ArK Age (Ma)
1s.d.
1 660 12 4.033 5.374 3.935 226.933 2691.97 58.3 8.6 0.129899715 6.988452 60.01 0.53 2 700 12 1.271 0.916 3.236 225.404 2278.00 84.6 8.6 0.022290914 8.639235 73.90 0.48 3 730 12 0.222 0.633 3.066 226.354 1980.18 97.2 8.6 0.01533941 8.581018 73.41 0.44 4 760 12 0.185 0.621 3.142 233.312 2025.45 97.9 8.9 0.014599821 8.573384 73.35 0.44 5 790 12 0.233 0.696 2.663 195.258 1711.48 96.7 7.4 0.01955213 8.546190 73.12 0.44 6 820 12 0.248 0.796 1.941 143.279 1284.36 95.3 5.5 0.030473731 8.597956 73.56 0.45 7 850 12 0.219 0.743 1.437 105.077 957.923 94.6 4.0 0.03878621 8.655223 74.04 0.45 8 890 12 0.248 1.010 1.352 98.557 911.406 93.4 3.8 0.056212434 8.667156 74.14 0.46 9 930 12 0.281 1.594 1.643 118.688 1104.33 93.7 4.5 0.07366858 8.765744 74.96 0.46
10 980 12 0.337 2.724 2.931 215.443 1953.78 95.7 8.2 0.069354547 8.746882 74.80 0.45 11 1030 12 0.314 3.271 3.808 284.611 2499.88 96.9 10.8 0.063041749 8.583880 73.44 0.44 12 1080 12 0.281 3.895 4.202 314.087 2727.52 97.5 12.0 0.068023277 8.546071 73.12 0.44 13 1150 12 0.227 6.239 2.551 187.263 1638.78 96.9 7.1 0.18275874 8.529136 72.98 0.44 14 1400 12 0.374 16.783 0.734 51.074 536.386 84.0 1.9 1.803425065 8.651524 74.00 0.50
Cumulative
%39Ar rlsd = 100.0 Total gas age = 72.46 0.24
note: isotope beams in mV, rlsd = released, error in age includes J error, all errors 1 sigma Pseudo
plateau age = 73.63 0.35 (36Ar through 40Ar are measured beam intensities, corrected for decay for the age calculations) (steps 2-8) No isochron
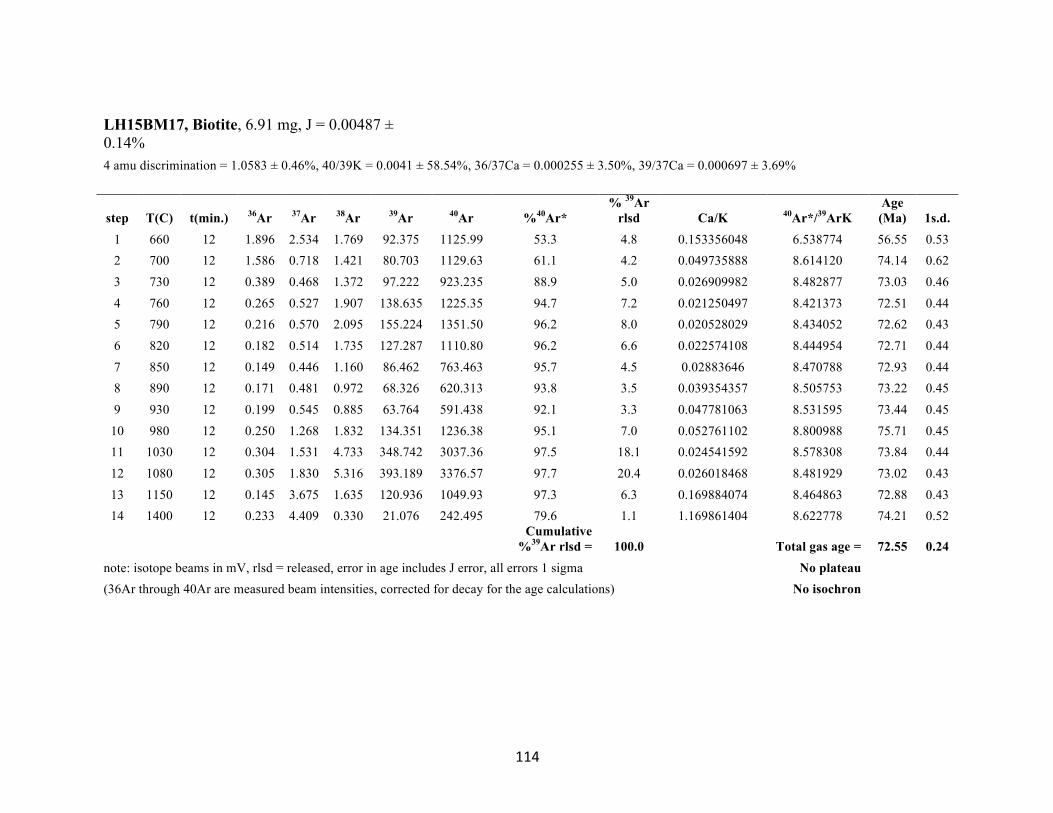
114
LH15BM17, Biotite, 6.91 mg, J = 0.00487 ± 0.14% 4 amu discrimination = 1.0583 ± 0.46%, 40/39K = 0.0041 ± 58.54%, 36/37Ca = 0.000255 ± 3.50%, 39/37Ca = 0.000697 ± 3.69%
step T(C) t(min.) 36Ar 37Ar 38Ar 39Ar 40Ar %40Ar* % 39Ar
rlsd Ca/K 40Ar*/39ArK Age (Ma)
1s.d.
1 660 12 1.896 2.534 1.769 92.375 1125.99 53.3 4.8 0.153356048 6.538774 56.55 0.53 2 700 12 1.586 0.718 1.421 80.703 1129.63 61.1 4.2 0.049735888 8.614120 74.14 0.62 3 730 12 0.389 0.468 1.372 97.222 923.235 88.9 5.0 0.026909982 8.482877 73.03 0.46 4 760 12 0.265 0.527 1.907 138.635 1225.35 94.7 7.2 0.021250497 8.421373 72.51 0.44 5 790 12 0.216 0.570 2.095 155.224 1351.50 96.2 8.0 0.020528029 8.434052 72.62 0.43 6 820 12 0.182 0.514 1.735 127.287 1110.80 96.2 6.6 0.022574108 8.444954 72.71 0.44 7 850 12 0.149 0.446 1.160 86.462 763.463 95.7 4.5 0.02883646 8.470788 72.93 0.44 8 890 12 0.171 0.481 0.972 68.326 620.313 93.8 3.5 0.039354357 8.505753 73.22 0.45 9 930 12 0.199 0.545 0.885 63.764 591.438 92.1 3.3 0.047781063 8.531595 73.44 0.45
10 980 12 0.250 1.268 1.832 134.351 1236.38 95.1 7.0 0.052761102 8.800988 75.71 0.45 11 1030 12 0.304 1.531 4.733 348.742 3037.36 97.5 18.1 0.024541592 8.578308 73.84 0.44 12 1080 12 0.305 1.830 5.316 393.189 3376.57 97.7 20.4 0.026018468 8.481929 73.02 0.43 13 1150 12 0.145 3.675 1.635 120.936 1049.93 97.3 6.3 0.169884074 8.464863 72.88 0.43 14 1400 12 0.233 4.409 0.330 21.076 242.495 79.6 1.1 1.169861404 8.622778 74.21 0.52
Cumulative
%39Ar rlsd = 100.0 Total gas age = 72.55 0.24 note: isotope beams in mV, rlsd = released, error in age includes J error, all errors 1 sigma No plateau (36Ar through 40Ar are measured beam intensities, corrected for decay for the age calculations) No isochron
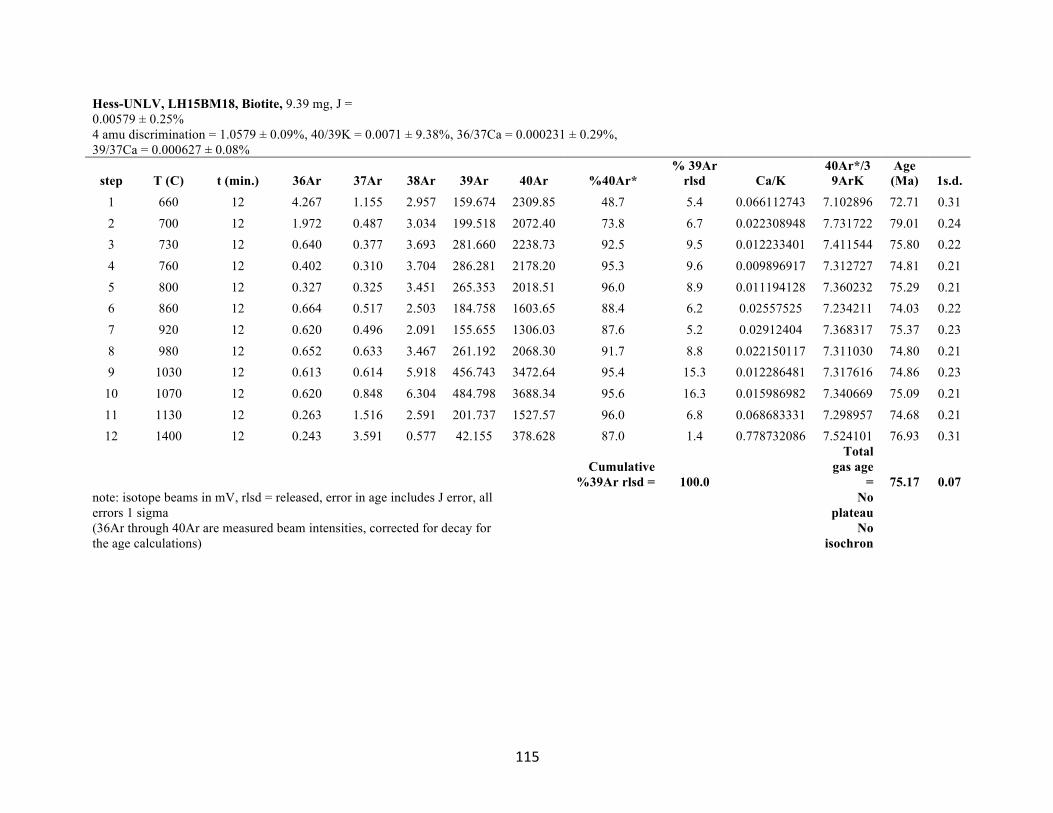
115
Hess-UNLV, LH15BM18, Biotite, 9.39 mg, J = 0.00579 ± 0.25% 4 amu discrimination = 1.0579 ± 0.09%, 40/39K = 0.0071 ± 9.38%, 36/37Ca = 0.000231 ± 0.29%, 39/37Ca = 0.000627 ± 0.08%
step T (C) t (min.) 36Ar 37Ar 38Ar 39Ar 40Ar %40Ar* % 39Ar
rlsd Ca/K 40Ar*/3
9ArK Age (Ma)
1s.d.
1 660 12 4.267 1.155 2.957 159.674 2309.85 48.7 5.4 0.066112743 7.102896 72.71 0.31 2 700 12 1.972 0.487 3.034 199.518 2072.40 73.8 6.7 0.022308948 7.731722 79.01 0.24 3 730 12 0.640 0.377 3.693 281.660 2238.73 92.5 9.5 0.012233401 7.411544 75.80 0.22 4 760 12 0.402 0.310 3.704 286.281 2178.20 95.3 9.6 0.009896917 7.312727 74.81 0.21 5 800 12 0.327 0.325 3.451 265.353 2018.51 96.0 8.9 0.011194128 7.360232 75.29 0.21 6 860 12 0.664 0.517 2.503 184.758 1603.65 88.4 6.2 0.02557525 7.234211 74.03 0.22 7 920 12 0.620 0.496 2.091 155.655 1306.03 87.6 5.2 0.02912404 7.368317 75.37 0.23 8 980 12 0.652 0.633 3.467 261.192 2068.30 91.7 8.8 0.022150117 7.311030 74.80 0.21 9 1030 12 0.613 0.614 5.918 456.743 3472.64 95.4 15.3 0.012286481 7.317616 74.86 0.23
10 1070 12 0.620 0.848 6.304 484.798 3688.34 95.6 16.3 0.015986982 7.340669 75.09 0.21 11 1130 12 0.263 1.516 2.591 201.737 1527.57 96.0 6.8 0.068683331 7.298957 74.68 0.21 12 1400 12 0.243 3.591 0.577 42.155 378.628 87.0 1.4 0.778732086 7.524101 76.93 0.31
Cumulative
%39Ar rlsd = 100.0
Total gas age
= 75.17 0.07 note: isotope beams in mV, rlsd = released, error in age includes J error, all errors 1 sigma
No plateau
(36Ar through 40Ar are measured beam intensities, corrected for decay for the age calculations)
No isochron
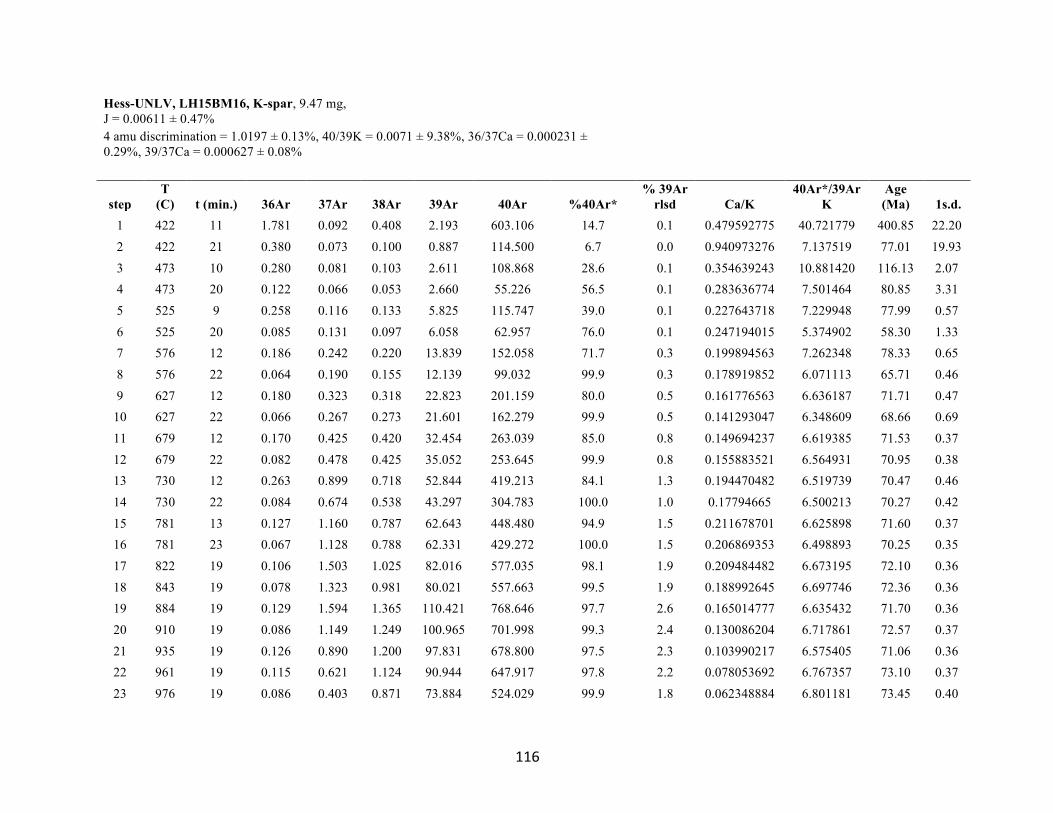
116
Hess-UNLV, LH15BM16, K-spar, 9.47 mg, J = 0.00611 ± 0.47% 4 amu discrimination = 1.0197 ± 0.13%, 40/39K = 0.0071 ± 9.38%, 36/37Ca = 0.000231 ± 0.29%, 39/37Ca = 0.000627 ± 0.08%
step T
(C) t (min.) 36Ar 37Ar 38Ar 39Ar 40Ar %40Ar* % 39Ar
rlsd Ca/K 40Ar*/39Ar
K Age (Ma) 1s.d.
1 422 11 1.781 0.092 0.408 2.193 603.106 14.7 0.1 0.479592775 40.721779 400.85 22.20 2 422 21 0.380 0.073 0.100 0.887 114.500 6.7 0.0 0.940973276 7.137519 77.01 19.93 3 473 10 0.280 0.081 0.103 2.611 108.868 28.6 0.1 0.354639243 10.881420 116.13 2.07 4 473 20 0.122 0.066 0.053 2.660 55.226 56.5 0.1 0.283636774 7.501464 80.85 3.31 5 525 9 0.258 0.116 0.133 5.825 115.747 39.0 0.1 0.227643718 7.229948 77.99 0.57 6 525 20 0.085 0.131 0.097 6.058 62.957 76.0 0.1 0.247194015 5.374902 58.30 1.33 7 576 12 0.186 0.242 0.220 13.839 152.058 71.7 0.3 0.199894563 7.262348 78.33 0.65 8 576 22 0.064 0.190 0.155 12.139 99.032 99.9 0.3 0.178919852 6.071113 65.71 0.46 9 627 12 0.180 0.323 0.318 22.823 201.159 80.0 0.5 0.161776563 6.636187 71.71 0.47
10 627 22 0.066 0.267 0.273 21.601 162.279 99.9 0.5 0.141293047 6.348609 68.66 0.69 11 679 12 0.170 0.425 0.420 32.454 263.039 85.0 0.8 0.149694237 6.619385 71.53 0.37 12 679 22 0.082 0.478 0.425 35.052 253.645 99.9 0.8 0.155883521 6.564931 70.95 0.38 13 730 12 0.263 0.899 0.718 52.844 419.213 84.1 1.3 0.194470482 6.519739 70.47 0.46 14 730 22 0.084 0.674 0.538 43.297 304.783 100.0 1.0 0.17794665 6.500213 70.27 0.42 15 781 13 0.127 1.160 0.787 62.643 448.480 94.9 1.5 0.211678701 6.625898 71.60 0.37 16 781 23 0.067 1.128 0.788 62.331 429.272 100.0 1.5 0.206869353 6.498893 70.25 0.35 17 822 19 0.106 1.503 1.025 82.016 577.035 98.1 1.9 0.209484482 6.673195 72.10 0.36 18 843 19 0.078 1.323 0.981 80.021 557.663 99.5 1.9 0.188992645 6.697746 72.36 0.36 19 884 19 0.129 1.594 1.365 110.421 768.646 97.7 2.6 0.165014777 6.635432 71.70 0.36 20 910 19 0.086 1.149 1.249 100.965 701.998 99.3 2.4 0.130086204 6.717861 72.57 0.37 21 935 19 0.126 0.890 1.200 97.831 678.800 97.5 2.3 0.103990217 6.575405 71.06 0.36 22 961 19 0.115 0.621 1.124 90.944 647.917 97.8 2.2 0.078053692 6.767357 73.10 0.37 23 976 19 0.086 0.403 0.871 73.884 524.029 99.9 1.8 0.062348884 6.801181 73.45 0.40
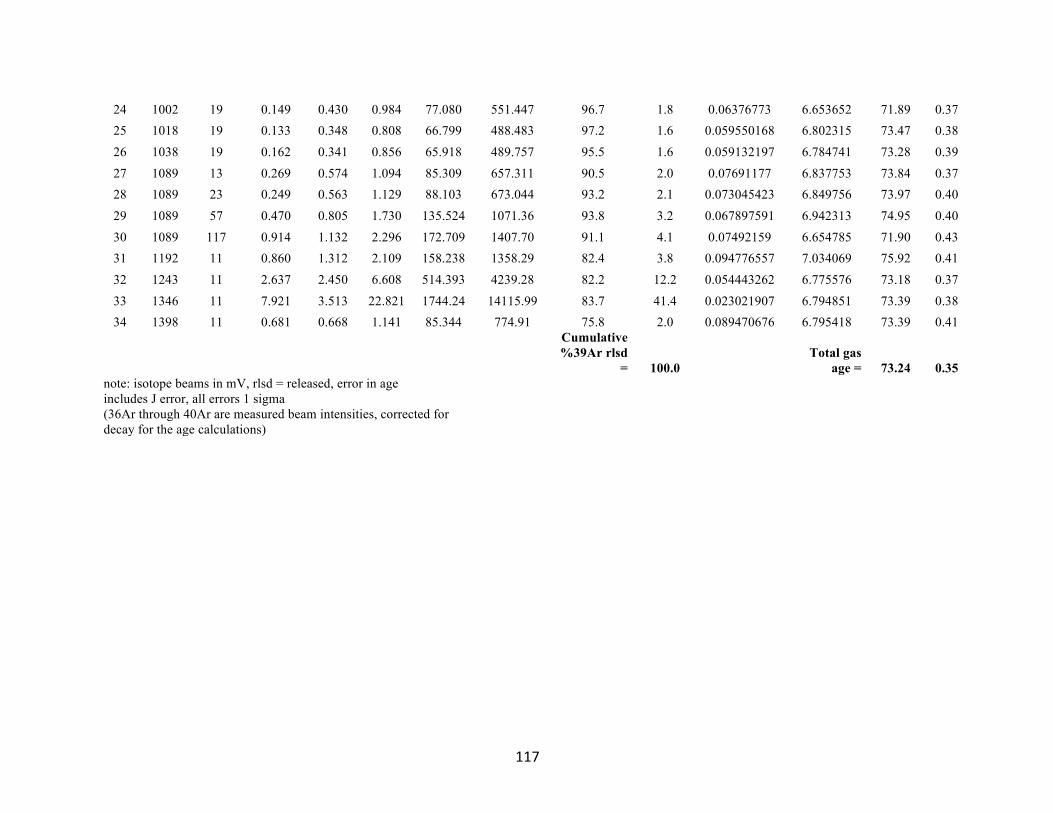
117
24 1002 19 0.149 0.430 0.984 77.080 551.447 96.7 1.8 0.06376773 6.653652 71.89 0.37 25 1018 19 0.133 0.348 0.808 66.799 488.483 97.2 1.6 0.059550168 6.802315 73.47 0.38 26 1038 19 0.162 0.341 0.856 65.918 489.757 95.5 1.6 0.059132197 6.784741 73.28 0.39 27 1089 13 0.269 0.574 1.094 85.309 657.311 90.5 2.0 0.07691177 6.837753 73.84 0.37 28 1089 23 0.249 0.563 1.129 88.103 673.044 93.2 2.1 0.073045423 6.849756 73.97 0.40 29 1089 57 0.470 0.805 1.730 135.524 1071.36 93.8 3.2 0.067897591 6.942313 74.95 0.40 30 1089 117 0.914 1.132 2.296 172.709 1407.70 91.1 4.1 0.07492159 6.654785 71.90 0.43 31 1192 11 0.860 1.312 2.109 158.238 1358.29 82.4 3.8 0.094776557 7.034069 75.92 0.41 32 1243 11 2.637 2.450 6.608 514.393 4239.28 82.2 12.2 0.054443262 6.775576 73.18 0.37 33 1346 11 7.921 3.513 22.821 1744.24 14115.99 83.7 41.4 0.023021907 6.794851 73.39 0.38 34 1398 11 0.681 0.668 1.141 85.344 774.91 75.8 2.0 0.089470676 6.795418 73.39 0.41
Cumulative %39Ar rlsd
= 100.0 Total gas
age = 73.24 0.35 note: isotope beams in mV, rlsd = released, error in age includes J error, all errors 1 sigma (36Ar through 40Ar are measured beam intensities, corrected for decay for the age calculations)
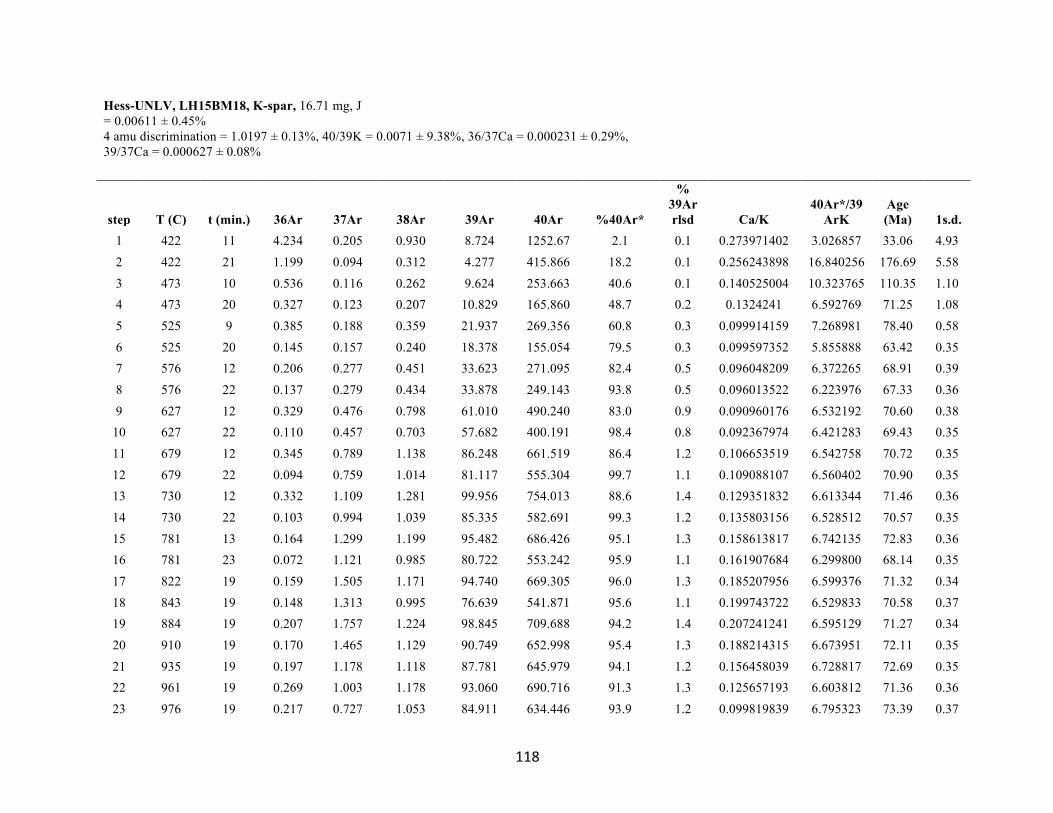
118
Hess-UNLV, LH15BM18, K-spar, 16.71 mg, J = 0.00611 ± 0.45% 4 amu discrimination = 1.0197 ± 0.13%, 40/39K = 0.0071 ± 9.38%, 36/37Ca = 0.000231 ± 0.29%, 39/37Ca = 0.000627 ± 0.08%
step T (C) t (min.) 36Ar 37Ar 38Ar 39Ar 40Ar %40Ar*
% 39Ar rlsd Ca/K
40Ar*/39ArK
Age (Ma) 1s.d.
1 422 11 4.234 0.205 0.930 8.724 1252.67 2.1 0.1 0.273971402 3.026857 33.06 4.93 2 422 21 1.199 0.094 0.312 4.277 415.866 18.2 0.1 0.256243898 16.840256 176.69 5.58 3 473 10 0.536 0.116 0.262 9.624 253.663 40.6 0.1 0.140525004 10.323765 110.35 1.10 4 473 20 0.327 0.123 0.207 10.829 165.860 48.7 0.2 0.1324241 6.592769 71.25 1.08 5 525 9 0.385 0.188 0.359 21.937 269.356 60.8 0.3 0.099914159 7.268981 78.40 0.58 6 525 20 0.145 0.157 0.240 18.378 155.054 79.5 0.3 0.099597352 5.855888 63.42 0.35 7 576 12 0.206 0.277 0.451 33.623 271.095 82.4 0.5 0.096048209 6.372265 68.91 0.39 8 576 22 0.137 0.279 0.434 33.878 249.143 93.8 0.5 0.096013522 6.223976 67.33 0.36 9 627 12 0.329 0.476 0.798 61.010 490.240 83.0 0.9 0.090960176 6.532192 70.60 0.38
10 627 22 0.110 0.457 0.703 57.682 400.191 98.4 0.8 0.092367974 6.421283 69.43 0.35 11 679 12 0.345 0.789 1.138 86.248 661.519 86.4 1.2 0.106653519 6.542758 70.72 0.35 12 679 22 0.094 0.759 1.014 81.117 555.304 99.7 1.1 0.109088107 6.560402 70.90 0.35 13 730 12 0.332 1.109 1.281 99.956 754.013 88.6 1.4 0.129351832 6.613344 71.46 0.36 14 730 22 0.103 0.994 1.039 85.335 582.691 99.3 1.2 0.135803156 6.528512 70.57 0.35 15 781 13 0.164 1.299 1.199 95.482 686.426 95.1 1.3 0.158613817 6.742135 72.83 0.36 16 781 23 0.072 1.121 0.985 80.722 553.242 95.9 1.1 0.161907684 6.299800 68.14 0.35 17 822 19 0.159 1.505 1.171 94.740 669.305 96.0 1.3 0.185207956 6.599376 71.32 0.34 18 843 19 0.148 1.313 0.995 76.639 541.871 95.6 1.1 0.199743722 6.529833 70.58 0.37 19 884 19 0.207 1.757 1.224 98.845 709.688 94.2 1.4 0.207241241 6.595129 71.27 0.34 20 910 19 0.170 1.465 1.129 90.749 652.998 95.4 1.3 0.188214315 6.673951 72.11 0.35 21 935 19 0.197 1.178 1.118 87.781 645.979 94.1 1.2 0.156458039 6.728817 72.69 0.35 22 961 19 0.269 1.003 1.178 93.060 690.716 91.3 1.3 0.125657193 6.603812 71.36 0.36 23 976 19 0.217 0.727 1.053 84.911 634.446 93.9 1.2 0.099819839 6.795323 73.39 0.37
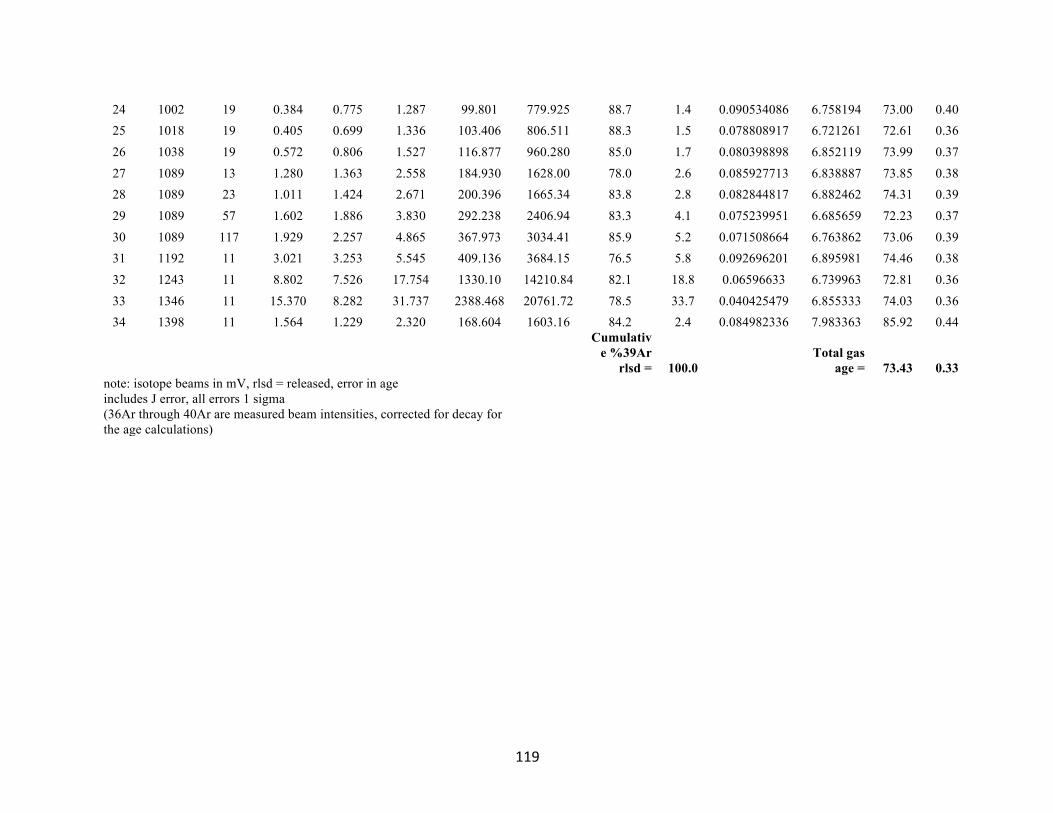
119
24 1002 19 0.384 0.775 1.287 99.801 779.925 88.7 1.4 0.090534086 6.758194 73.00 0.40 25 1018 19 0.405 0.699 1.336 103.406 806.511 88.3 1.5 0.078808917 6.721261 72.61 0.36 26 1038 19 0.572 0.806 1.527 116.877 960.280 85.0 1.7 0.080398898 6.852119 73.99 0.37 27 1089 13 1.280 1.363 2.558 184.930 1628.00 78.0 2.6 0.085927713 6.838887 73.85 0.38 28 1089 23 1.011 1.424 2.671 200.396 1665.34 83.8 2.8 0.082844817 6.882462 74.31 0.39 29 1089 57 1.602 1.886 3.830 292.238 2406.94 83.3 4.1 0.075239951 6.685659 72.23 0.37 30 1089 117 1.929 2.257 4.865 367.973 3034.41 85.9 5.2 0.071508664 6.763862 73.06 0.39 31 1192 11 3.021 3.253 5.545 409.136 3684.15 76.5 5.8 0.092696201 6.895981 74.46 0.38 32 1243 11 8.802 7.526 17.754 1330.10 14210.84 82.1 18.8 0.06596633 6.739963 72.81 0.36 33 1346 11 15.370 8.282 31.737 2388.468 20761.72 78.5 33.7 0.040425479 6.855333 74.03 0.36 34 1398 11 1.564 1.229 2.320 168.604 1603.16 84.2 2.4 0.084982336 7.983363 85.92 0.44
Cumulative %39Ar
rlsd = 100.0 Total gas
age = 73.43 0.33 note: isotope beams in mV, rlsd = released, error in age includes J error, all errors 1 sigma (36Ar through 40Ar are measured beam intensities, corrected for decay for the age calculations)
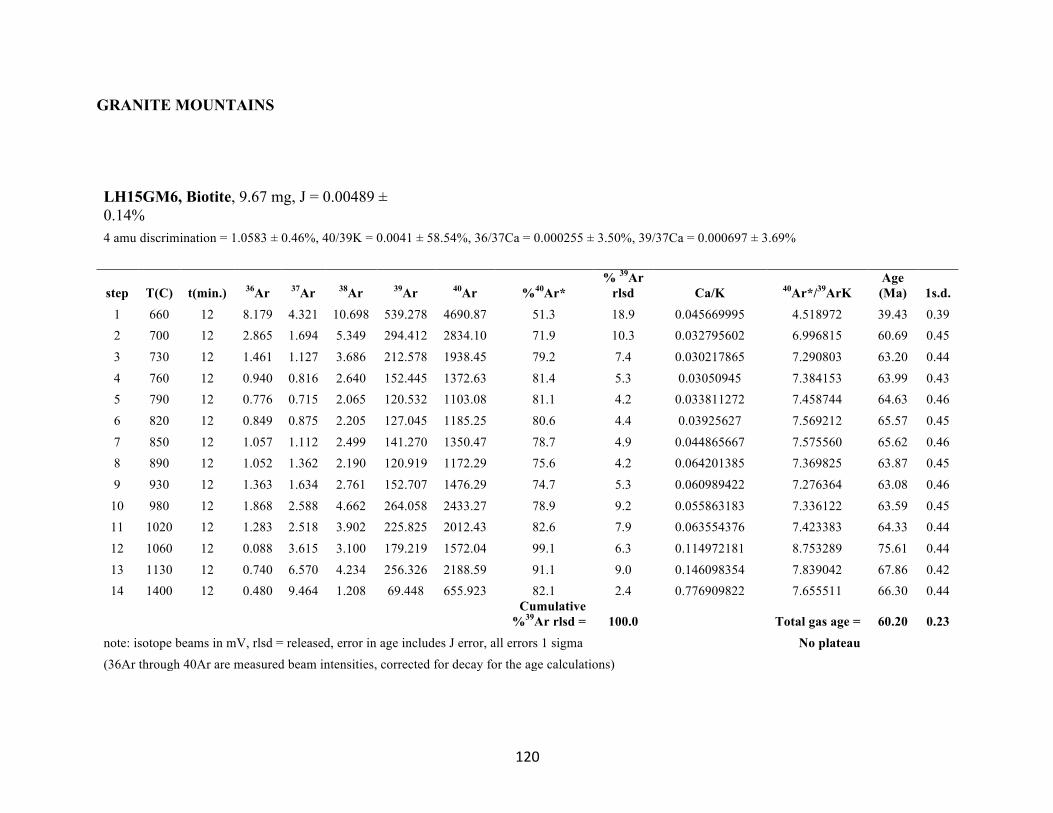
120
GRANITE MOUNTAINS
LH15GM6, Biotite, 9.67 mg, J = 0.00489 ± 0.14% 4 amu discrimination = 1.0583 ± 0.46%, 40/39K = 0.0041 ± 58.54%, 36/37Ca = 0.000255 ± 3.50%, 39/37Ca = 0.000697 ± 3.69%
step T(C) t(min.) 36Ar 37Ar 38Ar 39Ar 40Ar %40Ar* % 39Ar
rlsd Ca/K 40Ar*/39ArK Age (Ma)
1s.d.
1 660 12 8.179 4.321 10.698 539.278 4690.87 51.3 18.9 0.045669995 4.518972 39.43 0.39 2 700 12 2.865 1.694 5.349 294.412 2834.10 71.9 10.3 0.032795602 6.996815 60.69 0.45 3 730 12 1.461 1.127 3.686 212.578 1938.45 79.2 7.4 0.030217865 7.290803 63.20 0.44 4 760 12 0.940 0.816 2.640 152.445 1372.63 81.4 5.3 0.03050945 7.384153 63.99 0.43 5 790 12 0.776 0.715 2.065 120.532 1103.08 81.1 4.2 0.033811272 7.458744 64.63 0.46 6 820 12 0.849 0.875 2.205 127.045 1185.25 80.6 4.4 0.03925627 7.569212 65.57 0.45 7 850 12 1.057 1.112 2.499 141.270 1350.47 78.7 4.9 0.044865667 7.575560 65.62 0.46 8 890 12 1.052 1.362 2.190 120.919 1172.29 75.6 4.2 0.064201385 7.369825 63.87 0.45 9 930 12 1.363 1.634 2.761 152.707 1476.29 74.7 5.3 0.060989422 7.276364 63.08 0.46
10 980 12 1.868 2.588 4.662 264.058 2433.27 78.9 9.2 0.055863183 7.336122 63.59 0.45 11 1020 12 1.283 2.518 3.902 225.825 2012.43 82.6 7.9 0.063554376 7.423383 64.33 0.44 12 1060 12 0.088 3.615 3.100 179.219 1572.04 99.1 6.3 0.114972181 8.753289 75.61 0.44 13 1130 12 0.740 6.570 4.234 256.326 2188.59 91.1 9.0 0.146098354 7.839042 67.86 0.42 14 1400 12 0.480 9.464 1.208 69.448 655.923 82.1 2.4 0.776909822 7.655511 66.30 0.44
Cumulative
%39Ar rlsd = 100.0 Total gas age = 60.20 0.23 note: isotope beams in mV, rlsd = released, error in age includes J error, all errors 1 sigma No plateau (36Ar through 40Ar are measured beam intensities, corrected for decay for the age calculations)
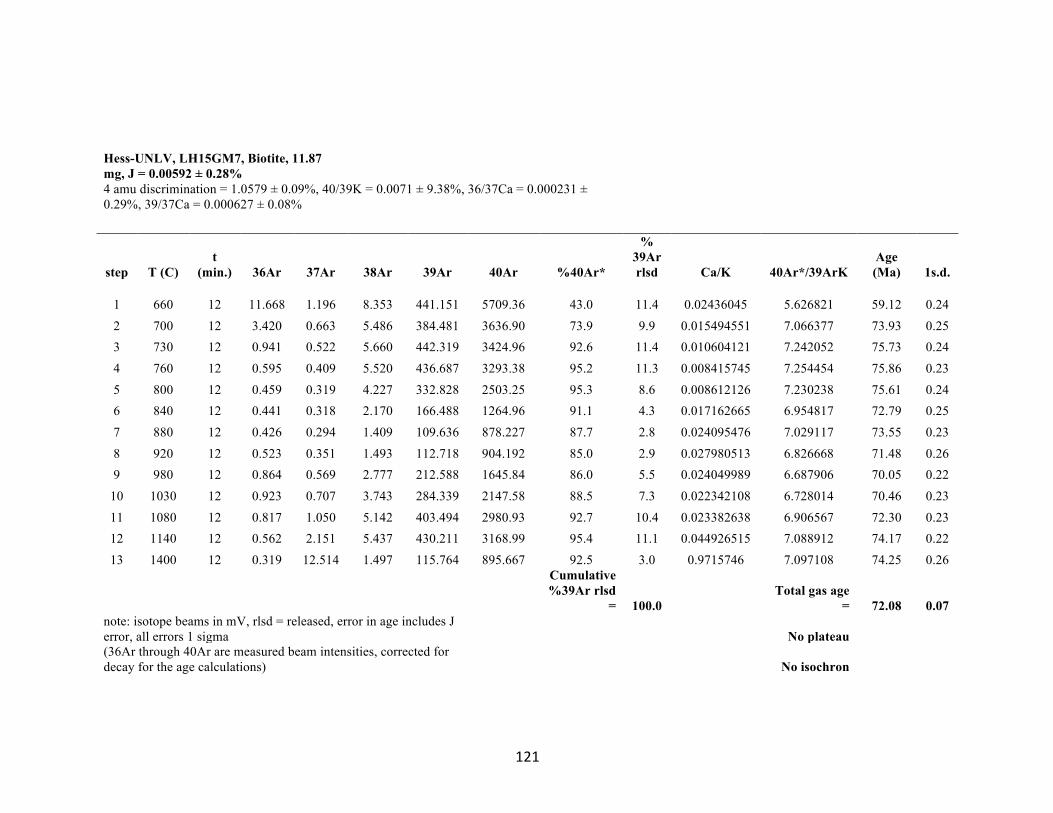
121
Hess-UNLV, LH15GM7, Biotite, 11.87 mg, J = 0.00592 ± 0.28% 4 amu discrimination = 1.0579 ± 0.09%, 40/39K = 0.0071 ± 9.38%, 36/37Ca = 0.000231 ± 0.29%, 39/37Ca = 0.000627 ± 0.08%
step T (C) t
(min.) 36Ar 37Ar 38Ar 39Ar 40Ar %40Ar*
% 39Ar rlsd Ca/K 40Ar*/39ArK
Age (Ma)
1s.d.
1 660 12 11.668 1.196 8.353 441.151 5709.36 43.0 11.4 0.02436045 5.626821 59.12 0.24 2 700 12 3.420 0.663 5.486 384.481 3636.90 73.9 9.9 0.015494551 7.066377 73.93 0.25 3 730 12 0.941 0.522 5.660 442.319 3424.96 92.6 11.4 0.010604121 7.242052 75.73 0.24 4 760 12 0.595 0.409 5.520 436.687 3293.38 95.2 11.3 0.008415745 7.254454 75.86 0.23 5 800 12 0.459 0.319 4.227 332.828 2503.25 95.3 8.6 0.008612126 7.230238 75.61 0.24 6 840 12 0.441 0.318 2.170 166.488 1264.96 91.1 4.3 0.017162665 6.954817 72.79 0.25 7 880 12 0.426 0.294 1.409 109.636 878.227 87.7 2.8 0.024095476 7.029117 73.55 0.23 8 920 12 0.523 0.351 1.493 112.718 904.192 85.0 2.9 0.027980513 6.826668 71.48 0.26 9 980 12 0.864 0.569 2.777 212.588 1645.84 86.0 5.5 0.024049989 6.687906 70.05 0.22
10 1030 12 0.923 0.707 3.743 284.339 2147.58 88.5 7.3 0.022342108 6.728014 70.46 0.23 11 1080 12 0.817 1.050 5.142 403.494 2980.93 92.7 10.4 0.023382638 6.906567 72.30 0.23 12 1140 12 0.562 2.151 5.437 430.211 3168.99 95.4 11.1 0.044926515 7.088912 74.17 0.22 13 1400 12 0.319 12.514 1.497 115.764 895.667 92.5 3.0 0.9715746 7.097108 74.25 0.26
Cumulative %39Ar rlsd
= 100.0 Total gas age
= 72.08 0.07 note: isotope beams in mV, rlsd = released, error in age includes J error, all errors 1 sigma No plateau (36Ar through 40Ar are measured beam intensities, corrected for decay for the age calculations) No isochron
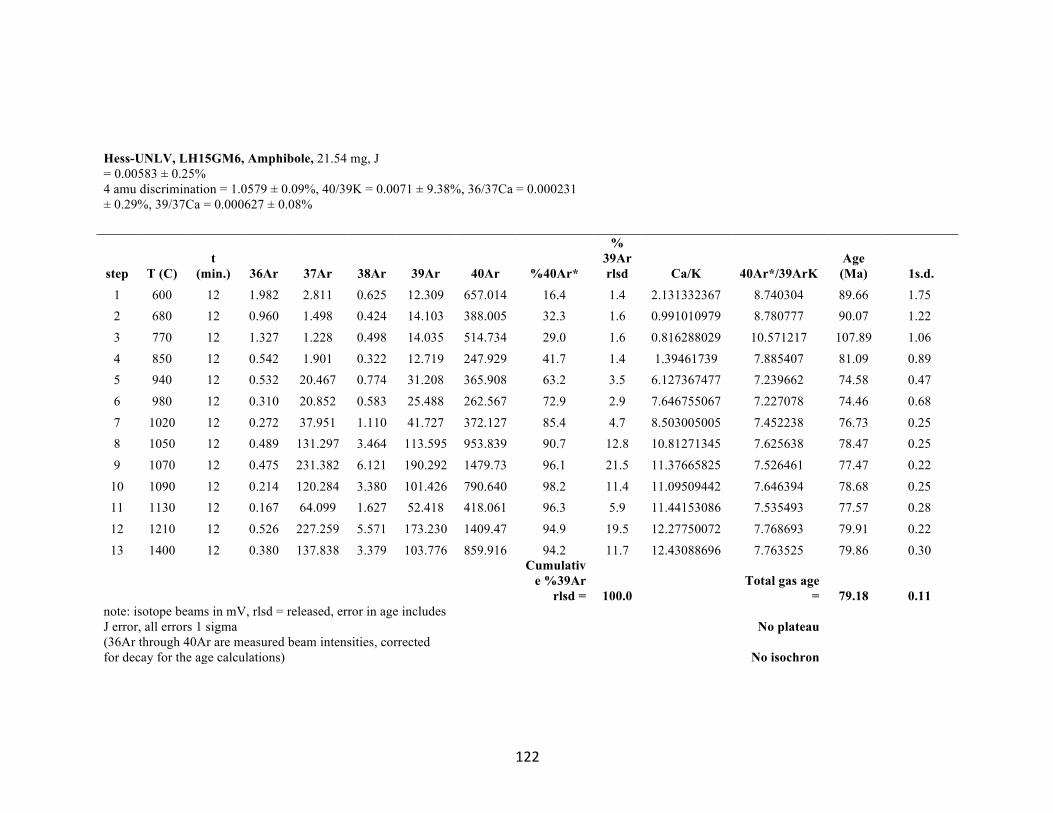
122
Hess-UNLV, LH15GM6, Amphibole, 21.54 mg, J = 0.00583 ± 0.25% 4 amu discrimination = 1.0579 ± 0.09%, 40/39K = 0.0071 ± 9.38%, 36/37Ca = 0.000231 ± 0.29%, 39/37Ca = 0.000627 ± 0.08%
step T (C) t
(min.) 36Ar 37Ar 38Ar 39Ar 40Ar %40Ar*
% 39Ar rlsd Ca/K 40Ar*/39ArK
Age (Ma) 1s.d.
1 600 12 1.982 2.811 0.625 12.309 657.014 16.4 1.4 2.131332367 8.740304 89.66 1.75 2 680 12 0.960 1.498 0.424 14.103 388.005 32.3 1.6 0.991010979 8.780777 90.07 1.22 3 770 12 1.327 1.228 0.498 14.035 514.734 29.0 1.6 0.816288029 10.571217 107.89 1.06 4 850 12 0.542 1.901 0.322 12.719 247.929 41.7 1.4 1.39461739 7.885407 81.09 0.89 5 940 12 0.532 20.467 0.774 31.208 365.908 63.2 3.5 6.127367477 7.239662 74.58 0.47 6 980 12 0.310 20.852 0.583 25.488 262.567 72.9 2.9 7.646755067 7.227078 74.46 0.68 7 1020 12 0.272 37.951 1.110 41.727 372.127 85.4 4.7 8.503005005 7.452238 76.73 0.25 8 1050 12 0.489 131.297 3.464 113.595 953.839 90.7 12.8 10.81271345 7.625638 78.47 0.25 9 1070 12 0.475 231.382 6.121 190.292 1479.73 96.1 21.5 11.37665825 7.526461 77.47 0.22
10 1090 12 0.214 120.284 3.380 101.426 790.640 98.2 11.4 11.09509442 7.646394 78.68 0.25 11 1130 12 0.167 64.099 1.627 52.418 418.061 96.3 5.9 11.44153086 7.535493 77.57 0.28 12 1210 12 0.526 227.259 5.571 173.230 1409.47 94.9 19.5 12.27750072 7.768693 79.91 0.22 13 1400 12 0.380 137.838 3.379 103.776 859.916 94.2 11.7 12.43088696 7.763525 79.86 0.30
Cumulative %39Ar
rlsd = 100.0 Total gas age
= 79.18 0.11 note: isotope beams in mV, rlsd = released, error in age includes J error, all errors 1 sigma No plateau (36Ar through 40Ar are measured beam intensities, corrected for decay for the age calculations) No isochron
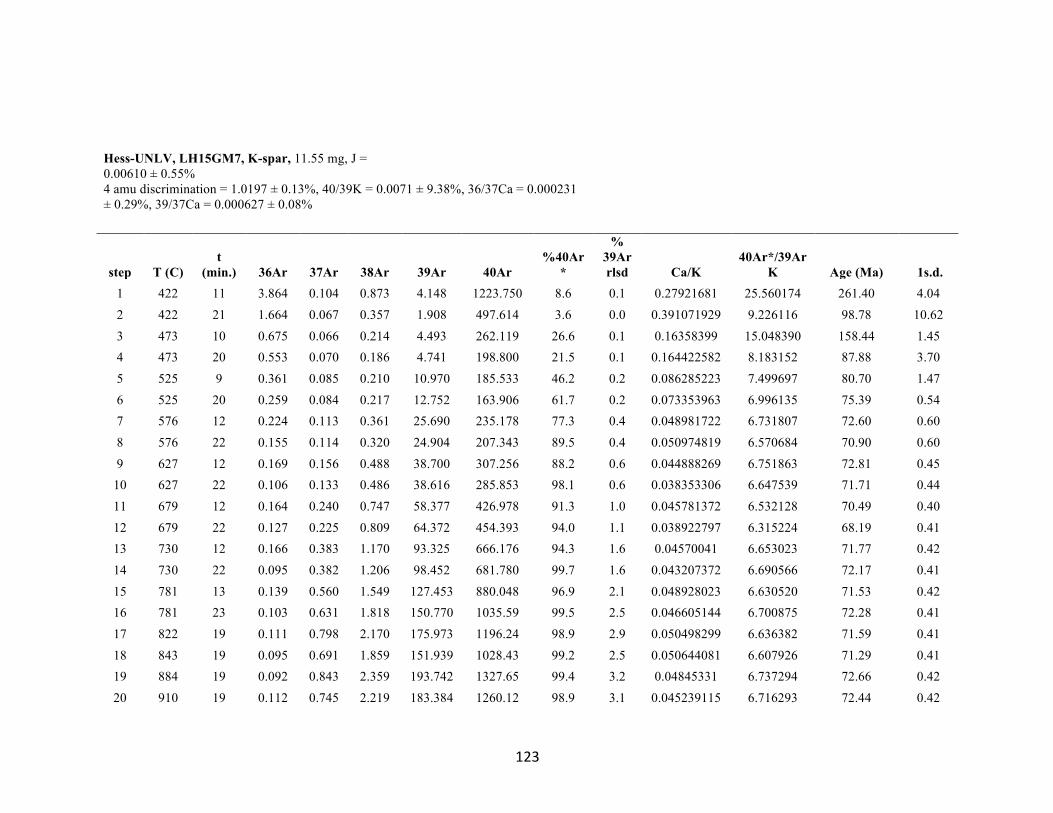
123
Hess-UNLV, LH15GM7, K-spar, 11.55 mg, J = 0.00610 ± 0.55% 4 amu discrimination = 1.0197 ± 0.13%, 40/39K = 0.0071 ± 9.38%, 36/37Ca = 0.000231 ± 0.29%, 39/37Ca = 0.000627 ± 0.08%
step T (C) t
(min.) 36Ar 37Ar 38Ar 39Ar 40Ar %40Ar
*
% 39Ar rlsd Ca/K
40Ar*/39ArK Age (Ma) 1s.d.
1 422 11 3.864 0.104 0.873 4.148 1223.750 8.6 0.1 0.27921681 25.560174 261.40 4.04 2 422 21 1.664 0.067 0.357 1.908 497.614 3.6 0.0 0.391071929 9.226116 98.78 10.62 3 473 10 0.675 0.066 0.214 4.493 262.119 26.6 0.1 0.16358399 15.048390 158.44 1.45 4 473 20 0.553 0.070 0.186 4.741 198.800 21.5 0.1 0.164422582 8.183152 87.88 3.70 5 525 9 0.361 0.085 0.210 10.970 185.533 46.2 0.2 0.086285223 7.499697 80.70 1.47 6 525 20 0.259 0.084 0.217 12.752 163.906 61.7 0.2 0.073353963 6.996135 75.39 0.54 7 576 12 0.224 0.113 0.361 25.690 235.178 77.3 0.4 0.048981722 6.731807 72.60 0.60 8 576 22 0.155 0.114 0.320 24.904 207.343 89.5 0.4 0.050974819 6.570684 70.90 0.60 9 627 12 0.169 0.156 0.488 38.700 307.256 88.2 0.6 0.044888269 6.751863 72.81 0.45
10 627 22 0.106 0.133 0.486 38.616 285.853 98.1 0.6 0.038353306 6.647539 71.71 0.44 11 679 12 0.164 0.240 0.747 58.377 426.978 91.3 1.0 0.045781372 6.532128 70.49 0.40 12 679 22 0.127 0.225 0.809 64.372 454.393 94.0 1.1 0.038922797 6.315224 68.19 0.41 13 730 12 0.166 0.383 1.170 93.325 666.176 94.3 1.6 0.04570041 6.653023 71.77 0.42 14 730 22 0.095 0.382 1.206 98.452 681.780 99.7 1.6 0.043207372 6.690566 72.17 0.41 15 781 13 0.139 0.560 1.549 127.453 880.048 96.9 2.1 0.048928023 6.630520 71.53 0.42 16 781 23 0.103 0.631 1.818 150.770 1035.59 99.5 2.5 0.046605144 6.700875 72.28 0.41 17 822 19 0.111 0.798 2.170 175.973 1196.24 98.9 2.9 0.050498299 6.636382 71.59 0.41 18 843 19 0.095 0.691 1.859 151.939 1028.43 99.2 2.5 0.050644081 6.607926 71.29 0.41 19 884 19 0.092 0.843 2.359 193.742 1327.65 99.4 3.2 0.04845331 6.737294 72.66 0.42 20 910 19 0.112 0.745 2.219 183.384 1260.12 98.9 3.1 0.045239115 6.716293 72.44 0.42
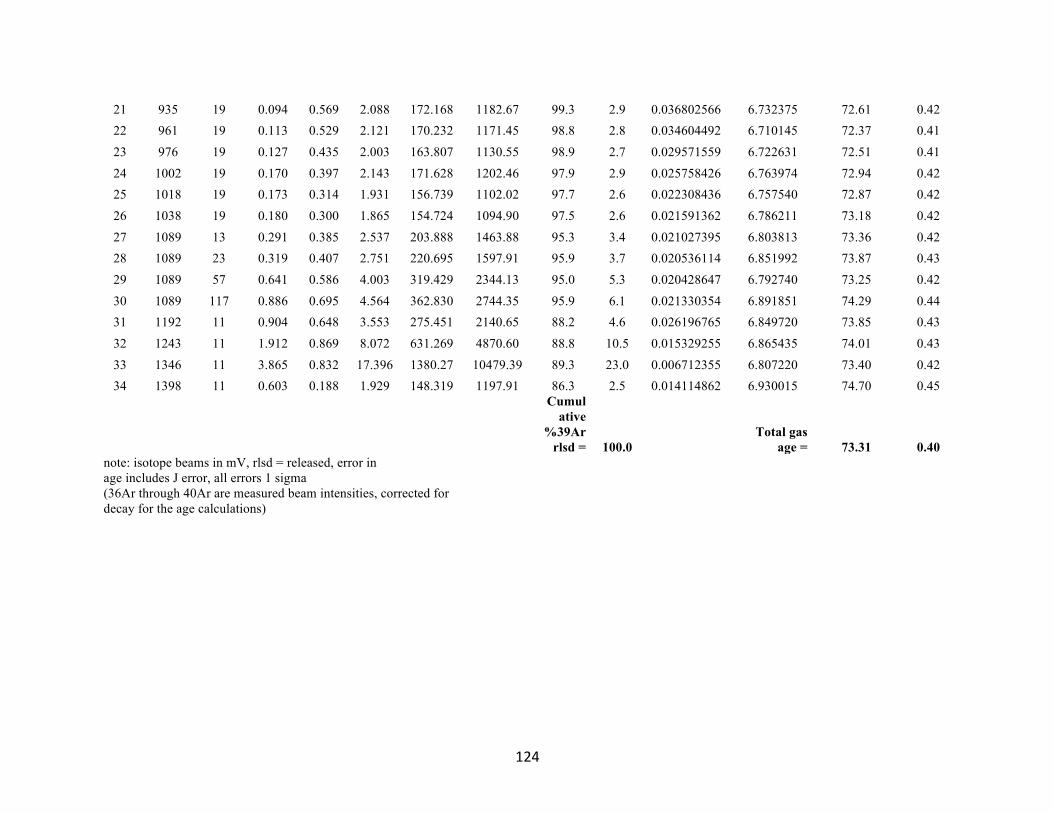
124
21 935 19 0.094 0.569 2.088 172.168 1182.67 99.3 2.9 0.036802566 6.732375 72.61 0.42 22 961 19 0.113 0.529 2.121 170.232 1171.45 98.8 2.8 0.034604492 6.710145 72.37 0.41 23 976 19 0.127 0.435 2.003 163.807 1130.55 98.9 2.7 0.029571559 6.722631 72.51 0.41 24 1002 19 0.170 0.397 2.143 171.628 1202.46 97.9 2.9 0.025758426 6.763974 72.94 0.42 25 1018 19 0.173 0.314 1.931 156.739 1102.02 97.7 2.6 0.022308436 6.757540 72.87 0.42 26 1038 19 0.180 0.300 1.865 154.724 1094.90 97.5 2.6 0.021591362 6.786211 73.18 0.42 27 1089 13 0.291 0.385 2.537 203.888 1463.88 95.3 3.4 0.021027395 6.803813 73.36 0.42 28 1089 23 0.319 0.407 2.751 220.695 1597.91 95.9 3.7 0.020536114 6.851992 73.87 0.43 29 1089 57 0.641 0.586 4.003 319.429 2344.13 95.0 5.3 0.020428647 6.792740 73.25 0.42 30 1089 117 0.886 0.695 4.564 362.830 2744.35 95.9 6.1 0.021330354 6.891851 74.29 0.44 31 1192 11 0.904 0.648 3.553 275.451 2140.65 88.2 4.6 0.026196765 6.849720 73.85 0.43 32 1243 11 1.912 0.869 8.072 631.269 4870.60 88.8 10.5 0.015329255 6.865435 74.01 0.43 33 1346 11 3.865 0.832 17.396 1380.27 10479.39 89.3 23.0 0.006712355 6.807220 73.40 0.42 34 1398 11 0.603 0.188 1.929 148.319 1197.91 86.3 2.5 0.014114862 6.930015 74.70 0.45
Cumulative
%39Ar rlsd = 100.0
Total gas age = 73.31 0.40
note: isotope beams in mV, rlsd = released, error in age includes J error, all errors 1 sigma (36Ar through 40Ar are measured beam intensities, corrected for decay for the age calculations)
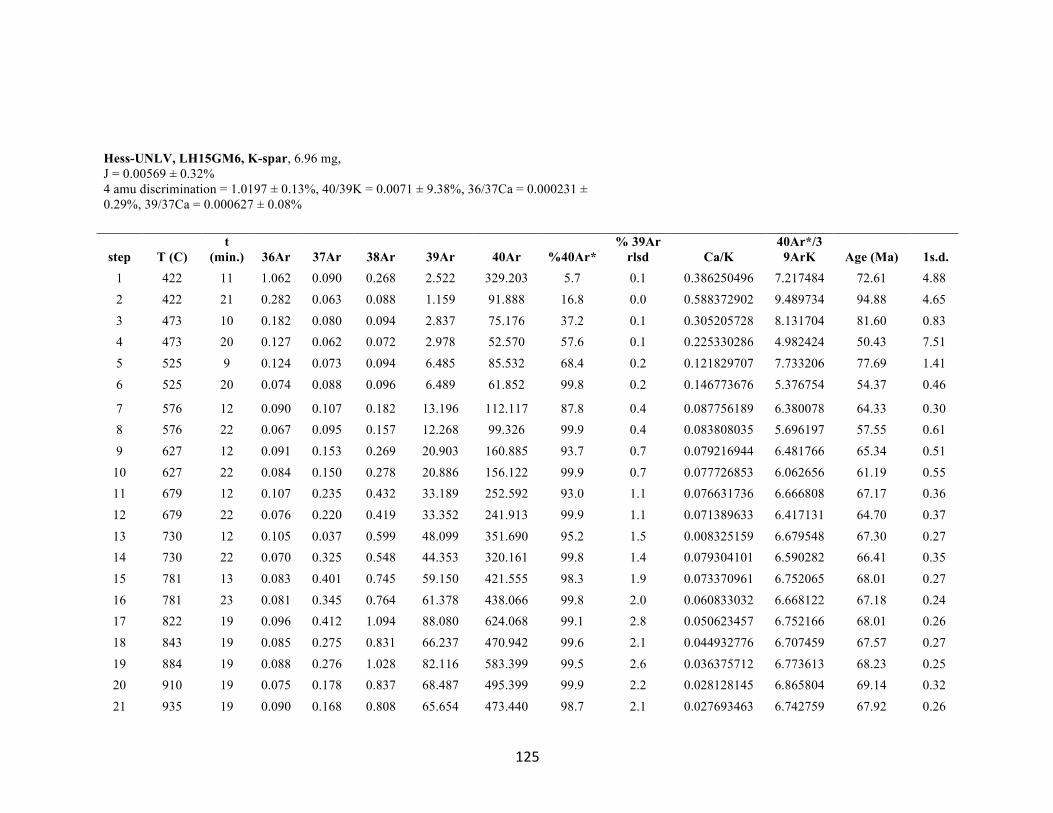
125
Hess-UNLV, LH15GM6, K-spar, 6.96 mg, J = 0.00569 ± 0.32% 4 amu discrimination = 1.0197 ± 0.13%, 40/39K = 0.0071 ± 9.38%, 36/37Ca = 0.000231 ± 0.29%, 39/37Ca = 0.000627 ± 0.08%
step T (C) t
(min.) 36Ar 37Ar 38Ar 39Ar 40Ar %40Ar* % 39Ar
rlsd Ca/K 40Ar*/3
9ArK Age (Ma) 1s.d. 1 422 11 1.062 0.090 0.268 2.522 329.203 5.7 0.1 0.386250496 7.217484 72.61 4.88 2 422 21 0.282 0.063 0.088 1.159 91.888 16.8 0.0 0.588372902 9.489734 94.88 4.65 3 473 10 0.182 0.080 0.094 2.837 75.176 37.2 0.1 0.305205728 8.131704 81.60 0.83 4 473 20 0.127 0.062 0.072 2.978 52.570 57.6 0.1 0.225330286 4.982424 50.43 7.51 5 525 9 0.124 0.073 0.094 6.485 85.532 68.4 0.2 0.121829707 7.733206 77.69 1.41 6 525 20 0.074 0.088 0.096 6.489 61.852 99.8 0.2 0.146773676 5.376754 54.37 0.46
7 576 12 0.090 0.107 0.182 13.196 112.117 87.8 0.4 0.087756189 6.380078 64.33 0.30 8 576 22 0.067 0.095 0.157 12.268 99.326 99.9 0.4 0.083808035 5.696197 57.55 0.61 9 627 12 0.091 0.153 0.269 20.903 160.885 93.7 0.7 0.079216944 6.481766 65.34 0.51
10 627 22 0.084 0.150 0.278 20.886 156.122 99.9 0.7 0.077726853 6.062656 61.19 0.55 11 679 12 0.107 0.235 0.432 33.189 252.592 93.0 1.1 0.076631736 6.666808 67.17 0.36 12 679 22 0.076 0.220 0.419 33.352 241.913 99.9 1.1 0.071389633 6.417131 64.70 0.37 13 730 12 0.105 0.037 0.599 48.099 351.690 95.2 1.5 0.008325159 6.679548 67.30 0.27 14 730 22 0.070 0.325 0.548 44.353 320.161 99.8 1.4 0.079304101 6.590282 66.41 0.35 15 781 13 0.083 0.401 0.745 59.150 421.555 98.3 1.9 0.073370961 6.752065 68.01 0.27 16 781 23 0.081 0.345 0.764 61.378 438.066 99.8 2.0 0.060833032 6.668122 67.18 0.24 17 822 19 0.096 0.412 1.094 88.080 624.068 99.1 2.8 0.050623457 6.752166 68.01 0.26 18 843 19 0.085 0.275 0.831 66.237 470.942 99.6 2.1 0.044932776 6.707459 67.57 0.27 19 884 19 0.088 0.276 1.028 82.116 583.399 99.5 2.6 0.036375712 6.773613 68.23 0.25 20 910 19 0.075 0.178 0.837 68.487 495.399 99.9 2.2 0.028128145 6.865804 69.14 0.32 21 935 19 0.090 0.168 0.808 65.654 473.440 98.7 2.1 0.027693463 6.742759 67.92 0.26
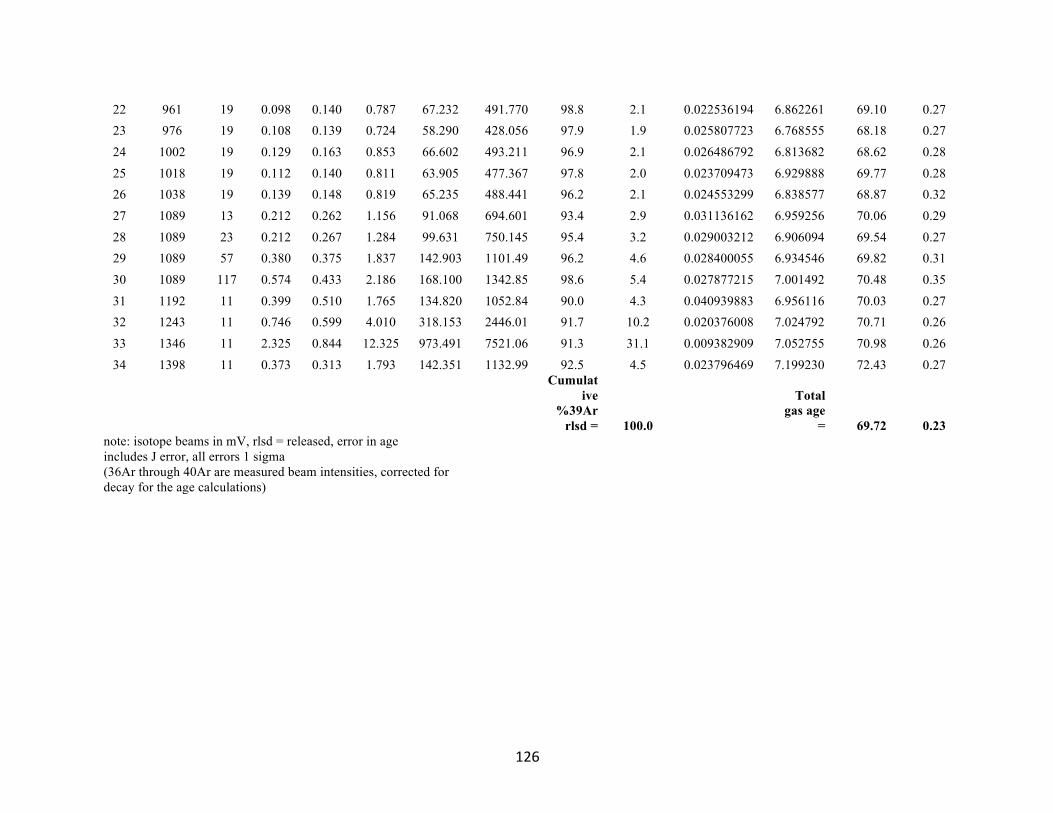
126
22 961 19 0.098 0.140 0.787 67.232 491.770 98.8 2.1 0.022536194 6.862261 69.10 0.27 23 976 19 0.108 0.139 0.724 58.290 428.056 97.9 1.9 0.025807723 6.768555 68.18 0.27 24 1002 19 0.129 0.163 0.853 66.602 493.211 96.9 2.1 0.026486792 6.813682 68.62 0.28 25 1018 19 0.112 0.140 0.811 63.905 477.367 97.8 2.0 0.023709473 6.929888 69.77 0.28 26 1038 19 0.139 0.148 0.819 65.235 488.441 96.2 2.1 0.024553299 6.838577 68.87 0.32 27 1089 13 0.212 0.262 1.156 91.068 694.601 93.4 2.9 0.031136162 6.959256 70.06 0.29 28 1089 23 0.212 0.267 1.284 99.631 750.145 95.4 3.2 0.029003212 6.906094 69.54 0.27 29 1089 57 0.380 0.375 1.837 142.903 1101.49 96.2 4.6 0.028400055 6.934546 69.82 0.31 30 1089 117 0.574 0.433 2.186 168.100 1342.85 98.6 5.4 0.027877215 7.001492 70.48 0.35 31 1192 11 0.399 0.510 1.765 134.820 1052.84 90.0 4.3 0.040939883 6.956116 70.03 0.27 32 1243 11 0.746 0.599 4.010 318.153 2446.01 91.7 10.2 0.020376008 7.024792 70.71 0.26 33 1346 11 2.325 0.844 12.325 973.491 7521.06 91.3 31.1 0.009382909 7.052755 70.98 0.26 34 1398 11 0.373 0.313 1.793 142.351 1132.99 92.5 4.5 0.023796469 7.199230 72.43 0.27
Cumulative
%39Ar rlsd = 100.0
Total gas age
= 69.72 0.23 note: isotope beams in mV, rlsd = released, error in age includes J error, all errors 1 sigma (36Ar through 40Ar are measured beam intensities, corrected for decay for the age calculations)
REFERENCES Anderson, J.L. and Smith, D.R., 1995, The effects of temperature and f02 on the Al-in hornblende
barometer: American Mineralogist, v. 80, p. 549-559. Applegate, J.D.R., Walker, J.D., Hodges, K.V., 1992, Late Cretaceous extensional unroofing in
the Funeral Mountains metamorphic core complex, California: Geology. v. 19, p. 519–522. Applegate, J.D., Hodges, K.V., 1995, Mesozoic and Cenozoic extension recorded by
metamorphic rocks in the Funeral Mountains, California: Geological Society of America Bulletin, v. 107, p. 1063–1076.
Barth, A. P., and Schneiderman, J. S., 1996, A comparison of structures in the Andean Orogen of
northern Chile and exhumed midcrustal structures in southern California, USA: An analogy in tectonic style?, International Geology Review, v. 38, p. 1075–1085.
Beyene, M.A., 2000, Kinematics and timing of the Pinto Shear Zone, New York Mountains,
Northeastern Mojave Desert, California. MS thesis, University of Nevada, Las Vegas. Burchfiel, B.C., Davis, G.A., 1976. Compression and crustal shortening in Andean-type
orogenesis: Nature, v. 260, p. 693–694. Burchfiel, B.C., Cowan, D.S., and Davis, G.A., 1992, Tectonic overview of the Cordilleran
orogen in the western United States, in Burchfiel, B.C., Lipman, P.W., and Zoback, M.L., eds., The Cordilleran Orogen: Conterminous U.S.: Boulder, Colorado, Geological Society of America, The Geology of North America, v. G-3, p. 407-479.
Carl, B.C., Miller, C.F., Foster, D.A., 1991, Western Old Woman Mountains shear zone:
evidence for latest Cretaceous core complex development in the southeastern California: Geology, v. 19, p. 893–896.
Coney, P. J., and T. A. Harms, 1984, Cordilleran metamorphic core complexes: Cenozoic
extensional relics of Mesozoic compression: Geology, v. 12, p. 550–554. Copeland, P., Currie, C.A., Lawton, T.F., and Murphy, M.A., 2017, Location, location, location:
The Variable lifespan of the Laramide orogeny: Geology, v. 45(3), p. 223-226. Constenius, K. N., 1996, Late Paleogene extensional collapse of the Cordilleran foreland fold
and thrust belt: Geological Society America Bulletin, v. 108, p. 20–39. DeCelles, P. G., 2004, Late Jurassic to Eocene evolution of the Cordilleran thrust belt and
foreland basin system, western U.S.A.: American. Journal of Science, v. 304, p. 105–168. DeCelles, P.G., and Graham, S.A., 2015, Cyclical processes in the North American Cordilleran
orogenic system: Geology, v. 43, p. 499-502.
127

DeCelles, P.G., Ducea, M.N., Kapp, P., and Zandt, G., 2009, Cyclicity in Cordilleran orogenic systems: Nature Geoscience, v. 2, p. 251–257.
Dickinson, W. R., 2002, The Basin and Range province as a composite extensional domain:
International Geology Review, v. 44, p. 1–38. Dickinson, W.R., and Snyder, W.S., 1979, Geometry of subducted slabs related to San Andreas
transform: The Journal of Geology, v. 87, p. 609-627. Druschke, P., Hanson, A.D., Wells, M.L., Gehrels, G.E. and Stockli, D., 2011. Paleogeographic
isolation of the Cretaceous to Eocene Sevier hinterland, east-central Nevada: Insights from U-Pb and (U-Th)/He detrital zircon ages of hinterland strata. Geological Society of America Bulletin, 123(5-6), p.1141-1160.
Dumitru, T.A., Gans, P.B., Foster, D.A., 1991, Refrigeration of the western Cordilleran
lithosphere during Laramide shallow-angle subduction: Geology, v. 19, p. 1145–1148. England, P., and Houseman, G., 1989, Extension during continental convergence, with application
to the Tibetan Plateau: Journal of Geophysical Research, Solid Earth, v. 94, p. 17561-17579.
Ernst, W.G., 2010, Subduction-zone metamorphism, calc-alkaline magmatism, and convergent-
margin crustal evolution: Gondwana Research, v. 18(1), p. 8-16. Faulds, J.E., Henry, C.D., and Hinz, N.H., 2005, Kinematics of the northern Walker Lane: An
incipient transform fault along the Pacific–North American plate boundary: Geology, v. 33(6), p. 505-508.
Faulds, J.E., and Henry, C.D., 2008, Tectonic influences on the spatial and temporal evolution of
the Walker Lane: An incipient transform fault along the evolving Pacifc – North American plate boundary, in Spencer, J.E., and Titley, S.R., eds., Ores and orogenesis: Circum- Pacific tectonics, geologic evolution, and ore deposits: Arizona Geological Society Digest v. 22, p. 437-470.
FitzGerald, J.D., and Stunitz, H., 1993, Deformation of granitoids at low metamorphic grade I:
reactions and grain size reduction: Tectonophysics, v. 221, p. 299–324. Foster, D.A., Harrison, T.M., Miller, C.F., and Howard, K.A., 1990, The 40Ar/39Ar
thermochronology of the eastern Mojave Desert, California, and adjacent western Arizona with implications for the evolution of metamorphic core complexes: Journal of Geophysical Research, v. 95, p. 20,005-20,024.
Foster, D.A., Miller, C.F., Harrison, T.M., and Hoisch, T.D., 1992, 40Ar/39Ar
thermochronology and thermobarometry of metamorphism, plutonism, and tectonic denudation in the Old Woman Mountains area, California: Geological Society of America Bulletin, v. 104, p. 176–191.
128
Gamble, J., 1959a, Geology and mineral resources of Township 8 North, Ranges 11 and 12 East, San Bernardino Base and Meridian, San Bernardino County, California: San Francisco, California, Southern Pacific company, unpublished report and l:24,000-scale map, 22 p.
Gamble, J., 1959b, Geology and mineral resources of Township 9 North, Ranges 11 and 12 East,
San Bernardino Base and Meridian, San Bernardino County, California: San Francisco, California, Southern Pacific Company, unpublished report and 1:24,000-scale map, 18 p.
Gapais, D., 1989, Shear structures within deformed granites: mechanical and thermal indicators:
Geology, v. 17, p. 1144-1147. George, P.G., Dokka, R.K., 1994, Major Late Cretaceous cooling events in the eastern
Peninsular Ranges, California, and their implications for Cordilleran tectonics: Geological Society of America Bulletin, v. 106, p. 903-914.
Glazner, A.F., 1994, Foundering of mafic plutons and density stratification of continental
crust: Geology, v. 22(5), p. 435-438. Grove, M., Lovera, O., and Harrison, M., 2003a, Late Cretaceous cooling of the east-central
Peninsular RangesBatholith (33 degrees N); relationship to La Posta Pluton emplacement, Laramide shallow subduction, and forearc sedimentation, in Johnson, S.E., et al., eds., Tectonic Evolution of Northwestern Mexico andSouthwestern USA: Geological Society of America Special Paper 374, p. 355–379.
Guillope, M., and Poirier, J.P., 1979, Dynamic recrystallization during creep of single-crystalline
halite: An experimental study: Journal of Geophysical Research, v. 84, p. 5557–5567. Henderson, L.J., Gordon, R.G., and Engebretsen, D.C., 1984, Mesozoic aseismic ridges on
the Farallon plate and southward migration of shallow subduction during the Laramide orogeny: Tectonics, v. 3, p. 121–132.
Hirth, G., and Tullis, J., 1992, Dislocation creep regimes in quartz aggregates: Journal of
Structural Geology, v. 14, p. 145–159. Hodges, K.V., and Walker, J.D., 1992, Extension in the Cretaceous Sevier orogen, North
American Cordillera: Geological Society of America bulletin, v. 104, p. 560-569. Holdsworth, R.E., Butler, C.A., and Roberts, A.M., 1997, The recognition of reactivation during
continental deformation: Journal of the Geological Society, v. 154(1), p. 73-78. Houseman, G.A., McKenzie, D.P., and Molnar, P., 1981, Convective instability of a thickened
boundary layer and its relevance for the thermal evolution of continental convergent belts: Journal of Geophysical Research: Solid Earth, v, 86, p. 6115-6132.
Howard, K.A. and Miller, D.M., 1992, Late Cenozoic Faulting at the Boundary between the
Mojave and Sonoran Blocks: Bristol Lake Area, California, in Richard, S.M., ed., Deformation associated with the Neogene Eastern California Shear Zone, southeastern
129
California and southwestern Arizona, San Bernardino County Museums Special Publication, p. 37-47.
Howard, K.A., Kilburn, J.E., Simpson, R.W., Fitzgibbon, Todd T., Detra, D.E., Raines, G.L, and
Sabine, C., 1987, Mineral resources of the Bristol/Granite Mountains Wilderness Study Area, San Bernardino County, California: U. S. Geological Survey Bulletin, Report: B 1712-C, p.C1-C18.
Humphreys, E. D., 1995, Post-Laramide removal of the Farallon slab, western United States:
Geology, v. 23, p. 987–990. Ibanez-Mejia, M., Pullen, A., Arenstein, J., Gehrels, G.E., Valley, J., Ducea, M.N., Mora, A.R.,
Pecha, M. and Ruiz, J., 2015, Unraveling crustal growth and reworking processes in complex zircons from orogenic lower-crust: The Proterozoic Putumayo Orogen of Amazonia: Precambrian Research, v. 267, p.285-310.
Jacobson, C.E., 1990, The 40Ar/39Ar geochronology of the Pelona Schist and related
rocks, Southern California: Journal of Geophysical Research, v. 95, p. 509–528. Jacobson, C.E., Oyarzabal, F.R., Haxel, G.B., 1996, Subduction and exhumation of the Pelona–
Orocopia–Rand schists, southern California: Geology, v. 24, p. 547–550. Jones, C.H., Sonder, L.J. and Unruh, J.R., 1998, Lithospheric gravitational potential energy and
past orogenesis: Implications for conditions of initial Basin and Range and Laramide deformation: Geology, v. 26, p.639-642.
Kula, J.L., 2002, Thermochronology and Geobarometry of the Granite Mountains, southeast
California; Exhumation of a Plutonic Complex During Collapse of the Sevier Orogen: MS Thesis, University of Nevada, Las Vegas.
Lease, R.O., McQuarrie, N., Oskin, M., and Leier, A., 2009, Quantifying Dextral Shear on the
Bristol-Granite Mountains Fault Zone: Successful Geologic Prediction from Kinematic Compatibility of the Eastern California Shear Zone: Journal of Geology, v. 117, p 37-53.
Liu, L., S. Spasojevic, and Gurnis, M., 2008, Reconstructing Farallon plate subduction beneath
North American back to the Late Cretaceous: Science, v. 322, p. 934–938. Liu, L., M. Gurnis, M. Seton, J. Saleeby, R. D. Müller, and Jackson, J. M., 2010, The role of
oceanic plateau subduction in the Laramide orogeny: Nature Geoscience, v. 3, p. 353–357. Livaccari, R. F., 1991, Role of crustal thickening and extensional collapse in the tectonic
evolution of the Sevier-Laramide Orogeny, Western United States, Geology, 19, 1104– 1107.
Lovera, O.M., 1992, Computer programs to model 40Ar/39Ar diffusion data from
multidomain samples: Computers & Geosciences,v. 18, p. 789–813.
130
Lovera, O.M., Richter, F.M., and Harrison, T.M., 1991, Diffusion domains determined by
39Ar released during step heating: Journal of Geophysical Research, v. 96, p. 2057–2069.
Lovera, O.M., Grove, M., Harrison, T.M., Mahon, K.I., 1997, Systematic analysis of K-feldspar
40Ar/39Ar step-heating experiments I: significance of activation energy determinations: Geochimica et Cosmochimica Acta, v. 61, p. 3171–3192.
Ludwig, K.R., 2001, User Manual for Isoplot: Berkeley Geochronology Center.
McCaffrey, K.J.W., Miller, C.F., Karlstrom, K.E., Simpson, C., 1999, Synmagmatic deformation
patterns in the Old Woman Mountains, SE California: Journal of Structural Geology, v. 21, p. 335–349.
Miller, C.F., and Bradfish, L.J., 1980, An inner Cordilleran belt of muscovite-bearing plutons:
Geology, v. 8, p. 412–416. Miller, Fred K., and Douglas M. Morton. Potassium-argon geochronology of the eastern
Transverse Ranges and southern Mojave Desert, southern California. No. 1152. 1980. Molnar, P., and Lyon-Caen, H., 1988, Some simple physical aspects of the support, structure and
evolution of mountain belts, in Clark, S.P., Jr., ed., Processes in Continental and Lithospheric Deformation: Geological Society of America Special Paper, v. 218, p. 179– 207.
McDougall, I. and Harrison, T.M., 1999, Geochronology and Thermochronology by the
40Ar/39Ar Method, 2nd edition, Oxford University Press, New York, NY, 269 p. Merrihue, C. and Turner, G., 1966. Potassium-argon dating by activation with fast
neutrons: Journal of Geophysical Research, v. 71(11), p. 2852-2857. Miller, D.M., and Howard, K.A., 1985, Bedrock geologic map of the Iron Mountains
Quadrangle, San Bernardino and Riverside counties, California. US Geological Survey, Report, MF- 1736.
Miller, D.M., Wells, M.L., Dewitt, E., Walker, J.D., and Nakata, J.K., 1996, Late Cretaceous
extensional fault system across the northeastern Mojave Desert: San Bernardino County Museum Association Quarterly: v. 43 (1), p. 77–83.
Passchier, C.W., and Trouw, R.A., 1996, Microtectonics, Springer, Berlin, Germany. 289pp. Patino Douce, A.E., Humphreys, E.D., and Johnston, A.D., 1990, Anatexis and metamorphism in tectonically thickened continental crust exemplified by the Sevier hinterland, western North America: Earth and Planetary Science Letters, v. 97, p. 290– 315.
131
Platt, J.P., 1986, Dynamics of orogenic wegdes and the uplift of high-pressure metamorphic rocks: Geological Society of Americ Bulletin, v. 97(9), p. 1037-1053. Pryer, L.L., 1993, Microstructures in feldspars from a major crustal thrust zone: the Grenville
Front, Ontario, Canada: Journal of Structural Geology, v. 15, p. 21–36. Saleeby, J., 2003, Segmentation of the Laramide Slab–Evidence from the southern Sierra Nevada
region: Geological Society of America Bulletin: v. 115, p. 655–668. Saleeby, J., Farley, K.A., Kistler, R.W., and Fleck, R., 2007, Thermal evolution and exhumation
of deep-level batholithic exposures, southernmost Sierra Nevada, California, in Cloos, M., Carlson, W.D., Gilbert, M.C., Liou, J.G., and Sorensen, S.S., eds., Convergent Margin Terranes and Associated Regions: A Tribute to W.G. Ernst: Geological Society of America Special Paper, v. 419, p. 39–66, doi: 10.1130/2007.2419(02).
Singleton, J.S. and Mosher, S., 2012. Mylonitization in the lower plate of the Buckskin-Rawhide
detachment fault, west-central Arizona: Implications for the geometric evolution of metamorphic core complexes: Journal of Structural Geology, p. 39, pp.180-198.
Snell, K.E., Koch, P.L., Druschke, P., Foreman, B.Z. and Eiler, J.M., 2014. High elevation of the
‘Nevadaplano’during the Late Cretaceous: Earth and Planetary Science Letters, v. 386, p.52-63.
Simpson, C., 1985, Deformation of granitic rocks across the brittle-ductile transition: Journal of
Structural Geology 7, 503-511. Simpson, C. and Wintsch, R.P., 1989, Evidence for deformation-induced K-feldspar replacement
by myrmekite: Journal of Metamorphic Geology 7, 261–275. Smith, A.G., Wells, M.L., and Foster, D.A., 2003, Timing and development of an orogen-
parallel lineation and of frontal thrusting in the southern Cordilleran fold–thrust belt, New York Mountains, California. Geological Society of America Abstracts with Programs.
Sonder, L. J., and Jones, C. H., 1999, Western United States extension: How the west was
widened, Annual Review Earth Planetary Science Letters, v. 27, p. 417–462. Stipp, M., Stünitz, H., Heilbronner, R., and Schmid, S.M., 2002, The eastern Tonale fault zone: A
“natural laboratory” for crystal plastic deformation of quartz over a temperature range from 250 to 700 °C: Journal of Structural Geology, v. 24, p. 1861–1884.
Wells, M.L., Dallmeyer, R.D., and Allmendinger, R.W., 1990, Late Cretaceous extension in the
hinterland of the Sevier thrust belt, northwestern Utah and southern Idaho: Geology, v. 18, p. 929–933.
Wells, M.L., Spell, T. L., and Grove, M., 2002, Late Cretaceous intrusion and extensional
exhumation of the Cadiz Valley Batholith, Iron Mountains, Southeastern California: Geological Society of America Abstracts with Programs. v. 34, No. 6, p.178.
132
Wells, M.L., Beyene, M.A., Spell, T.L., Kula, J.L., Miller, D.M., Zanetti, K.A., 2005, The Pinto zone; a Laramide synconvergent extensional shear zone in the Mojave Desert region of the southwest United States: Journal of Structural Geology, v.27, p. 1697-1720.
Wells, M.L., and Hoisch, T. D., 2008, The role of mantle delamination in widespread
Late Cretaceous extension and magmatism in the Cordilleran orogen, western United States: Geological Society of America Bulletin, v. 120, p. 515-530.
Wells, M.L., and Hoisch, T. D., Cruz-Uribe, A.M., and Vervoort, J.D., 2012, Geodynamics
of synconvergent extension and tectonic mode switching: Constraints from the Sevier- Laramide orogen: Tectonics, v. 31, 20 p.
Yonkee, W.A. and Weil, A.B., 2015. Tectonic evolution of the Sevier and Laramide belts
within the North American Cordillera orogenic system. Earth-Science Reviews, 150, p.531-593.
Young, R.A., and Hartman, J. H., 2014, Paleogene rim gravel of Arizona: Age and
significance of the Music Mountain Formation: Geosphere, v. 10, p. 870-891. Zeitler, P. K., 1993, Inversion of 40Ar/39Ar age spectra using the controlled-random-
search method, Eos Trans. AGU, 74(43), 650.
133
134
VITAE
Personal Strengths: Geologic mapping, structural geology, tectonics and orogenesis, economic geology and hydrothermal systems, 3D modeling.
Education
Master of Science (Geology) University of Nevada, Las Vegas GPA: 3.91 2015-May2017 • Project: Late Cretaceous extensional collapse of the southern Cordillera. Project has strong
emphasis on field mapping, structural analysis, analytical work, and igneous petrology. Advisor: Dr. Michael L. Wells
• Teaching assistant for upper level Field Methods and Advanced Field classes.
Bachelor of Science (Geology) Idaho State University GPA: 3.38 2009-2011 • Senior Project: Detrital zircons from the Maurice Mountain Quartzite and Black Lion
Conglomerate, Pioneer Mountains, SW Montana: The southern edge of the Belt Basin. • Project was presented at the Geological Society of America Conference, Rocky
Mountain/Cordilleran Section, 2011 (as a poster).
Associate of Arts (Liberal Arts) College of Southern Idaho 2006-2009
Work Experience
Project Geologist Silver Standard Resources Inc. May 2017-Present • Structural mapping by hand at designated scale on North American project. Digitizing
maps and data compiling. Core logging. Mapped Palaeoproterozoic shear zone hosted gold deposits in northern Saskatchewan - developed targets for drilling campaign.
Mapping Geologist Silver Standard US Inc. June 2016-August 2016
• Performed detailed structural mapping on the Perdito Project, Inyo Mountains, California. Mapped claim areas at 1:2,500 scale, mapped detailed surface structural geology, as well as oxidation and alteration outcrop maps. Provided digitized maps and thorough documents reporting findings and targets for future drilling campaigns.
Field Geologist Louisiana State University June 2014-August 2014
• Provided geological field assistance for Prof. Barbara Dutrow in the Sawtooth Mountain Metamorphic Complex, Idaho.
• Performed detailed geologic mapping, rock descriptions, and precise sample collection for all metamorphic units.
Geologist Lost River Geologic Services (sole-proprietor) May 2011-April 2014 • Provided detailed geology for Hudson Ranch Power, LLC and EnergySource, LLC. • Mapping borehole cuttings, interpreting and preparing XRD samples, interpreting 3D
reflection seismic, managing geophysical surveys, developing 3D models. Submitted technical
135
reports (see attached citations), and assisted with the targeting and development of numerous production wells in the Salton Sea Geothermal Field, California.
Zircon Separation Lab Manager Idaho State University October 2010–May 2011 • Managed a team of students through the complete process of separating zircons from their
parent rock to analysis at the LA-ICP-MS lab at UA
Field Assistant Idaho State University - Geosciences Summer 2010 • Provided field assistance for ISU graduate student. Mapping metasedimentary rocks,
intermediate and bimodal volcanic rocks and performing structural analysis on the Wildhorse detachment fault.
Weeds Technician Bureau of Land Management, CFO Summers 2006–2009
• Responsible for the identification and management of endemic and invasive species on 800,000 acres, rangeland health monitoring, and ecosystem preservation in riparian areas.
Report and abstract citations
Hess, L.T., and Wells, M.L., 2016, Development and disaggregation of a plutonic complexion SE California: Constrains on Late Cretaceous collapse of the Sevier orogen. Geological Society of America Abstracts, National Conf., Paper No. 55-5.
Hess, L.T., and Wells, M.L., 2016, Late Cretaceous to Neogene Tectonic History of the Bristol and Granite Mountains, Southeast California. Geological Society of America Abstracts, Cordilleran Section, Paper No. 26-5.
Link, P.K., Stewart, E.D., Steel, T., Sherwin, J., Hess, L.T., and McDonald, C., 2016, Detrital zircons in the Mesoproterozoic upper Belt Supergroup in the Pioneer, Beaverhead and Lemhi Ranges, MT and ID: The Big White arc. GSA Special Paper 522 Belt Basin: Window to Mesoproterozoic Earth.
Hess, L.T., 2013a, Hudson Ranch II Well 19-2: Detailed Visual Observations from Drill Cuttings. Internal report prepared for EnergySource, LLC, 18p.
Hess, L.T., 2013b, Hudson Ranch II Well 19-1 Side-Track: Detailed Visual Observations from Drill Cuttings. Internal report prepared for EnergySource, LLC, 16p.
Hess, L.T., Link, P.K., and McDonald, K.M., 2011, Detrital zircons from the Maurice Mountain Quartzite and Black Lion Conglomerate, Pioneer Mountains, SW Montana: The southern edge of the Belt Basin: Geological Society of America Abstracts with Programs, v. 43, no. 4, p. 69.
Hess, L.T., 2012a, Detailed Visual Investigation of Alteration and Flow Zones in Legacy Geothermal Wells Located Near the Hudson Ranch Project Area. Internal report prepared for EnergySource, LLC, 32p.
Hess, L.T., 2012b, Analysis of Reflection Seismic Features. Internal report prepared for EnergySource, LLC, 9p.
Neuhoff, P., and Hess, L.T. 2012. Alteration History of Geothermal Wells in the Vicinity of the Hudson Ranch Project, Imperial County, California. Internal report prepared for EnergySource, LLC, 19p.
Norton, D.L., Sims, D., Neuhoff, P., and Hess, L.T. 2011. Geologic Review of Hudson

136
Ranch Geothermal Wellfield. Internal report prepared for Energy Source, LLC, 59p. Awards
• Awarded NAGT internship opportunity for best field camp student, 2010 • Geological Society of America graduate student research grant, 2016 • Graduate student academic achievement award at UNLV, 2017
Computer skills • Office, Windows, Mac OS, Photoshop, Illustrator • LeapFrog 3D modeling, ArcGIS, Mathematica, Opendtect, Maptek Vulcan, Global Mapper