Embed Size (px)
Citation preview
Late Cenozoic Volcanism in the Hövsgöl Rift Basin: Source, Genesis, and Evolution of Intraplate Volcanism in Mongolia
Honors Thesis
Presented to the College of Agriculture and Life Sciences, Physical Sciences
of Cornell University
in Partial Fulfillment of the Requirements for the
Research Honors Program
by
Andrew V. Zuza
May 2011
Christopher Andronicos
Abstract: Diffuse, intraplate volcanic deposits are prevalent throughout Mongolia. This study sought to examine Late Cenozoic lavas (9.5-17.1 Ma) from the Hövsgöl rift basin in order to better understand their source, genesis, and evolution. The relationship of these volcanic rocks to the Baikal Rift Zone (BRZ) and the extent to which these lavas are involved in, or derived from, rifting has important implications for lithospheric development of Mongolia and Central Asia. The alkaline basalts have similar light rare earth element enrichments (La/Yb = 9.1-31.9) and 87Sr/86Sr ratios in the range of .7039 to .7050. Major and trace element and isotopic data reveal that low degrees of partial melting of garnet lherzolite occurred at depths greater than 65 km. Enrichment in fluid-mobile elements (e.g. Sr and Ba), lower La/Nb ratios, and a calc-alkaline trend suggest that hydrous minerals may have contributed to the melt. Nb enrichment (>35 ppm), along with the melting of hydrous minerals, may be attributed to the melting of a metasomatically enriched lithospheric mantle source. The mixing of minor asthenospheric upwelling with a volatile-rich, metasomatized lithospheric mantle may have produced melts without requiring extremely elevated temperatures, consistent with other published studies that show a small, shallow thermal anomaly under Mongolia.
Zuza
1
INTRODUCTION
Late Cenozoic intraplate volcanism is prevalent throughout Mongolia and Central Asia
(Fig. 1). Though relatively widespread, volcanic fields are small in volume. The general
proximity of these lavas to the Baikal rift zone (BRZ) has led many researchers to regard these as
rift-related volcanic rocks, which leads to an important question: what is the relationship between
the volcanic rocks and rifting? This question has important implications for the nature of the
BRZ itself. Is it an active rift, initiated and driven by forces related to mantle convection (see
Logatchev and Zorin, 1992; Gao et al., 1994; Zorin et al., 2006), a passive rift, with tectonic
extension occurring because of far-field forces from the India/Eurasia collision (see Zonenshain
and Savostin, 1981; Petit et al., 1997; Nielsen and Thybo, 2009), or some combination of the two
(see Petit et al., 1996; Delvaux et al., 1997; Zorin et al., 2003)? A key test to these various
hypotheses is the geochemical signatures of the volcanic rocks.
Lake Hövsgöl (referred to as Khubsugul in some literature), which sits in a north-south
trending rift basin on the southwestern leg of the BRZ, has numerous exposures of volcanic
rocks. This region is a great laboratory for examining the different hypotheses because it is the
youngest and most recently active rift basin in the BRZ (Devyatkin and Smelov, 1980). Initial
volcanism in the Hövsgöl area (21.4 Ma to 6.17 Ma: Rasskazov et al., 2000) predates extension
and crustal rifting (~ 5 Ma: Fedotov et al., 2003) by more than 15 Myr. This fact may argue
against active rifting, but further study is necessary.
Regardless of the origins of volcanism and rifting, this study aims to examine the
geochemical characteristics of these volcanic rocks to better understand their source, genesis, and
evolution. The relationship of these volcanic rocks to rifting and the extent to which these lavas
are invol
of Mongo
Figure 1. TBusingol, DComplied
GEOL
T
(Zorin, 2
(Fig. 1).
boundari
ved in, or de
olia and Cen
Tectonic map oD—Darhat, H—and modified f
LOGIC B
The Baikal ri
003). This r
The rift is sp
ies, only cutt
erived from,
ntral Asia.
of the Baikal R—Hövsgöl, UAfrom Zorin et a
BACKGR
ft zone stretc
rift sequence
patially contr
ting through
rifting has i
Rift Zone in SoA—Upper Angal. (2003) and I
ROUND
ches over 1,
e extends ov
rolled by the
older basem
2
important im
utheastern Sibgara, Ba—BargIonov (2002).
500 km as a
er the southe
e location of
ment structur
mplications fo
eria and Northguzin, UM—U
a series of La
eastern porti
f lithospheric
res in the mo
for lithospher
hern Mongolia.Upper Muya, an
ate Cenzoic h
ion of the Si
c plate and m
ost northeast
ric developm
Rift basins: Bnd Ts—Tsypa.
half-grabens
iberian crato
microplate
tern section
Zuza
ment
B—
s
on
Zuza
3
(Mats, 1992). The rift half-grabens of the BRZ are asymmetric, with master faults forming on
the Siberian craton side of the rift at all localities except for two rift-basins in the northeast (Fig.
1). The earliest rift volcanism in the BRZ occurred in the Late Cretaceous-Paleogene (80-35 Ma:
Rassakov, 1994), preceding the onset of extension and the subsequent formation of rift basins in
the Oligocene (30-35 Ma: Logatchev, 1993). Volcanism was most active in the Middle-Late
Miocene and in the Pliocene-Quaternary (Rassakov, 1994).
Many rift basins have formed along the length of the BRZ, including the Hövsgöl,
Darhat, Baikal, and Barguzin basins. The Hövsgöl rift is believed to be the youngest of three
parallel, N-S orientated grabens on the southwestern fringe of the BRZ (Devyatkin, 1980).
Extension within the Hövsgöl rift started later than that of the main Baikal Rift, beginning ~ 5
Ma (Fedotov et al., 2003).
The Hövsgöl rift basin is located at the suture between the Tuva-Mongolian massif and
several Paleozoic terranes (Rasskazov et al., 2000a). The Tuva-Mongolian massif is a complex
of Neoproterozoic terranes. Two of these terranes are formally recognized: a continental block
and an island arc, known as the Gargan microcontinent and the Dunzhugur island arc
respectively (Kuzmichev et al., 2001). These terranes were incorporated onto the Siberian craton
via large-scale thrusts in the Late Ordovician-Silurian as part of the Sayan-Baikal orogenic belt.
Three Paleozoic metamorphic terranes, which were amalgamated onto the Sayan-Baikal
orogenic belt, are exposed on the eastern edge of the Hövsgöl rift basin. The Tunka and
Khamar-Daban terranes are believed to be metamorphosed back-arc basins (Shkol’nik, 2008),
whereas the Dzhida terrane is a metamorphosed island-arc (Al’mukhamedov et al., 1996).
Zuza
4
From the Late Permian to the Late Jurassic the continental margin consisted of the
Mongol-Okhotsk Ocean (Kravchinsky et al., 2002). A subduction zone and a Late Paleozoic arc
formed, intruding granitic magma into the overlying Gargan microcontinent (Zorin et al., 1995).
The Mongol-Okhotsk Ocean began to close in the Late Jurassic (Kravchinsky et al., 2002),
eventually forming the southwest-northeast trending Mongol-Okhotsk suture (Fig. 1; see
synthesis by Yin, 2010). Units of both the Gargan microcontinent and Late Paleozoic granitoids
crop out on the northwestern side of Lake Hövsgöl, whereas rocks of the Paleozoic metamorphic
terranes are found to the northeast of the lake (Fig. 2).
The Late Cenozoic basalts that are the focus of this study lie unconformably on top of
these basement rocks. Volcanic deposits in the Hövsgöl area (21.4 Ma to 6.17 Ma: Rasskazov et
al., 2000) are faulted by extensional and crustal rifting processes during the Late-Miocene (<5
Ma: Fedotov et al., 2003). Quaternary fluvial, lacustrine, and glacial sedimentary deposits cover
much of the area around Lake Hövsgöl.
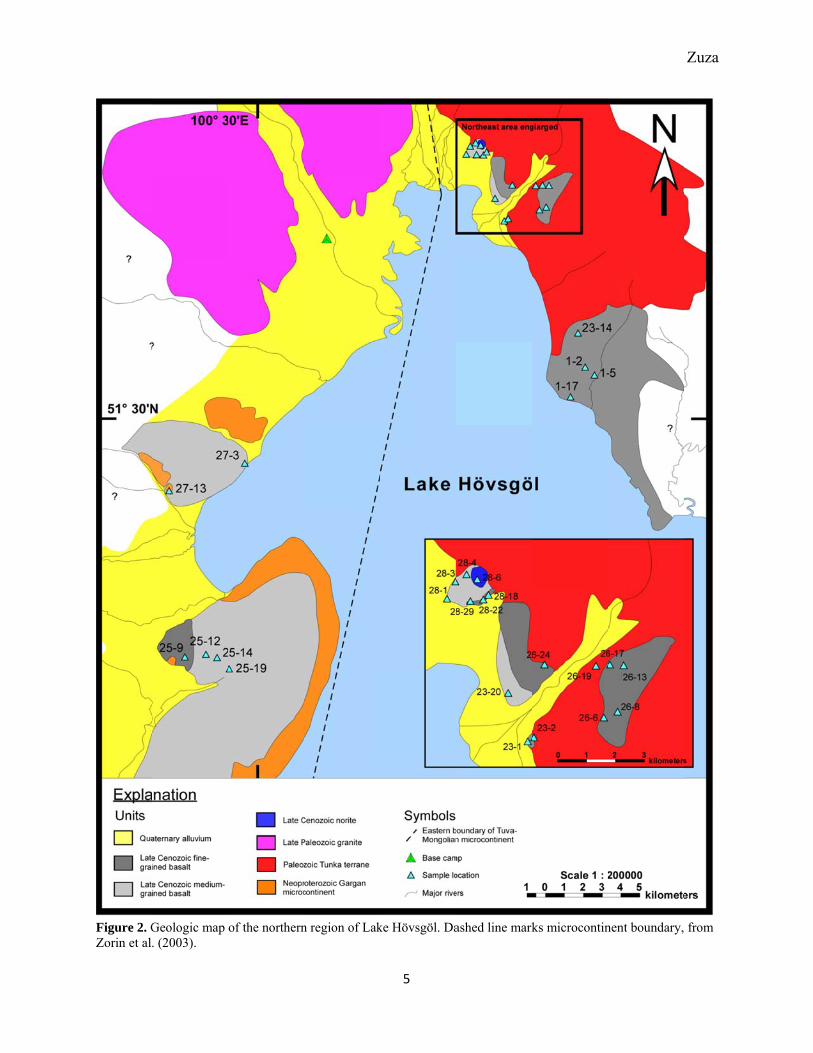
Figure 2. GZorin et al
Geologic map . (2003).
of the northernn region of Lak
5
ke Hövsgöl. Daashed line markks microcontinnent boundary,
Zuza
from
Zuza
6
METHODS
A month of field work was conducted during the summer of 2010. The ~400 km2 field
area was mapped at a scale of 1:200,000. Twenty-eight basalt samples were collected and were
made into singly polished thin sections by Texas Petrographic Services Inc. Twenty-four bulk-
rock samples were crushed and powdered for geochemical work. Major and minor element
analysis was conducted at the Cornell Center for Materials Research on 20 of the samples using a
JEOL-8900 microprobe on glasses made from fused whole-rock powders. Instrumental neutron
activation analysis (INAA) was utilized to examine the trace elements of 16 representative
samples. Bulk rock powder (~.5 g) was sealed in silica glass ampoules. Samples were irradiated
by the Nuclear Reactor Program at North Carolina State University and later analyzed in an
ORTEC GEM-20170-S solid-state γ-ray spectrometer at Cornell University. Sr isotope ratios
were analyzed for 12 samples using a FISONS VG Sector 54 Thermal Ionization Mass
Spectrometer (TIMS) at Cornell University’s W. M. Keck Foundation Isotope Laboratory. Data
are reported in Table 1 (standard analysis are given in Table A1 and A2).
Zuza
7
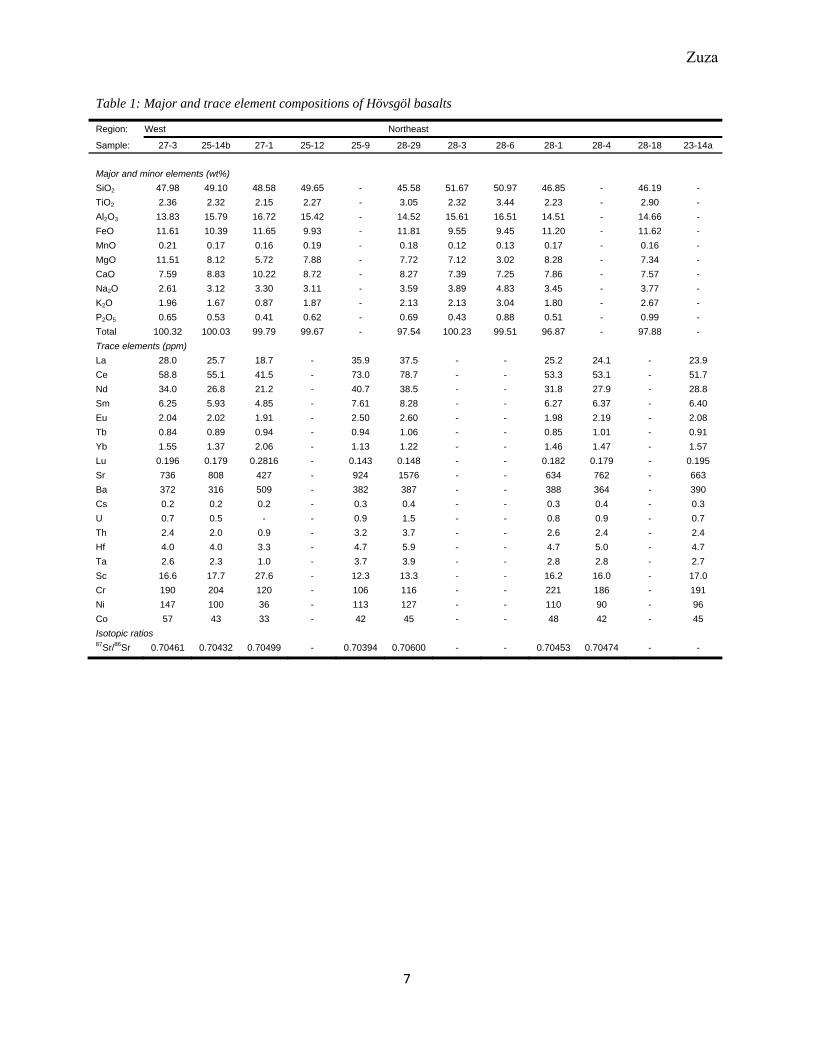
Table 1: Major and trace element compositions of Hövsgöl basalts
Region: West Northeast
Sample: 27-3 25-14b 27-1 25-12 25-9 28-29 28-3 28-6 28-1 28-4 28-18 23-14a
Major and minor elements (wt%)
SiO2 47.98 49.10 48.58 49.65 - 45.58 51.67 50.97 46.85 - 46.19 -
TiO2 2.36 2.32 2.15 2.27 - 3.05 2.32 3.44 2.23 - 2.90 -
Al2O3 13.83 15.79 16.72 15.42 - 14.52 15.61 16.51 14.51 - 14.66 -
FeO 11.61 10.39 11.65 9.93 - 11.81 9.55 9.45 11.20 - 11.62 -
MnO 0.21 0.17 0.16 0.19 - 0.18 0.12 0.13 0.17 - 0.16 -
MgO 11.51 8.12 5.72 7.88 - 7.72 7.12 3.02 8.28 - 7.34 -
CaO 7.59 8.83 10.22 8.72 - 8.27 7.39 7.25 7.86 - 7.57 -
Na2O 2.61 3.12 3.30 3.11 - 3.59 3.89 4.83 3.45 - 3.77 -
K2O 1.96 1.67 0.87 1.87 - 2.13 2.13 3.04 1.80 - 2.67 -
P2O5 0.65 0.53 0.41 0.62 - 0.69 0.43 0.88 0.51 - 0.99 -
Total 100.32 100.03 99.79 99.67 - 97.54 100.23 99.51 96.87 - 97.88 -
Trace elements (ppm)
La 28.0 25.7 18.7 - 35.9 37.5 - - 25.2 24.1 - 23.9
Ce 58.8 55.1 41.5 - 73.0 78.7 - - 53.3 53.1 - 51.7
Nd 34.0 26.8 21.2 - 40.7 38.5 - - 31.8 27.9 - 28.8
Sm 6.25 5.93 4.85 - 7.61 8.28 - - 6.27 6.37 - 6.40
Eu 2.04 2.02 1.91 - 2.50 2.60 - - 1.98 2.19 - 2.08
Tb 0.84 0.89 0.94 - 0.94 1.06 - - 0.85 1.01 - 0.91
Yb 1.55 1.37 2.06 - 1.13 1.22 - - 1.46 1.47 - 1.57
Lu 0.196 0.179 0.2816 - 0.143 0.148 - - 0.182 0.179 - 0.195
Sr 736 808 427 - 924 1576 - - 634 762 - 663
Ba 372 316 509 - 382 387 - - 388 364 - 390
Cs 0.2 0.2 0.2 - 0.3 0.4 - - 0.3 0.4 - 0.3
U 0.7 0.5 - - 0.9 1.5 - - 0.8 0.9 - 0.7
Th 2.4 2.0 0.9 - 3.2 3.7 - - 2.6 2.4 - 2.4
Hf 4.0 4.0 3.3 - 4.7 5.9 - - 4.7 5.0 - 4.7
Ta 2.6 2.3 1.0 - 3.7 3.9 - - 2.8 2.8 - 2.7
Sc 16.6 17.7 27.6 - 12.3 13.3 - - 16.2 16.0 - 17.0
Cr 190 204 120 - 106 116 - - 221 186 - 191
Ni 147 100 36 - 113 127 - - 110 90 - 96
Co 57 43 33 - 42 45 - - 48 42 - 45
Isotopic ratios 87Sr/86Sr 0.70461 0.70432 0.70499 - 0.70394 0.70600 - - 0.70453 0.70474 - -
Zuza
8
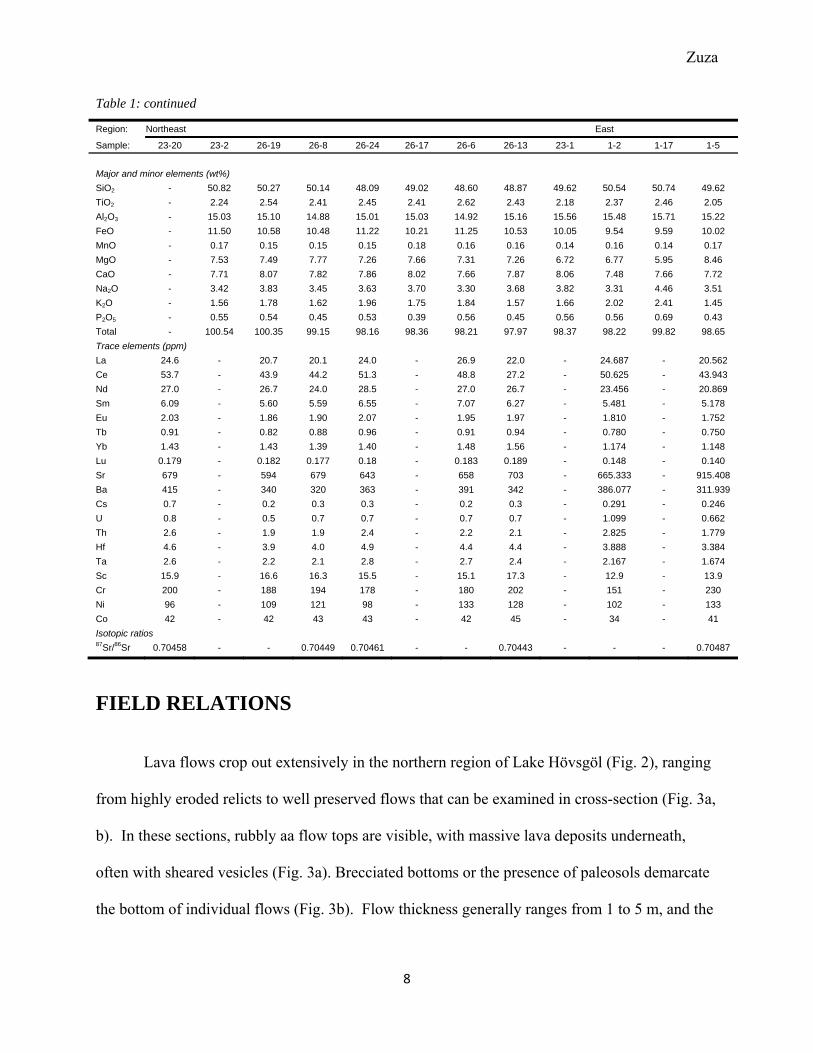
Table 1: continued
Region: Northeast East
Sample: 23-20 23-2 26-19 26-8 26-24 26-17 26-6 26-13 23-1 1-2 1-17 1-5
Major and minor elements (wt%)
SiO2 - 50.82 50.27 50.14 48.09 49.02 48.60 48.87 49.62 50.54 50.74 49.62
TiO2 - 2.24 2.54 2.41 2.45 2.41 2.62 2.43 2.18 2.37 2.46 2.05
Al2O3 - 15.03 15.10 14.88 15.01 15.03 14.92 15.16 15.56 15.48 15.71 15.22
FeO - 11.50 10.58 10.48 11.22 10.21 11.25 10.53 10.05 9.54 9.59 10.02
MnO - 0.17 0.15 0.15 0.15 0.18 0.16 0.16 0.14 0.16 0.14 0.17
MgO - 7.53 7.49 7.77 7.26 7.66 7.31 7.26 6.72 6.77 5.95 8.46
CaO - 7.71 8.07 7.82 7.86 8.02 7.66 7.87 8.06 7.48 7.66 7.72
Na2O - 3.42 3.83 3.45 3.63 3.70 3.30 3.68 3.82 3.31 4.46 3.51
K2O - 1.56 1.78 1.62 1.96 1.75 1.84 1.57 1.66 2.02 2.41 1.45
P2O5 - 0.55 0.54 0.45 0.53 0.39 0.56 0.45 0.56 0.56 0.69 0.43
Total - 100.54 100.35 99.15 98.16 98.36 98.21 97.97 98.37 98.22 99.82 98.65
Trace elements (ppm)
La 24.6 - 20.7 20.1 24.0 - 26.9 22.0 - 24.687 - 20.562
Ce 53.7 - 43.9 44.2 51.3 - 48.8 27.2 - 50.625 - 43.943
Nd 27.0 - 26.7 24.0 28.5 - 27.0 26.7 - 23.456 - 20.869
Sm 6.09 - 5.60 5.59 6.55 - 7.07 6.27 - 5.481 - 5.178
Eu 2.03 - 1.86 1.90 2.07 - 1.95 1.97 - 1.810 - 1.752
Tb 0.91 - 0.82 0.88 0.96 - 0.91 0.94 - 0.780 - 0.750
Yb 1.43 - 1.43 1.39 1.40 - 1.48 1.56 - 1.174 - 1.148
Lu 0.179 - 0.182 0.177 0.18 - 0.183 0.189 - 0.148 - 0.140
Sr 679 - 594 679 643 - 658 703 - 665.333 - 915.408
Ba 415 - 340 320 363 - 391 342 - 386.077 - 311.939
Cs 0.7 - 0.2 0.3 0.3 - 0.2 0.3 - 0.291 - 0.246
U 0.8 - 0.5 0.7 0.7 - 0.7 0.7 - 1.099 - 0.662
Th 2.6 - 1.9 1.9 2.4 - 2.2 2.1 - 2.825 - 1.779
Hf 4.6 - 3.9 4.0 4.9 - 4.4 4.4 - 3.888 - 3.384
Ta 2.6 - 2.2 2.1 2.8 - 2.7 2.4 - 2.167 - 1.674
Sc 15.9 - 16.6 16.3 15.5 - 15.1 17.3 - 12.9 - 13.9
Cr 200 - 188 194 178 - 180 202 - 151 - 230
Ni 96 - 109 121 98 - 133 128 - 102 - 133
Co 42 - 42 43 43 - 42 45 - 34 - 41
Isotopic ratios 87Sr/86Sr 0.70458 - - 0.70449 0.70461 - - 0.70443 - - - 0.70487
FIELD RELATIONS
Lava flows crop out extensively in the northern region of Lake Hövsgöl (Fig. 2), ranging
from highly eroded relicts to well preserved flows that can be examined in cross-section (Fig. 3a,
b). In these sections, rubbly aa flow tops are visible, with massive lava deposits underneath,
often with sheared vesicles (Fig. 3a). Brecciated bottoms or the presence of paleosols demarcate
the bottom of individual flows (Fig. 3b). Flow thickness generally ranges from 1 to 5 m, and the
Zuza
9
largest vertical section had at least 6 stacked basalt flows. Basement rock structures and fabrics
generally trend NNE-SSW, perpendicular to regional extension.
Samples are grouped into three spatial regions—west, northeast, and east—for analysis
and discussion. The flows were also compared with similar volcanic deposits 10 km east of the
lake (i.e. Heven Plateau: Perepelov et al., 2010).
Dating of the flows by Rasskazov et al. (2000) show that the west and north east flows
are 9.5 + .3 Ma (K-Ar) and 10.2 + .5 Ma (K-Ar), respectively. The eastern flows are 16.44 + .08
Ma (40Ar/39Ar: Rasskazov et al., 2000) and the Heven Plateau flows are 17.1 + .4 Ma (40Ar/39Ar:
Perepelov et al., 2010).
PETROGRAPHY
The samples are silica undersaturated, alkali basalts. Olivine phenocrysts are abundant in
all but one sample. Olivine composition is generally 85-90% forsterite (+ optic sign and 2V ≈
90⁰). Olivine often exhibits normal zoning (i.e Mg-rich cores with more Fe-rich rims).
Clinopyroxene and plagioclase are also sometimes zoned. Minor alteration is present in many of
the samples, with small amounts of olivine weathering to iddingsite (Fig. 3d). Some olivine is
also rimmed by pyroxene. Generally, textural growth patterns reveal expected mineralization
sequences, with olivine and calcium-rich plagioclase crystalizing before the pyroxenes and less
calcic plagioclase.
Northeast flows
Samples from the northeast have the most diverse range of textures. A portion of these
samples represent an extrusive lava flow. They are finer-grained and porphorytic, dominated by
euhedral olivine phenocrysts. These samples have an aphanitic ground mass populated by
Zuza
10
plagioclase microlites, which sometimes have a preferred orientation, presumably controlled by
flow direction. Some samples have larger plagioclase phenocrysts, indicating slower cooling
rates or plagioclase fractionation in the magma chamber. Some clinopyroxene (modal 5-15%)
and orthopyroxene (modal 5-10%) phenocrysts exist.
Other samples have undergone slower cooling, and are medium-grained, with a
phaneritic texture. They are made up of predominately euhedral to subhedral olivine,
plagioclase, and clinopyroxene, with lesser amounts of orthopyroxene. Plagioclase often
exhibits trachytic textures (Fig. 3e). Textural growth patterns reveal that Ca-rich plagioclase
crystallized first (Fig. 3f), followed by olivine and intermediate plagioclase, and then
clinopyroxene (Fig. 3g).
The last volcanic lithology identified in the region is phaneritic large grained (>5 mm)
norite. This lithology has a relatively sharp contact with the medium-grained deposits that were
discussed above (Fig. 3c). There is no olivine present in these samples, with the rock composed
of clinopyroxene, orthopyroxene, and plagioclase feldspar. There are also long (~5mm),
preferentially oriented ilmenite crystals. The plagioclase feldspar is the intermediate to calcic
labradorite (%An ~55%). The labrodorite commonly grows around the clino- and
orthopyroxenes, although some synchronous growth is evident.
These three lithologies are likely part of the same flow (Fig. 2), with the fine grained
rocks representing the chilled margin.
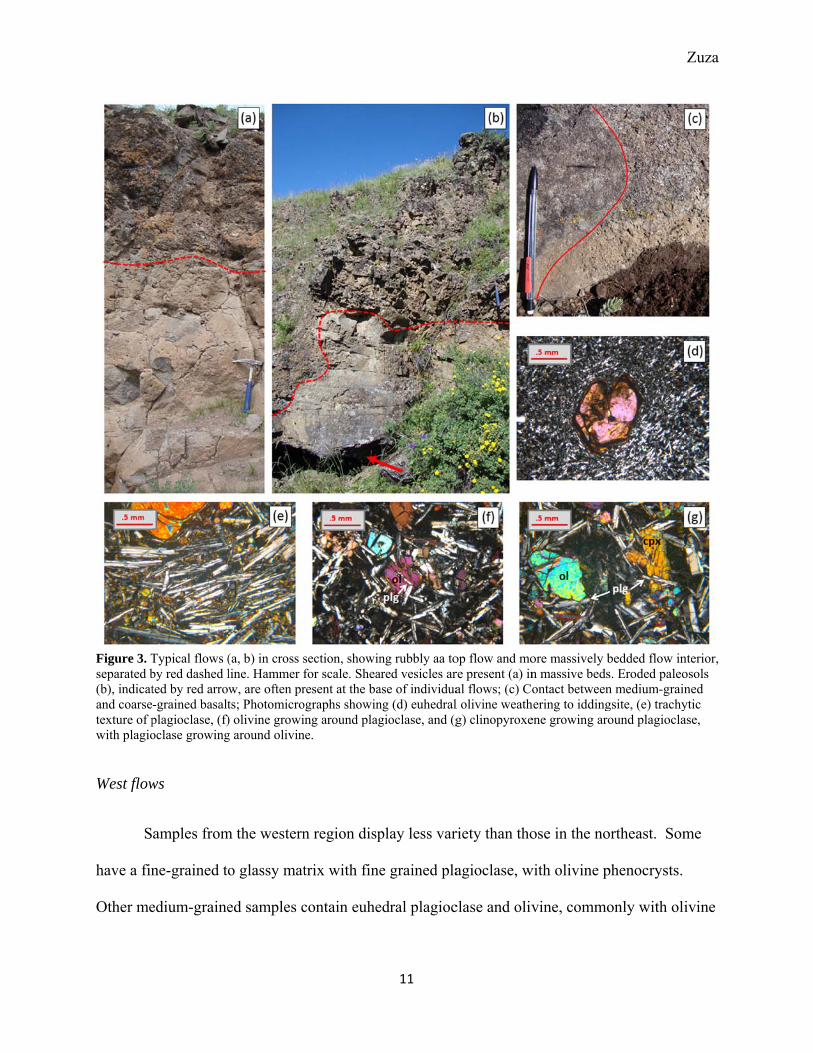
Figure 3. Tseparated b(b), indicatand coarsetexture of pwith plagio
West flow
S
have a fin
Other me
Typical flows (by red dashed lted by red arro-grained basaltplagioclase, (f)oclase growing
ws
amples from
ne-grained to
edium-graine
(a, b) in cross sline. Hammer fw, are often prts; Photomicro) olivine growig around olivin
m the western
o glassy mat
ed samples c
section, showinfor scale. Shearesent at the baographs showining around plagne.
n region disp
trix with fine
contain euhe
11
ng rubbly aa toared vesicles arase of individuang (d) euhedralgioclase, and (g
play less var
e grained pla
edral plagioc
op flow and more present (a) inal flows; (c) Col olivine weathg) clinopyroxe
riety than tho
agioclase, w
clase and oliv
ore massively bn massive bedsontact between
hering to iddingene growing aro
ose in the no
with olivine p
vine, commo
bedded flow ins. Eroded paleon medium-graingsite, (e) trachyound plagiocla
ortheast. Som
phenocrysts.
only with oli
Zuza
nterior, osols ned ytic ase,
me
ivine
Zuza
12
growing around plagioclase (Fig. 3f). Subhedral to anhedral clinopyroxene and orthopyrxene are
also present, but are modally less abundant.
East flows
These flows are glassier, with more groundmass by volume. Overall, these flows appear
different from the other two regions, dominated almost solely by olivine euhedral to subhedral
phenocrysts. Rare clinopyroxene phenocrysts exist.
GEOCHEMISTRY
Major and minor elements
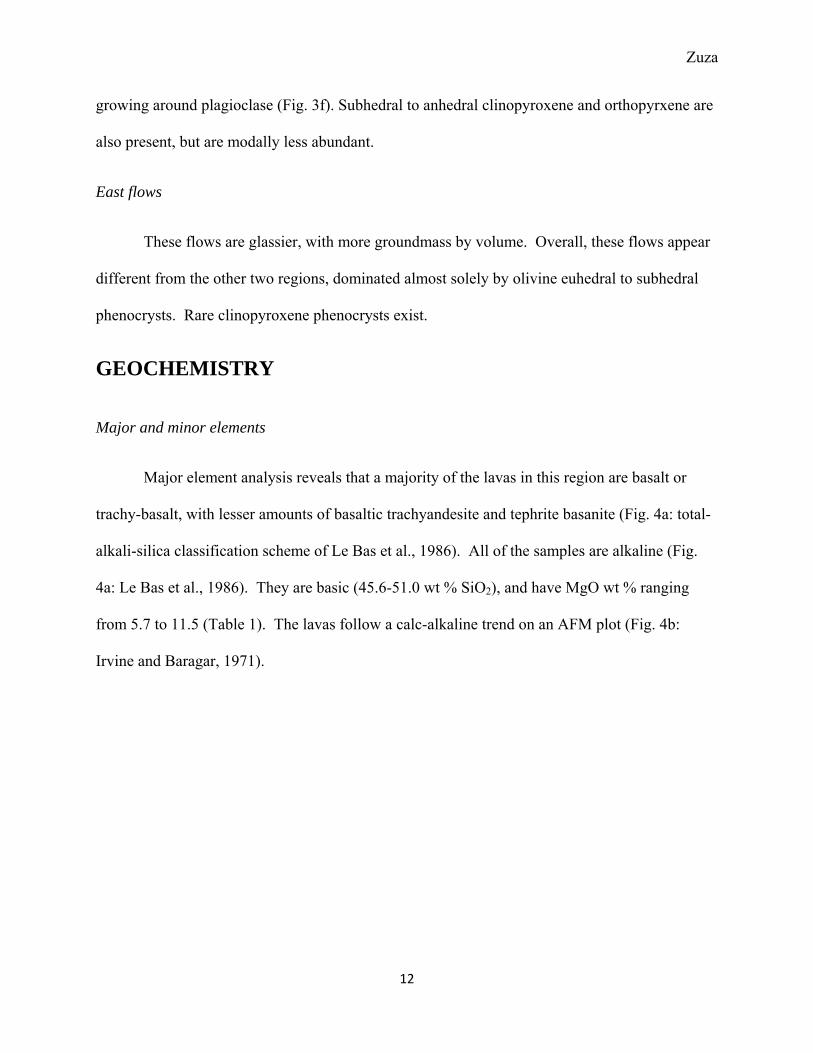
Major element analysis reveals that a majority of the lavas in this region are basalt or
trachy-basalt, with lesser amounts of basaltic trachyandesite and tephrite basanite (Fig. 4a: total-
alkali-silica classification scheme of Le Bas et al., 1986). All of the samples are alkaline (Fig.
4a: Le Bas et al., 1986). They are basic (45.6-51.0 wt % SiO2), and have MgO wt % ranging
from 5.7 to 11.5 (Table 1). The lavas follow a calc-alkaline trend on an AFM plot (Fig. 4b:
Irvine and Baragar, 1971).
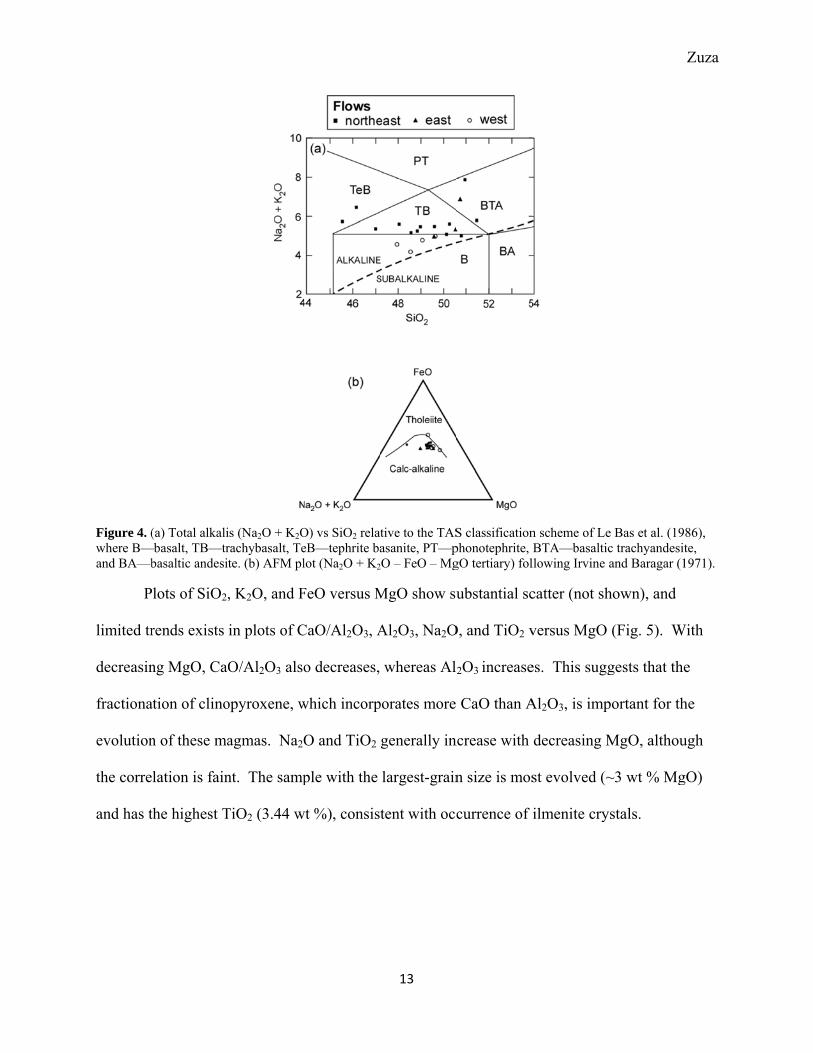
Figure 4. (where B—and BA—b
P
limited tr
decreasin
fractiona
evolution
the corre
and has t
(a) Total alkali—basalt, TB—tr
basaltic andesi
lots of SiO2,
rends exists
ng MgO, CaO
ation of clino
n of these ma
lation is fain
the highest T
is (Na2O + K2Orachybasalt, Tete. (b) AFM pl
, K2O, and F
in plots of C
O/Al2O3 also
opyroxene, w
agmas. Na2O
nt. The samp
TiO2 (3.44 w
O) vs SiO2 relaeB—tephrite balot (Na2O + K2
FeO versus M
CaO/Al2O3, A
o decreases,
which incorp
O and TiO2
ple with the
wt %), consis
13
tive to the TASasanite, PT—p
2O – FeO – Mg
MgO show su
Al2O3, Na2O
whereas Al
porates more
generally in
largest-grain
tent with occ
S classificationphonotephrite, gO tertiary) fol
ubstantial sc
O, and TiO2 v
l2O3 increase
CaO than A
ncrease with
n size is mos
currence of
n scheme of LeBTA—basaltic
llowing Irvine
catter (not sh
versus MgO
es. This sugg
Al2O3, is imp
decreasing M
st evolved (~
ilmenite cry
e Bas et al. (19c trachyandesitand Baragar (1
hown), and
(Fig. 5). W
gests that the
portant for th
MgO, althou
~3 wt % Mg
ystals.
Zuza
86), te, 1971).
With
e
he
ugh
gO)
Figure 5. V
Trace ele
T
primitive
trace elem
earth elem
ocean isl
decreasin
importan
elements
Variation diagr
ements
These lavas, a
e mantle-nor
ments. The
ments (LRE
and basalts (
ng MgO (Fig
nt in differen
, with Ni an
rams of MgO v
as well as th
rmalized trac
lavas have s
E) relative to
(OIB). Com
g. 5), sugges
ntiating these
d Co having
vs CaO/Al2O3,
hose at Heven
ce element p
steep rare ear
o heavy rare
mpatible elem
sting that the
e magmas. C
g only faint tr
14
Al2O3, Na2O,
n Plateau (P
atterns (Fig.
rth element (
e earth eleme
ments (e.g. C
e fractionatio
Cr vs. MgO h
rends.
TiO2, Cr, Ni, a
erepelov et a
. 6), and are
(REE) patter
ents (HREE)
Cr, Ni, and C
on of olivine
has the stron
and Co.
al., 2010), h
enriched in
rns, are enric
), and are ge
Co) generally
e and clinopy
ngest trend o
ave similar
incompatibl
ched in light
enerally simi
y decrease w
yroxene is
of the trace
Zuza
le
t rare
lar to
with
Zuza
15
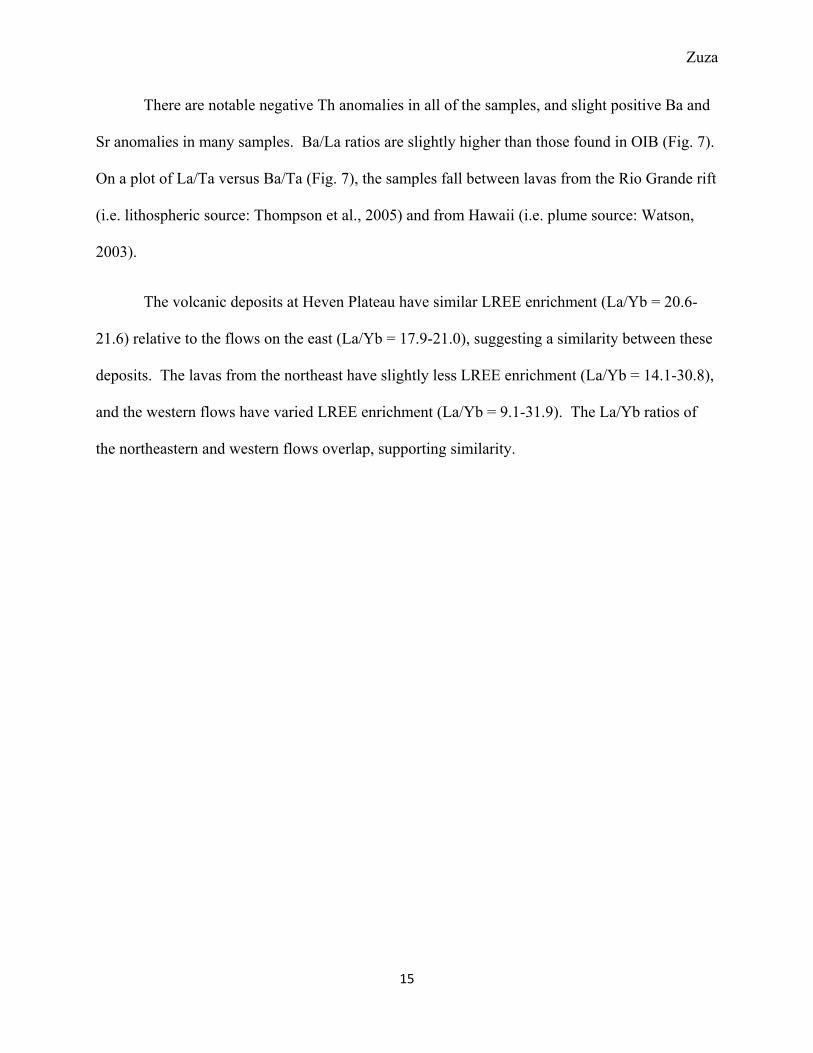
There are notable negative Th anomalies in all of the samples, and slight positive Ba and
Sr anomalies in many samples. Ba/La ratios are slightly higher than those found in OIB (Fig. 7).
On a plot of La/Ta versus Ba/Ta (Fig. 7), the samples fall between lavas from the Rio Grande rift
(i.e. lithospheric source: Thompson et al., 2005) and from Hawaii (i.e. plume source: Watson,
2003).
The volcanic deposits at Heven Plateau have similar LREE enrichment (La/Yb = 20.6-
21.6) relative to the flows on the east (La/Yb = 17.9-21.0), suggesting a similarity between these
deposits. The lavas from the northeast have slightly less LREE enrichment (La/Yb = 14.1-30.8),
and the western flows have varied LREE enrichment (La/Yb = 9.1-31.9). The La/Yb ratios of
the northeastern and western flows overlap, supporting similarity.
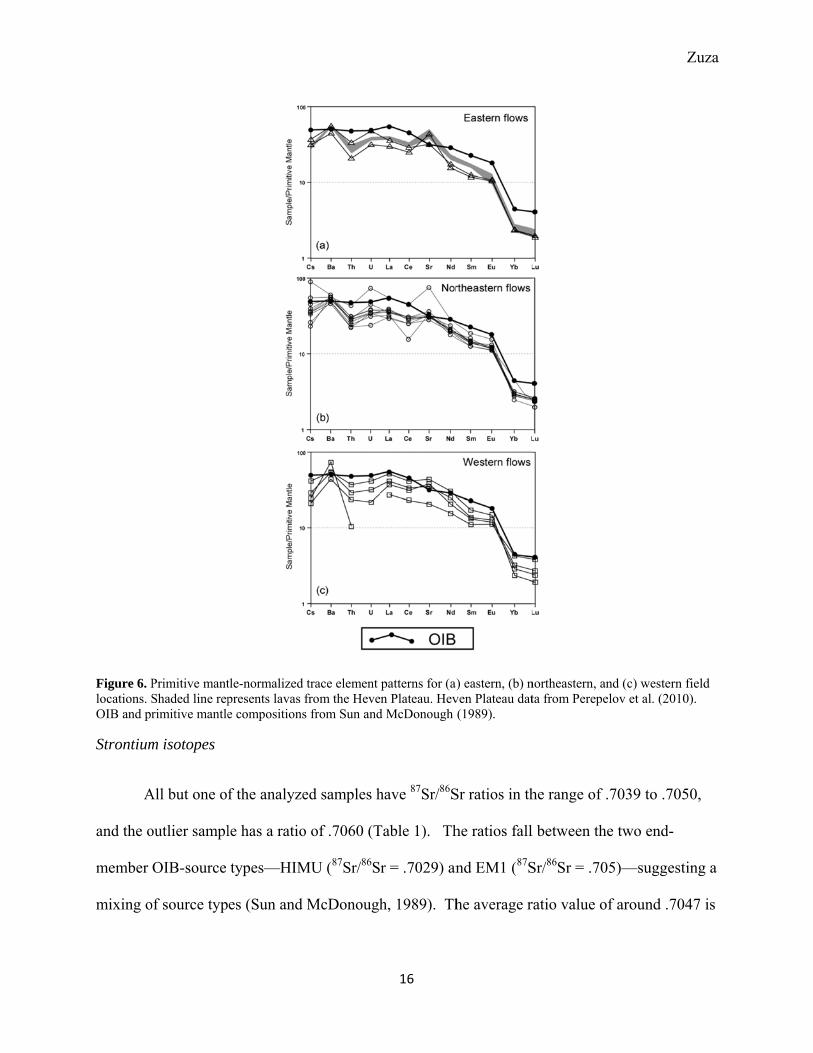
Figure 6. Plocations. SOIB and pr
Strontium
A
and the o
member
mixing o
Primitive mantShaded line reprimitive mantle
m isotopes
All but one of
outlier sampl
OIB-source
of source typ
tle-normalized presents lavas e compositions
f the analyze
le has a ratio
types—HIM
es (Sun and
trace element from the Heves from Sun and
ed samples h
o of .7060 (T
MU (87Sr/86S
McDonough
16
patterns for (a)en Plateau. Hevd McDonough
have 87Sr/86S
Table 1). Th
r = .7029) an
h, 1989). Th
) eastern, (b) nven Plateau dat(1989).
Sr ratios in th
he ratios fall
nd EM1 (87S
he average r
northeastern, anta from Perepe
he range of .
l between the
Sr/86Sr = .70
ratio value of
nd (c) western lov et al. (2010
7039 to .705
e two end-
5)—suggest
f around .70
Zuza
field 0).
50,
ting a
47 is
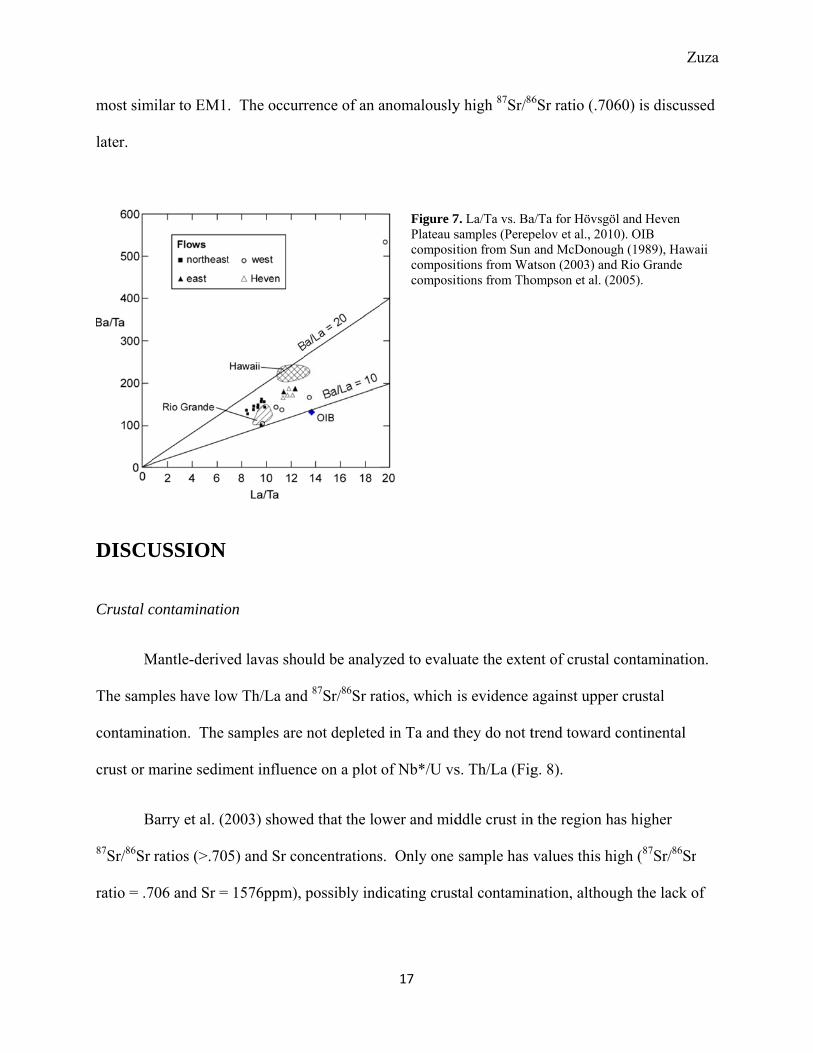
most sim
later.
DISCU
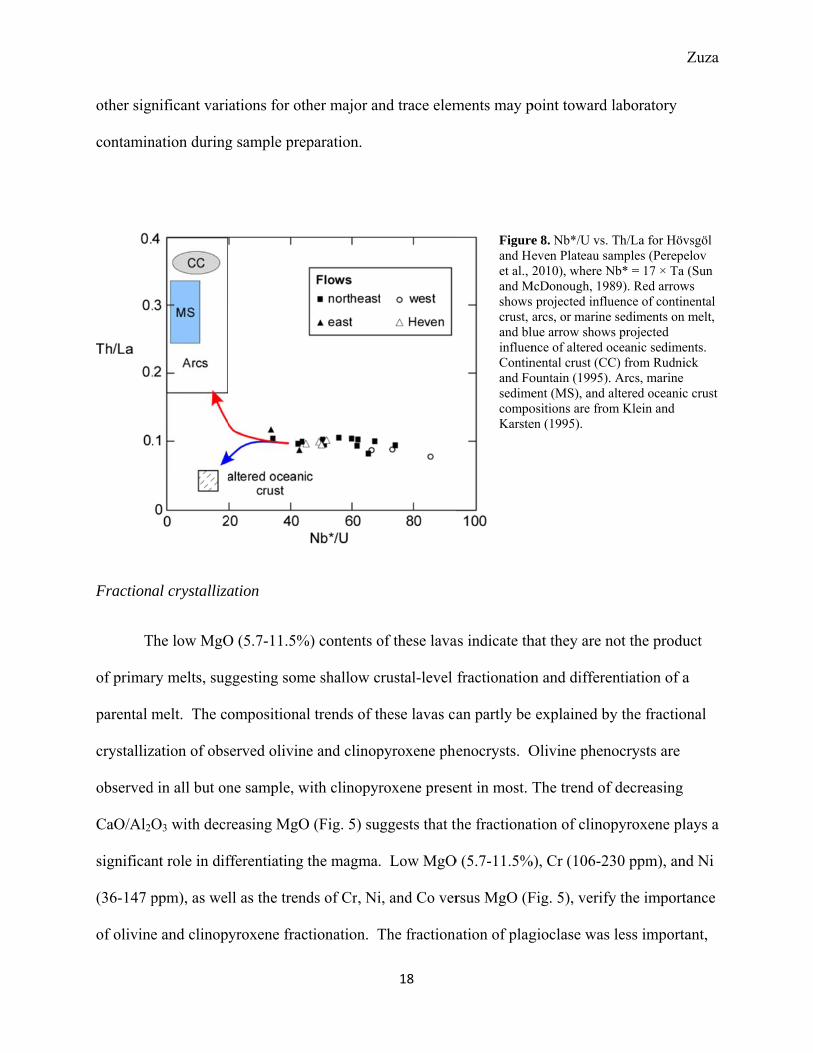
Crustal c
M
The samp
contamin
crust or m
B
87Sr/86Sr
ratio = .7
milar to EM1
USSION
contaminatio
Mantle-derive
ples have low
nation. The
marine sedim
Barry et al. (2
ratios (>.70
706 and Sr =
. The occurr
on
ed lavas sho
w Th/La and
samples are
ment influenc
2003) showe
5) and Sr co
1576ppm),
rence of an a
uld be analy
d 87Sr/86Sr ra
not depleted
ce on a plot
ed that the lo
oncentrations
possibly ind
17
anomalously
Figure 7Plateau scompositcompositcomposit
yzed to evalu
atios, which
d in Ta and t
of Nb*/U vs
ower and mid
s. Only one
dicating crus
y high 87Sr/86
7. La/Ta vs. Basamples (Pereption from Sun tions from Wations from Tho
uate the exte
is evidence
they do not t
s. Th/La (Fig
ddle crust in
sample has
stal contamin
6Sr ratio (.70
a/Ta for Hövsgpelov et al., 20and McDonou
atson (2003) anompson et al. (
ent of crustal
against uppe
trend toward
g. 8).
n the region h
values this h
nation, altho
060) is discu
göl and Heven 10). OIB ugh (1989), Hand Rio Grande (2005).
l contaminat
er crustal
d continental
has higher
high (87Sr/86S
ugh the lack
Zuza
ussed
awaii
tion.
l
Sr
k of
other sign
contamin
Fraction
T
of primar
parental m
crystalliz
observed
CaO/Al2O
significan
(36-147 p
of olivine
nificant vari
nation during
al crystalliza
The low MgO
ry melts, sug
melt. The co
zation of obs
d in all but on
O3 with decr
nt role in dif
ppm), as we
e and clinop
iations for ot
g sample pre
ation
O (5.7-11.5%
ggesting som
ompositiona
served olivin
ne sample, w
reasing MgO
fferentiating
ll as the tren
yroxene frac
ther major an
eparation.
%) contents o
me shallow c
al trends of th
ne and clinop
with clinopyr
O (Fig. 5) sug
the magma.
nds of Cr, Ni
ctionation. T
18
nd trace elem
of these lava
rustal-level
hese lavas ca
pyroxene phe
roxene prese
ggests that th
. Low MgO
i, and Co ver
The fractiona
ments may p
Figureand Heet al., 2and Mshows crust, aand bluinfluenContinand FosedimecompoKarste
as indicate th
fractionation
an partly be
enocrysts. O
ent in most. T
the fractionat
O (5.7-11.5%
rsus MgO (F
ation of plag
point toward
e 8. Nb*/U vs.even Plateau sa2010), where N
McDonough, 19 projected influarcs, or marineue arrow shownce of altered onental crust (CCountain (1995)ent (MS), and ositions are froen (1995).
hat they are n
n and differe
explained b
Olivine phen
The trend of
ation of clino
%), Cr (106-2
Fig. 5), verify
gioclase was
laboratory
Th/La for Hövamples (PerepeNb* = 17 × Ta 989). Red arrowuence of contine sediments on
ws projected oceanic sedimeC) from Rudni. Arcs, marine altered oceanicm Klein and
not the produ
entiation of a
by the fractio
nocrysts are
f decreasing
opyroxene pl
230 ppm), an
fy the import
s less import
Zuza
vsgöl elov (Sun
ws nental
n melt,
ents. ick
c crust
uct
a
onal
lays a
nd Ni
tance
ant,
Zuza
19
as plagioclase would have taken both CaO and Al2O3 out of the melt, which is not seen as MgO
decreases (Fig. 5). The lack of a negative Eu anomaly (Fig. 6) also supports this.
The considerable scatter (Fig. 5) with these trends suggests that fractionation of a single
parental melt cannot be entirely responsible for the compositional differences of these samples.
Magma mixing, high-pressure fractionation (see Barry et al., 2003), or a varied source may
account for the observed compositional differences.
Melt source
Steep REE patterns (La/Yb ~ 15-30) suggest that melting occurred within the garnet
lherzolite stability field (Fig. 6, 9). The spinel-garnet transition zone in the region is located at
~65 km depth (Ionov et al. 1998), providing a minimum depth for melt production. Other
investigations on Mongolian basalts have shown magma generation depths greater than 70 km
(Barry et al., 2003; Perepelov et al., 2010). The relationship between Ba/Ta and La/Ta (Fig. 7),
87Sr/86Sr ratios (most .7039-.7050), and minimal crustal interaction suggest that melting occurred
at the base of the lithosphere or in the uppermost asthenosphere.
Geochemical evidence (Fig. 9), pressure/temperature constraints at > 65 km depth, and
other studies (e.g. Barry et al., 2003) suggest that a low degree of partial melting produced these
magmas. Anhydrous melting at these depths would require extremely elevated asthenospheric
mantle temperatures, which are not observed in geophysical surveys (Poort and Klerkx, 2004).
P-T analyses on garnet lherzolite xenoliths also indicate that the lower lithosphere does not have
temperatures greater than 1100⁰C (Ionov et al., 1998). The existence of volatiles could produce
melts at these lower temperatures.
Figure 9. Sare arc roccompositiocompositiofrom smallDePaolo (1
E
La conce
melt. As
show tha
(e.g. an o
melts (Fi
slab on th
related to
oceanic c
Sm/Yb vs. La/ks (Kay et al.,
on from Sun anons from Rudnler degrees of p1997). Dates ar
Enrichment in
entrations (T
s pointed out
at the melting
old slab). Th
ig. 10). The
he melt. A p
o altered oce
crust. Th co
Sm for Hövsgö1993) and Haw
nd McDonoughick and Fountapartial melting re from Rasska
n fluid-mobi
able 1; Fig.
t by Sun and
g source inte
he lavas have
calc-alkalin
plot of Nb*/U
eanic crust, a
ncentrates in
öl and Heven Pwaiian basalts h (1989) and loain (1995). Batof spinel perid
azov et al. (200
ile elements
10) suggest
d McDonoug
eracted direc
e low values
ne trend (Fig
U vs. Th/La
as the they do
n oceanic cru
20
Plateau sample(Lassiter and D
ower crustal (Ltch melting curdotite and garn00).
(e.g. positiv
that hydrous
gh (1989), lo
ctly or indire
s for these ra
. 4b) also su
(Fig. 8) reve
o not trend t
ust, and is re
s (Perepelov etDePaolo, 1997)LC), middle crurves show char
net peridotite so
ve Sr and Ba
s minerals m
ower La/Nb a
ectly with alt
atios, falling
uggests some
eals that the
toward direc
elatively imm
t al., 2010). Sh). Primitive ma
ustal (MC), andracteristics of mources, based o
a anomalies:
may have con
and 87Sr/86Sr
tered recycle
off the trend
e influence o
melt source
t influence w
mobile, so it
hown for compantle (PM) d upper crustalmagmas deriveon Lassiter and
Fig. 6) and
ntributed to t
r ratios may
ed oceanic cr
d for typical
of a subducte
e was not dir
with altered
s strong
Zuza
parison
l (UC) ed d
low
the
rust
l OIB
ed
rectly
depletion
melting (
A
metasom
amphibo
Metasom
17 × Ta:
concentra
Figure 10.× Ta (Sun Ba/Nb andGradation values repral. (1986) a
n in the Hövs
(Klein and K
As previously
matized lithos
le and Ba en
matic enrichm
Sun and Mc
ations may b
. (a) La/Nb* vsand McDonou
d La/Nb ratios ain arrow depicresent 87Sr/86Srand data from A
sgöl lavas (F
Karsten, 1995
y described b
spheric mant
nrichment ca
ment of the li
cDonough, 1
be derived fr
s. Ba/Nb* for Hugh, 1989). Arrand increasing
cts transition ber ratios. Ratios Austal-Cook I
Fig. 6) also c
5).
by Barry et a
tle source. S
an be associa
ithosphere w
1989) enrichm
rom metasom
Hövsgöl and Hrow represents
87Sr/86Sr ratiosetween the HIMfor St. Helenaslands from Pa
21
confirms that
al. (2003), th
Sr enrichmen
ated with the
would provid
ment (>35 p
matized litho
Heven Plateau stypical positivs of OIB, as deMU-type (whita, Tristen de Cuanter et al. (200
t the magma
his may sugg
nt is associat
e melting of p
de such hydr
ppm) also sup
ospheric man
samples (Perepve correlation bescribed by Sunte) and EM1-tyunha, and Goug06).
as are not the
gest the pres
ted with the
phlogopite (
rous mineral
pports this id
ntle (Stein an
pelov et al., 201between the linn and McDono
ype (red) OIB sgh are modifie
e product sla
ence of a
melting of
(Fig. 6).
s. High Nb*
dea, as high
nd Kessel, 1
10), where Nb*near relationshiough (1989). sources. Numeed from Weave
Zuza
ab
* (i.e.
Nb
997).
* = 17 ip of
rical er et
Zuza
22
Metasomatism
A possible model for the metasomatic enrichment in this region involves the Paleozoic
Mongol-Okhotsk subduction zone (Zorin, 1999). Panter et al. (2006) found similar metasomatic
enrichment related to ancient subduction in New Zealand and Marie Byrd Land, where fluid-
mobile elements and enriched fluids migrated from the dehydrating slab to the base of the
overlying lithosphere. The base of the lithosphere inboard of a subduction zone became altered
by the products of the dehydrating slab. After subduction ceased, metasomatized lithospheric
mantle was formed (Stein and Kessel, 1997). Alkaline magmatism, with similar trace element
characteristics, occurred inboard and parallel to an ancient subduction zone. Similar enrichment
may have occurred in the Hövsgöl region. The Mongol-Okhotsk Ocean closed at the end of the
Mesozoic, forming the southwest-northeast trending Mongol-Okhotsk suture (see synthesis by
Yin, 2010). Lake Hövsgöl is inboard of this suture, in the region where subduction-related
metasomatism could have occurred (Fig. 1).
This volatile-rich, metasomatized lithospheric mantle may have sat until activated by a
thermal anomaly to trigger partial melting and magmatism. This may help to explain why Late
Cenozoic magmatism is not specifically related temporally or spatially to rift basins (e.g.
minimal volcanism near Lake Baikal: Fig.1; Zorin et al., 2003), but rather, is parallel to the
Mongol-Okhotsk suture. Arc-related, Late Paleozoic granites crop out in the Hövsgöl region
(Fig. 2), indicating that the area is a reasonable distance from the proto-subduction zone to have
undergone enrichment from the dehydrating slab.
Magma genesis and evolution
Zuza
23
Even with the lowered melting temperature associated with a volatile-rich metasomatized
lithospheric mantle, a thermal source is still required to initiate melting. Shallow asthenospheric
upwelling, seen as a slight thermal anomaly beneath Mongolia (Zhao, 2001), may have triggered
melting. 87Sr/86Sr ratios (most .7039-.7050: average of .7047) support this, suggesting the
mixing of EM1-like (i.e. enriched asthenosphere) with HIMU-like (i.e. a metasomatized mantle)
source (Sun and McDonough, 1989). The lack of a deep-rooted low velocity zone suggests that
this minor upwelling is not derived from great depth (Zhao, 2001). Several explanations for
shallow asthenospheric upwelling have been suggested: (1) thermal blanketing by the Eurasia
continent, leading to small amounts of convection (Barry et al., 2003); (2) lithospheric
delamination and subsequent replacement by the asthenosphere (Barry et al., 2003); or (3) the
sinking of subducted oceanic slabs, resulting in an upwelling asthenosphere (Yin, 2010). A
combination of these processes may be occurring.
The results of this study, as well as others (e.g. Barry et al., 2003; Perepelov et al., 2010),
indicate that Late Cenozoic volcanism in this region has been relatively continuous and similar
for over 20 Myr. Incompatible element patterns and isotopic ratios for the flows analyzed in this
study, which span ~8 Myr, show little variation (Fig. 6, 7, 8). This fact, along with a gradual
increase in the degrees of partial melting over time (Fig. 9), may suggest that asthenospheric
upwelling is related to thermal blanketing of the region by a thickened mantle lithosphere (Yin,
2010). Following this model, terrane amalgamation and the gradual development of Central
Asia since the Neoproterozoic has greatly thickened the lithosphere (Rasskazov et al., 2000a;
Yin, 2000; Barry et al., 2003). This large Eurasian continental mass may be leading to a thermal
blanketing effect, with small asthenospheric convective cells developing in response to a slow
Zuza
24
warming of the upper mantle. Other models for asthenospheric upwelling (e.g. deep-rooted
plume or delamination) would likely show more temporal and chemical variations.
CONCLUSIONS
Petrographic and geochemical analysis of Late Cenozoic lavas from the Hövsgöl rift
basin was conducted in order to determine magma source, genesis, and evolution. Crustal
contamination is minimal. Trace elements and isotopic ratios reveal that low degrees of partial
melting of garnet lherzolite occurred at depths greater than 65 km. An enriched asthenospheric
source probably interacted with a volatile-rich, metasomatized lithospheric mantle, to produce
melts without requiring significantly elevated temperatures.
Although previously discounted by Barry et al. (2003), influence and dehydration of the
oceanic crust associated with the Paleozoic Mongol-Okhotsk subduction zone seems like a likely
mechanism for creating metasomatically enriched lithospheric mantle. Work by Panter et al.
(2006) found similar trace element and isotopic ratio signatures for melts of metasomatized
mantle lithosphere on the inboard side of ancient sutures, which appears to be a good analogue
for Mongolian magmatism.
The cause of asthenospheric upwelling is questionable, although consistent lava
compositions over at least 20 Myr and increasing degrees of partial melting with time, may
support the model of thermal blanketing by a thickened lithosphere.
In terms of the debate between active and passive rifting, low-volume volcanism, lack of
a deep-rooted low velocity zone (Zhao, 2001), and the temporal disconnect between volcanism
and crustal rifting (> 15 Myr: Rasskazov et al., 2000; Fedotov et al., 2003) seem to rule out the
Zuza
25
possibility of a mantle plume driving extension. Minor upwelling is likely occurring to trigger
melting of a volatile-rich metasomatized source, but it is unlikely that this is causing intra-
continental extension. In this region, rifting is likely passive, with extension along preexisting
structures (e.g. sutures, fabrics, etc.) being controlled by far-field stress.
Further study would benefit from more isotopic information (e.g. Nd and Pb isotopes)
and precise dating on these volcanic deposits. This would allow for better constraints of the
source and timing of melt generation. Additionally, a broader sampling of volcanic deposits
across Mongolia and Central Asia would aid in understanding the regional implications of Late
Cenozoic volcanism.
ACKNOWLEDGEMENTS
This project was made possible by the Keck Geology Consortium, with additional
support coming from an Cornell University’s Engineering Learning Initiatives research grant and
a Keck-ExxonMobil Enhanced grant. Suzanne Kay (Cornell University) provided valuable
advice and assistance with electron microprobe and INAA analysis. Further laboratory support
by Robert Kay (Cornell University), with INAA, and John Hunt (Cornell University), with the
electron microprobe work, helped immensely. Tremendous field support and guidance was
provided by Aranzal Bat-Erdene (Mongolian University of Science and Technology) and
Andrew de Wet (Franklin & Marshall College). Camp logistics and cooking, provided by
Sarantsetseg Gonchigdori and Dagiimaa Yadam, made fieldwork possible.
REFERENCES
Zuza
26
Al'mukhamedov, A. I., Gordienko, I. V., Kuz'min, M. I., Tomurtogoo, O., and Tomurkhuu, D.,
1996, The Dzhida Zone: A Fragment of the Paleoasian Ocean: Geotectonics, v. 30, no. 4,
p. 279-294.
Barry, T.L., Saunders, A.D., Kempton, P.D., Windley, B.F., Pringle, M.S., Dorjnamjaa, D.,
Saandar, S., 2003, Petrogenesis of Cenozoic basalts from Mongolia: Evidence for the role
of asthenospheric versus metasomatized lithospheric Mantle Sources: Journal of
Petrology, v. 44, p. 55-91.
Devyatkin, Y.V., and Smelov, S.B., 1980, Position of basalts in the Cenozoic sedimentary
sequence of Mongolia: International Geology Review, v. 22, p. 307-317.
Delvaux, D., Moeys, R., Stapel, G., Petit, C., Levi, and K., Miroshnichenko, A., Ruzhich, V.,
and San'kov, V., 1997, Paleostress reconstructions and geodynamics of the Baikal region,
Central Asia, Part 2. Cenozoic rifting: Tectonophysics, v. 282, no. 1-4, p. 1-38.
Fedotov, A., San'Kov, V., De Batist, M., Kazansky, A., Parfeevets, A., Miroshnitchenko, A., and
Pouls, T., 2006, Chronology of the Baikal Rift System: EOS Transactions. AGU, v. 87,
no. 25, p. 246-250.
Gao, S., Davis, P. M., Liu, H. and Slack, P. D., 1994, Asymmetric upwarp of the asthenosphere
beneath the Baikal rift zone, Siberia: Journal of Geophysical Research, v. 99, no. B8,
p.15319-15330.
Ionov, D. A., O’Reilly, S. Y., and Griffin, W. I., 1998, A geotherm and lithospheric section for
Central Mongolia (Tariat region): Mantle Dynamics and Plate Interactions in East Asia –
American Geophysical Union Monograph, Geodynamics Series, v. 27, p. 127-153.
Zuza
27
Ionov, D. A., 2002, Mantle structure and rifting processes in the Baikal–Mongolia region:
geophysical data and evidence from xenoliths in volcanic rocks: Tectonophysics, v. 351,
p. 41-60.
Irvine, T. N., and Baragar, W. R. A., 1971, A guide to the chemical classification of the common
volcanic rocks: Canadian Journal of Earth Sciences, v. 8, p. 523-548.
Klein, E. M., and Karsten, J. L., 1995, Ocean ridge basalts with convergent margin geochemical
affinities from the southern Chile Ridge: Nature, v. 374, p.52-57.
Kravchinsky, V. A., Cogné, J.-P., Harbert, W. P., and Kuzmin, M. I., 2002, Evolution of the
Mongol-Okhotsk Ocean as constrained by new palaeomagnetic data from the Mongol-
Okhotsk suture zone, Siberia: Geophysical Journal International, v. 148, no. 1, p. 34-57.
Kuzmichev, A. B., Bibikova, E. V., and Zhuravlev, D. Z., 2001, Neoproterozoic (~800 Ma)
orogeny in the Tuva‐Mongolia Massif (Siberia): island arc–continent collision at the
northeast Rodinia margin: Precambrian Research, v. 110, p. 109‐126.
Lassiter, J. C. and DePaolo, D. J., 1997, Plume/lithosphere interactions in the generation of
continental and oceanic flood basalts: chemical and isotopic constraints: Large Igneous
Provinces: Continental, Oceanic, and Planetary Flood Volcanism (Mahoney, J.J. &
Coffin, M. F. (eds)). Geophysical Monograph, American Geophysical Union, v. 100, p.
335–356.
Le Bas, M.J., LeMaitre, R.W., Streckeisen, A.L., and Zanettin, B., 1986, A chemical
classification of volcanic rocks based on the total alkali-silica diagram: Journal of
Petrology, v. 27, p. 745-750.
Zuza
28
Logatchev, N.A., 1993. History and geodynamics of the Baikal rift in the context of the Eastern
Siberia rift system - a review: Bulletin des Centres de Recherches Exploration, v. 17, p.
353–370.
Logatchev, N.A. and Zorin, Y.A., 1992, Baikal rift zone: Structure and geodynamics:
Tectonophysics, v. 208, no. 1-3, p. 273-286.
Nielsen, C. and Thybo, H., 2009, No Moho uplift below the Baikal Rift Zone: Evidence from a
seismic refraction profile across southern Lake Baikal: Journal of Geophysical Research
B: Solid Earth, v. 114, no. 8, p. 1-22.
Panter, K. S., Blusztajn, J., Hart, S. R., Kyle, P. R., Esser, R., and Mcintosh, W. C., 01, 2006,
The Origin of HIMU in the SW Pacific: Evidence from Intraplate Volcanism in Southern
New Zealand and Subantarctic Islands: Journal of Petrology, v. 47, no. 9, p. 1673-1704.
Petit, C., Deverchere, J., Houdry, F., Sankov, V. A., Melnikova, V. I., and Delvaux, D.,1996,
Present-day stress field changes along the Baikal rift and tectonic implications: Tectonics,
v. 15, no. 6, p. 1171.
Petit, C., Burov, E. and Déverchère, J., 1997, On the structure and mechanical behavior of the
extending lithosphere in the Baikal Rift from gravity modeling: Earth and Planetary
Science Letters, v. 149, no. 1-4, p. 29-42.
Perepelov, A. B., Tsypukova, S. S., Demonterova, E. I., Pavlova, L. A., Travin, A. V., and Bat-
Ulzii, D., 2010, The first mineralogical, geochemical, and isotope-geochronological data
on neogene alkaline basaltic volcanism of the Heven Zalu Uriin Sar'dag Plateau
(Northern Mongolia): Doklady Earth Sciences, v. 434, no. 1, p. 1230-1234.
Mats, V. D., 1993, The structure and development of the Baikal rift depression: Earth Science
Reviews. v. 34, no. 2, p. 81-118.
Zuza
29
Poort, J., and Klerkx, J., 2004, Absence of a regional surface thermal high in the Baikal rift; new
insights from detailed contouring of heat flow anomalies: Tectonophysics, v. 383, no. 3,
p. 217 – 241.
Rasskazov S. V., Ivanov A. V., and Demonterova E. V., 2000a, Deep-seated inclusions in Zun-
Murin basanites (Tunka rift valley, Baikal region): Russian Geology and Geophysics, v.
41, p. 98-108.
Rasskazov, S.V., Logachev, N.A., Brandt, I.S., Brandt, S.B., and Ivanov, A.V., 2000,
Geochronology and geodynamics of the Late Cenozoic in Southern Siberia, Southern and
Eastern Asia: Nauka Publications, p. 288.
Rasskazov, S.V., Luhr, J.F., Bowring, S.A., Ivanov, A.V., Brandt, I.S., Brandt, S.B.,
Demonterova, E.I., Boven, A.A., Kunk, M., Hough, T., Dungan, M.A., 2003, Late
Cenozoic Volcanism in the Baikal Rift System: Evidence for Formation of the Baikal and
Khubsugul Basins due to Thermal Impacts on the Lithosphere and Collision-Derived
Tectonic Stress: Berliner Palaobiologische Abhandlugen, v. 4, p. 33-48.
Shkol'nik, S.I., Reznitskii, L.Z., Belichenko, V.G., and Barash, I.G., 2009, Geochemistry,
petrogenesis, and geodynamic typification of metavolcanics of the Tunka terrane (Baikal-
Hovsgol region): Russian Geology and Geophysics, v. 50, no. 9, p. 779-788.
Stein, M., Navon, O., and Kessel, R., 1997, Chromatographic metasomatism of the Arabian-
Nubian lithosphere: Earth and Planetary Science Letters, v. 152, p. 75-91.
Sun, S., and McDonough, W.F., 1989, Chemical and isotope systematics of oceanic
basalts: Implications for mantle composition and processes, In Saunders, A.D.,and Norry, M.J.,
eds. Magmatism in the ocean basins: Geological Society, London, Special Publication 42,
p. 313-345.
Zuza
30
Thompson, R. N., Ottley, C. J., Smith, P. M., Pearson, D. G., Dickin, A. P., Morrison, M. A.,
Leat, P. T., Gibson, S. A., 2005, Source of the Quaternary Alkalic Basalts, Picrites and
Basanites of the Potrillo Volcanic Field, New Mexico, USA: Lithosphere or Convecting
Mantle?: Journal of Petrology, v. 46, no. 8, p. 1603-1643.
Watson, S., 1993, Rare earth element inversions and percolation models for Hawaii: Journal of
Petrology, v. 35, p. 763–783.
Weaver, B.L., Wood, D.A., Tarney, J., and Joron, J.L., 1986, Role of subducted sediment in the
genesis of ocean-island basalts: geochemical evidence from South Atlantic Ocean
islands: Geology, v. 14, no. 4, p. 275-278.
Yin, An., 2010, Cenozoic tectonic evolution of Asia: A preliminary synthesis: Tectonophysics, v.
488, no. 1, p. 293-325.
Zhao, D., 2001, Seismic structure and origin of hotspots and mantle plumes: Earth and Planetary
Science Letters, v. 192, no. 3, p. 251-265.
Zonenshain, L.P. and Savostin, L.A., 1981, Geodynamics of the Baikal rift zone and plate
tectonics of Asia: Tectonophysics, v. 76, no. 1-2, p. 1-45.
Zorin, Y.A., Turutanov, E.K., Mordvinova, V.V., Kozhevnikov, V.M., Yanovskaya, T.B. and
Treussov, A.V., 2003, The Baikal rift zone: The effect of mantle plumes on older
structure, Tectonophysics, v. 371, no. 1-4, p. 153-173.
Zorin, Y.A., Turutanov, E.K., Kozhevnikov, V.M., Rasskazov, S.V. and Ivanov, A.V., 2006,
Cenozoic upper mantle plumes in East Siberia and Central Mongolia and subduction of
the Pacific Plate: Doklady Earth Sciences, v. 409, no. 5, p. 723-726.
Zuza
31
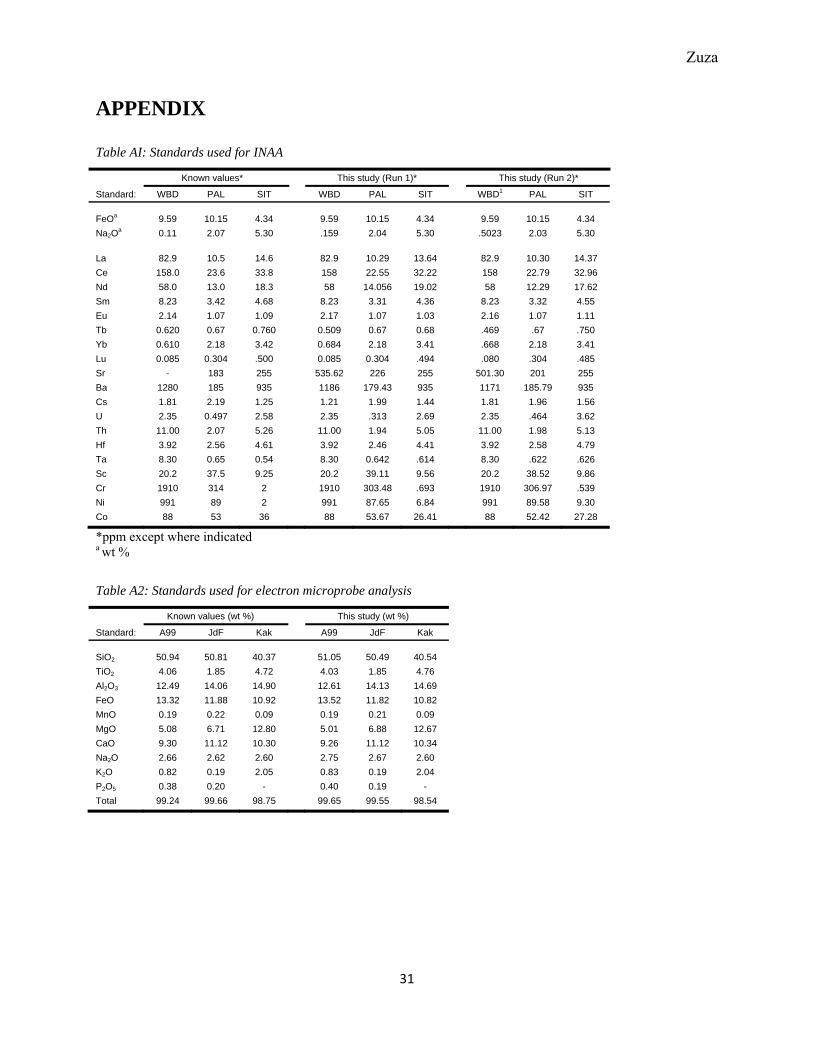
APPENDIX Table AI: Standards used for INAA
Known values* This study (Run 1)* This study (Run 2)*
Standard: WBD PAL SIT WBD PAL SIT WBD1 PAL SIT
FeOa 9.59 10.15 4.34 9.59 10.15 4.34 9.59 10.15 4.34
Na2Oa 0.11 2.07 5.30 .159 2.04 5.30 .5023 2.03 5.30
La 82.9 10.5 14.6 82.9 10.29 13.64 82.9 10.30 14.37
Ce 158.0 23.6 33.8 158 22.55 32.22 158 22.79 32.96
Nd 58.0 13.0 18.3 58 14.056 19.02 58 12.29 17.62
Sm 8.23 3.42 4.68 8.23 3.31 4.36 8.23 3.32 4.55
Eu 2.14 1.07 1.09 2.17 1.07 1.03 2.16 1.07 1.11
Tb 0.620 0.67 0.760 0.509 0.67 0.68 .469 .67 .750
Yb 0.610 2.18 3.42 0.684 2.18 3.41 .668 2.18 3.41
Lu 0.085 0.304 .500 0.085 0.304 .494 .080 .304 .485
Sr - 183 255 535.62 226 255 501.30 201 255
Ba 1280 185 935 1186 179.43 935 1171 185.79 935
Cs 1.81 2.19 1.25 1.21 1.99 1.44 1.81 1.96 1.56
U 2.35 0.497 2.58 2.35 .313 2.69 2.35 .464 3.62
Th 11.00 2.07 5.26 11.00 1.94 5.05 11.00 1.98 5.13
Hf 3.92 2.56 4.61 3.92 2.46 4.41 3.92 2.58 4.79
Ta 8.30 0.65 0.54 8.30 0.642 .614 8.30 .622 .626
Sc 20.2 37.5 9.25 20.2 39.11 9.56 20.2 38.52 9.86
Cr 1910 314 2 1910 303.48 .693 1910 306.97 .539
Ni 991 89 2 991 87.65 6.84 991 89.58 9.30
Co 88 53 36 88 53.67 26.41 88 52.42 27.28
*ppm except where indicated a wt %
Table A2: Standards used for electron microprobe analysis
Known values (wt %) This study (wt %)
Standard: A99 JdF Kak A99 JdF Kak
SiO2 50.94 50.81 40.37 51.05 50.49 40.54
TiO2 4.06 1.85 4.72 4.03 1.85 4.76
Al2O3 12.49 14.06 14.90 12.61 14.13 14.69
FeO 13.32 11.88 10.92 13.52 11.82 10.82
MnO 0.19 0.22 0.09 0.19 0.21 0.09
MgO 5.08 6.71 12.80 5.01 6.88 12.67
CaO 9.30 11.12 10.30 9.26 11.12 10.34
Na2O 2.66 2.62 2.60 2.75 2.67 2.60
K2O 0.82 0.19 2.05 0.83 0.19 2.04
P2O5 0.38 0.20 - 0.40 0.19 -
Total 99.24 99.66 98.75 99.65 99.55 98.54