Embed Size (px)
Citation preview
LAST 0>91 -PLflgf eEroM/
Seasonal Changes of Inshore FishPopulations on Sturgeon and RobertsBank, Fraser River EstuaryBritish Columbia
D. K. Gordon and C. D. Levings
Department of Fisheries and OceansFisheries Research BranchWest Vancouver Laboratory4160 Marine DriveWest Vancouver, British Columbia V7V 1N6
January 1984
Canadian Technical Report ofFisheries and Aquatic SciencesNo. 1240
Canada
Canadian Technical Report ofHydrography and Ocean Sciences
Technical reports contain scientific and technical information that contributes toexisting knowledge but which is not normally appropriate for primary literature. Thesubject matter is related generally to programs and interests of the Ocean Science andSurveys (OSS) sector of the Department of Fisheries and Oceans.
Technical reports may be cited as full publications. The correct citation appearsabove the abstract ofeach report. Each report is abstracted in Aquatic Sciences andFisheries Abstracts and indexed in the Department's annual index to scientific andtechnical publications.
Technical reports are produced regionally butarenumbered nationally. Requestsfor individual reportswill befilled bythe issuing establishment listed on thefront coverand title page. Out of stock reports will besupplied for a fee by commercial agents.
Regional and headquarters establishments of Ocean Science and Surveys ceasedpublication of theirvarious report series as of December 1981. A complete listing ofthese publications is published in the Canadian Journal of Fisheries and AquaticSciences, Volume 39: Indexto Publications 1982. Thecurrent series, which begins withreport number 1, was initiated in January 1982.
Rapport technique canadien surPhydrographie et les sciences oceaniques
Les rapports techniques contiennent des renseignements scientifiques ettechniques qui constituent une contribution aux connaissances actuelles, mais qui nesont pas normalement appropries pour la publication dans un journal scientifique. Lesujet est generalement lie aux programmes et intSrets du service des Sciences et lev£soceaniques (SLO) du ministere des Peches et des Oceans.
Les rapports techniques peuvent etre cites comme des publications completes. Letitre exact parait au-dessusdu resumedechaque rapportTLes rapports techniquessontresumes dans la revue Resumes des sciences aquatiques et halieutiques, et lis sontclasses dans l'index annuel des publications scientifiques et techniques du Ministere.
Les rapports techniques sont produits a l'echelon regional, mais numerotes al'echelon national. Les demandes de rapports seront satisfaites par l'etablissementauteur dont le nom figure sur la couverture et la page du titre. Les rapports epuisesseront fournis contre retribution par des agents commerciaux.
Lesetablissements des Sciences et levesoceaniques dans les regions et a Padministration centrale ont cess£ de publier leurs diverses series de rapports en decembre 1981.Une liste complete de ces publications figure dans le volume 39, Index des publications1982 du Journal canadien des sciences halieutiques et aquatiques. La s6rie actuelle acommence avec la publication du rapport numero 1 en Janvier 1982.
J-
Canadian Technical Report of
Fisheries and Aquatic Sciences No. 1240
January 1984
SEASONAL CHANGES OF INSHORE FISH POPULATIONS
ON STURGEON AND ROBERTS BANK, FRASER RIVER ESTUARY
BRITISH COLUMBIA
by
D. K. Gordon and C. D. Levings
Department of Fisheries and Oceans
Fisheries Research Branch
West Vancouver Laboratory
4160 Marine Drive
West Vancouver, British Columbia V7V 1N6

- 11 -
(c)Mmister of Supply and Services Canada 1984
Cat. No. Fs 97-6/1240 .. ISSN 0706-6457
\*•*
t
\
-Ill
ABSTRACT
Gordon, D.K. and CD. Levings. 1984. Seasonal changes of inshore fishpopulations on Sturgeon and Roberts Bank, Fraser River estuary.British Columbia. Can. Tech. Rep. Fish. Aquat. Sci. 1240: 81 p.
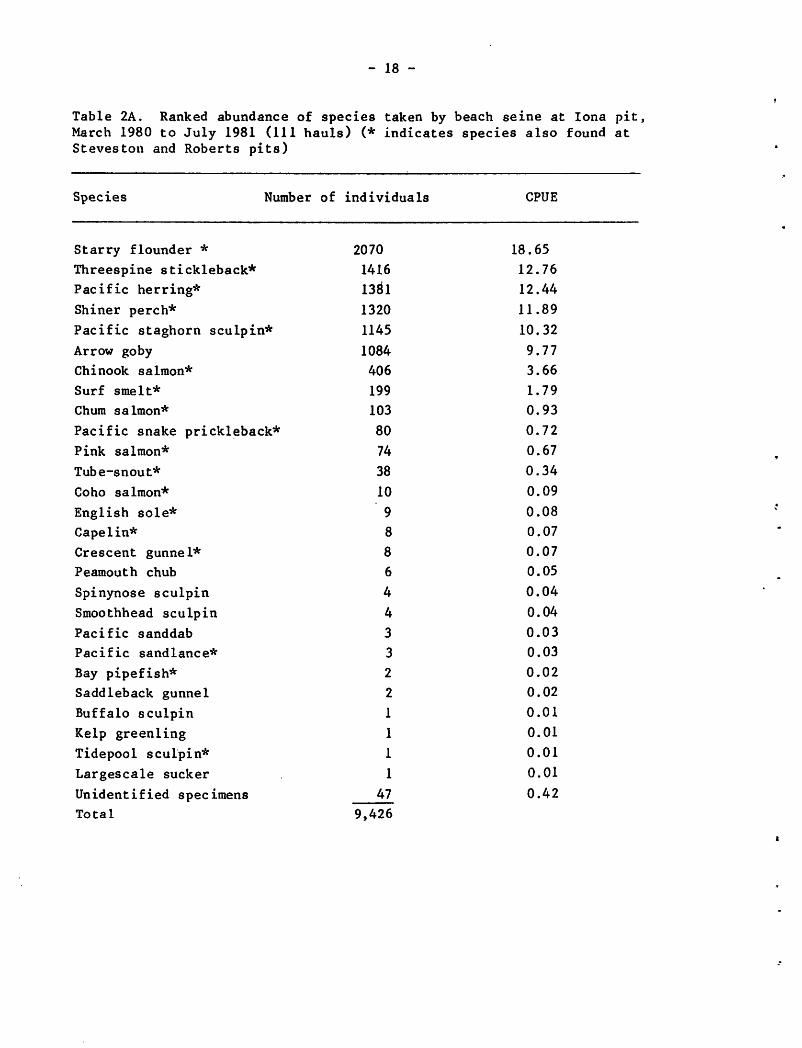
Results of a beach seine sampling program at three low tiderefuges on Sturgeon and Roberts Banks, Fraser River estuary, arepresented. Twenty-seven fish species were taken at lona Island, asandflat site on northern Sturgeon Bank impacted by domestic sewage.Twenty-five species were caught at a reference location in a sandflat onsouthern Sturgeon Bank (Steveston pit). Catches were lower at lonacompared to Steveston, and there were some differences in communitycomposition. Fifty-two fish species were observed in the eel grasshabitats on Roberts Bank and catches were generally much higher comparedto lona and Steveston pit. Starry flounder (Platichthys stellatus),threespine stickleback (Gasterosteus aculeatus),herring (Clupea harenguspallasi), and shiner perch (Cymatogaster aggregata) were among the fivemost abundant species, as judged by CPUE, at both lona and Stevestonpit. Juvenile chinook salmon (Oncorhynchus tshawytscha) and Pacificstaghorn sculpin (Leptocottus armatus) completed the ranking atSteveston and lona, respectively. At Roberts Bank herring, sandlance(Ammodytes hexapterus), shiner perch, staghorn sculpin, and tubesnout(Aulorhynchus flavidus), were the most abundant species. Seasonaltrends in catches on Sturgeon Bank appeared to be closely related toseasonal variation in temperature but at Roberts Bank there was greatervariability implying that other factors were involved. Dissolved oxygenwas consistently lower at lona and may have affected the distribution ofsome species. Rapid changes in species composition and abundance duringthe summer at all three sites was related to influxes of juveniles ofvarious species. The inter-tidal habitats, both vegetated andnon-vegetated, have a substantial capacity for fish rearing and as suchdeserve further investigation and continuing protection from disruption.
Key Words: Fraser River estuary, sand flats, Zostera marina, juveniledemersal fish, juvenile salmonids, seasonal changes.
- IV -
k£sum£
Gordon, D% K. and C. 0. Levings. 1984. Seasonal changes of inshore fishpopulations on Sturgeon and Roberts Bank, Fraser River estuary, BritishColumbia. Can. Tech. Rep. Fish. Aquat. Sci. 124U: 81 p.
Les auteurs presentent les resultats d'un programmed'echantillonnage a la senne de rivage dans trois refuges de basses eaux desbancs Sturgeon et Roberts, dans l'estuaire du Fraser. Vmgt-sept especes depoisson ont e*te* capturees a la hauteur de l'lle lona, vey de la partie nord dubanc Sturgeon qui regoit des eaux usees domestiques. A un site etalon sur unvey au sud du banc Sturgeon (Steveston), 25 especes ont ete pechees. Lesprises etaient moins nombreuses a lona qu'a Steveston et il existait unecertaine difference dans la composition des communautes. Au banc Roberts, lesauteurs ont observe 52 especes dans les herbiers de zosteres et les capturesy etaient generalement plus elevees qu'a lona et a Steveston. A ces deuxendroits, la plie etoilee (Platichthys stellatus), 1'epinoche a trois epines(Gasterosteus aculeatus), le hareng (Clupea harenqus pallasi) et le perch-mene(Qymatoqaster aggregata) figuraient parmi les especes les plus abondantesselon les PUE. En cmquieme place venaient le saumon qumnat juvenile(Oncorhynchus tshawytscha) a lona et le chabot arme (Leptpcottus armatus) aSteveston. Au banc Roberts, le hareng, le lancon qourdeau (Ammodyteshexapterus), le perche-mene le chabot arme" et la trompe (Aulorhynchusflavidus"T""e*taient les especes les plus abondantes. Les tendances saisonnieresdes prises au banc Sturgeon semblaient §tre liSes aux variations saisonnieresde la temperature mais, au banc Roberts, les variations etaient plusprononcees, ce qui porte a croire a la presence d'autres facteurs. A Inoa, laconcentration d'oxygene dissous etait uniformement infeneure et peut avoirinflue sur la repartition de certaines especes. Ues changements rapides de lacomposition des especes et de leur abondance pendant I'ete aux trois sites ontete relies a 1'apport de juveniles de differentes especes. Les habitatsmtertidaux, couverts ou non de vegetation, possedent une grande capacitecomme aire de croissance du poisson et, a ce titre, meritent des etudes pluspoussees et une protection permanente contre toute alteration.
Mots-cles: estuaire du fleuve Fraser, veys, Zostera marina, poissonsdemersaux juveniles, salmonides juveniles, variationssaisonnieres.
>
<)INTRODUCTION
A preliminary study (Greer et al. 1980) showed significantcatches of juvenile salmonids and other species at low tide refuges onthe Fraser river estuary at Sturgeon and Roberts Bank, BritishColumbia. As this estuary is adjacent to Vancouver, the largest city onthe west coast of Canada, such information is highly relevant to fishhabitat management in an urban setting. A detailed sampling program wasestablished in 1980 to examine fish use and the comparative ecology ofthree contrasting environments in this area to provide further data.The foreshore banks of the Fraser River estuary (Fig. 1) are extremelydifficult to work on because of their size (14,000 ha) and exposure tothe Strait of Georgia. Therefore 3 representative areas were chosen fordetailed studies at low tide when a restricted body of water could besampled. These were as follows: Roberts Bank pit: a dredge borrow areain eelgrass beds between the Tsawwassen ferry terminal causeway and theWestshore terminal causeway: Steveston Pit, located in a relict riverchannel through a sandflat on southern Sturgeon Bank' lona pit, theseaward end of a man-made channel receiving domestic sewage dischargedonto northern Sturgeon Bank. Data pertaining to environmentalparameters and fish catches in beach seines were collected on 27 tripsbetween March 1980 and July 1981. The original data are tabulated in adata report (Conlin et al. 1982). The present report provides a summaryof the fish catch for all species sampled. In addition the resultsof statistical analyses of catches of the major species andenvironmental data are discussed.
Previous intertidal fish surveys in the northeast Pacific(e.g. Miller et al. 1980) used stations at more open coast environmentsand a quarterly sampling pattern. Our data therefore provide the firstdetailed information on temporal change in inshore fish communities insheltered brackish environments on the British Columbia coast,
specifically the southern Strait of Georgia and the lower Fraser River .estuary.
DESCRIPTION OF THE STUDY AREAS
Roberts and Sturgeon Bank are major foreshore areas of thelower Fraser estuary that are open to the Strait of Georgia (Fig. 1).Sea dykes constructed in the late 1800's on Lulu, Sea, and WesthamIslands, and the adjacent mainland preclude the movement of water athigh tide over the seaward portions of the islands. The effectiveintertidal area of the Banks is currently approximately 14000 ha.Because of this extremely large expanse, we decided to sample only atlow tide (<1 m above chart datum) when much smaller areas contain
water. These low tide refuges, or pits, are the focus of the habitatstudies reported herein.
- 2 -
Sturgeon Bank, except for a fringe of marsh 1-2 km seaward ofthe dykes is characterized by sand of relatively uniform diameter (500pm) (Luternauer 1980). Other than adjacent to the marsh and near thelona Island sewage outfall mud is uncommon. Two general sites onSturgeon Bank were sampled. On southern Sturgeon Bank a relict riverchannel, named Steveston pit, was sampled. A sandbar demarcating thesouthwest shore of the channel begins to dry when tide levels fall toapproximately 1.0 m in relation to chart datum (O.D.) (Fig. 1). Thenortheast and south shores begin to dry at 0 m O.D. A system of shallowchannels forms a sill separating the pit from the Strait of Georgia atlow tide. The deepest part of the channel is adjacent to the southwestsandbar, where bottom is located at about - 4.0 m O.D. Detailedbathymetric data are presented elsewhere (Conlin et al. 1982). Whentidal levels permitted up to 6 stations (Fig. 1) were sampled at thislocation. On the northern part of Sturgeon Bank, the seaward portion ofa man-made trench connected with the lona Island sewage treatment plantwas sampled (Fig. 1).
The third location studied was on southern Roberts Bank,
between the Westshore Terminal causeway and the Tsawwassen ferryterminal causeway. Stations at this area were all on man-made beachesor in natural substrates that had been affected by industrial activity.Two stations were on the Westshore Causeway and another was on the ferryterminal structure. The remaining 5 stations were around the edge ofthe borrow pit formed by dredging to construct the Westshore Terminal.The borrow pit stations could only be sampled when tide levels were <0.5m 0 D. In contrast to those on Sturgeon Bank, all Roberts Bank stationswere either in or in close proximity to vegetation, namely eel grass(Zostera marina). Mean plant density on a transect across Roberts Bankand between the causeways at approximately the 1.0 m elevation was 136turions vtT^ in july 1981 (Levings and Gordon, unpublished data). Thesedata are representative of the beach seine stations around the borrowpit. Eel grass at the lower sectors of stations on the Westshorecauseway and the ferry terminal was sparser.
Tidal currents reach considerable velocities at the studyareas, especially on large amplitude tides. Available data show thatsurface currents at Steveston pit and on Roberts Bank can range from 200to 600 cm s"1 (Levings, unpublished data and WCHL 1981). Bottomcurrents at both sites were considerably weaker at the time thesemeasurements were made but vary dramatically with tidal regime. Onlarge ebb and flood tides current velocities at Steveston pit weresufficient to put sand in suspension, as observed in drift samples(Levings 1982).
METHODS
A 14.7 m beach seine was used, with 4.9 m wings (1 cmstretched mesh), bunt 4.9 m ( 3 mm mesh), and depth 3.5 m. This net was
'•&
- 3
estimated to sample approximately 350 m2. Except at stations where thebeach gradient was steep, where outboard motor boats were used, the netwas deployed by personnel wearing chest waders. The distance the netwas pulled off the beach and subsequently retrieved varied from about 5to 10 m. Samples were obtained at most of the sites approximately every2 weeks, except during the winter months (October to March) when weatherand darkness prevented frequent trips. Because of changes in tidallevels it was not possible to sample all stations on every trip. Thework was scheduled so that the work occurred at tidal levels ± 2 h fromthe lowest tide of the day. However, at least 3 replicate seines wereobtained at key locations on each sampling session. Completeinformation on stations sampled, dates, and times is presented elsewhere(Conlin et al. 1982.)
Whenever possible fish were identified in the field, counted,and released alive. Some specimens were fixed in 10% formalin forlength/weight determination (Kotyk et al. 1983) as were fish that couldnot be identified without laboratory examination. Fork lengths of fishwere measured to the nearest millimetre. Nomenclature for fish speciesfollows Jean et al. (1981).
Salinity, temperature and dissolved oxygen (D.O.) measurementswere made with the fish collections, usually from a depth of 25 cm.Replicates of 3 to 6 samples were usually obtained on each trip.Salinity estimates were determined from duplicate 75 mL samples usingeither an Autosal 8400 salinometer or an American Opticalrefractometer. Temperatures were obtained with a hand heldthermometer. The Winkler method (Strickland & Parsons 1972) was used todetermine the dissolved oxygen levels of duplicate 300 mL watersamples. Data on temperature, salinity, and dissolved oxygen aretabulated in Conlin et al. (1982).
Multi-way analyses of variance (ANOVA) were carried out tocompare fish abundance among areas and among sampling times using theUniversity of British Columbia Computing Centre statistical package UBCGenlin (General Least Squares Analysis of Variance Program). Analyseswere performed on the transformed [in (x + 1)] catch data of majorspecies and the temperature, salinity, and dissolved oxygen data.
RESULTS AND DISCUSSION
ENVIRONMENTAL PARAMETERS
Seasonal variation in temperature, salinity and D.O. are shownin Figures 2, 3 and 4. Winter and early spring temperatures were in therange 4 to 5°C. Late summer temperatures at Steveston and lona pit wereconsiderably higher than at Roberts Bank, exceeding 20°C compared to amaxima of about 19°C or lower at the latter location. ANOVA showed a
- 4 -
significant difference (p <0.05, F = J22.9) between locations.
The spring freshet of the Fraser River produces a dramataicseasonal effect on salinity at Steveston and lona, decreasing values tothe 2-4%o range from winter maxima of approximately 23%> (Fig. 3). Inaddition the proximity of these two sites to the Middle Arm and SouthArm of the Fraser maintains the year-round salinities of these two sitesat significantly (p <0.05; F = 1413.6) lower levels than those found atRoberts Bank pit. On Roberts Bank freshening due to river runoff wasless marked, and the seasonal range in surface salinities was from about18 to 27%S (Fig. 3). Based on salinity regimes Steveston and lona wereestuarine environments while Roberts Bank was a partial marine site.
Dissolved oxygen values at lona pit ranged from minima ofapproximately 4 mg L~* in October 1981 to about 10 mg L~* in April 1982(Fig. 4). Values at Steveston pit were higher, usually between 10 and12 mg L~*. On Roberts Bank, D.O. values were consistently >10 mg L"1,reaching maximum values of close to 16 mg L~* in spring. Dissolvedoxygen (D.O.) values at lona are significantly lower (p <0.05, F =190.9) all year round than those at Steveston and Roberts Bank, probablydue to the continual discharge of sewage (Otte and Levings 1975,Birtwell et al. 1983). Mean values for percent saturation of D.O. in1980 and 1981 at lona pit were 61.0% and 75.8%, respectively, comparedto 117.8% and 106.8% at Steveston and 166.3% and 165.1% at Roberts
Bank. The latter super-saturated values are indicative of the highprimary productivity of eel grass and algae.
SPATIAL VARIATION IN CATCHES AND SPECIES DISTRIBUTIONS
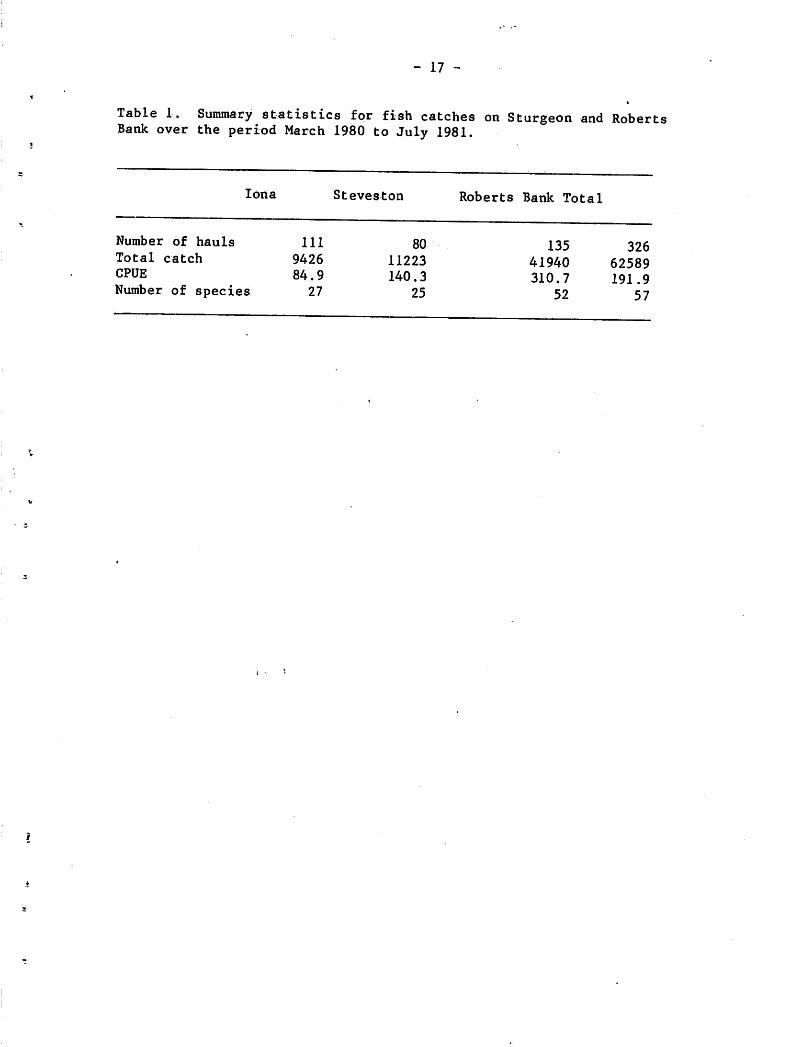
Roberts Bank showed by far the greatest population density andspecies diversity of the three sites (Table 1). Oceanographic featuresof Roberts Bank are more stable and in addition this area is
characterized by a more complex habitat with the presence of eel grassbeds, rock jetties, pilings, borrow pit and sand banks.
Catch per unit effort (CPUE) at Steveston was greater that atlona (Table 1), but the species diversity of these two sites wasessentially the same. Steveston and lona are estuarine environments,located in relatively close proximity to one another and therefore theyshare the same species and show similar diversity levels. However, lonais more stressful than Steveston due to the year-round influx of sewageand the lower levels of D.O.
A common result of several studies of northeast Pacific bay,estuarine and inshore fish populations, (e.g., Allen and Horn 1975: Horn1980a) is that five or fewer species usually comprise 75% or more of thetotal fishes sampled even though there may be many other speciescollected. The results of the present study generally fit in with thesefindings. At lona six species comprise 89.3% of the total catch overthe program while at Steveston five species comprise 85.1% of thecatch and at Roberts Bank four species represented 77.5% of the catch(Table 2a, b, c). Other species at all three sites each comprised lessthan 5% of the total catch.
- 5 -
Of a total of 57 species sampled, 18 were found to be commonto all three locations (Table 2a, b, c). Roberts Bank had 25 endemicspecies of which at least 13 were considered rare (captured on few trips(n <2) and in small numbers (n <3)). Two species, the arrow goby andpeamouth chub, were exclusive at Steveston and lona. The peamouth chub,primarily a freshwater species may be excluded from Roberts Bank byhigher salinities. Based on Clark and Mclnerney's experimental work(1974) this species is tolerant of brackish water and probably couldoccasionally use these habitats. Arrow gobies have been found atRoberts Bank above the eel grass beds at much higher tidal elevationsthan those sampled in the present study (A. MacDonald, pers. comm.).
The eulachon and brassy minnow were caught only at Steveston,on one occasion each. The brassy minnow and the large scale suckerare freshwater species (Carl et al. 1959) and the occurrence of them inthe Steveston and lona catches indicates a small number of individualsperiodically get swept down the river and out into the estuary. Thesetwo species have low tolerance to salt water (Clark and Mclnerney1974). As eulachon spawn in the Fraser River between March and May(Samis 1977), their presence probably indicates the capture of anindividual as it was moving through the river to spawn or a spent fishcarried out to the estuary. Six species, the saddleback gunnel, kelpgreenling, buffalo sculpin, smoothhead sculpin, spinynose sculpin andStfttd dab were not caught at Steveston but were present at the other twosites. All of these species were captured infrequently (<2 trips) or insmall numbers (<4) so at lona that they would have to be considered rareand thus not making up an important component of the community. Thesespecies are probably not tolerant of the low salinities found onSturgeon Bank. The kelp greenling and smoothhead sculpin are also rareat Roberts Bank whereas the other four species are considerably morenumerous. Three species, the penpoint gunnel, butter sole and sand solewere found at both Steveston and Roberts Bank but not at lona. Thepenpoint gunnel was only captured on two occasions at Steveston whereasat Roberts Bank it was taken on numerous trips and in large numbers.This suggests that the penpoint gunnel is essentially a marine speciesthat has been caught incidentally at Steveston but should not beconsidered an integral member of the Steveston faunal assemblage. Thebutter sole and sand sole occur in moderate numbers at Steveston andRoberts Bank lona and their absence at lona could be due to sewageeffects.
TEMPORAL VARIATION IN CATCHES
The seasonal trend in catch at lona and Steveston (Fig. 5)appears to be very closely tied to the seasonal variation in temperature(Figs. 2, 3, 4). At lona both catches and temperature increase throughthe spring to a maximum in early August, followed by a gradual declinethrough fall and winter then increasing again in March 1981. AtSteveston the same general trend is also evident except that two peaksin both catch and temperature occur during June and August of 1980 andthe increase for both catch and temperature in 1981 occurs somewhatearlier, in late February. At Roberts Bank the relationship between
1—1
ft
ao
ex.
CO£
d€
3*
oto
CL
CO
rr
CO
Du
H«
CO
(-•
CD?
0C
OO
Cu
*1
rt>
CO
O3
**
<-S
CO
r-»
-"»
3*
MT
JO
CO
r"
3r-
hC
u
torh
to ft
CD X rr
»i
CD 3 CD
rt
CD 3 TJ O to
(0O
3rr
oC
O3
*o
r»
3"^
to3
3*
CD
XO
toft
CD
•-t
r—•
toi-
hto
CD
toh
-C
DC
Dto
OO
CD
<3
CO 3*
3ft
3*
33
cr
CD
3T
33
3C
Oco
rr
<H
«to
rr
cr
r->
ftrr
toC
r—•
<O
Qr-
*3
to3
3€
3r-
tC
D»-
ts:
OQ
rt
h-
ft3
coC
D*
ir-
tp
rH
*i-
trr
c»C
Dr-h
a•t
CD
H.
CC
OC
Oft
H«
CO
CD
H*
Crr
CO
0Q
OQ
CD
tor-
tr-
h3
rr
O r-t
rr
3*
31
CDO
QG
O
3C
D3
*O
-3
0Q
rr
CD
CO
rr
CD
»-»
31
nC
Drr
3T
>O
CD
CD
orr
CD
<3
*H
*
3*
to 3I
rr
CO
oC
O
r—•
to 3C
DO
3*
r-J
3t,
rrto
CD
H*
H«
rr
O3
rrC
DC
Orr
CD
3 r-»
«
»i
C torr
CD
ftr-
h
O3 C
O
CO
i-t
3 to3
*O
CD f-t
to 3to 3
rr
3*
TJ CD
CD
cr
O 3to
Hi
CO
rr
h1
'o
r*h
3rh
too
3C
Drr
ifO
Q3
r-*
H.
33
JOrt
^!
H»
C3
*(—
•O
r-h
««
Cu
r—'
CD
1C
DJ«
Oto l-
h
CO
< to
t—*
1 CO
C3
*rr
Q.
CO
CO
CD
ow
r—•
(UC
Do
ir—
0Q
CD
WC
DH
-C
Dto
Orr
Cu
3r-
hV
fiW
h«
toCD
C*J
CO
CD
3<
ofi
CO
CO
3 Cu
Oi
r-h
3rt
CO
/~
\T
Jft
3*
r—
•
N.^
<S
ja0
*to
^2
.o
jco
r—•
CD
toto
CO
CO
CD
oC
OC
Or-
30
QC
D3
3C
DC
OC
Dto
rr
CD
3*
rr
*fl
CO
CD
vO
cr
r-h
H«
♦i
to
cC
Dco
****
PT
r-t
O1
rr
3to
0QC
Ou
33
*o
?r
toO
t-t
CO
Cu
toC
O<
CD
<3
3*
toC
DC
OH
*C
D»"
»/-s
C3>
CD
CO
3H
*•t
CO
3T
J**
!C
D5
CO?«
•r—
>C
3H
*C
OC
i-t
r-h
rr
3H
«H
«<
CD
0Q
CD
3<
OQ
toH
*O
00
»-t
ftto
H«
3•i
r->
«to
rr
CD
ftrr
3H
«3
0Q3
CD
*•
oC
D3
*r-h
H-
OC
u3
CD
CD
r-t
CD
Cu
CD
•C
Oo
1>
»•
rr
rt
torr
to
nH
»H
-OQ
3C
u3
*S
a.
to3
*5
Cu
toit
toto
H*
ai
r-h
CD
O3
•H
«C
n•
TJ
3H
«C
OO
Cu
*•
CO
Cu
a*
-••
O 3
rt
*<
33
•v<
oo
r-*
H*
3C
Di-
tto
3C
O1—
»•
»i1
r-»
orr
r-*
CD
toT
J*-
!C
r-h
rr
ON
3to
«.
rr
3*
H«
r-h
OQ
Cf
£O
*C
OC
O>
H«
•r--"0
fto
r->
OC
OC
DC
DC
OC
D3
•3
*to
Cu
r-»
CD
o3
,rh
ON
-^
toC
-trt
Cd
H-
o
Cu
r—•
VO
o*
<CD
pr
V-
ri
a>
N3
*C
D3
CO
.rr
O.
CO
"O
CO
CO
1to
3O
Qcr
CD
3r-»
3O
yto
CO
rt
3
to pr
CID
>-<
X3
•3
<to
03f—
*ri
CO
CD
*-"
toC
DC
3*
to3
*g
Cu
H»
O?
r»-
tC
O•"
»to
r-«
OQ
o3
»•*•
H»
CD
toC
Dx
CO3
*o
o7
to•—
Vr-*
^"s
Cu
<ft
Srr
Ocr
O3
CO
3rt
CO
CD
toi
CD
rt
•-»
rt
^to
7?
ftO
3H
*
0)
a.
I-t
to(_
h«
ft<
•scr
wC
CDCD
toH
«1
co3
CD
3*
13
33
*C
On
CO
to•
to3
3
oT
JC
Ow
Oi-
hto
CD
cocr
t—to
ft
H*
r-t
CO
&.
rr
toC
D•-
t3
3to
>C
DH
«C
Do
ftC
DO
CD
rt
rt
r-«
rt
rr
3*
OQ
i-h
coH
oC
Drr
rSrr
rr
OQ
nv<
;^
CO
3"
*nH
«rr
•C
Or-*
Ocr
CO
r-*
n3
H«
r-h
CD
I3
OC
DC
Oft
rr
ft
H«
•"t3
*C
D>
.C
Oj-
*-
OC
Drt
V5
CD
torr
3O
1C
Oo
rr
CD
or-1
r-«
CO
CD
toC
ur-
tO
^3
"O
CD
to
<u
.g
re
§1
iCD
r-t
to
3h
*to
3o
cr
^5r-
t»•
a.
3<
OQ
3C
uto
r-h
•I
3C
DC
O2
!C
OC
Ocr
TJ
CO
aO
torr
(0rr
CD
CO
O.
gh
-3
««<
cCD
to0
QC
D©
»H
-r—
toto
3rr
OC
OT
JC
DH
«T
JC
Dto
<1
cr
rr
JOft
3C
OO
3co
•-*
3o
CO
r-*
r»
•-d
CO
H-
CO
"O
o1—
»C
<J
toH
-C
Drr
CO
CD
H*
ftO
Qo
H*
CD
O3
*
H*
CD
rr
I-t
sC
D<
H-
H3
CO
r-«
3*
cr
OCD
rt
3T
3*
dr-h
toC
LC
D3
ft€
to3
CD
OQ
f-t
CD
r—
•3
cr
cr
CO
3T
J3
o<
oC
Dft
a.
CDr—
•O
CDC
.ft
ri
H*
CO
CO
I3
H«
eLrr
H«
H-
CD
to1
3.
r-»
7T
XH
«T
JC
D^~
s
hrr
Q.
rf*
CD
ot—
il-
Jr-
»«3
H«
CD
rr
H»
H*
rr
ft
toH
«C
DC
UC
Ocr
CD
r-*
CD
CD
CO
rr
cr
CO
CD
torr
CD
i^
1—1
pr
30
»3
rr
TJ
oC
Dto
3CD
COC
3rr
CO
D-
CD
crv:
H'
n3
r-1
CO
CD
3to
CO
3C
O3
*C
DO
QC
uM
*<
r-t
rt
»-•
•
oC
O!-
*•
o<
3C
OO
CO
H«
3c
toO
CO
cC
DC
uto
si
Cu
•t
•—•
rr
CD
»-*
toT
Jto
CO
OQ
1co
»ft
h-
3*
33*
3to
oC
Dto
Oto
H*
cog
crtj
to3
•"*"
CD
rt
toC
Ort
r-*
»rr
oo
CD
•T
JC
OH
«O
•rt
H"
r-•
to 3rr
•
CD
r-t
rj*
co3
torr
OT
3C
DO
r-»
gC
OH
*H
-3
o<
H«
1r-h
to3
CD
C^
<to
3C
DC
Cd
r-t>
OO
i—•
to3
1C
Or-»
(-••
too
Hr—
i-t
T3
.C
DrH
CO
oD
uto
H-
O3
3ft
n3
3^
ftto
^-»
*C
u•"
tto
Ln
r-h
33
OQ
CD
3*
CD
rr
3r—
»i-
tto
r—
CO
C•1
O3
_3
3cr
Cu
3H
«3
.v<
?0
3rr
r-»
irt
3*
s:
3C
D3 7
?v-*
it
OQ
oC
Dto
l-1
'C
uc
CD
rj*
r-h
r-h
S-*
'r-•
r—
3o
gO
Cu
CO
cC
O»
—3
o3
*C
Do
H-
3»
-»•
rr
g*
(Dp
rC
Oif
a.
OO
Ou
r-h
cto
*<to
vO
3to
rr
Oo
•to
3*
vO
CO
^rr
cr
tor|
Cu
CO
too
CD
CD
oto
to1
r* 3*
3"
i-l
coto
o3
*3
CO
CD
CD
33
Orr
00
5>
-tr-h
O3
or~
*H
«-J
3*
CD
OC
Dc
CD
CD
rr
<cr
<;
rr
c3
CD
CD
cr
pr
TJ
sto
rr
O.
i-J
O.
H>
rr
<H
-L
O3
rt
Qj
CD•
cO
CO
•3
KJ
iO
cr
€*-
tr—
toft
r-•
*-•
•C
O<
CD
CO
toC
uO
N
(OC
DH
«C
D3
*••*
•3
(bC
DC
Dto
r-
3*
CD
ON
—'
rr
3*
TJ
CO
3i
•C
O>
..
•11
torr
31
^O
Cu
to3
rt
3*
rr
<3
toco
H«
*-J
Cu
pr
OQ
3<
to3
3*<
:C
D•1
3•
3*
CD
"O
r-
t>to
cr
•i
CD
cn
CO
r-h
Cu
CD
33
/-N
CD
ftrr
1
g3
o3
*CD
O-
CD
rr
Orr
CO
CO
i-t
(0H
«C
D•-
»C
DC
DO
CO
toC
uO
toft
H«
ftr—
3H
«3
*C
D
•tH
-ft
OQ
Ct-
rtC
DC
OC
OC
D0
Q"O
rr
CD
to7
?ft
CD
i-«
t—•
CO
r-h
CO
r-h
•-J
CO
CO
13
CO
oO
3o
vO
rt
CO
CD
3i_
i.
H«
rr
O0
0r—
torr
MC
Or-
Ji-
t3
*O
t,i-
tCD
H«
toC
DC
DH
-v<
to!-
••
CD
•t
r-h
CO
cO
NC
OC
OT
J
o r<o
cdg
Cco
tj
to3
*C
oC
ucr
*o
Orr
"O
OC
DC
Dr-h
3*
tor—
>C
D3
orr
torr
CO
r-»
3rt
3*
i3
*<
00
CO
CD
CO
oft
pr
33
33
OC
DC
CO
r—
1rr
*-<
CO
or-h
CD
CO
CD
to3
*to
OX
3*
rr
OC
Drr
OC
DS
-'
O•"
••H
«»-
t
coO
3p
r3
*•t
3to
OT
JC
D•x
jrr
ftC
DO
»»
•"»C
uo
3r-*
n€
CD
CD
<C
O3
*rt
*-t
r-h
rr
3to
CO
H«
CO1 C
D
pr
cC
Dr—
Du
toO
H«
CO
3C
D3
*3
*C
uC
Or-
1*
3T
JC
OT
JC
DC
DC
DC
On
CD
TJ
CD
CD
toC
DT
Jrr
TJ
rti
(1)
H'
to•1
3fi
)n
cr
OC
Drr
toC
Drr
cr
cC
O3
rt
toC
Do
Oft
XC
Dr-
lO
to3
CO
r—»
C
CO
H«
rr
CO
rr
pr
CO
OQ
3C
DC
Dg
COc
to1-
13
*1
con
XH
«C
uO
r-'
•"1
TJ
to3
*<
33
r-h
>-t
Cu
Oto
*-<
•I
oCO
O.
H«
3*
CO
rr
3*
H«
Oo
*o
co
rr
a.
toto
H-
ftg
H»
toX
cC
O<
H«
rr
torr
Cu
CD
OC
D3
I-t
CD
H«
!-t
CD
O^~
Nrr
CD
oto
toO
H-
H«
too
<3
to3
CD
13
<C
O<
rr
H«
r-•
tocr
3r—
'3
*to
nto
OC
DC
Drr
3*
CO
**CO
3H
'3
^3
*3
*c
f3
3O
33
CD
CO
OQ
"O
O!-*
•C
D»
C1
—•
to3
*r—
H-
oC
CD
rr
3*
*O
H-
CO
o3
coH
-C
DQ
*to
CO
CD
0Q
3P
-H
*H
*r—
•rr
•-J
Cu
to•i
1r—
rt
r-»«
crr
CD
OC
O1
OH
-to
CO
toh
«to
rr
OQ
cr-
tC
DP
3CO
3cr
coH
'r-h
rt
3C
OH
-C
DC
DH
-0
QC
DC
oC
OC
O3
3T
Jl-
hC
urh
3rr
co3
3C
D3
Cu
r-h
*1to
rr
O3
3rr
toCD
3g
^rr
toto
oto
•iO
3*
CO
H-
r-*
»rr
Cto
OO
<€
o.
Cu
rr
Cto
H«
oo
3*
D*
Qj
rr
3*
3C
Drr
h»
CD
3*
3»
-»
3rr
rr
3to
rr
H«
3C
D3
3c
3rr
oC
OC
D
COQ
j3
*to
CD
i-l
««
J«
-»3
rr
r-h
CD
CD*-
l3
*H
-rr
3rr
CO
tort
CO
toH
«O
CD
toC
uC
DC
Orr
3cr
33
3"
r-«
Oto
to•-
*H
-r--
0Q
CD
i-t
rr
toC
OC
On
H*
3*
rr
•r—
'o
rr
H«
CO
c§
CO
CD
TJ
CD
H«
Cu
/—
sC
D<
£5S
*
Or-
cr
£to
c3
r-t
3
CO
3r-
trr
CO
rr
rr
OCD
3CD
H«
3rr
3•n
cC
O1
CD
i3
r--
CD
CD
CD
€0Q
00
oi
rr
H<
3*
(-•«
CO
/-^
€r—
'o
*i-
t0
Qrr
rr
33
*to
CO
H«
ftO
r-»
rt
OQ
rr
VO
Cu
Cu
i-t
to pr
w3
ZJ*
NC
Drr
1—
CO
toC
DC
Or—
3*
OO
CD
r-»
rr
c3
3*
<H
«3
too
3*
ON
O•
O
OQ
Cu
rr
pr
O-
CD
CD
H-
CD
WV
0"0
CO
toCD
Or-
t»€
CD
3i-
h•
CD
g0
QC
DO
Qo
rr
r-h
toto
VJI
3rr
to
cr*
n>to
3*
3*
a.
ri
CO
tox-4
CO
Cu
r-t
a.
to3
*3
3g
OQ
*13
*3
Crr
rr
>•
H»
3*
3
inceidegree•y
pf
CD
3CO
3U
»ft
CO
<C
Oft
CO
rr
Cr—
TJ
CD
rr
*-t
rr
rt
nC
O3
i-3
CD
Cu
3*
H«
Ccr
o7
?<
*-,
H-
CD
rr
33
*3
VO
CD
n3
*C
Drr
•3
*C
DT
J3
toft
to••>
•i-
l
CD
33
v<
3C
Drr
Cu
OO
CO
cr
00
>-»
CD
to3
*C
O•
CO
!-••
aH
«3
3rr
CD
CD
toto
coO
r-h
1C
Do
torr
CD
<*
ftO
Qc
It
rr
CD
3*
3co
rr
lv-^
rr
CD
HH
«3
*r—
«C
DC
D
•11
ato
toO
to rr
CD
r-t
3*
CD
> rt
CD
CO
rr
rr
CU
O »-h
- 7 -
DIFFERENCES IN DISTRIBUTION, CATCH SIZE, AND LENGTHS
Catch patterns and length frequency changes, when sufficientdata were available, were examined for the abundant commercial species,namely chum, chinook, and pink salmon, herring, English sole and starryflounder as well as five other species which were among the 10 topranking species at both the Roberts Bank pit and the two locations onSturgeon Bank (lona, Steveston). These were as follows: threespinestickleback, shiner perch, Pacific staghorn sculpin, surf smelt, andPacific sandlance. Spatial and temporal differences in catches amongthe 3 sample sites were the main statistical contrasts, and comments onreproduction and migrations are given when possible.
Salmonids
Chinook, chum, pink and coho were captured during the samplingprogram collectively composing 4.99% of the total catch for the threesites. Catches of these species accounted for 6.3% of the total atlona, 13.8% at Steveston, and 2.3% at Roberts Bank. No sockeye and onlya very few coho were captured in this study, probably because of themigratory behaviour of these species on their way to the sea. Coho andsockeye smolts are thought to move directly out to sea when they leavethe Fraser estuary. Certain populations of sockeye fry which have beenrecorded from sloughs in the lower Fraser (Levy and Northcote 1982).Coho smolts were taken on Roberts Banks in an intensive sampling programand mark-recapture study (Levings et al. 1983).
Pink salmon, in accordance with their known cycle of even yearoutmigrations on the Fraser, were only captured during 1980. The pinksfirst appear at Steveston (Fig. 10) in early April and decreased innumber, and thereafter increased at lona and then Roberts Bank. Thissuggests pinks first leave the South Arm of the Fraser River atSteveston and then quickly move outwards from here, pausing at the othertwo sites during the movement away from the river mouth. Catches ofpinks at the three sites were significantly (p <0.05; F = 4.2) differentfrom one another with Roberts Bank having the largest mean catchfollowed by lona and Steveston. Modal length of pink fry at lona andSteveston was approximately 35 mm in April. A month later pink fromRoberts Bank showed modes at 40 and 57 mm, while June samples wereunimodal over the range 54 to 47 mm (Fig. 11).
Chum salmon first appeared in early April 1980 at all threesites and in early March 1981. Catches at lona were significantlylarger (p <0.05 F = 5.7) than at the other two sites during 1980 andsignificantly larger at Roberts Bank in 1981. Chum disappeared from theSteveston pit before Roberts Bank or lona during both 1980 and 1981(Fig. 12), suggesting a dispersion pattern similar to that forpinks. Intensive beach seining was conducted near our Roberts BankStation 1 at a variety of tide levels to collect fish for mark/recaptureexperiments (Levings et al. 1983). Results from this latter study showedthat chum were more abundant at higher tide levels, supporting Bax etal.'s (1980) conclusions from Puget Sound data. Our low tide sampling
- 8 -
therefore underestimated the species abundance. Chum fry at lona fromApril 1980 showed a wide size range, with modes evident at 39, 43, and51 mm. In March 1980 only smaller chums were present at this site, witha mode at 40 mm. Chums taken on Roberts Bank in May 1980 and 1981 werelarger than those from Sturgeon Bank, with the majority between 40 and65 mm (Fig 13).
Chinook were the most numerous of the four salmonid speciescaught at all three sites. During 1980 chinook first appeared in largenumbers at Steveston in early April whereas in 1981 they appeared firstat Roberts Bank (Fig. 14) in early March. However this probablyreflects sampling problems as the Steveston site was not seined betweenearly March and late April 1981. Steveston showed the largest catchesboth years (p <0.05; F = 30.9). Levings (1983a) provides furtherdetails on juvenile chinook ecology in the Fraser River estuary.Chinook fry dominated catches on Sturgeon Bank while both fry and smoltswere taken on Roberts Bank.
The origin of salmon using the Banks cannot be establishedwithout further mark-recapture work, but some inference can be made fromexisting data. Based on 8 recoveries of hatchery chinook smolts (4 in1981, 4 in 1982) (DFO, unpublished data) it is known that stocks fromthe lower Fraser (Chilliwack, Chehalis hatcheries) use Roberts Bank.Other wild smolts may be from upper Fraser stocks, some proportion ofwhich are thought to over winter in the tributaries above the FraserCanyon (Tutty and Yole 1976). Chinook fry using Sturgeon and RobertsBank are likely Harrison River fish (Levings 1983a) which are used asbroodstock for the Chehalis hatchery. Chum and pink are also likely tobe from Fraser stocks, although the possibility of contributions fromother south coast stocks cannot be ruled out. Chum taken on Roberts
Bank in late June were larger than earlier fry and might well have beenfish from other river systems that had been rearing in the Strait ofGeorgia for a month or so (Healey, 1980). The few coho smolts takenwere probably of mixed stock origin as well.
Shiner perch
Shiner perch were primarily caught during the summer months,and were rare during the winter and spring at all three locations (Fig.15). Roberts Bank pit was found to have larger catches than lona andSteveston pit during 1980 but in 1981 more were taken at the latterlocation (p <0.05; F = 8.2). The seasonal nature of the shiner perchreflects their life cycle. Young are born between May and August(Hart 1973) and mature over the subsequent months. Newly-born young ofshiner perch were obtained at lona, Steveston, and Roberts Bank pits inJune 1980 and 1981, as shown by the distinct length modes at 30 to40 mm (Fig. 16). Few fish over 50 mm were observed in samples fromlona.
Herring
Juvenile herring catches at ail three sites show a distinct
- 9 -
seasonality (Fig. 17) which also relates to their life cycle. As larvalherring mature into the juvenile schooling stage there is a shift indiet and their habitat (Hart 1973; Levings 1983b). The catch data showthat this change coincides with a movement into the nearshore during thesummer months. Juvenile herring at lona were observed in June and July1980 and 1981, with major modes in July occurring at about 32, 46, and55 mm. There was also evidence of very small herring (25 to 30 mm) inAugust 1980 (Fig. 18a). In June 1980 and 1981 herring juveniles fromSteveston pit also showed 3 modes similar to those from lona. July andAugust samples from this location were unimodal at about 33 mm Fig.18b). Herring from Roberts Bank in June 1980 showed a small peak inabundance at about 40 mm, with a major peak at approximately 70 mm. InJune 1981 only the mode at 40 to 45 mm was evident (Fig 18c).Differences in herring catches between sites were not found to bestatistically different (p >0.05, F = 12.7), however Roberts Bank hadthe largest catches followed by Steveston and lona (Table 2).
Some of the juvenile herring using the Banks may be theprogeny of fish that spawn in the eel grass on Robert Bank.Unfortunately spawning records are scanty for this site, which has notbeen regularly monitored. It is generally acknowledged that spawning isusually very light at this location (DFO, unpublished data). There aredata from Point Roberts, about 5 km south of Roberts Bank and across theU.S. border. A moderate herring roe fishery is conducted at PointRoberts, and estimates of spawning escapements there have ranged from2075 tons (1973) to 119 tons (1982) over the period 1973 to 1982.Escapement estimates for 1979 and 1980, which would match our samplingyears for juvenile herring, were 754 and 307 tons, respectively,slightly below the 10 y average of about 806 tons (K. Buchanan,Washington Department of Fisheries (WDF), personal communication).Larvae produced from herring spawning at Point Roberts probably driftinto Sturgeon and Roberts Bank. It is also likely that the 'jack'herring (3 to 10 cm) taken on Roberts Bank are the progeny of stocksspawning on the B.C. Gulf Islands (e.g. Mayne, Galiano), directly acrossthe Strait of Georgia.
Surf smelt
Surf smelt did not show seasonal variations in abundance(Fig. 19) and ANOVA did not demonstrate a significant difference betweenlocations over both years (p >0.05, F = 1.28). Surf smelt are known(Hart 1973) to spawn on beaches during most months of the year.
Pacific sandlance
Sandlance were captured at all three sites, however so few weretaken at lona (n = 3) that they were not considered an importantcomponent of the lona fish fauna. In both 1980 and 1981, there was asignificant difference (p <0.05, F = 11.1) in catches when Steveston andRoberts Bank were compared. During 1980 Roberts Bank had the largercatches while in 1981 Steveston had the greater values (Fig. 20). Largeschools of this species were observed to avoid the beach seine, and in
- 10 -
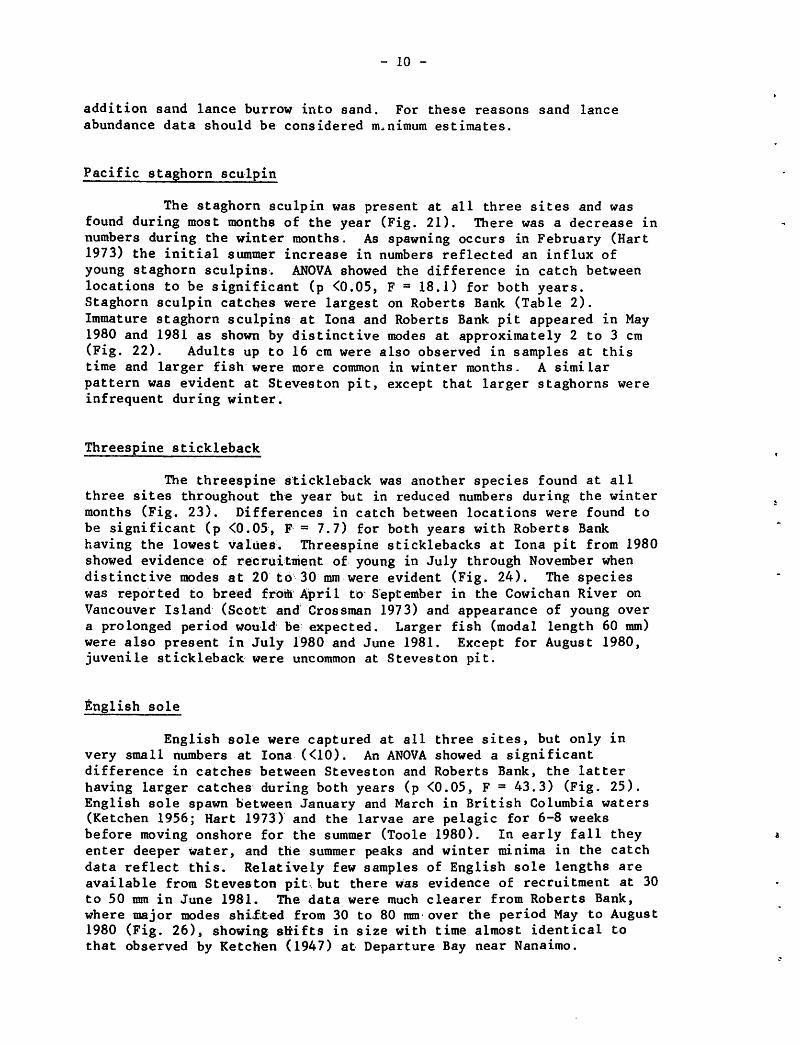
addition sand lance burrow into sand. For these reasons sand lanceabundance data should be considered minimum estimates.
Pacific staghorn sculpin
The staghorn sculpin was present at all three sites and wasfound during most months of the year (Fig. 21). There was a decrease innumbers during the winter months. As spawning occurs in February (Hart1973) the initial summer increase in numbers reflected an influx ofyoung staghorn sculpins. ANOVA showed the difference in catch betweenlocations to be significant (p <0.05, F - 18.1) for both years.Staghorn sculpin catches were largest on Roberts Bank (Table 2).Immature staghorn sculpins at lona and Roberts Bank pit appeared in May1980 and 1981 as shown by distinctive modes at approximately 2 to 3 cm(Fig. 22). Adults up to 16 cm were also observed in samples at thistime and larger fish were more common in winter months. A similarpattern was evident at Steveston pit, except that larger staghorns wereinfrequent during winter.
Threespine stickleback
The threespine stickleback was another species found at allthree sites throughout the year but in reduced numbers during the wintermonths (Fig. 23). Differences in catch between locations were found tobe significant (p <0.05, F = 7.7) for both years with Roberts Bankhaving the lowest values. Threespine sticklebacks at lona pit from 1980showed evidence of recraitTrJent of young in July through November whendistinctive modes at 20 to 30 mm were evident (Fig. 24). The specieswas reported to breed from April to September in the Cowichan River onVancouver Island (Scott and Crossman 1973) and appearance of young overa prolonged period would be expected. Larger fish (modal length 60 mm)were also present in July 1980 and June 1981. Except for August 1980,juvenile stickleback were uncommon at Steveston pit.
English sole
English sole were captured at all three sites, but only invery small numbers at lona (<10). An ANOVA showed a significantdifference in catches between Steveston and Roberts Bank, the latterhaving larger catches during both years (p <0.05, F = 43.3) (Fig. 25).English sole spawn between January and March in British Columbia waters(Ketchen 1956; Hart 1973) and the larvae are pelagic for 6-8 weeksbefore moving onshore for the summer (Toole 1980). In early fall theyenter deeper water, and the summer peaks and winter minima in the catchdata reflect this. Relatively few samples of English sole lengths areavailable from Steveston pit but there was evidence of recruitment at 30to 50 mm in June 1981. The data were much clearer from Roberts Bank,where major modes shifted from 30 to 80 mm over the period May to August1980 (Fig. 26), showing sttifts in size with time almost identical tothat observed by Ketchen (1947) at Departure Bay near Nanaimo.
r-h
H«
CO 3*
rr
3*
to 3
r-3
o Cu
CD
rr
CO
n 3 H-
3 CD
€i-
h
r-«
rr
r—
3*
CO
1 CD
CD
.OC
D
cr-«
H»
OQ
»i
i-t
CD
to co
r-h
CO
3 13
*rr
to3
*o
rC
DH
-
r-l
rr
toC
Orr
rr
3H
*
Cu
Co
^
3 O 13
CD
o CO
TJ
rt
r-t
O6
Cu
r-h
3 ftrr
rt
3*
H*
CD
< CD
r+i
H*
OC
Oi-
h3
*
r-»
TJ
toto
ri
rr
rr
(0rr
TJ
rt
CDO
3*
rt
3CD
Cu
rt
roC
OS
1-a
oto
c3
toC
Oft C
Drt
3 Cu
o
3 CO 3*
*<l-
hC
Dcr
co»n
rr
toc
nto
7f
n
CO
•»
3*
toto
»-•
3C
OC
uO
OH
-rt
3
r-h
rt
rt
3*
CD
CD
CO 3"
CO
t,O
CO
ft
rr
Oto
3rr
3H
-3
O3
3H
«co
rt
rt
r—
3*
r-
CD7
TC
D
Z »n3
^rr
O3
*co C
D> i-
trh
3O C
03
i-h
Cu
rr
cr
3*
*<
CD
Z^
O•t
«-i
Cu
rr
co3
*CD
ft1
O3
rr
toCD
3 Cu
CD
rr
o*
v<3
p, I—'
F1
•C
D </-
xv<
r-
vo
0)-*
J3
00
Cu
'<«>
'
fto
CD
rr
< H>
CO
3CD
0Qto
CO$ to
r-
aV
O
00
co3
TJ CD
CO
ftrt
H-
rt
CD
toC
OH
«rr
O 3*
Oto
r-h
r-»
toO
ftC
Drt
Oco
nn
oq
h>
h-
nto
CD
•C
u
rr>
3*
CD
*J3
CD3
*i-
tC
DC
D3
*to
m.
r-C
JQ
CO3
*O
to3
3*
CD
33
3rr
Cu
r-»
toO
33
ftC
OC
OC
u•
O i-h
Hr-
h3
*O
CDO C
u
CO
toto
33
Cu
Cu
it»
i-
3to
CO
rr
CD
CO
OO
r-h
3O
CO
H.
rr
co
Cft
MO
OQ
<C
DC
DO
»-|
3^
WtO
toto
&"« to
coco
3 TJ
toT
J O3
nc
rt
i-t
co
i-h
CDH
«»-
tco
v<
3*
to n CD
to
*-v
cr
(oO
CDrt
H*
CD
CO3
toft
!-•
Or*
-•
<3
CD
i-h
<*-
»
con>
CD
CO
H«
rr
33
CDto •-
t3
*^<
to•
3 r-'
COr-
j3
*to
CDrt
v:
Or{
H«
CD
CO
ft
fto
on
<C
uC
O(0
r-t
Cu
toto to
rr
^O rr
to »-»
coo i-
h
CD
ON
CO
TJ
rh
CD
H*
ftco
C3
*
(DC
O3
r».
a.
g
0r-
i-h
to r-l
rr
3*
rt
CD
O
<-»
rt
33
*to
to3
rr
D-
rh
CDO C
rxj
3C
Q.
ft tocr
«<:
co
rt
21
H-
01r—
«-•
•r—
rr
fD-
li
toCD
CT
rr
O 3qj
rr
r-*
rh
?0
H«
CD
CO
CO
3*
3 i—1
Cu
rt
h-
co
CD
CO
rt
3*
CO
oH
-€
rr
^rr
cr
«*•>
to3
rr
3 3JO
cr
oco
cr
1C
D"I
Ort
l-h
TO
coto
tj
toC
D3
ft7
?
coa>
coro
V-*
I—•
0Q
tor|
3to
Cu
co CO
rr
3*
cr
CDCD C
u
3V
OC
D0
0tO
3O
toft
v—•
«-«5
CDw
Cu
co Ccro
Qto
*<
OQ CD
CO
3*
CO
rt
torr
cocr
CD
H-
rt
TJ
rr
3*
toC
Dco
rr
toco
33
TT
JC
uC
DC
Drt
o
Co
CD
H«
r—rt
CD
OO
COT
J0
QC
DC
Di-
l3
toC
Dft
3 Cu
rr
3«-<
5CD
to-
CO
3co
H«
cd3
cuC
Drr
r-
rr
0Q3
*ft
i-l
CD
CD
tor-
tC
Dft
rr
coto
toC
OH
>
ftCD
3O <
Oi-
CD
i-h
O»-
tft
cdcd
toC
uC
Drr
ftH
»g
^o
CCD
3C
urt
coi-
hrt
to^d
toftO
VJ
33
*rr
0)
< CD
toC
Orr
TJ
CD
CO ft
l-h
H
•1C
DO
CO
3 JOr|
oo
CD
"I
orr
3C
Ol—
•
CO
toro
3-P
-7
?-
cr
co£
toH
«ft
I—»
3*
»-•
CD
•1
Vfl
/~
\
OI— V
O5»
ro
o3
o
CO O 3 rr
3*
3h
hCD
CO»-
«J0
)rr
rr
toto
to
OH
-•*
»O 3
rr 3*
toC
Drr
•'I
rr
ri
3*
toC
OC
O
CDCD
r-t
Q>
CO
to CD
ft cr
to »i
toto
TJ
ftT
Jrr
CD
CD
toi-
tn
h-
CO
N CD
rt
Cu
Ocr
cr<
<co
3*
H«
OQ 3*
ft to TJ to ft It
*•< i-
ho n H
'
CO 3*
1 CD to I-t
3r-'
OQ
cr
3co
a.
TJ
!-»•
•I
CO
o rr
CC
DC
Oft
CD
rr
Cu
CD Cu
to r-•
to3
CO
o co
h«
rt
3 tj
pi0
»-•
1r—
rr to
33
Ort
3 rr
r-h
3*
H*
CO
CO 3*
O rh
3*
torr
CT
3*
H«
CO
rr
tov-
rr
at
•to n
to 3 Cu
CO
rt
3 I-l
0Q CD
O 3 to to 3 ?T
rr
v.ft
!
CT
H-
O3
rr
Cu
3*
H-
ft
<to
CD
rr
0Q
CD
CD
rr
rt
to3
*rr
toC
Drr
Cu
rt
to3
*3
CDC
u
3 rr
rr
coto
rt
rr
rt
CO
H«
Cu
Cu
cr
t—•
to CO
N oto
3 coC
O CO
cr
i-h
co rr
Jjd
toO
3cr
rt
roH
«r|
tort
r-»
CO
O O Z t-«
a CO
M O z CO
ftto
rt
co
CD
TJ
Cu
to 3H
«3
3H
-
KO
Qto •1
TJ
rr
Ot
n»
—H
«vO
O"«
JC
u
^-'O
i-h
i-h
Orx
ji-
lC
Dcr
^Oil
33
0Q
toCO
r-f
rt
vc-
CO
rt
OO
3 3>
Cu
TJ
•ii
CD
CO
(-1
.to
rr
c1
CD<
I—<
CDH
«(D
3C
DC
DH
«1
rr
r-»
OC
DH
«3
CO3
TJ
r—
H«
vOft
>0
0r—
cr
CD3
O
3•-
Ovo
Cu
00
CD
OC
O
to
to9
rr
Cu
ro
r—
Ovo
00
»»
—3 C
uto
i-h
€rr 3
*H
«CO
CO TJ
v<j
H-i
CD
toto
v:
I-l
to
CDco
Xrt
ftn
CDO
TJ
3rr
OQ
^CO
H«
rta
OQ
CD3
*•
ftto
1rt
ro
30
0!-
>•
Co
O*
rr
h-
^3
3•
CO
I--
3h
-rr
to
So
"CD
l-h
TJ to
1rr
rr
CO
3*
rr
ftC
OC
D•-
I
<3
CO
•-
"I
-3
*<to
coco
3co
rt
g(0
to<
T3
HH
-to
r—C
urr
rDrr
i_j.
3CD
3rr
2<
3CD
h«
-,3
3<
:r*
«to
I—'
D.
coco
toC
Orr
ftto
O 3•1 3 rr
riC
to co
i-t
CD
TJ O »i
rr
CD
a cr
co 3 H«
rr
3*
O ftC
Oft
H-
3
CDCD
3C
u
3 H«
rt
3*
O3
Crt
3CO
Cu
it
CO rt
Cu
CD
_i.
ft3
i-l
<CD
coto
3GO
H«
CD
VC
DH
«C
OM
CO3
OO 3
/-n
3ft
toro
3
<-vH
-ft
(D
CDrt
oI C
O
OQ
«""-
*vvi
>0
QT
J•
I—S
5I—
00
to
vo
•0
0O -
f toS
1to
OQ
i-l
CD
ft»-
|3
*i-
hI—
H«
vO
CO
00
3*
ft
O CO
X H*
CO
rt
CD
rr
TJ
3*
O co
rr
H»
3*
3C
DO
Q
CO
to3
T3
3tj
gC
DC
Dto
i-i
CDg
o,
to X
33 to
co
♦
r"
N CD<
0)
CD
cr
rt
r-v
**
CO
CO
33
3to
§.^
cr
h-«
co i-t
coco
rr
toH
-i-
l3
»"!
*<
C-«
3 3 CD
vo
i—•
CO
Oft
wo
•3 TJ O
*2
OCD
cr
3C
Drr
n-
rt
coto co
to toi-
r»3
h«
?r
co 3*
Cu
to<
rr
CD
to1 C
DC
O 3*
too
cr
<s
CD3
Cu
Cu
toto
3 rr
l-h
torr
i-»
3*
r-
i-l
Oto
33
OQ
O.
3*
O 3 rr
O*
coO
H-
rt
OQ
3*
3
v<
i-h
CD
H«
toft
rito
co3
^~N
i—•
3^
•n
v;
ro
OQ
^n
ft.
tj
to rr
to
/\
ft^1
O3
*>
^•
.o
oK
jii-
h
Oco
to*»
1rr
rr
toft
IIi-
l3
*rt
CDI—
"<
co
in
•r-h
(BU
IH
rr
-^
o 3M
r->
3O
CDC
U3
CO(0
toco
i-t
tort
o>3
3"
rr
Du
to 3JO
CO
ort
tocr
CD < CD
CO
rt
O 3O
O,
rt
OC
O£
3rr
o>O
CD
CO
rr
< CDl-
hto
coo
TJ
rr
cT
JO
3C
D3
CL
to rt
i-h
rr
OO
rt
rt
O
rr
(0 rt
r-l
rt
OC
D3 to
to to ft cr
co
CO
rr
to i-l
rt
3to
3*
o3
to<
Cu
rr
CD
i-h
Ui.
O3
3i-
hr|
<l-
hrr
CD
CO
3*
33
*C
DH
-O
i-l
Ml-
»rt
3C
DC
DC
OO
QC
OO
i—•
rt
3H
*
I-l
Orr
CO
CD
3*
3*
toC
Ln
CD
•-\
CO
H«
CD
7<o
3T
J•
1—»
OQ
CD
CD
•1to
O3
to3
t,ft
I-l
to3
*C
DJO
rr
toO
CD
33
*cr
nto
toco
3rt
1to
«•
<rr
CO
CD
CO
rr
§C
Orr
to3
**
1C
Dto
CD
<*
Cu
3V
S7
?T
JH
*
OQ
CD
3ft
rt
nO
OC
Oa
3K
•
rr
CO
rt
s~
\ft
.
H«
7*
ocr
CD
3<
3rr
3to
rt
ftrr
CD
3*
>»
•C
DC
D•
i-l
rr
3C
O
Oh
-C
Oo
rr
vO
H-
rh
3*
\J\
3rh
CO
ON
ftC
O>
-•
CD
TJ
CD
OH
«M
H«
CO
rt
33
rr
OQ
rr
OH
-r-
ftC
OH
-JO
7?
CD
OC
DH
-*3
*cr
•H
«C
D7
?C
Oi-
lC
DO
rr
r-»
h-
CO
*<C
D
- 12 -
found used the habitats in their juvenile stages, when they are growingrapidly and require most food. A comparison of invertebrateproductivity would be needed to assess if there were differences in foodproduction. A preliminary examination of diet data available (Levings,unpublished) shows that chinook appear to be a major piscivore in thefish community, and chinook smolts use forage fish such as herring,sandlance, and tubesnouts. These were widely distributed on the Banks.Like gobies in California bays and estuaries (Home 1980b) the foragespecies probably channel substantial energy from invertebrates topiscivorous fish.
In addition to expanded productivity studies, future workshould continue to evaluate loss of habitat due to man-made disruptionon the Banks. Past studies have examined the lethal and sublethal
impact of sewage (Birtwell et al. 1983) and causeways (Levings, 1980) onSturgeon Bank. In 1982 and 1983 approximately 70 ha of sand andmudflats, and 30 ha of eelgrass were obliterated for recent constructionof the Roberts Bank coal port (Fig. 1). The non-vegetated habitats arepermanently alienated. This loss of habitat may have implications forcommercially important fish stocks whose juveniles rear on Robert Banks.
ACKNOWLEDGMENTS
This study, conducted at an expansive and difficult estuary,was possible due to the collaboration of many colleagues, coauthors ofthe report where the original data are presented (Conlin et al. 1982).Thanks are also due to Dr. Alex Peden, B.C. Provincial Museum, D. Burt,and G. Sandercock for their help in verifying identification of the fishfrom the study. The manuscript was constructively reviewed by S.Macdonald, J. Westrheim and G. Hughes.
- 13 -
LITERATURE CITED
Allen, L.G., and M. H. Horn. 1975. Abundance, diversity andseason-ality of fishes in Colorado Lagoon, Alaraitos Bay,California. Estuaries Coastal Mar. Sci. 3: 371-380.
Bax, N.J., E.P. Salo, B.P. Synder, C.A. Simenstad, and W.J. Kinney.1980. Salmon outmigration studies in Hood Canal: a summary -1977p. 171-201. In: McNeil, W.J., and D.C. Himsworth (Ed.). SalmonidEcosystems of the North Pacific. Oregon State University Press.331 p.
Birtwell, I.K., G.L. Greer, M.D. Nassichuk, and I.H. Rogers. 1983.Studies on the impact of municipal sewage discharged onto anintertidal area within the Fraser River estuary, B.C. Can. Tech.Fish. Aquat. Sci. 1170 ix + 55 p.
Carl, G.C., W.A. Clemens, and C.C. Lindsey. 1959. The Fresh-waterFishes of British Columbia (3rd Edition). B.C. Provincial MuseumHandbook No. 5. Victoria, B.C. 192 p.
Clark, D.W. and J.E.McInerney. 1974. Emigration of the peamouth chub,Mylocheilus caurinus, across a dilute seawater bridge: anexperimental zoogeographic study. Can. J. Zool. 52: 457-469.
Conlin, K, B. Lawley, P. Futer, M. Kotyk, L. Jantz, B. Hillaby, R.Elvidge, B. Piercey, D. Gordon, C. Levings, K. Hutton, R.Maclndoe. 1982. Fraser estuary comparative habitat study: 1.Beach seine catches, water characteristics, and geomorphology March1980 to July 1981. Can. Data. Rep. Fish. Aquat. Sci. 340. 125p.
Greer, G.L., CD. Levings, R. Harbo, B. Hillaby, T. Brown, and J.Sibert. 1980. Distribution of fish species on Roberts andSturgeon Bank recorded in seine and trawl survey. Can. Man. Rep.Fish. Aquat. Sci.1596: 51 p.
Gordon, D.C. 1965. Aspects of the age and growth of Cymatogasteraggregata. Gibbons. M.Sc. Thesis, University of British Columbia,Vancouver, B. C. (not seen; cited in Wiebe 1968). 51 p.
Hart, J.L. 1973. Pacific fishes of Canada. Bull. Fish. Res. Bd.Canada, 180: 740 p.
Healey, M.C. 1980. The ecology of juvenile salmon in Georgia Strait,British Columbia p. 203-229 in McNeil, W.J. and D.C. Himsworth(Ed.). Salmonid ecosystems of the North Pacific. Oregon StateUniversity Press, 331 p.
Horn, M.H. 1980a. Diel and seasonal variation in abundance anddiversity of shallow-water fish populations in Morro Bay,California. Fishery Bulletin; 74(3): 759-770.
- 14 -
Horn, M.H. 1980b. Diversity and ecological roles of non-commercialfishes in California marine habitats. Cal COFI Report, Vol. XXI:37-47.
Jean, Y., A.E. Peden, and D.E. McAllister. 1981. English, French, andScientific Names of Pacific Fish of Canada. Heritage Record No.13, British Columbia Provincial Museum, Victoria, BritishColumbia. 51 p.
Ketchen, K.S. 1947. Studies on lemon sole development and eggproduction. Fish. Res. Bd. Canada, Prog. Rep. Pac. Coast StationsNo. 73: 68-70.
Ketchen, K.S. 1956. Factors influencing the survival of the lemon sole(Parophrys vetulus) in Hecate Strait, British Columbia. J. Fish.Res. Bd. Can. 13: 647-694.
Kotyk, M., G. Greer, B. Piercey, and D.K. Gordon. 1983. Fraser estuarycomparative habitat study. II. Length-weight relationship for 33species, March 1980 to July 1981. Can. Data. Rep. Fish. Aquat.Sci. (in prep.).
Leroux, J. and J.L. Luternauer. 1979. Comprehensive compilation of airphoto indices for the Fraser Delta foreshore (Point Grey toTsawwassen). 1922-1978. Geological Survey of Canada, Vancouver,B. C (Open File Report).
Levings, CD. 1980. Consequences of training walls and jetties foraquatic habitats at two British Columbia estuaries. CoastalEngineering 4: 111-136.
Levings, CD., G.L. Greer, and P. Miller. 1983. Results of preliminarymark-recapture experiments with juvenile salmonids on Sturgeon andRoberts Bank, Fraser River estuary. Can. Man. Rep. Fish. Aquat.Sci., No. 1684. 38 p
Levings, CD. 1983a. Comparative ecology of juvenile chinook(Oncorhynchus tshawytscha) at contrasting habitats on Sturgeon andRoberts Bank, Fraser River estuary (manuscript).
Levings, CD. 1983b. Some observations of juvenile herring at theFraser River estuary, British Columbia, p. 91 to 104 In: AnnualPacific Herring Workshop 1981., Can. Man. Rep. Fish. Aquat. Sci.1700. 151 p.
Levy, D.A., and CD. Levings. 1978. A description of the fishcommunity of the Squamish River estuary, British Columbia, relativeabundance, seasonal changes, and feeding habits of salmonids.Fish. Environ. Canada, Fish. Mar. Service, Man. Rep. No. 1475,63 p.
- 15 -
Levy, D.A., and T.G. Northcote. 1982. Juvenile salmon residency in amarsh area of the Fraser River estuary. Can. J. Fish. Aquat. Sci.39: 270-276.
Luternauer, J.L. 1980. Genesis and morphologic features on the westerndelta front of the Fraser River, British Columbia-status ofknowledge, p.381-396 in McCann,, S.B. (Ed). The Coastline ofCanada. Geol. Survey Canada Paper 80-10.
Miller, B.C., C.A. Simenstad, J.N. Cross, K.L. Fresh, and S.N.Steinfort. 1980. Nearshore fish and macroinvertebrate assemblagesalong the Strait of Juan de Fuca including food habits of thecommon nearshore fish. Final report of three years sampling U.S.Environmental Protection Agency, 600/7-80-027. 211 p.
Northcote, T.G., N.T. Johnston, K. Tsumura. 1978. A regionalcomparison of species distribution, abundance, size and othercharacteristics of lower Fraser River fishes. Westwater Tech.Rep. No. 14. 38 p. University of British Columbia, Vancouver,British Columbia.
Otte, G. and CD. Levings. 1975. Distribution of macroinvertebratecommunities on a mud flat influenced by sewage, Fraser Riverestuary, British Columbia. Environment Canada, Fish. Mar. Serv.Tech. Rep. No. 476. 72 p.
Samis, S.C 1977. Sampling eulachon eggs in the Fraser River using asubmersible pump. Dept. Fish. Environment, Fish. Mar. Serv. Tech.Rep. No. PAC/T-77-18: 7 p.
Scott, W.B. and E.J. Crossman. 1973. Freshwater Fishes of Canada.Bull. Fish. Res. Bd. Canada. 184. 966 p.
Smith, R.T. 1936. Report on the Puget Sound trawl investigations.Wash. Dep. Fish. Biol. Rep. 36B: 1-61 (not seen; cited in Hart1973).
Strickland, J.D.H., and T.R. Parsons. 1972. A practical handbook ofseawater analysis. Bull Fish. Res. Bd. Canada, 167: 310 p.
Toole, CL. 1980. Intertidal recruitment and feeding in relation tooptimal utilization of nursery area by juvenile English sole(Parophrys vetulus: Pleuronectidae). Env. Biol. Fish., 5(4):383-390.
Tutty, B.D. and F.Y.E. Yole. 1976. Overwintering chinook salmon in theupper Fraser River system. Fish. Mar. Serv. Man. Rep. 1460. 24 p.
Western Canada Hydraulic Laboratories (WCHL), 1981. Report on hydraulicmodel studies for Roberts Bank Port Development. Prepared forNational Harbours Board, Vancouver. 42 p. + figures, appendices.
Wiebe, J.P. The reproductive cycle of the viviparous sea perch,Cymatogaster aggregata Gibbons. Can. J. Zool. 46: 1221-1234.
17 -
Table 1. Summary statistics for fish catches on Sturgeon and RobertsBank over the period March 1980 to July 1981.
Ioria Steveston Roberts Bank Total
Number of hauls 111 80 135 326Total catch 9426 11223 41940 62589CPUE 84.9 140.3 310.7 191.9Number of species 27 25 52 57
- 18 -
Table 2A. Ranked abundance of species taken by beach seine at lona pit,March 1980 to July 1981 (111 hauls) (* indicates species also found atSteveston and Roberts pits)
Species Number of individuals
Starry flounder *
Threespine stickleback*
Pacific herring*
Shiner perch*
Pacific staghorn sculpin*
Arrow goby
Chinook salmon*
Surf smelt*
Chum salmon*
Pacific snake prickleback*
Pink salmon*
Tube-snout*
Coho salmon*
English sole*
Cape1in*
Crescent gunnel*
Peamouth chub
Spinynose sculpin
Smoothhead sculpin
Pacific sanddab
Pacific sandlance*
Bay pipefish*
Saddleback gunnel
Buffalo sculpin
Kelp greenling
Tidepool sculpin*
Largescale sucker
Unidentified specimens
Total
2070
1416
13dl
1320
1145
1084
406
199
103
80
74
38
10
9
8
8
6
4
4
3
3
2
2
9,426
CPUE
18.65
12.76
12.44
11.89
10.32
9.77
3.66
1.79
0.93
0.72
0.67
0.34
0.09
0.08
0.07
0.07
0.05
0.04
0.04
0.03
0.03
0.02
0.02
0.01
0.01
0.01
0.01
0.42
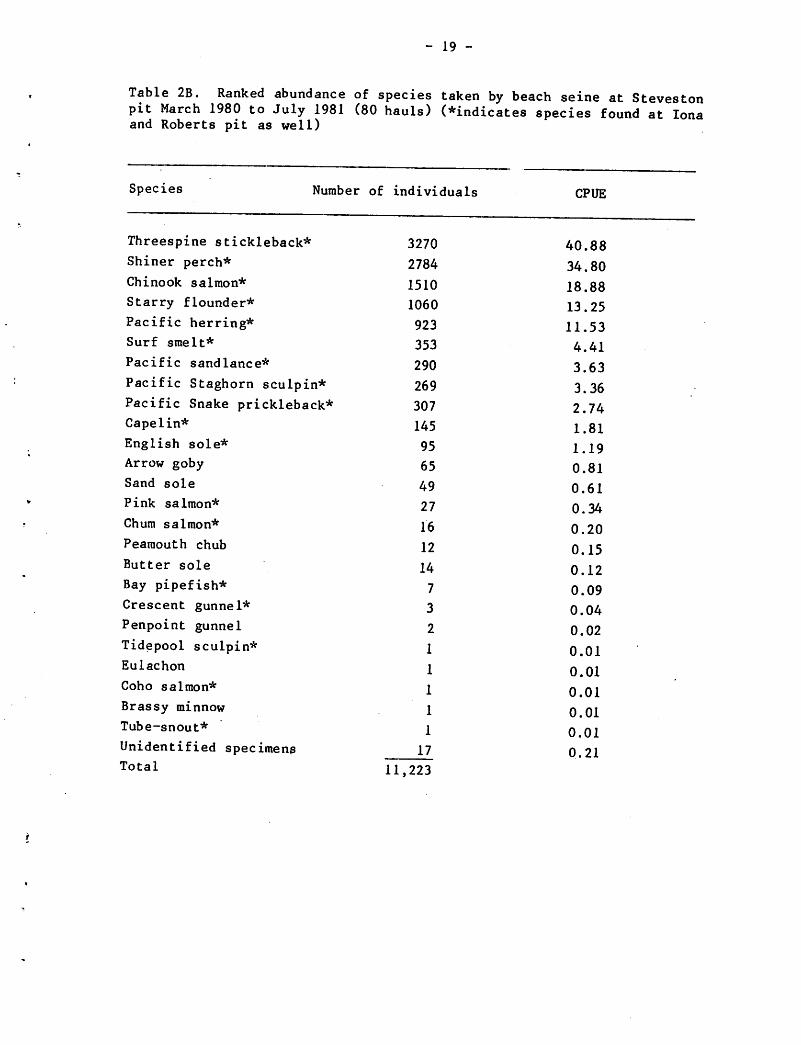
- 19 -
Table 2B. Ranked abundance of species taken by beach seine at Stevestonpit March 1980 to July 1981 (80 hauls) Vindicates species found at lonaand Roberts pit as well)
Species Number of individuals
Threespine stickleback*
Shiner perch*
Chinook salmon*
Starry flounder*
Pacific herring*
Surf smelt*
Pacific sandlance*
Pacific Staghorn sculpin*Pacific Snake prickleback*Capelin*
English sole*
Arrow goby
Sand sole
Pink salmon*
Chum salmon*
Peamouth chub
Butter sole
Bay pipefish*
Crescent gunnel*
Penpoint gunnel
Tidepool sculpin*
Eulachon
Coho salmon*
Brassy minnow
Tube-snout*
Unidentified specimensTotal
3270
2784
1510
1060
923
353
290
269
307
145
95
65
49
27
16
12
14
7
3
2
1
1
1
1
1
17
11,223
CPUE
40.88
34.80
18.88
13.25
11.53
4.41
3.63
3.36
2.74
1.81
1.19
0.81
0.61
0.34
0.20
0.15
0.12
0.09
0.04
0.02
0.01
0.01
0.01
0.01
0.01
0.21
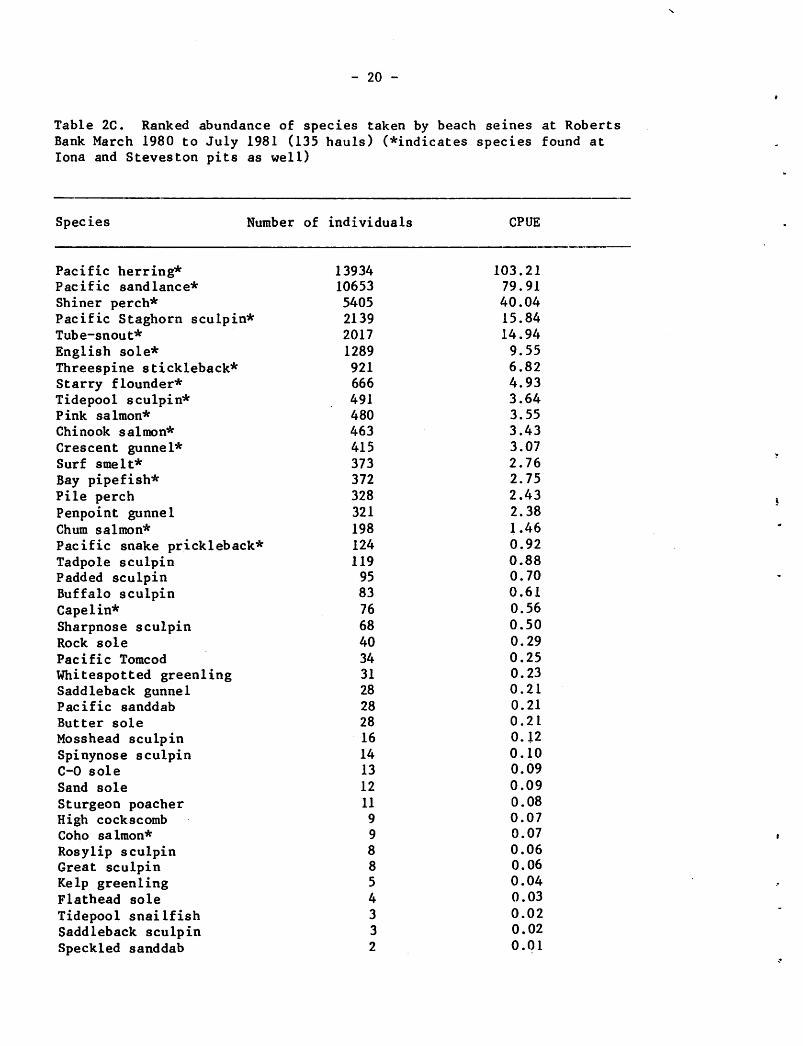
- 20 -
Table 2C Ranked abundance of species taken by beach seines at RobertsBank March 1980 to July 1981 (135 hauls) Vindicates species found atlona and Steveston pits as well)
Species Number of individuals
Pacific herring*Pacific sandlance*
Shiner perch*Pacific Staghorn sculpin*Tube-snout*
English sole*Threespine stickleback*Starry flounder*Tidepool sculpin*Pink salmon*
Chinook salmon*
Crescent gunnel*Surf smelt*
Bay pipefish*Pile perchPenpoint gunnelChum salmon*
Pacific snake prickleback*Tadpole sculpinPadded sculpinBuffalo sculpinCape1in*Sharpnose sculpinRock sole
Pacific Tomcod
Whitespotted greenlingSaddleback gunnelPacific sanddab
Butter sole
Mosshead sculpinSpinynose sculpinC-0 sole
Sand sole
Sturgeon poacherHigh cockscombCoho salraon*
Rosylip sculpinGreat sculpinKelp greenlingFlathead sole
Tidepool snailfishSaddleback sculpinSpeckled sanddab
13934
10653
5405
2139
2017
1289
921
666
491
480
463
415
373
372
328
321
198
124
119
95
83
76
68
40
34
31
28
28
28
16
14
13
12
11
9
9
8
8
5
4
3
3
2
CPUE
103.21
79.91
40.04
15.84
14.94
9.55
6.82
4.93
3.64
3.55
3.43
3.07
2.76
2.75
2.43
2.38
1.46
0.92
0.88
0.70
0.61
0.56
0.50
0.29
0.25
0.23
0.21
0.21
0.2L
0.12
0.10
0.09
0.09
0.08
0.07
0.07
0.06
0.06
0.04
0.03
0.02
0.02
0.01
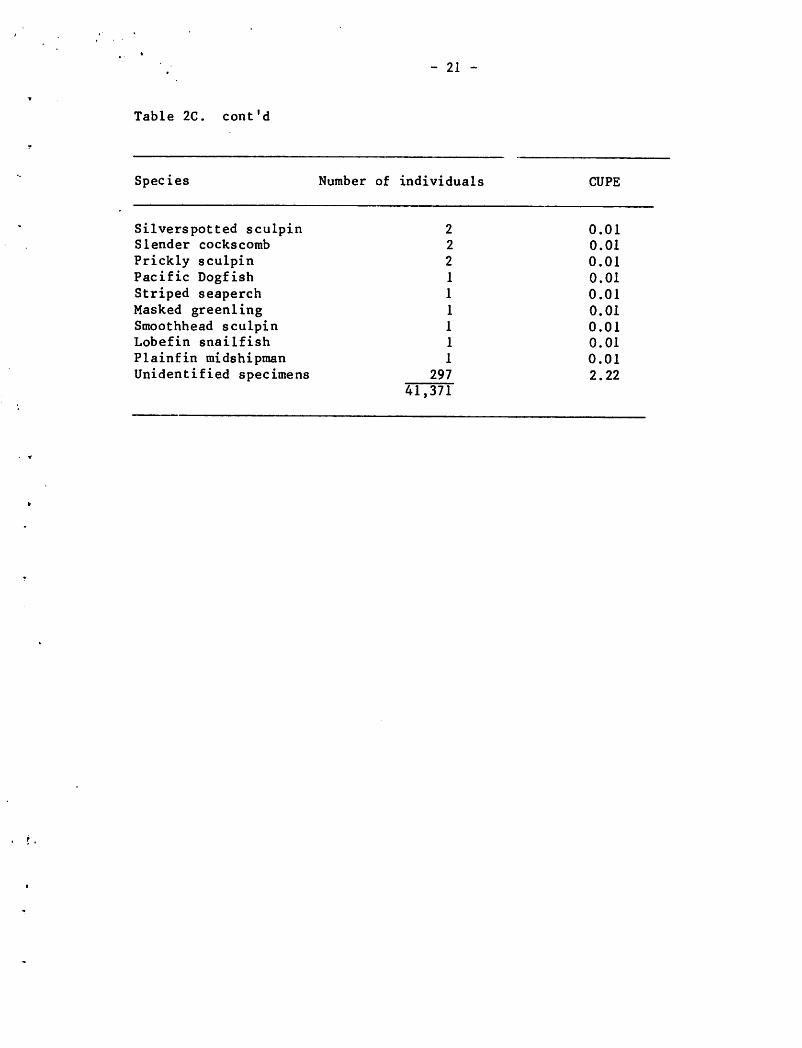
Table 2C cont'd
Species
Silverspotted sculpinSlender cockscomb
Prickly sculpinPacific DogfishStriped seaperchMasked greenlingSmoothhead sculpinLobefin snailfish
Plainfin midshipmanUnidentified specimens
- 21 -
Number of individuals
2941,37
CUPE
0.01
0.01
0.01
0.01
0.01
0.01
0.01
0.01
0.01
2.22
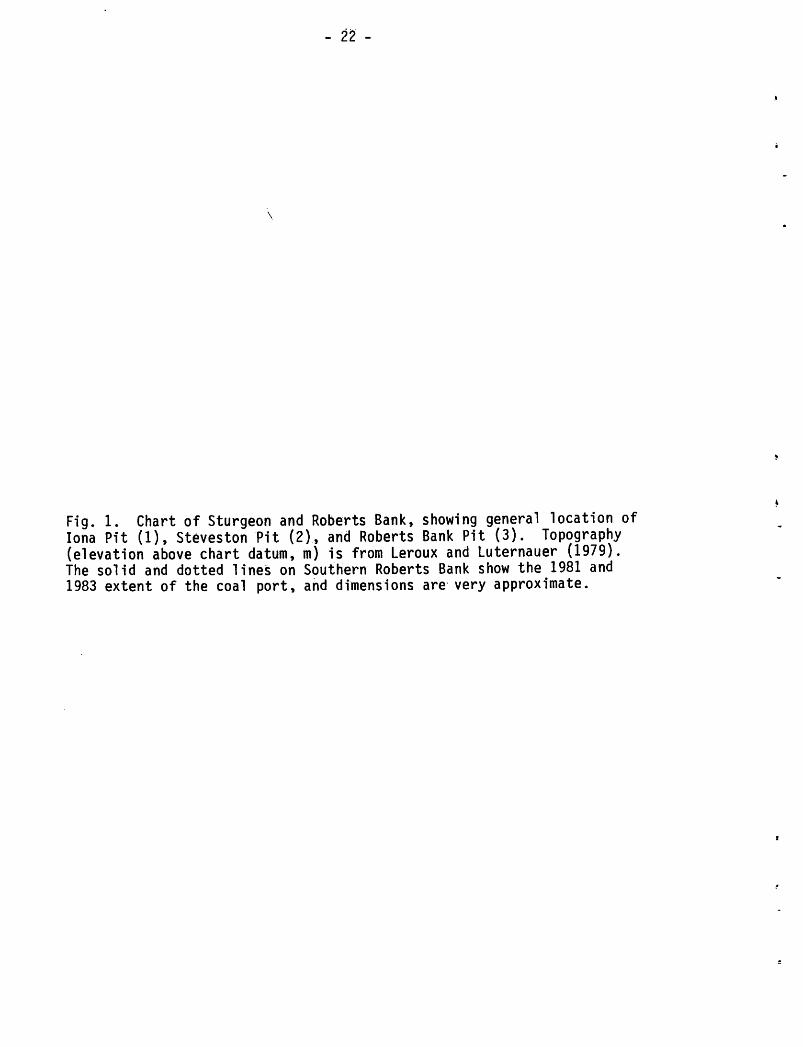
- 22 -
Fig. 1. Chart of Sturgeon and Roberts Bank, showing general location oflona Pit (1), Steveston Pit (2), and Roberts Bank Pit (3). Topography(elevation above chart datum, m) is from Leroux and Luternauer (1979).The solid and dotted lines on Southern Roberts Bank show the 1981 and1983 extent of the coal port, and dimensions are very approximate.
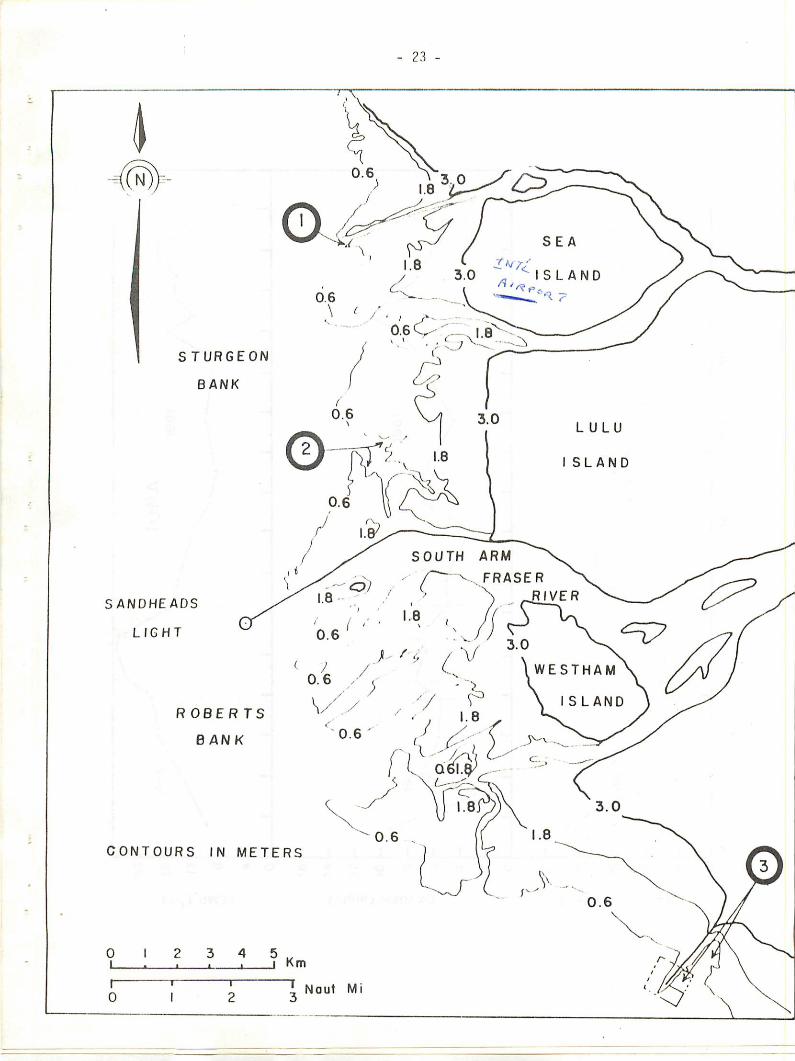
I
STURGEON
BANK
SANDHEADS
LIGHT
ROBERTS
BANK
CONTOURS IN METERS
2 3 4 5
0T~ ~~* Naut Mi
- 23 -

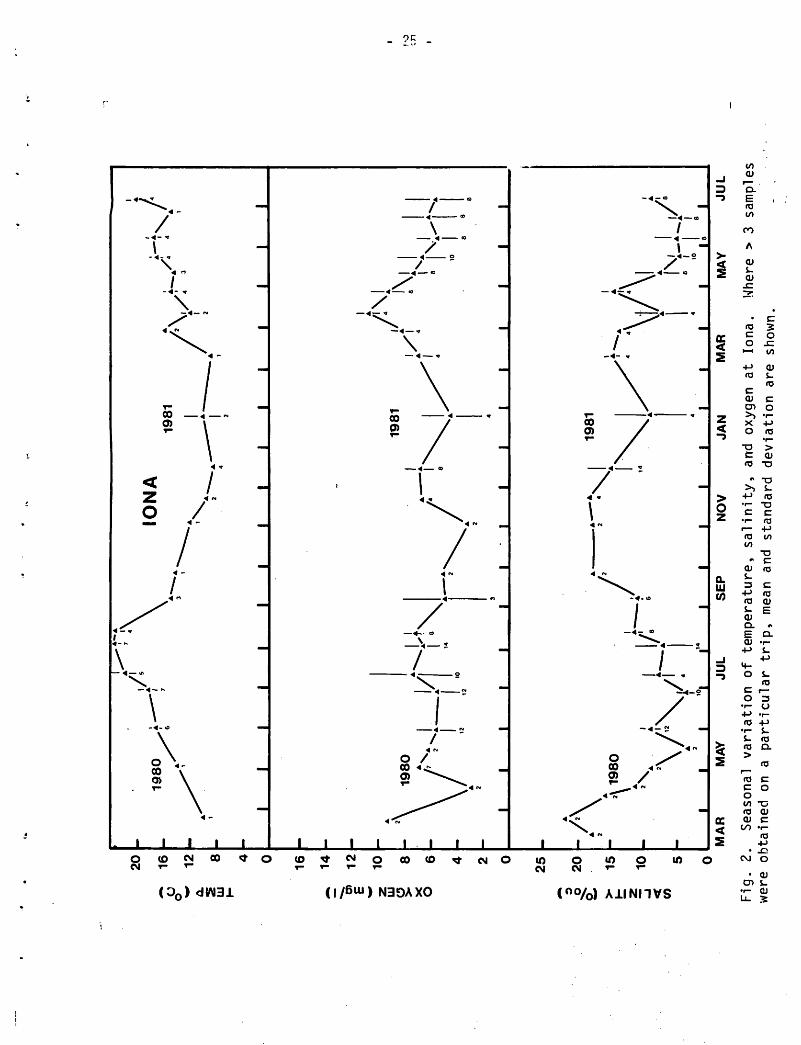
o° a.
2 HI
r-
20
16
12 8 4 2
-
25
-
19
80
JL
—J/
pH\
JI
JL
J20
-/• \
/1
5
310
k< co
MA
R
2\1
98
0 V"\/
ii
°ii14
MA
YJU
LS
EP
ION
A1
98
1:^
'i\/
\.
JL
/J
L
19
81
Fig
.2
.S
easo
nal
vari
ati
on
of
tem
per
atu
re,
sali
nit
y,
and
oxyg
enat
lon
a.W
here
wer
eob
tain
edon
ap
arti
cula
rtr
ip,
mea
nan
dst
anda
rdde
viat
ion
are
show
n.
in

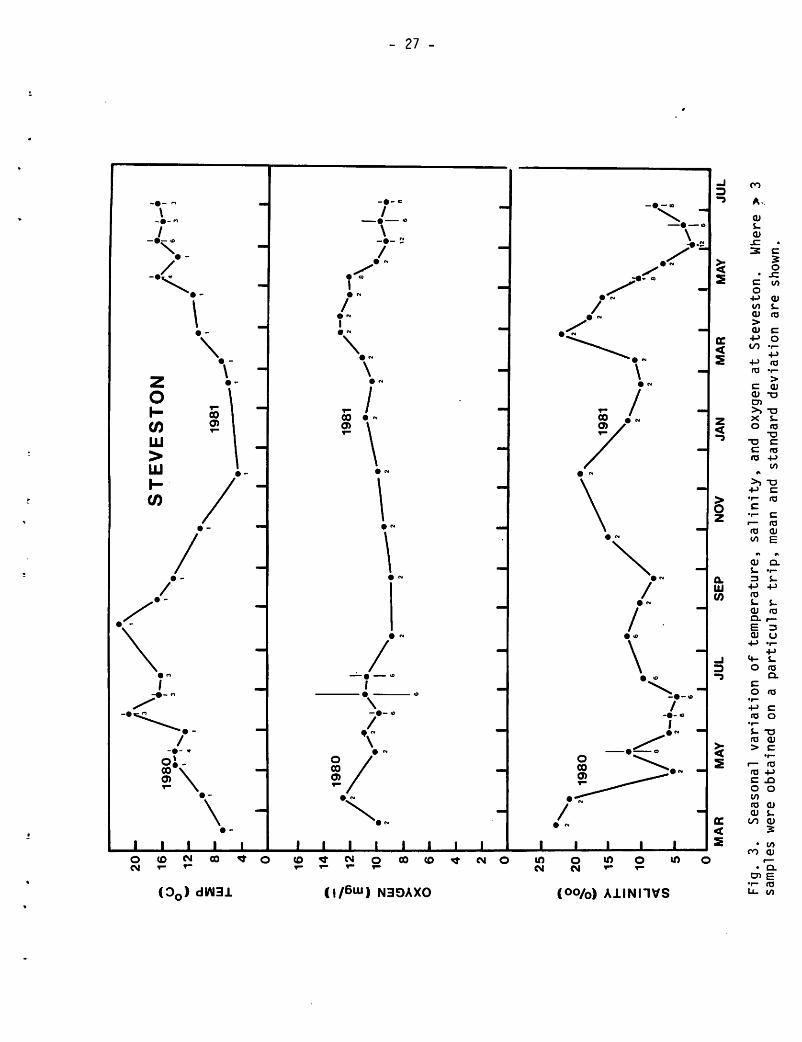
oo
OL s LU
20
16
12 8 4
16
~1
4h
"|12
z UJ
o >-
X o
10 8 6 4 2 0
25
§20
»-
< CO
15
10 5 0
MA
R
19
80
,
/••
: JL
JL
19
80
•—
•.
•^*
\'/
JI
II
L
MA
YJU
LS
EP
ST
EV
ES
TO
N
19
81
i
JI
L
«\/l
/
<•—
•«
/*'
!"5 \
!-• J
J1
II
>i
'i
i
NO
VJA
NM
AR
MA
YJU
L
Fig
.3
.S
easo
na
lva
ria
tio
no
fte
mp
era
ture
,sa
lin
ity,
and
oxy
gen
at
Ste
vest
on
.W
here
>3
sam
ples
wer
eob
tain
edon
ap
art
icu
lar
trip
,m
ean
and
stan
dard
dev
iati
on
are
show
n.

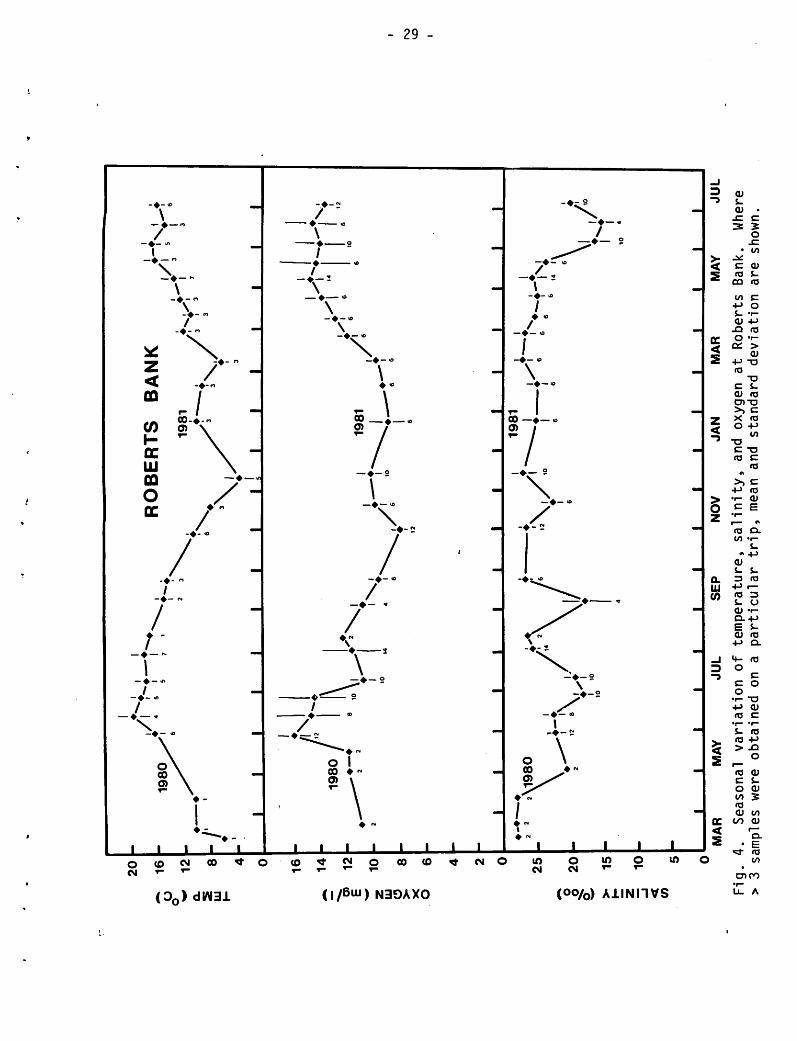
Q.
5 m I- E UJ
O >-
x O o > < CO
4h
2 0
25
20
15
10 5
♦-♦•
1
MA
R
11
1M
AY
JU
LS
EP
RO
BE
RT
SB
AN
K
****
***/♦~Nl>
TV
,
^T
^*
-. ♦-Nj
K,/
r*
--;-T t4
|\
,/;
I
NO
VJA
NM
AR
MA
YJU
L
Fig
.4.
Seas
onal
va
ria
tio
no
fte
mp
era
ture
,sa
lin
ity,
and
oxyg
ena
tR
ob
erts
Ban
k.W
here
>3
sam
ples
wer
eo
bta
ined
ona
pa
rtic
ula
rtr
ip,
mea
nan
dst
an
da
rdd
evia
tio
na
resh
own.
ro

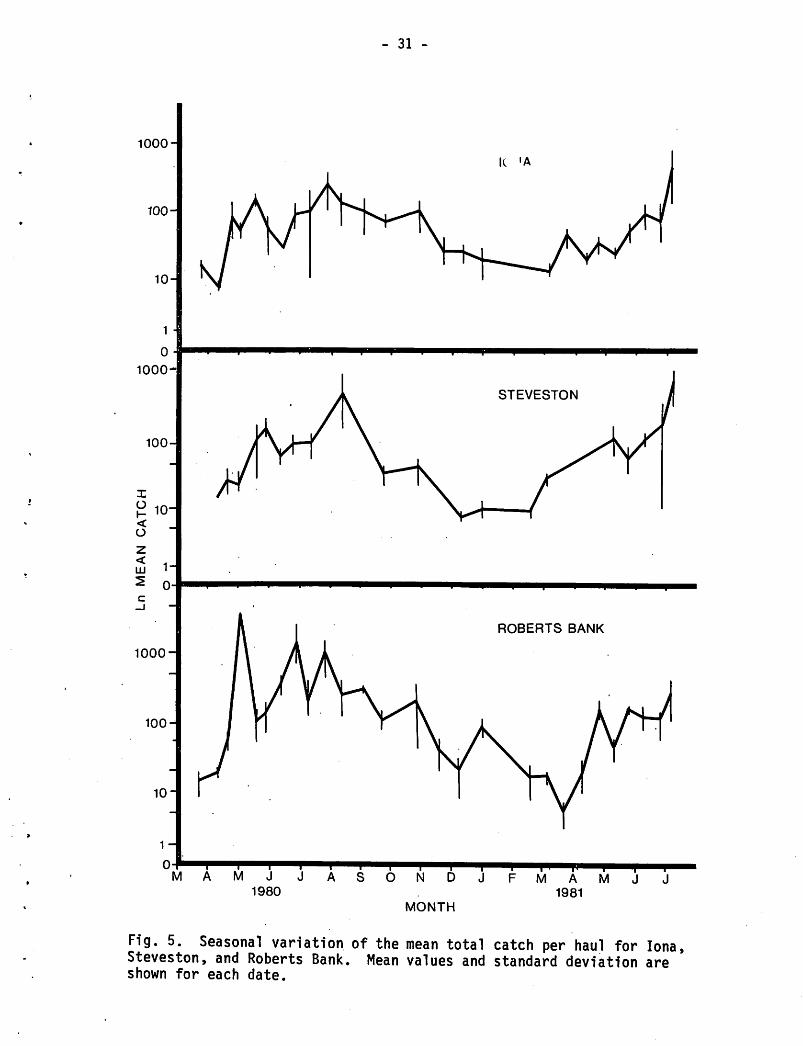
1000-
100-
10-
110-
1000-
100-
I
oI-<o
10-
£ i-
1000-
100-
10"
1-
0-1M A M J
1980
- 31 -
O N D J
MONTH
K 'A
^"^
ROBERTS BANK
MAM
1981
Fig. 5. Seasonal variation of the mean total catch per haul for lona,Steveston, and Roberts Bank. Mean values and standard deviation areshown for each date.

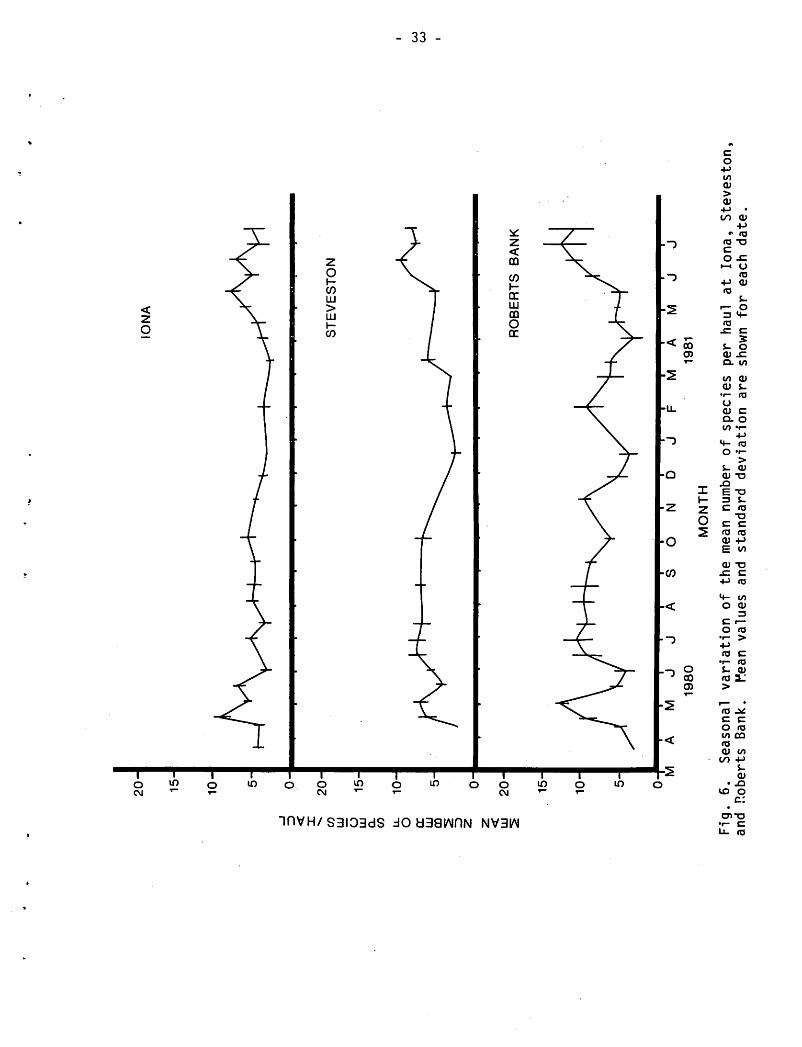
< X UJ
o UJ
Q.
W U.
O or
UJ
co
20
-
15
-
10
-
5-
0-
20
-
15
-
10
-
5-
o-
< uj
20
-
15
-
10
-
5-
o-f M
MJ
1980
MONTH
ION
A
ST
EV
ES
TO
N
m—
B^
i
M
ROBERTSBANK
A
1981
M
Fig.
6.Seasonal
variationofthemean
number
ofspecies
per
haul
at
lona,
Steveston,
and
Roberts
Bank.
Mean
values
and
standard
deviation
are
shown
for
each
date.
CO
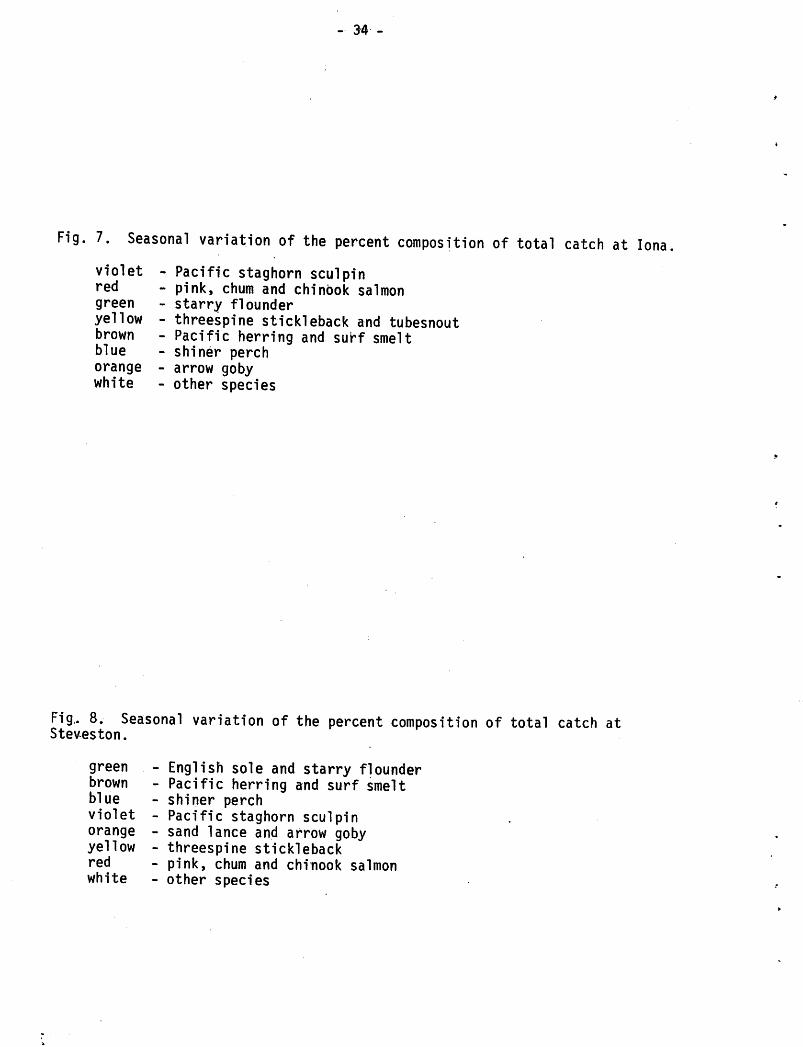
- 34 -
Fig. 7. Seasonal variation of the percent composition of total catch at lona
violet - Pacific staghorn sculpinred - pink, chum and chinook salmongreen - starry flounderyellow - threespine stickleback and tubesnoutbrown - Pacific herring and surf smeltblue - shiner perchorange - arrow gobywhite - other species
Fig.. 8. Seasonal variation of the percent composition of total catch atSteveston.
green - English sole and starry flounderbrown - Pacific herring and surf smeltblue - shiner perchviolet - Pacific staghorn sculpinorange - sand lance and arrow gobyyellow - threespine sticklebackred - pink, chum and chinook salmonwhite - other species
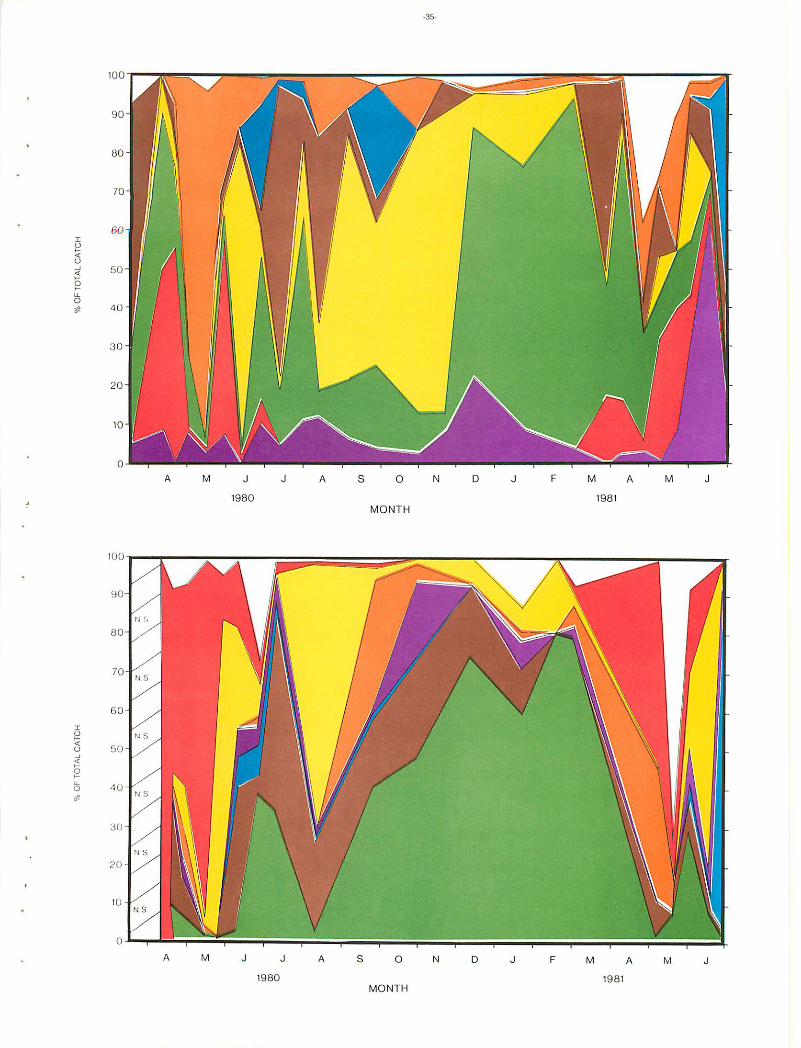
%O
FT
OT
AL
CA
TC
H%
OF
TO
TA
LC
AT
CH

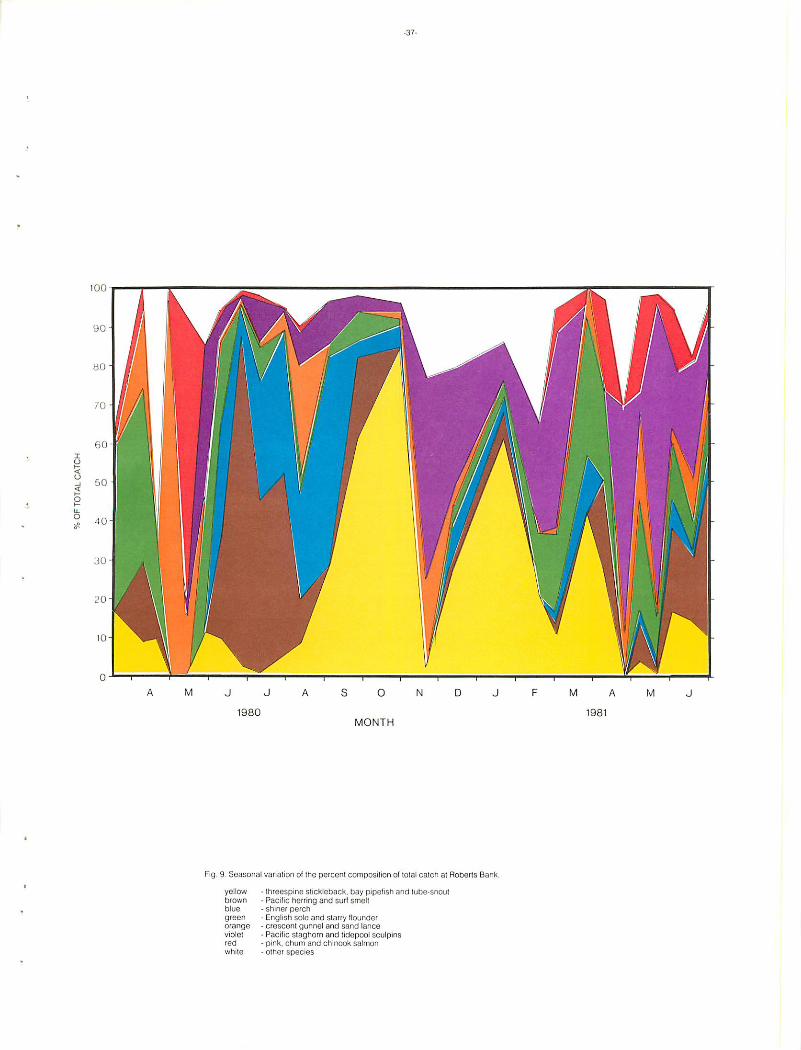
IOOt
-37-
Fig 9. Seasonal variation of the percent composition of total catch at Roberts Bank
yellow - threespine stickleback, bay pipefish and tube-snoutbrown - Pacific herring and surf smellblue - shiner perchgreen - English sole and starry flounderorange - crescent gunnel and sand lanceviolet - Pacific staghorn and tidepool sculpinsred - pink, chum and chinook salmonwhite - other species

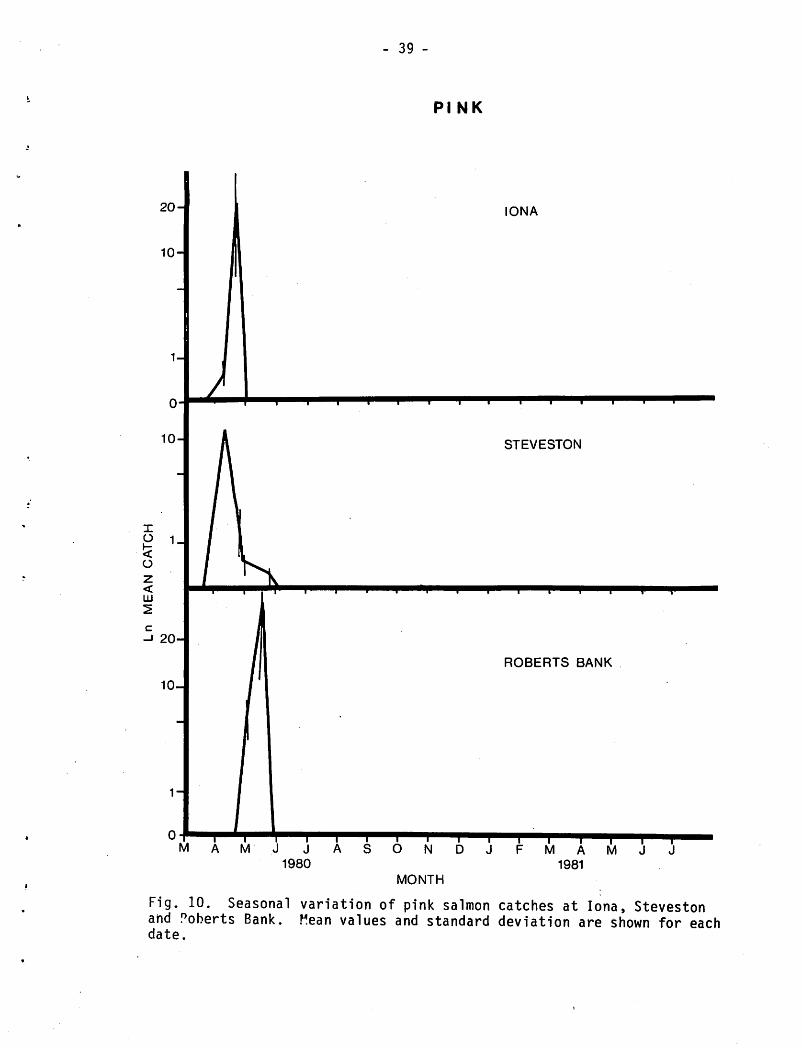
- 39 -
PINK
20-
10-
1-
^^^^^
1-
10-
1-
M O N
MONTH
IONA
t i n
STEVESTON
ROBERTS BANK
M A
1981
T—TM
Fig. 10. Seasonal variation of pink salmon catches at lona, Stevestonand foberts Bank. Mean values and standard deviation are shown for eachdate.

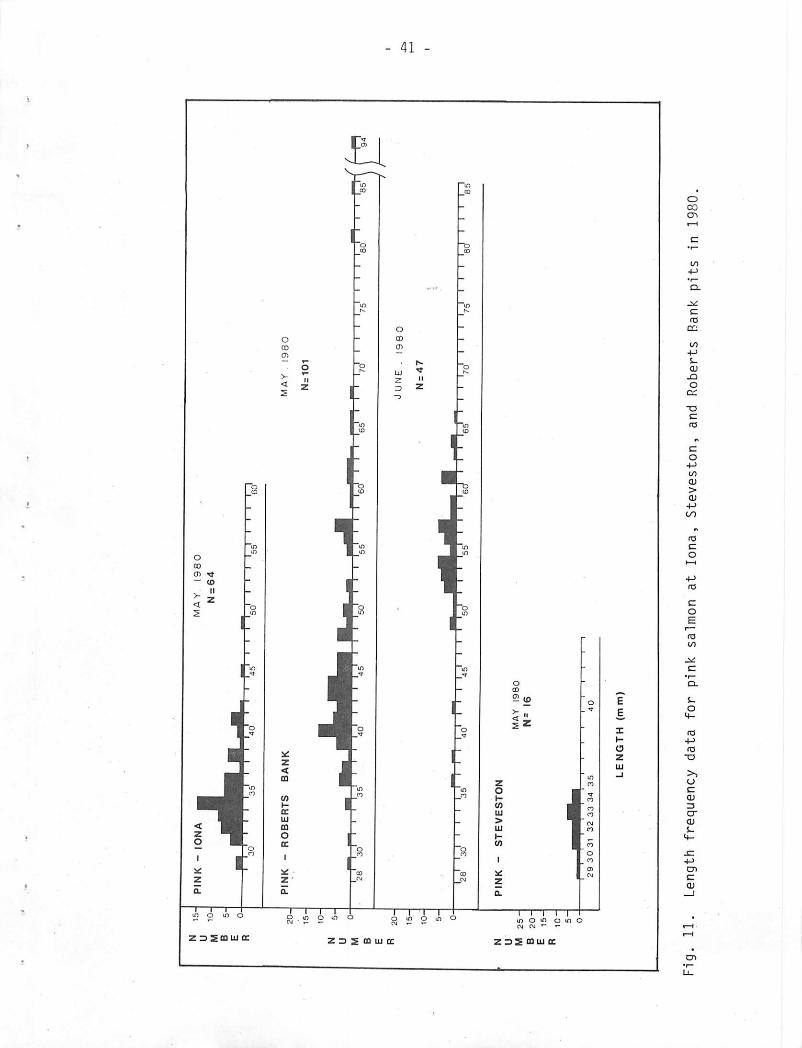
<
Fig.
II.
Length
frequency
data
for
pink
salmon
atlona,
Steveston,
and
Roberts
Bank
pits
in1980.
I 4^

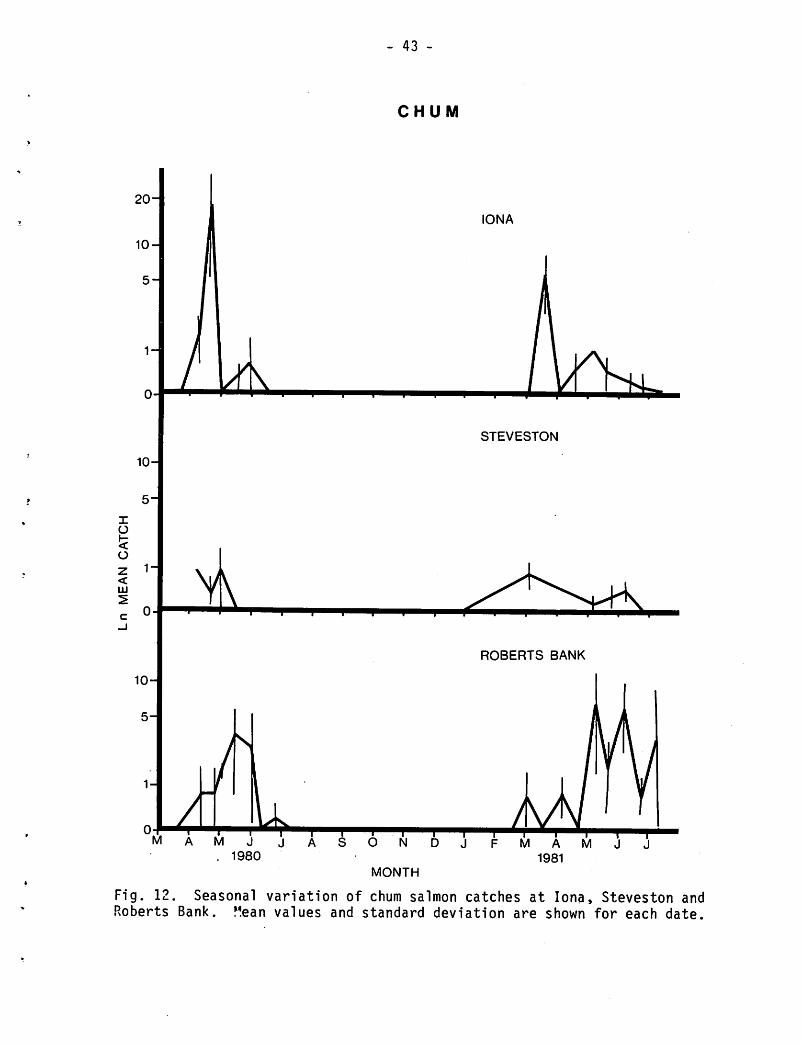
10-
5-
IO
o
z 1'<111
ID
S'
1-
0-JM
1\
M J j. 1980
- 43 -
CHUM
I IIIA S O N
MONTH
IONA
STEVESTON
ROBERTS BANK
Fig. 12. Seasonal variation of chum salmon catches at lona, Steveston andRoberts Bank. Mean values and standard deviation are shown for each date.

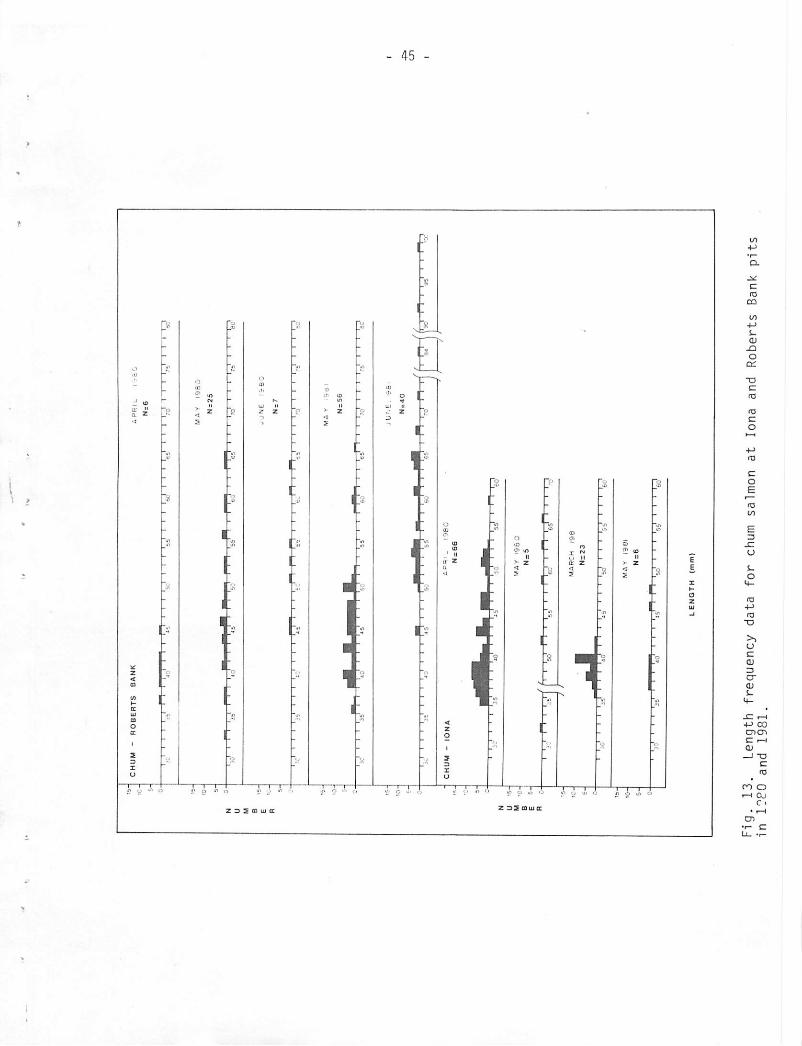
CH
UM
-R
OB
ER
TS
BA
NK
II
It
II
.1ni
riv
mi
rni
ii
i,ji
ii
i6si
ii
i^
ii
ii.s
ti
in
-ji
ii
\rb\
ii
iiM
i
n•
im
iW
iW
t:
5S
N=
25
W•
n^
ii
r^r*
ii
ii
iii
ii
i.i
ii
ili
75
80
N=
7
ji
ii
ii
ii
ii
ii
ii
rT
.ri
f™1
?"l
ii
i—i
ni
PTci
ii
ii._
ii
ii
i.ei
ii
ii_
,i
ij
ii
ii.
•f-O
-
N:5
6
Len
II
!.„!
II
III
II
III
N=
40
"l"
"I~
^it
jI
ri
r~i
nr
>:
is
CH
UM
-I0
NA
"i—
r~
T—
i—i—
r
ftP
<?!_
'98
C
N=
66
MA
Y'9
5:
N=
5
LJ
IfI
""
/
'so1
'551
'1
n.;n
y'«
1L
J
--.
JJ
10
-M
AR
CH
19
8
rfl 4
Ms
23
1';
S''
"W
'1
11
11
11
II
11
1w
l51
m-
MA
Yi9
ei
5-
N- :
6
''3S
1'
14
01
''«
'1
11
W'
'1
w
LE
NG
TH
(m
m)
-t™
r-i
Fig.
13.
Length
frequency
data
for
chum
salmon
atlona
and
Roberts
Bank
pits
in
1?80
and
1981.
4=>
en

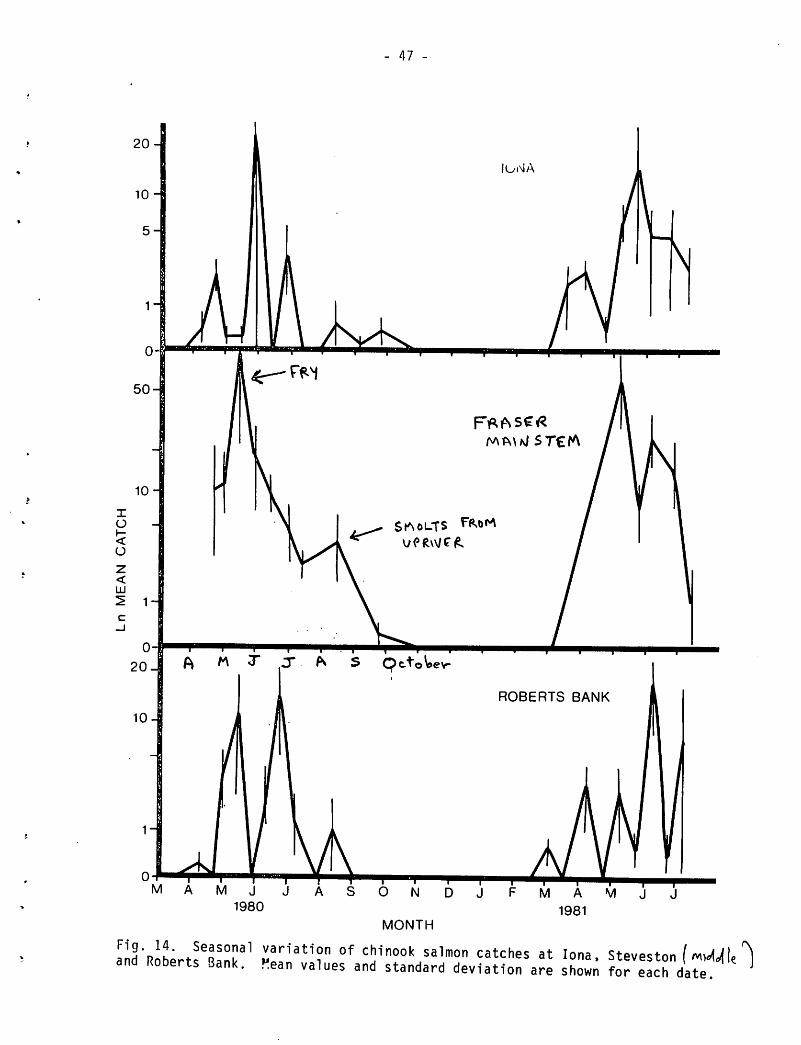
M J J
1980
47
luNA
Mr\\hJ ST£P\
SK\oLTS F*oM
A S O N D J
MONTH
ROBERTS BANK
MAM
1981
J J
a^'Rjberts^r1 ™r1at1?n of ch^°ok salmon catches at lona, Steveston (*y4J[\Aand Roberts Sank. Mean values and standard deviation are shown for each date. J

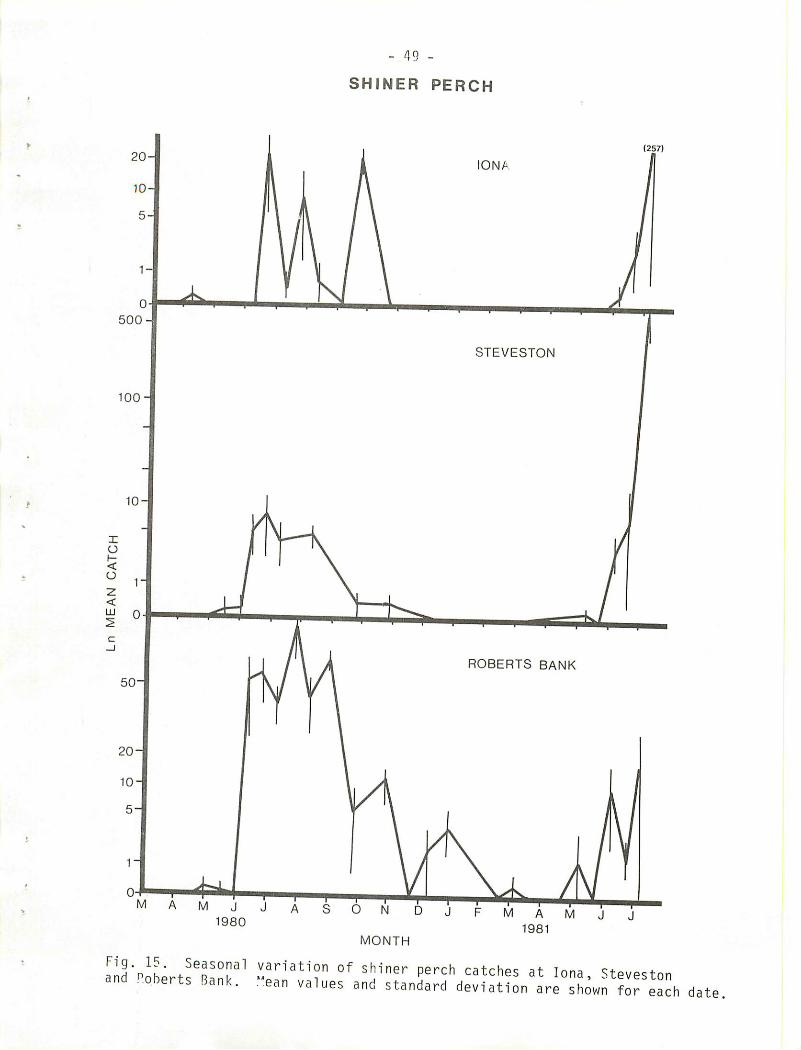
- 49 -
SHINER PERCH
MONTH1981
aFnd9*pJbertseBaSnkal %*l*V? °f S51ner perCh Catches at Iona> Steveston..oberts Bank. ..ean values and standard deviation are shown for each date

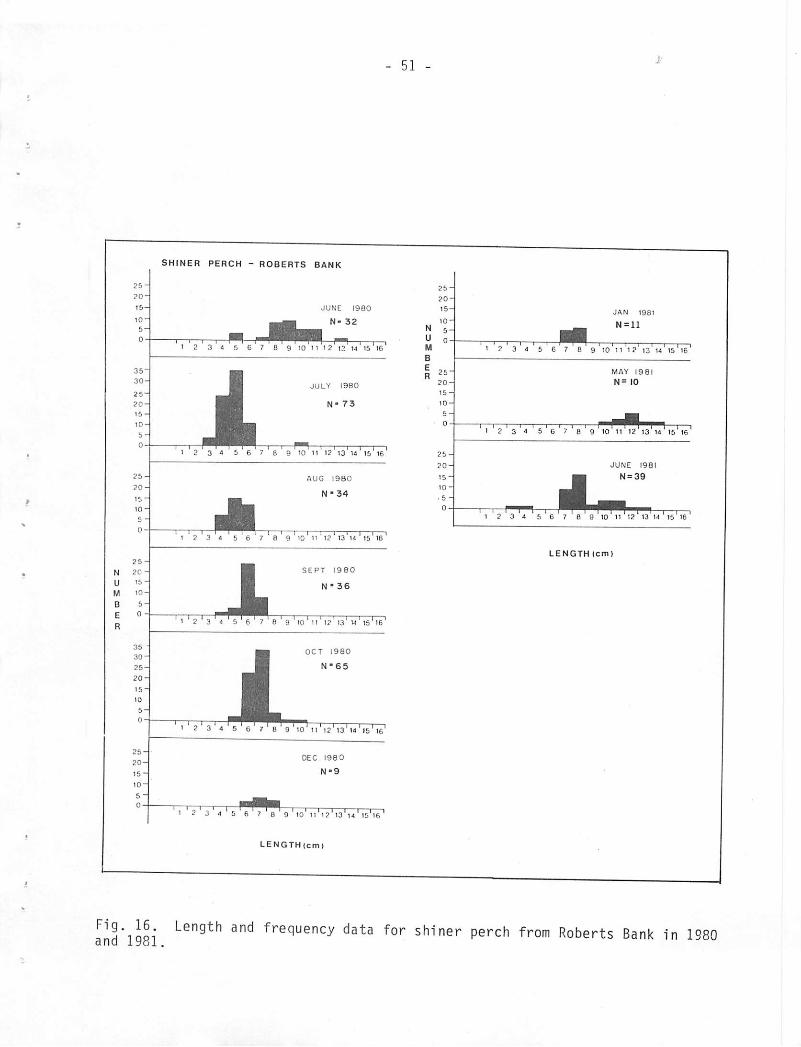
- 51 -
SHINER PERCH - ROBERTS BANK
JUNE 1980
N- 32
' 2 3 4 5 6 7 8 9 10 11 12 13 14 15 16
JULY 1980
N- 73
N-34
J*12 3 4 5 6 7 B 9 10 11 12 13 14 15 16
SEPT 1980
N" 36
ill 1 1—l1 2 3 4 5 6 7 8 9 10 11 1? 13 14 15 16
OCT I960
N-65
1 2 3 4 5 6 7 8 9 10 II 12 13 14
DEC 1980
N"9
3"4'6*617*8*9 '10' ii' i? ' 13*14 ' is'i6 '
LENGTH(cm)
25-
20
15-
10-
N 5-U oM
B
ER
20-
15-
,0'
5-
0
25
JAN 1981
'234 5 ' 6 ' 7 ' 8 ' 9 'lo'll '12' 13'14'15 ' 16'
MAY 1981
N= 10
1 '2 ' 3 '4 ' 5 ' 6 '7 'a ' 9 ' 10' 11 'l2 '13' 14 ' 15'16 '
i 1 rm 1 .1 2 3 4 5 6 7 8 9 10 11 12 13 14 15 16
JUNE I98I
N=39
LENGTH (cm)
Ha'iII; LenQth and frec1uenc^ data ^r shiner perch from Roberts Bank in 1980ana 1yoi.

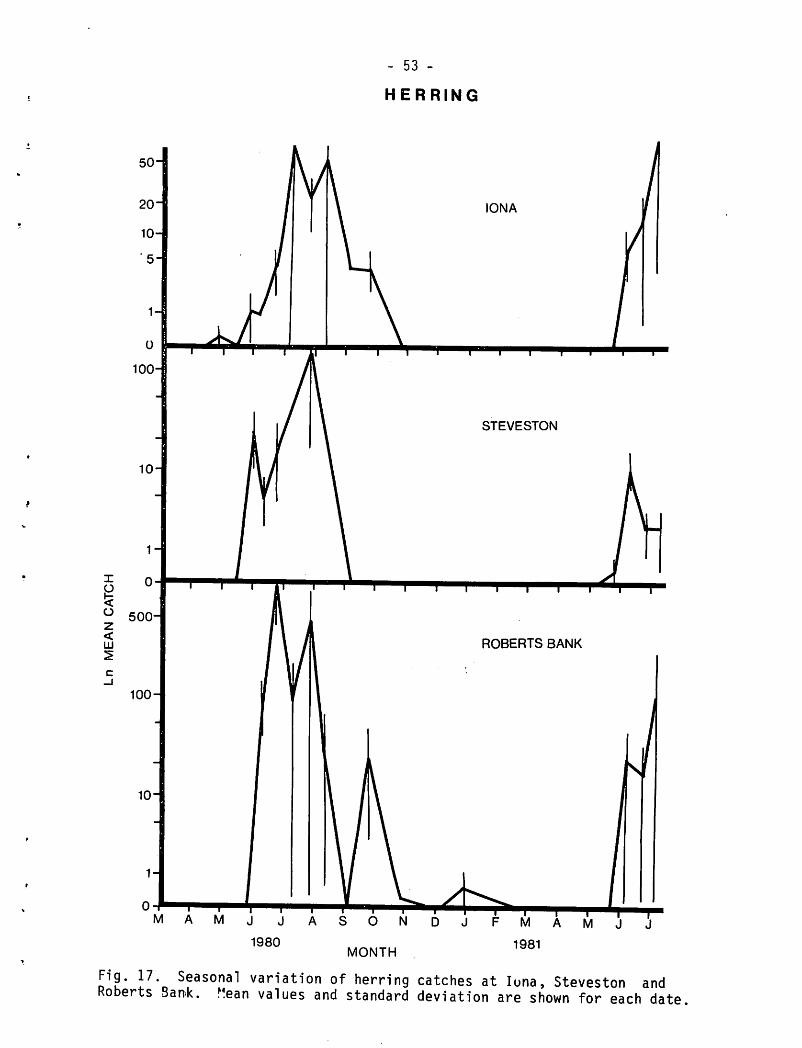
o
z<UJ
500-
100-
- 53 -
HERRING
Fig. 17. Seasonal variation of herring catches at lona, Steveston andRoberts San>k. Mean values and standard deviation are shown for each date

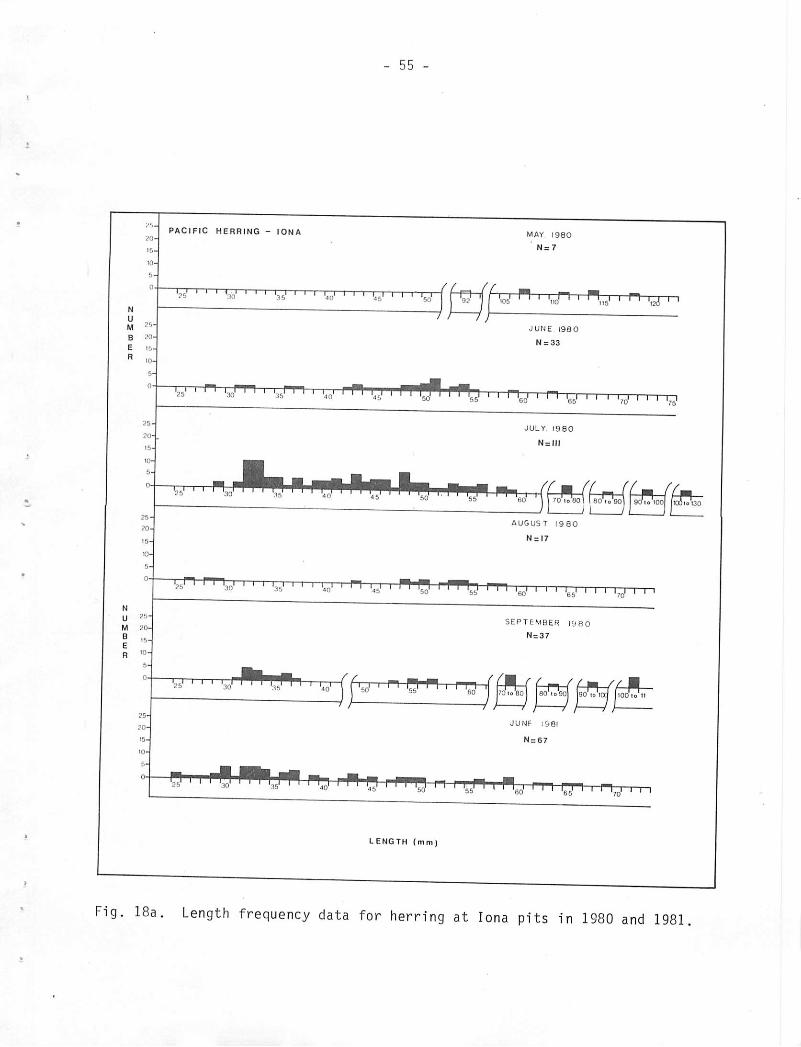
15-
10-
N
U
M ""
B 20-
E
R -oh
N
U
M
B
E
R
-
15-
••-
5-
25-
20-
15-
10-
5-
Q,
' -
5-
25-
20-
15-
10-
5-
PACIFIC HERRING - IONA
',,' i ("' i..„m i i rr25 ".TO
I.,,.I I I"
- 55 -
W ' ' '!,.,' ' ' ' 'jo'
MAY 1980
N=7
fu W i >n i H.i i105 110 W ' " ',20 '
JUNE 1980
N = 33
<o r' ' w ' • • 'sof • • • w ' i n60i i n i65i . i . i70. i . i , ,
JULY 1980
N = ll|
AUGUST 1980
N = I7
'" '45' ' ' ' 'so' ' ' ' 'ss' ' ' ' '«,' I ' ' Q I I I l70l I I I
SEPTEMBER I9H0
N = 37
II I I I I25 30- '.5ft' ' ' ' ',„
BO TOio80 80'I o90 90 tola
LENGTH (mm)
JUNF 1981
N=67
Jill
Fig. 18a. Length frequency data for herring at lona pits in 1980 and 1981.

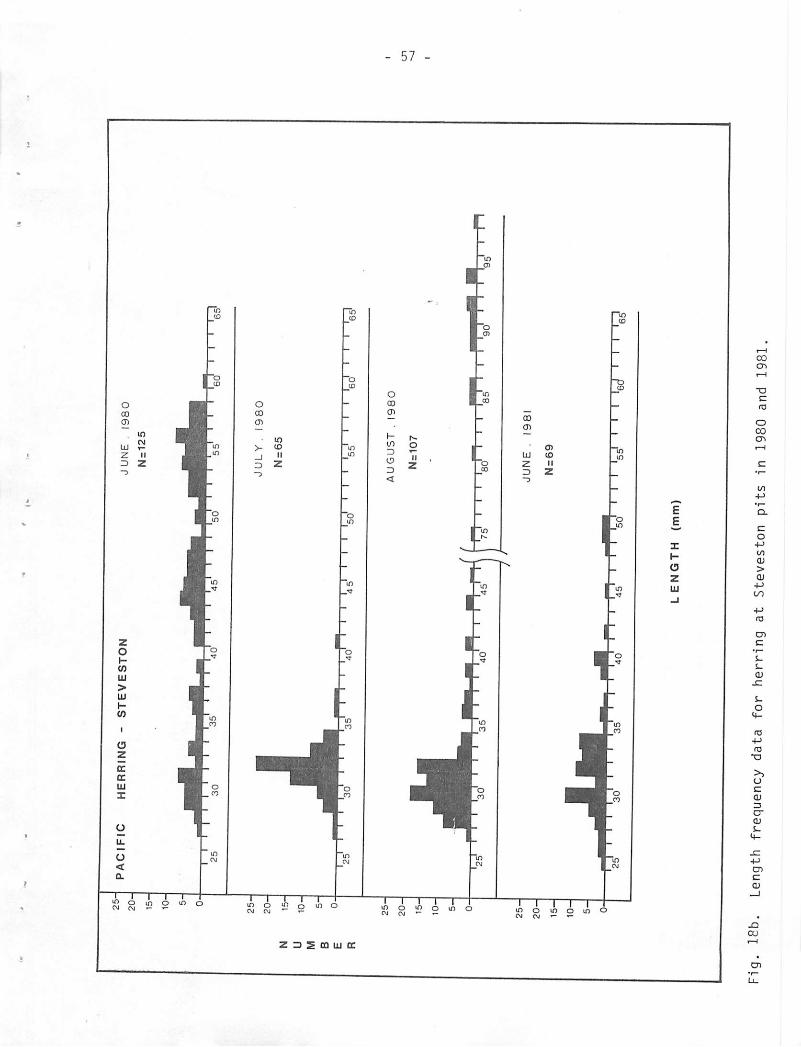
25
-
20
-
15
-
10
-
5-
0
PA
CIF
ICH
ER
RIN
G-
ST
EV
ES
TO
N
25
30
35
40
45
50
JU
NE
.I9
80
N=
12
5
55
JU
LY
.1
98
0
N=
65
60
th
r6
5'
25
-
20
-
N1
5-
1'a
nn
''
QI
'I
U'
II
LJ
II
IL
JI
I•1
55
05
56
06
5'
25
-
20
- 0'25'
'^^
o^
^S
^'
^J
*''4
5
AU
GU
ST
.1
98
0
N=
10
7
''
''8
on'
'8
5
JU
NE
.I9
8I
N=
69
90
''
•'s
s''
'i
y•
"'
y
LE
NG
TH
(mm
)
Fig.
18b.
Leng
thfr
eque
ncy
data
for
herr
ing
atSt
eves
ton
pits
in19
80an
d19
81.
c_
n
1r
95

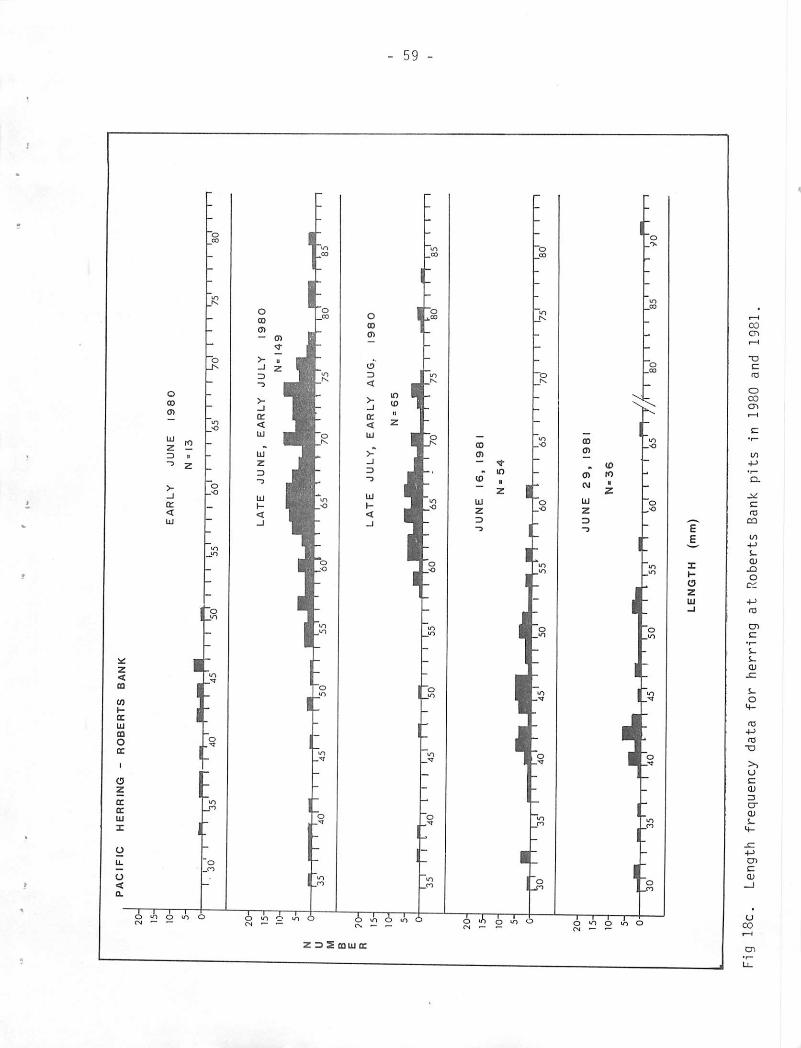
20
-
15
-
10
-
0
20
-
15
-
10 5H o-
20
-
15
-
10
-
5-
0
PA
CIF
ICH
ER
RIN
G-
RO
BE
RT
SB
AN
K
I-
EA
RL
YJU
NE
19
80
N-
13
1W
''
''so
1'
''
LA
TE
JU
NE
,E
AR
LY
JUL
Y1
98
0
N«
14
9
JU
NE
16
,1
98
1
N-
54
JU
NE
29
,1
98
N-3
6
II
II
60
LE
NG
TH
(mm
)
TT
^I
fI
80
''
''85
''
'*
V
Fig
18c.
Length
frequency
data
for
herring
atRoberts
Bank
pits
in1980
and
1981.

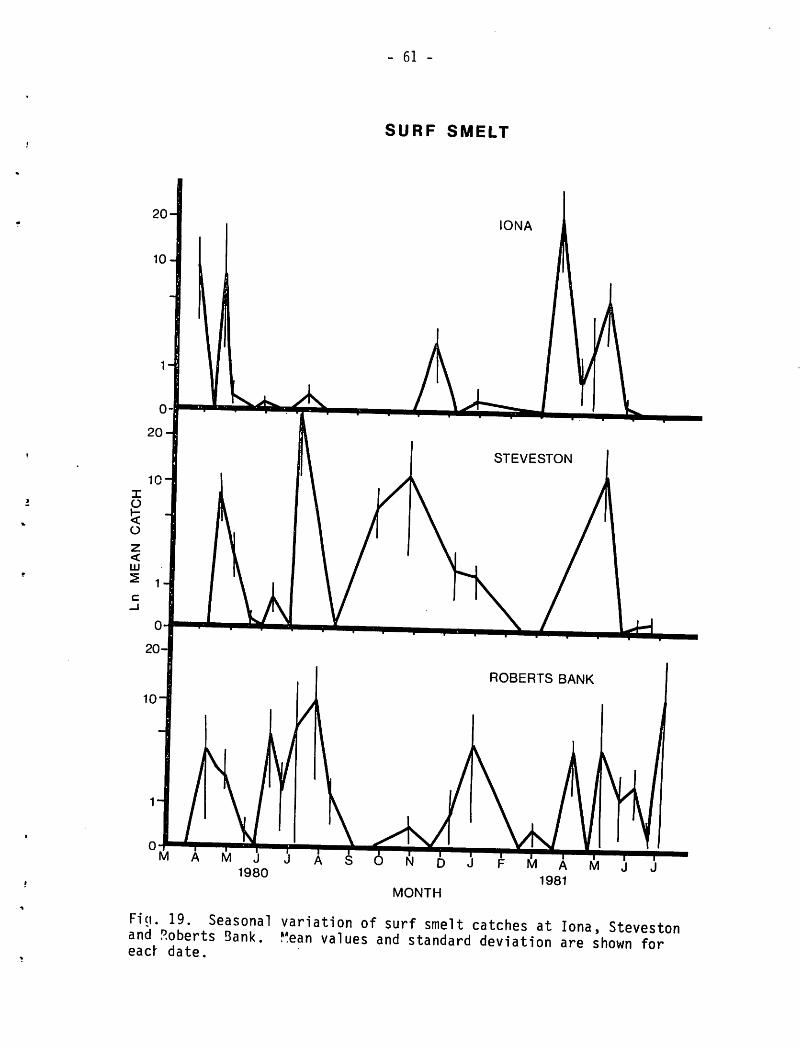
- 61 -
SURF SMELT
MONTH
1Ua'o11' ,Se^S0nal variation of surf smelt catches at lona, Stevestonand Roberts Bank. Mean values and standard deviation are shown foreacr date.

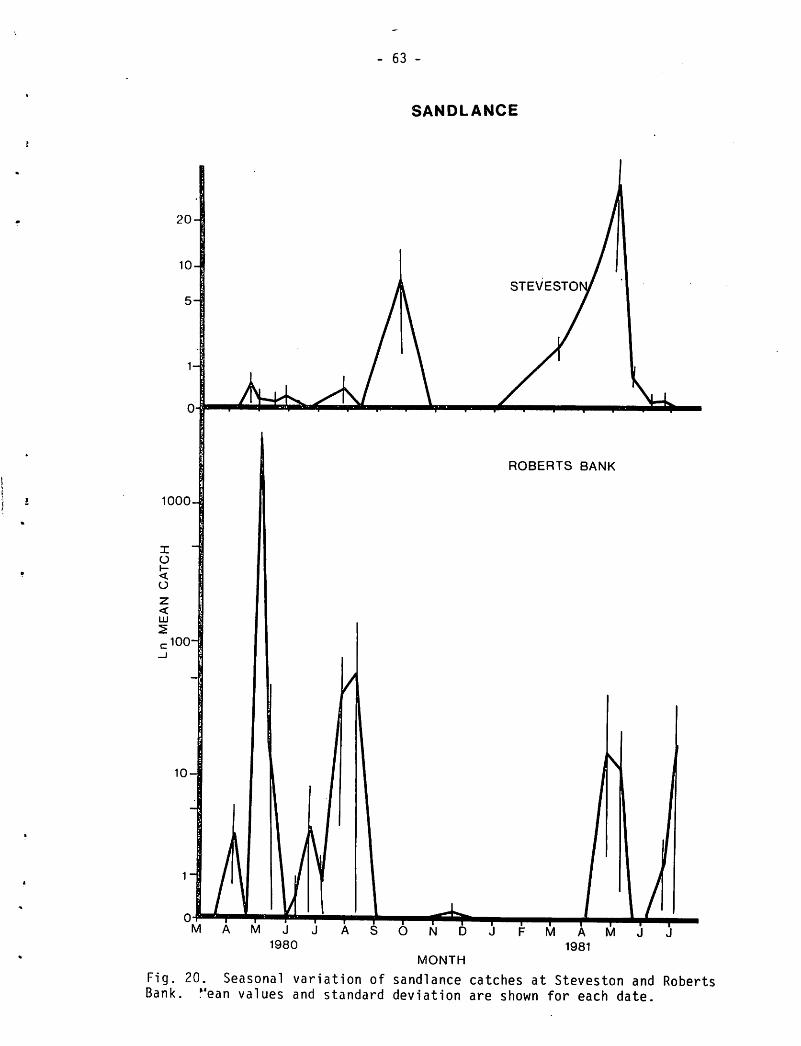
20
10-[
5-
0-
1000-
A^
JJASONDJFMA1980 1981
MONTH
Fig. 20. Seasonal variation of sandlance catches at Steveston and RobertsBank. Mean values and standard deviation are shown for each date.
- 63 -
SANDLANCE
ROBERTS BANK
-w

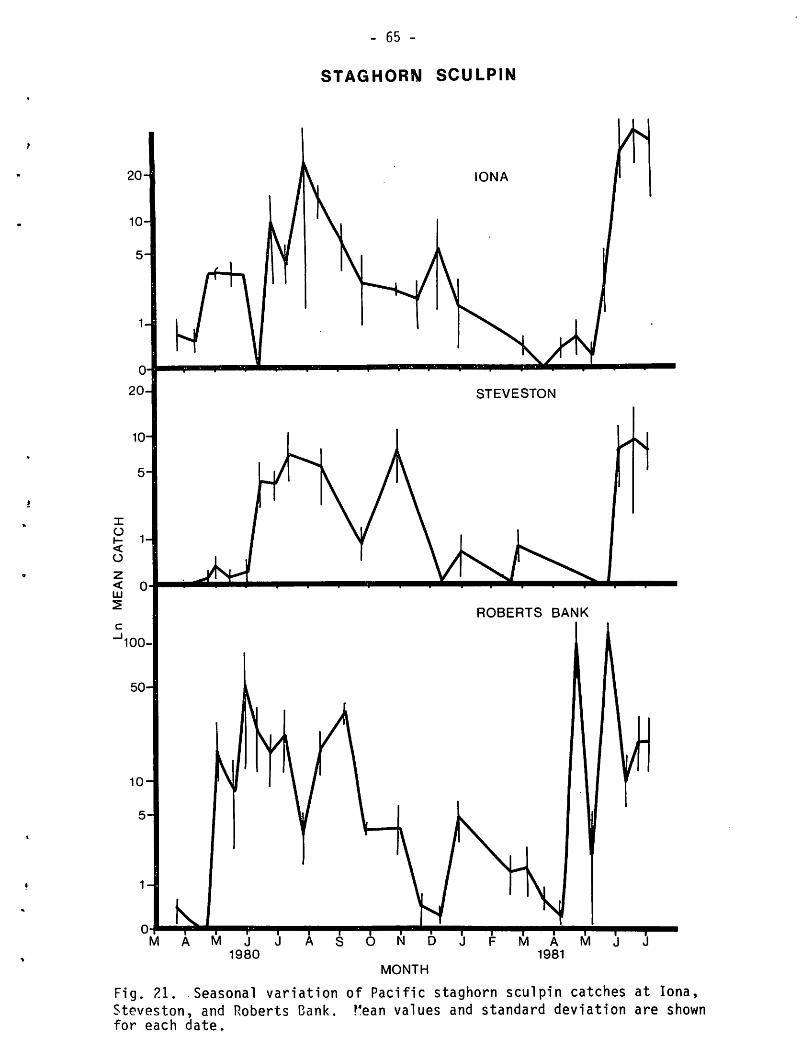
M J J1980
- 65 -
STAGHORN SCULPIN
MONTH
M A1981
Fig. 21. Seasonal variation of Pacific staghorn sculpin catches at lona,Steveston, and Roberts Bank. Mean values and standard deviation are shownfor each date.

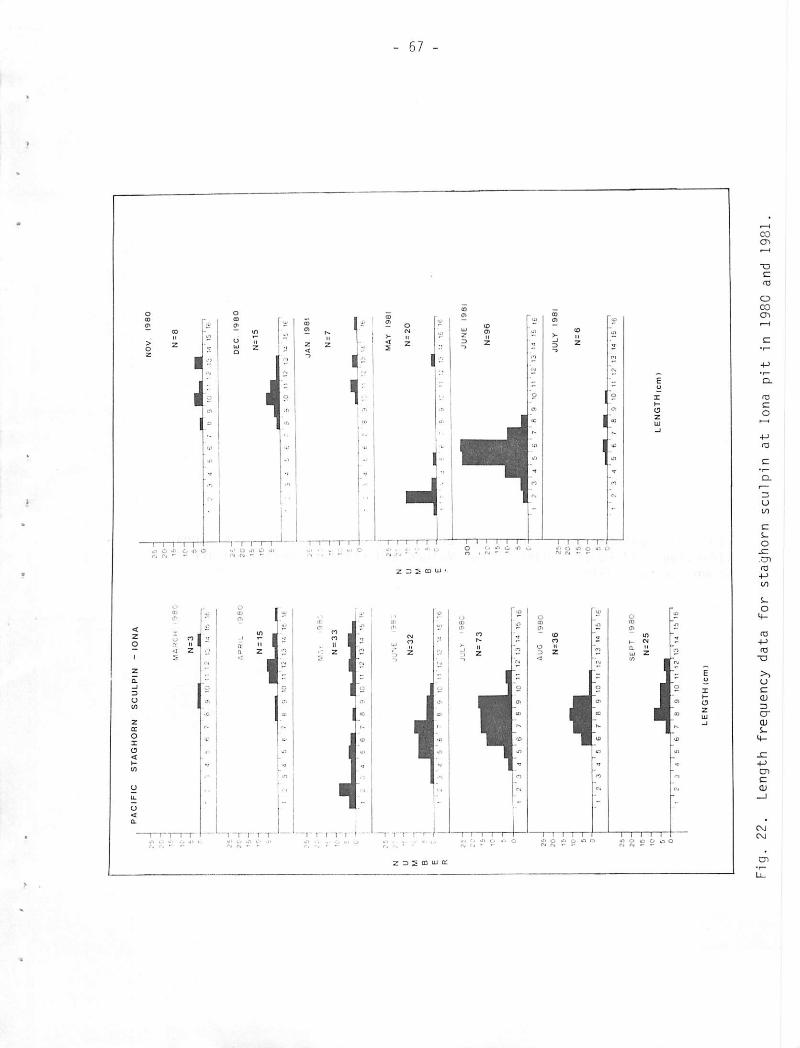
N U M B E R
PA
CIF
ICS
TA
GH
OR
NS
CU
LP
IN-
ION
A
MA
RC
H
N=
3
5-
&9
101
'•12
1514
1511
.;.
==
_
••-
N=
15
i:•
34
•.6
'8
910
'VI'
12'-
.3«
l!u
5_
98
-
•-
N=
33
-
10
II1
21
314
B5-
ICi'
l«
JUL
Y''•
M=
73
2'
3'4
56
78
910
"12
13"
1616
AU
G1
98
0
N=
36
I'
?'
34
56
78
910
1112
1314
15
'16
SE
PT
198
0
N=
25
23
45
67
89
10
111
21
314
151
6
LE
NG
TH
(cm
)
20
-
15
-
10
-
N=
8
3if
;•
•1.
'12
14'I
S'1
6'
DE
C1
98
0
N=
15
c,10
11'1
213
14'1
5if
JA
N1
98
1
N=
7
MA
Y1
98
1
N=
20
M15
K
JU
NE
19
81
N=9
6
12
'3
45
67
'6
910
1112
1314
15ig
JU
LY
19
81
N=
6
12
34
56
78
910
1112
13*
14'
1516
LE
NG
TH
icm
Fig.
22.
Length
frequency
data
for
staghorn
sculpin
atlona
pit
in198C
and
1981
en
- 68 -r
Fig. 23. Seasonal variation of threespine stickleback catches at lona,Steveston, and Roberts Bank. Mean Values and standard deviation areshown for each date.
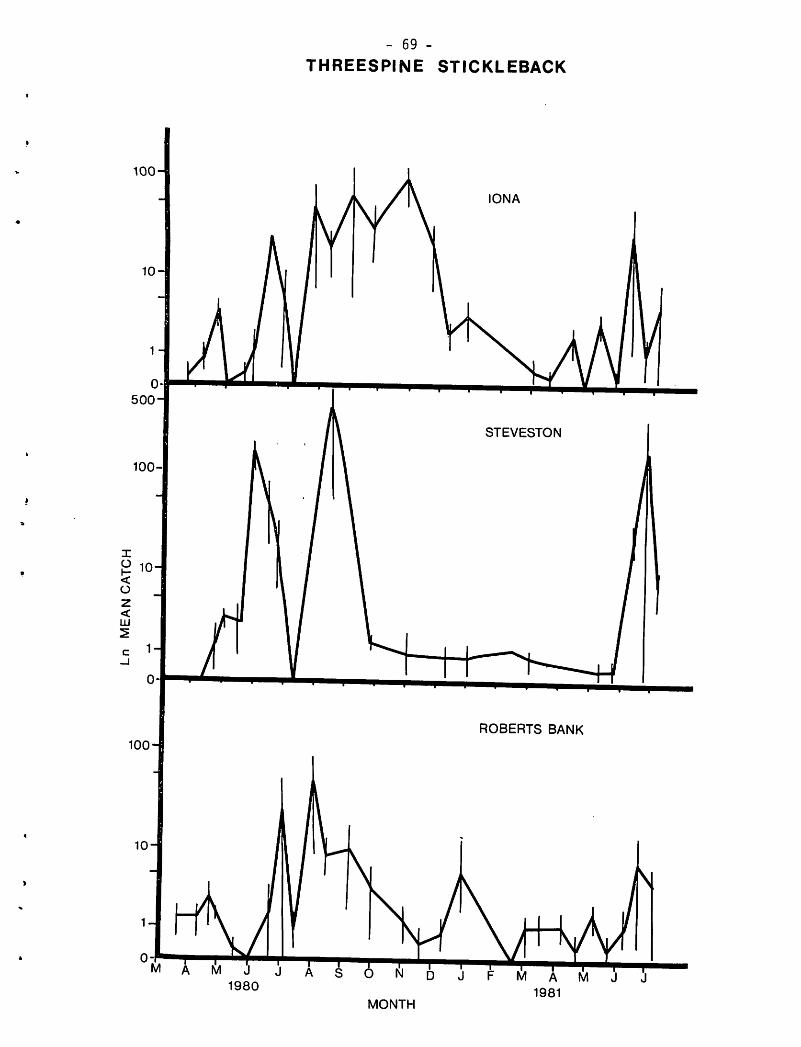
M J J
1980
- 69 -
THREESPINE STICKLEBACK
MONTH1981

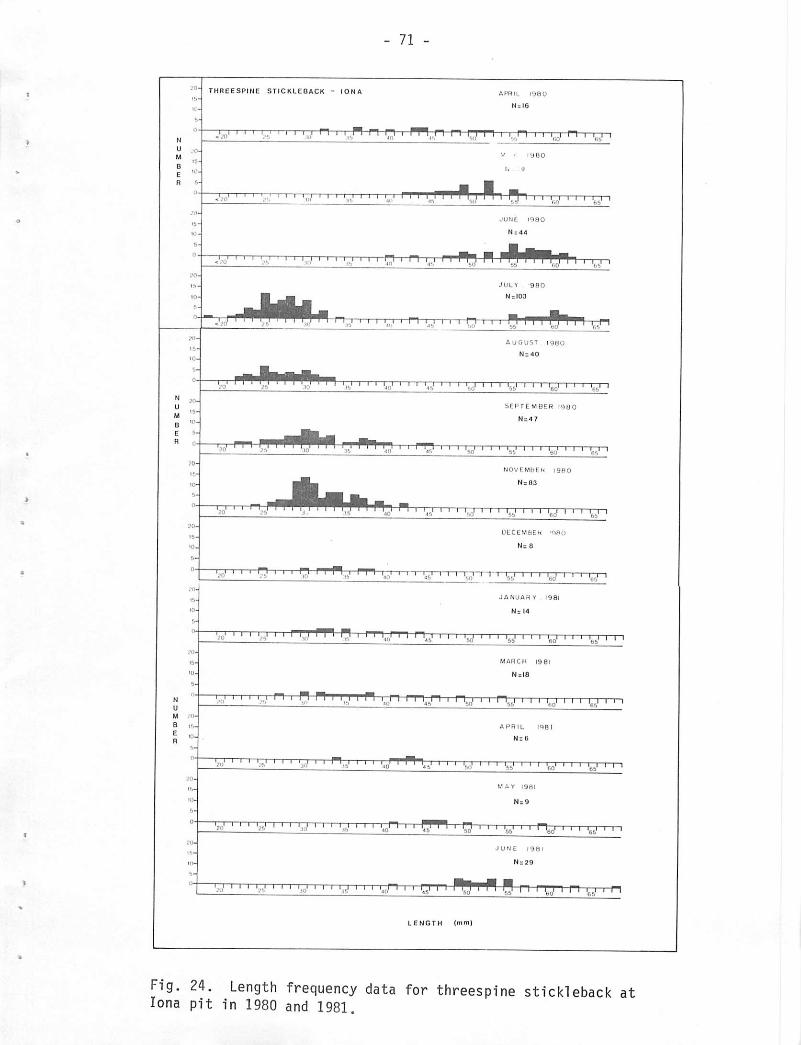
E '""
30-
15-
10-
-
-
15-
5-
-
- 71 -
THREESPINE STICKLEBACK - IONA APRIL 1080
N = I6
j.,,1 ' • ' •,.,' ' ' ' ',' n i i,,W H n i Ft*^ i i i ivi i i i in i i y n i itj i
.v • i960
i. a
i i i.i i i i i i i i i *T* ~i n i i i i
"I. I I ' l ' l ' I l I I
JUNE 1980
Nr44
•n i n i i ri ftMl 55
JULY '9R0
N = I03
,i i i i i.i i n i.i i—i i r—i i i iBO r,5
August i960
N:40
',.,' ' ' ' '.,„' ' I ' ',.J ' I I I.J I I I ltjJ I I I i6 I I I I. J I
bEFTEMBER 1980
N = 47
1 ' W ' ' ' '<>•} ' ' ' 'eo' ' ' ' W '
NOV T Ml! EH I 98 0
N=83
'4', so" ' ' ' ',,' ' ' ' ',0' ' ' ' ',,' '
DECEMBER "IPO
N=B
•n i i i n i i W i i i i V ' • • i,f} ' i ' i.,,,' i i" i i5j i i i i i i i i i ,i i
V ' ' ' ',..' ' '
JANUARY 1981
N=I4
1 H„i i i i i ,i i i i i,i i i i ii i i ' ii I I i
MARCH 1981
N = I8
i ' i i • i„i n i PI ff i ij i B ij i i i y i i n.j i i n,«.' ' ' ' W ' ' ' W ' ' '
',.,' ' I I 1,1 I I I I I I I—I I I fftT
' ' I l.„l I I ' I I I I I I I I I I I H I I30 :I5
APRIL 1981
N = 6
1 ' w ' ' ; w • • • ui~r~r~i
MAY 1981
N = 9
n i ' i '...' ' ' rv50 55
JUNE 1981
N;29
Jill I.J I I I
„' ' ' ' ';,.,' ' ' ' '.,„' ' ' ' ',,,! I ' ' ',,P I I l4Sl I I Wflh1^ B||| n n i.j i n
LENGTH (mm)
Fig. 24. Length frequency data for threespine stickleback atlona pit in 1980 and 1981.

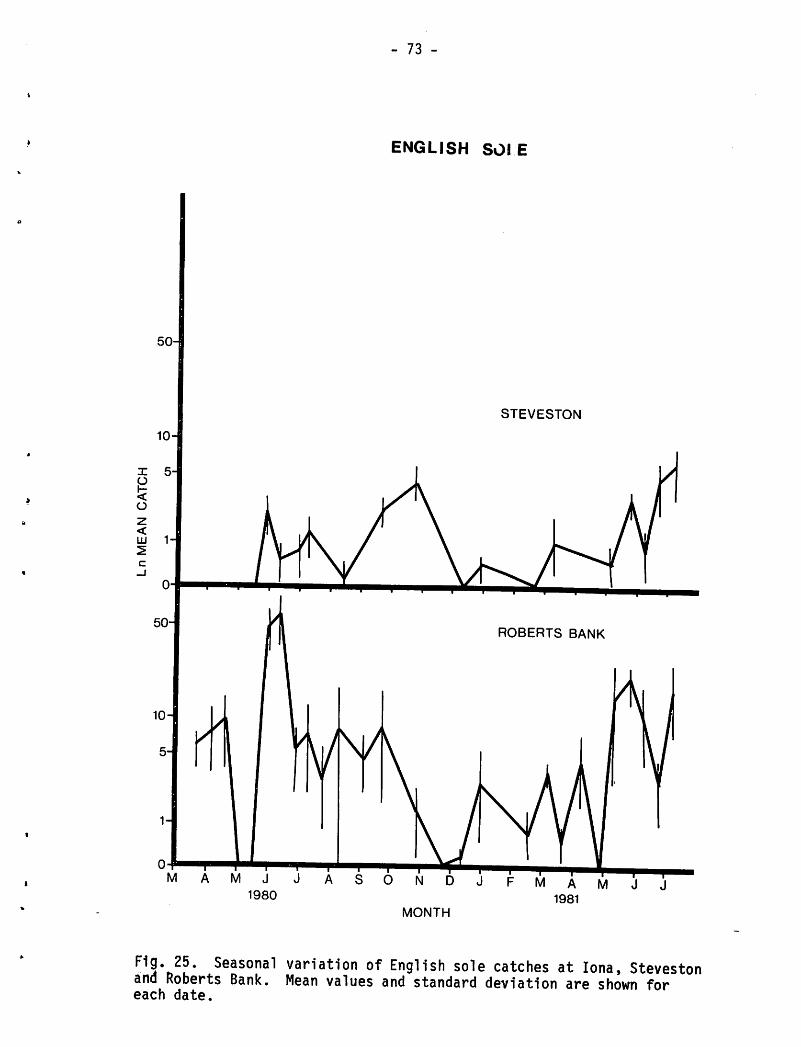
50-
M J J
1980
- 73 -
ENGLISH SOLE
STEVESTON
M A
1981
F1g. 25. Seasonal variation of English sole catches at lona, Stevestonand Roberts Bank. Mean values and standard deviation are shown foreach date.

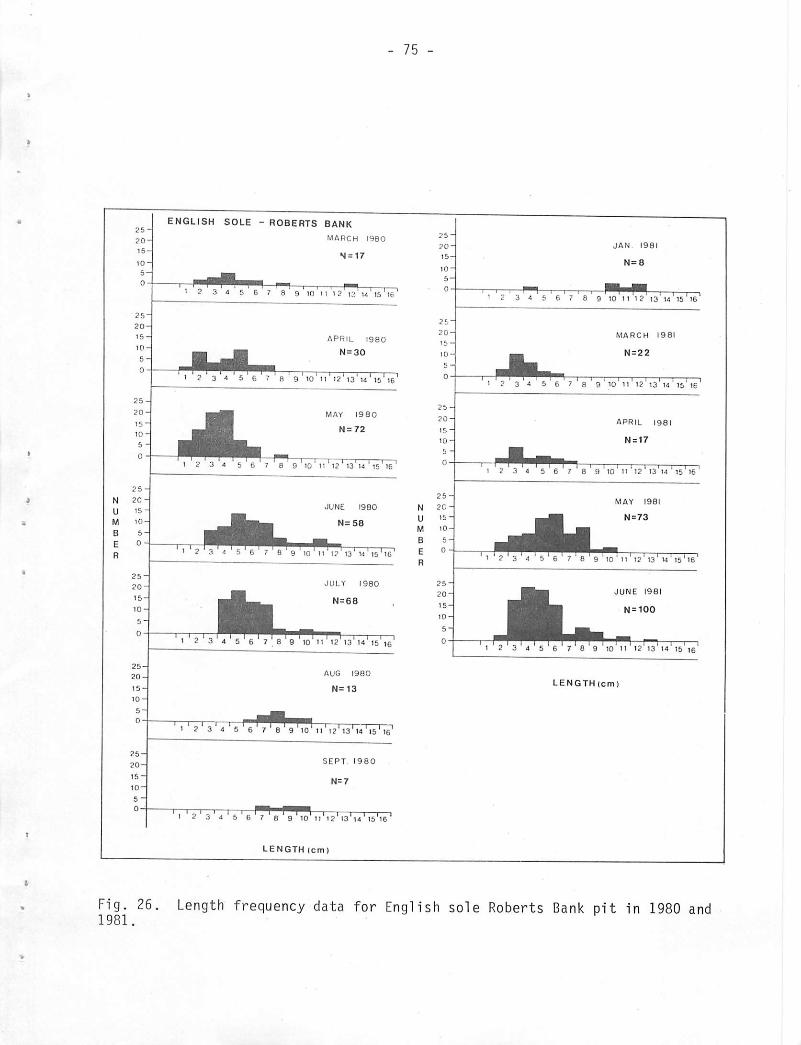
25-
20-
15-
10-
5-
0
25"
20-
15-
10-
5-
0
ENGLISH SOLE - ROBERTS BANK
MARCH 1980
N = 17
' 2 3 4 5 6 7 8 ' 9 10 .1 "l2' l2' 14 ' 15 ' 16'
APRIL 1980
N=30
? 3 4 5 6 7 8 9 10' 11 12 13 141516
' 2 ' 3 ' 4 ' 5 ' 6 ' 7 ' 8 ' 9 ' 10' 11'12' 13* 14' 15*16 '
LENGTH (cm
75 -
25-
20-
15-
10-
5-
0
25"
20-
15-
10-
5-
0
JAN 1981
N=8
2 3 4 6 ' 6 ' 7 ' 8 ' 9 ' 10' 11 12 13' 14 ' IS' 16'
MARCH 1981
N = 22
1 2 3 4 5' 6 7 8 9 '10 11 12 13 14 15'16
Fig. 26. Length frequency data for English sole Roberts Bank pit in 1980 and1981.

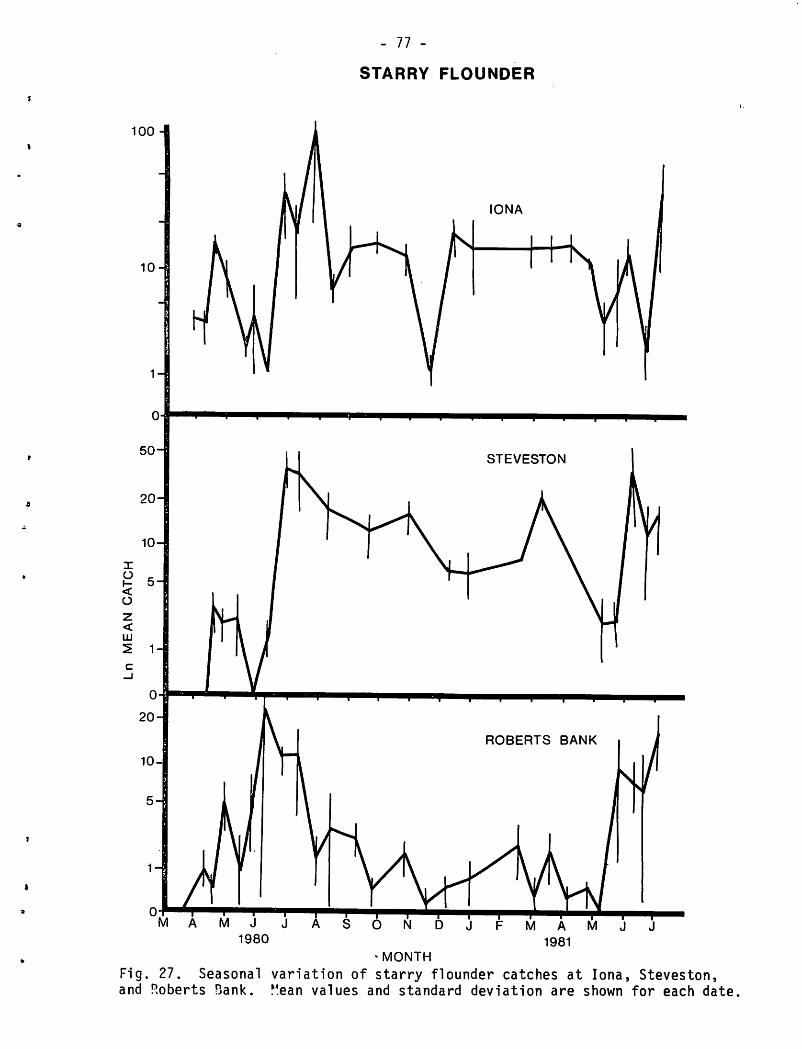
100-a
o-fM
- 77 -
STARRY FLOUNDER
mjjAsondjfmaivi1980 1981
-MONTH
Fig. 27. Seasonal variation of starry flounder catches at lona, Steveston,and Roberts Bank. Mean values and standard deviation are shown for each date

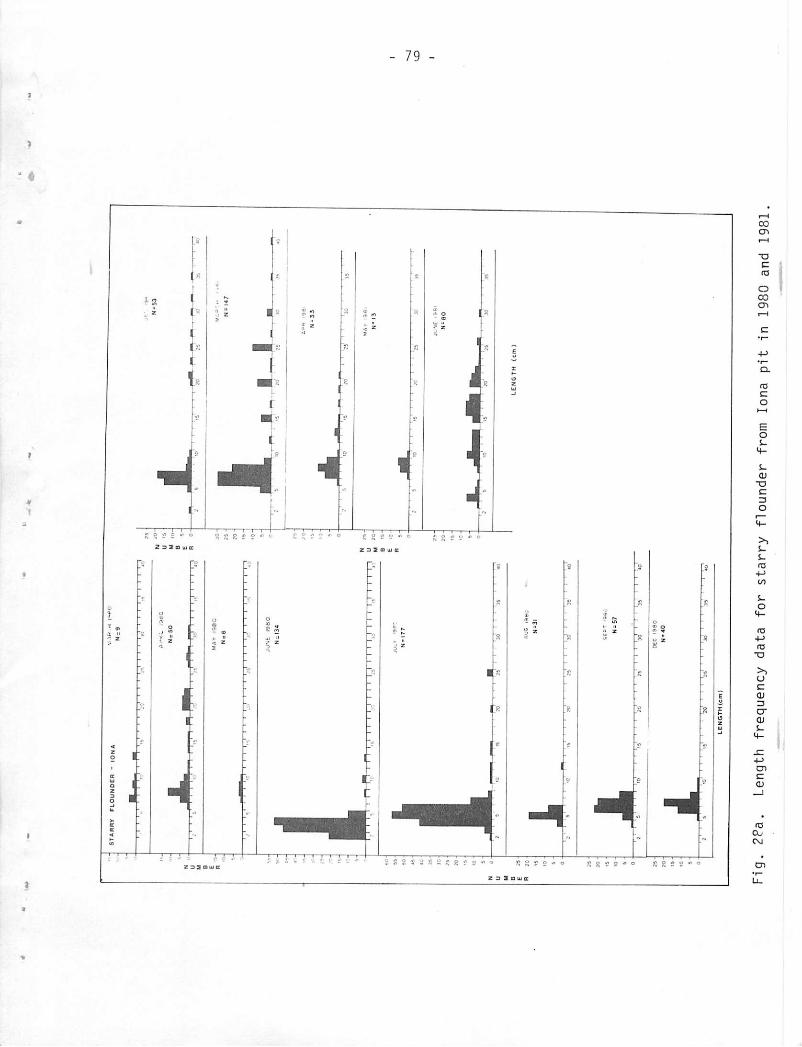
*.-
E»
BJO
ST
AR
RY
FL
OU
ND
ER
-IO
NA
11
11
.W
m11
m•
I.I
I—I
II
I
u-g
'',
''
''
'.,'
.-.•
'-<
.-1
98
0
N=
50
U>s
Mh:
-rt-
rt-
fh
-en
-m
.,'•
••
wR
°•n
—n
—r—
r-*
—-—
-*
•-
Ma
a
ii
ii.
ii
nH
in
rj
ii
ii
.1i
ii
i,i
ii
ii
ji
ii
iji
ii
ij
^T
J'
•O
-ir-
Br
20
}i
>s
to
'Cii
1w
::
••*
•:
'35
•:—
17
III—
r-i—
l—
r-T
JO75
LE
NG
TH
(cm
)
SE
=T
19
80
N=
57
1-
—•-
-••
—•
•-
—-•
-;v
j5
>i
»'
'»
LE
NG
TH
(cm
)
J1)
40
Fig.
2?a.
Length
frequency
data
for
starry
flounder
from
lona
pit
in1980
and
1981
•
^1

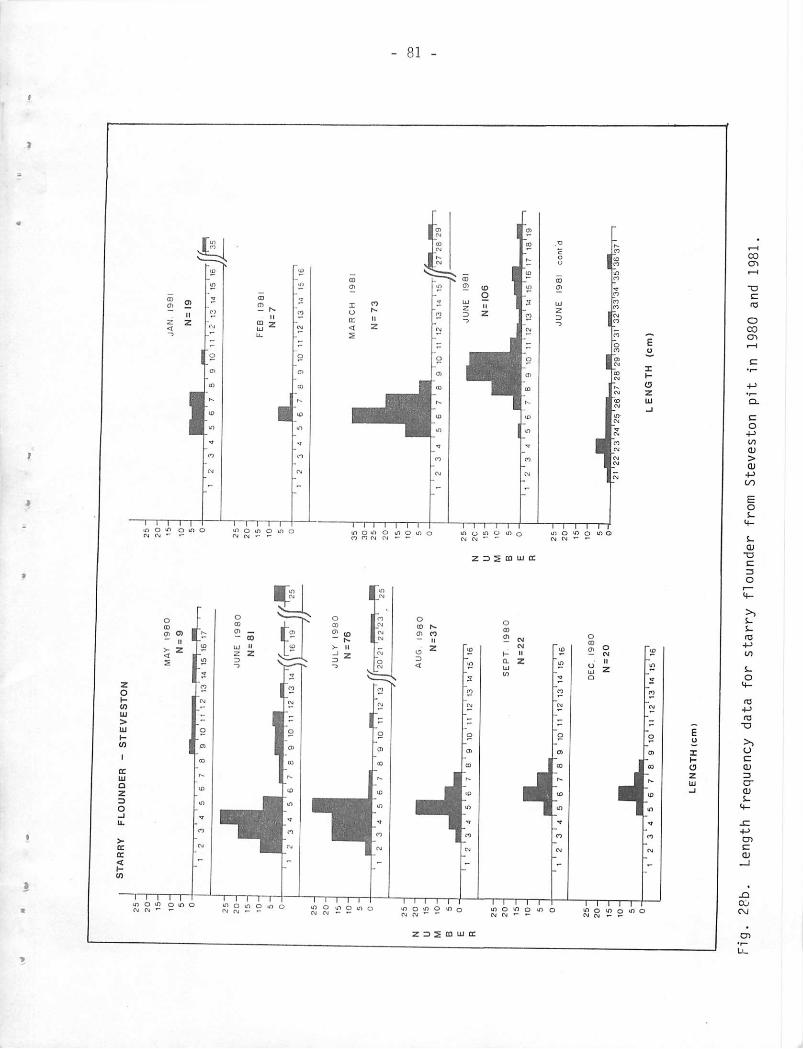
25
20
15
10 5-
0
25
20
-
15
-
10
-
5-
:-
25
-
20
15
—1
10
-
5-
0
25
-
20
-
15
-
10
-
5-|
0
25
-
20
-
15
-
10 5
i
0
25
-
20
-
15
-
10
-
STA
RR
YFL
OU
ND
ER
-ST
EV
EST
ON
12
'34
5'6
'7'8
910
1112
13'|
f'20'
2l22
23*
"25
AU
G1
98
0
N=
37
"T
TT 1
23
4'5
'6'
7'B
'9'1
0'l
l'l2
'13
'm'1
5'16
'
Ii
„I
ZI
I'I
.1
T
SE
PT
19
80
N=
22
1'2
'3'4
'5'6
'7'8
'9
'10'
11'1
2'13
'14*
15'i6
'
DE
C.
19
80
N=
20
1'2
'3
'4'S
'9'7
'B
'9
'io
'11'
12'1
3'14
'15'
15'
LE
NG
TH
(cm
)
25
20
15
-
10
-
5-
0-
25
20
-
15
-
10
-
5-
0-
35
30
25
20
15
10 5 0-
25
N2
C
U15
M1
0
B5
E0
R
25
20
is
le s
'
0-
JAN
19
81
N=
19 T-r
-r-r
ffF-
,i
1415
16II
35
FE
B1
98
!
N=
7
12
34
5'6
7'B
'9'1
0u
'l2
'l3
'l4
'is
'l6
-—
;—
i—
r1
23
45
67
69
MA
RC
HI9
8I
N=
73
1011
12'1
314
'15
'//
JU
NE
I98
Ico
nt'
d
'21'2
2l2
3^4^
^26'
27l2
8l29
30'3
132
'33'
34'3
5'36
'37
''
LE
NG
TH
(cm
)
Fig.
28b.
Leng
thfre
quen
cyda
tafo
rst
arry
floun
der
from
Stev
esto
npi
tin
1980
and
1981
.
i
CO