Embed Size (px)
Citation preview
January 29th, 2015
Laser Test of RIN, Linewidth and
Optical Noise Parameters
Official Keysight solution partner
Official SYCATUS supplier & Keysight system integrator
Webcast Host
Makoto Shikata President, Sycatus Corporation Technical expert
Jack Dupre OgMentum Incorporated Applications specialist
Jake Weise President, OgMentum Inc. Lead presenter
Page 1
Outline
Telecom and Datacom demands on laser noise performance
Types of Laser Noise
Measuring RIN
Measuring Optical Frequency Noise and Linewidth
Presentation summary
Page 2
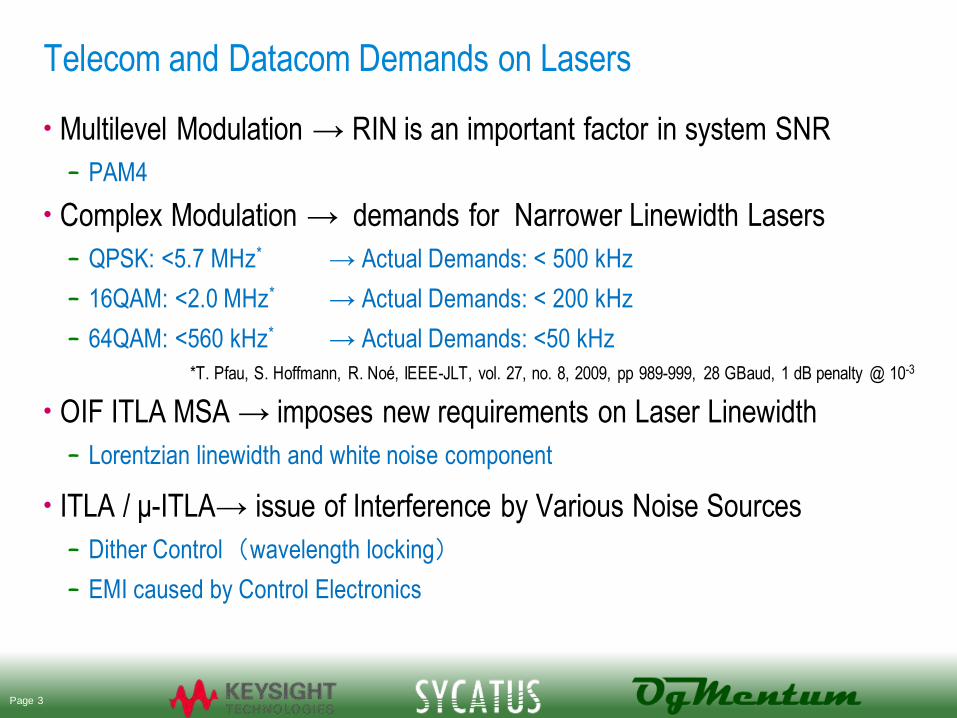
Telecom and Datacom Demands on Lasers
• Multilevel Modulation → RIN is an important factor in system SNR
– PAM4
• Complex Modulation → demands for Narrower Linewidth Lasers
– QPSK: <5.7 MHz* → Actual Demands: < 500 kHz
– 16QAM: <2.0 MHz* → Actual Demands: < 200 kHz
– 64QAM: <560 kHz* → Actual Demands: <50 kHz
*T. Pfau, S. Hoffmann, R. Noé, IEEE-JLT, vol. 27, no. 8, 2009, pp 989-999, 28 GBaud, 1 dB penalty @ 10-3
• OIF ITLA MSA → imposes new requirements on Laser Linewidth
– Lorentzian linewidth and white noise component
• ITLA / μ-ITLA→ issue of Interference by Various Noise Sources
– Dither Control(wavelength locking)
– EMI caused by Control Electronics
Page 3
Types of Laser Noise
Page 4
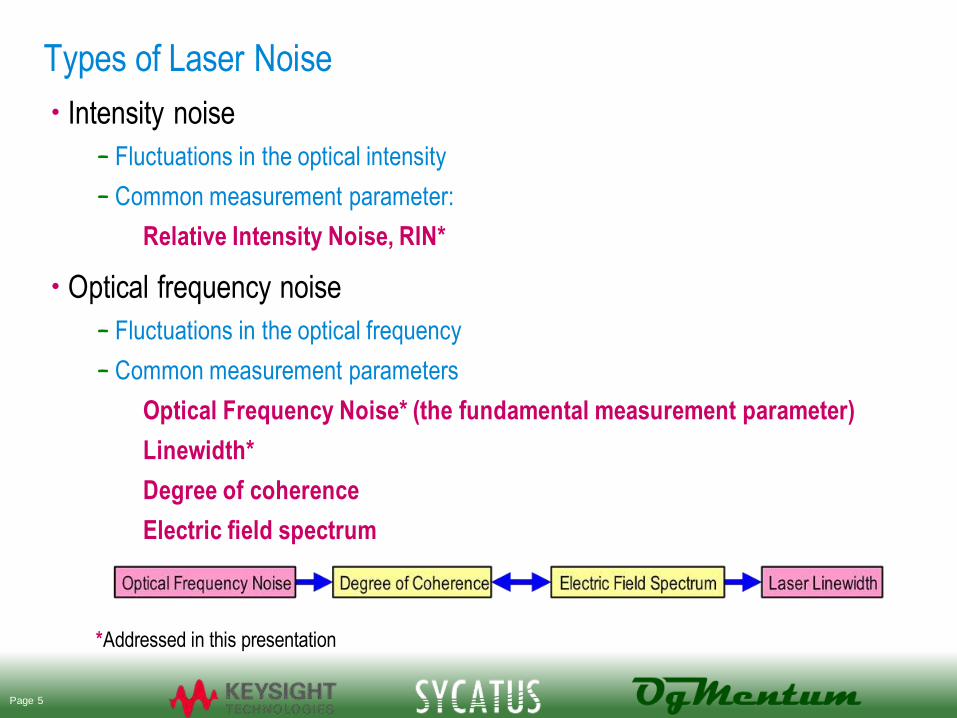
Types of Laser Noise
• Intensity noise
– Fluctuations in the optical intensity
– Common measurement parameter:
Relative Intensity Noise, RIN*
• Optical frequency noise
– Fluctuations in the optical frequency
– Common measurement parameters
Optical Frequency Noise* (the fundamental measurement parameter)
Linewidth*
Degree of coherence
Electric field spectrum
*Addressed in this presentation
Page 5
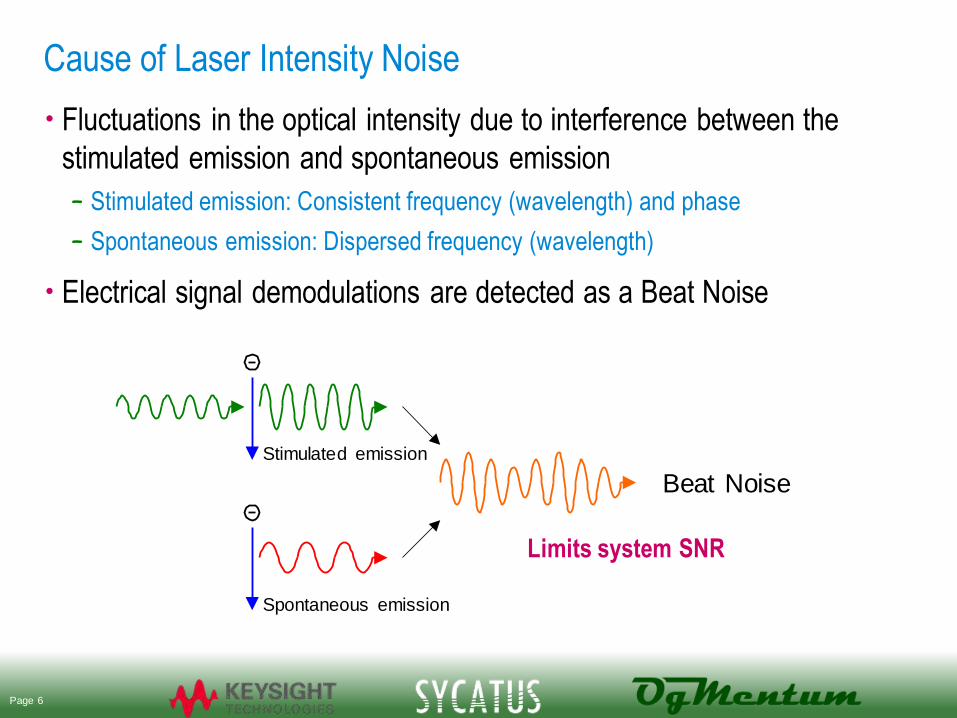
Cause of Laser Intensity Noise
• Fluctuations in the optical intensity due to interference between the
stimulated emission and spontaneous emission
– Stimulated emission: Consistent frequency (wavelength) and phase
– Spontaneous emission: Dispersed frequency (wavelength)
• Electrical signal demodulations are detected as a Beat Noise
Stimulated emission
Spontaneous emission
Limits system SNR
Beat Noise
Page 6
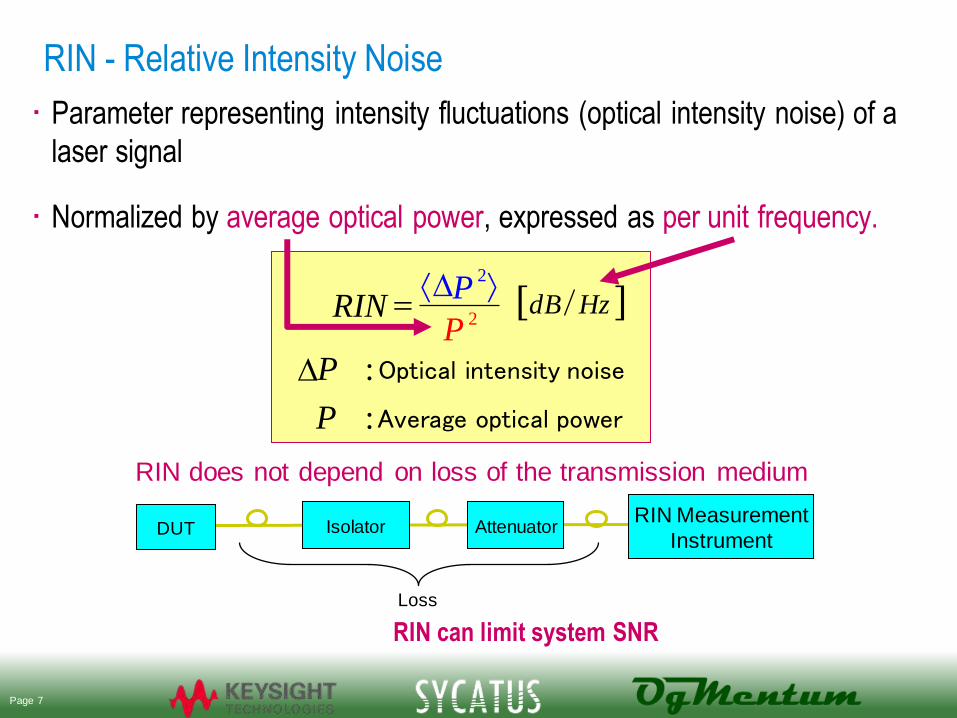
RIN - Relative Intensity Noise
• Parameter representing intensity fluctuations (optical intensity noise) of a
laser signal
• Normalized by average optical power, expressed as per unit frequency.
Average optical power
P
P RIN 2
2 D = [ ] Hz dB
P D
P
Optical intensity noise
:
:
Attenuator DUT Isolator RIN Measurement
Instrument
Loss
RIN does not depend on loss of the transmission medium
RIN can limit system SNR
Page 7
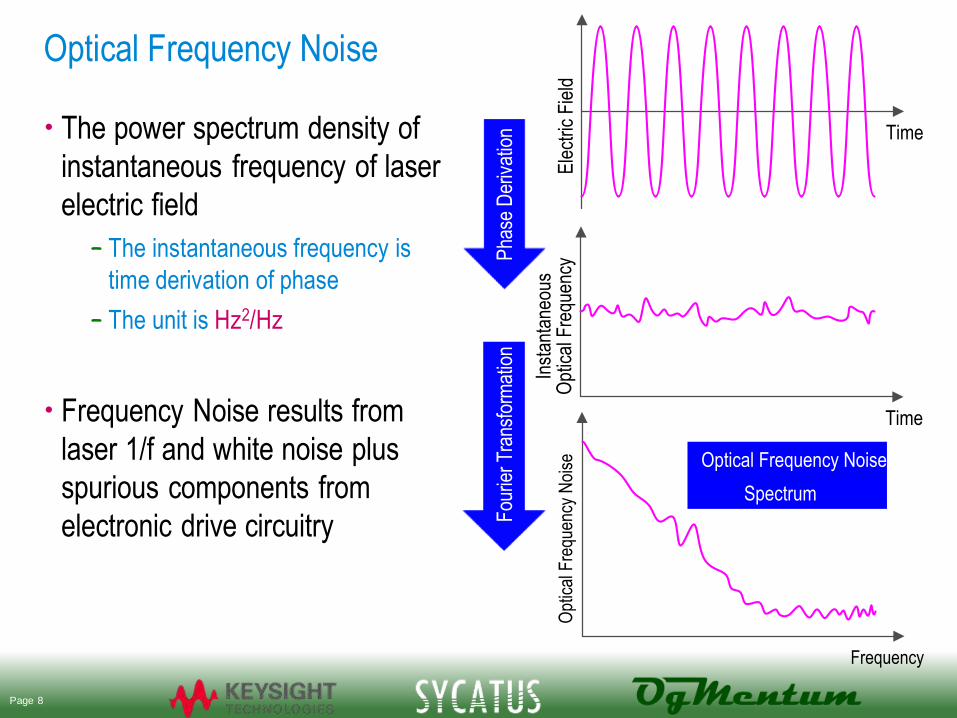
Optical Frequency Noise
• The power spectrum density of
instantaneous frequency of laser
electric field
– The instantaneous frequency is
time derivation of phase
– The unit is Hz2/Hz
• Frequency Noise results from
laser 1/f and white noise plus
spurious components from
electronic drive circuitry P
hase
Der
ivat
ion
F
ourie
r T
rans
form
atio
n
Ele
ctric
Fie
ld
Time
Inst
anta
neou
s O
ptic
al F
requ
ency
Time
Opt
ical
Fre
quen
cy N
oise
Frequency
Optical Frequency Noise
Spectrum
Page 8
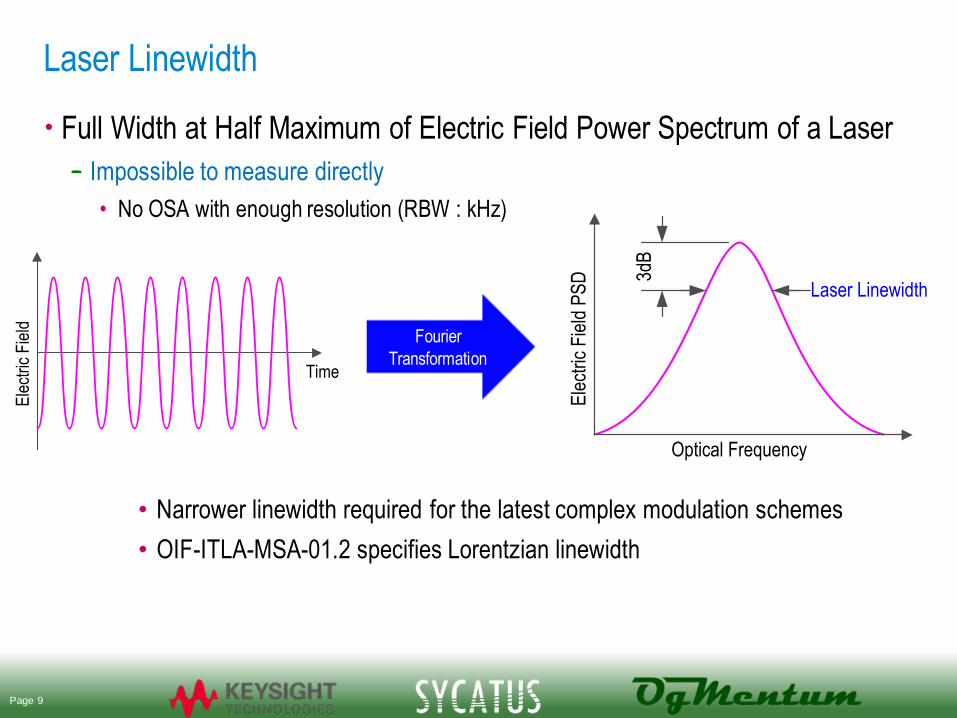
Laser Linewidth
• Full Width at Half Maximum of Electric Field Power Spectrum of a Laser
– Impossible to measure directly
• No OSA with enough resolution (RBW : kHz)
Ele
ctric
Fie
ld P
SD
Optical Frequency
Laser Linewidth
3dB
• Narrower linewidth required for the latest complex modulation schemes
• OIF-ITLA-MSA-01.2 specifies Lorentzian linewidth
Ele
ctric
Fie
ld
Time
Fourier
Transformation
Page 9
Measuring RIN
Page 10
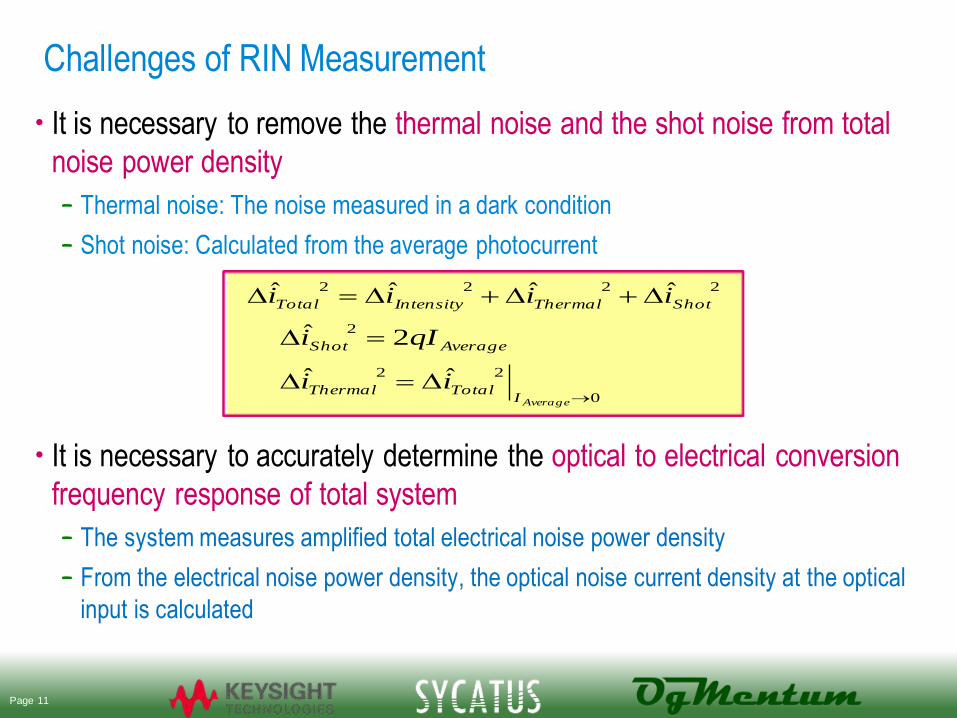
Challenges of RIN Measurement
• It is necessary to remove the thermal noise and the shot noise from total
noise power density
– Thermal noise: The noise measured in a dark condition
– Shot noise: Calculated from the average photocurrent
• It is necessary to accurately determine the optical to electrical conversion
frequency response of total system
– The system measures amplified total electrical noise power density
– From the electrical noise power density, the optical noise current density at the optical
input is calculated
0
22
2
2222
ˆˆ
2ˆ
ˆˆˆˆ
D=D
=D
DDD=D
AverageITotalThermal
AverageShot
ShotThermalIntensityTotal
ii
qIi
iiii
Page 11
-170
-165
-160
-155
-150
-145
-140
0 1000 2000 3000 4000 5000 6000 7000
Frequency (M Hz)
RIN (dB
/Hz)
-6dBm
-3dBm
0dBm
+3dBm
+6dBm
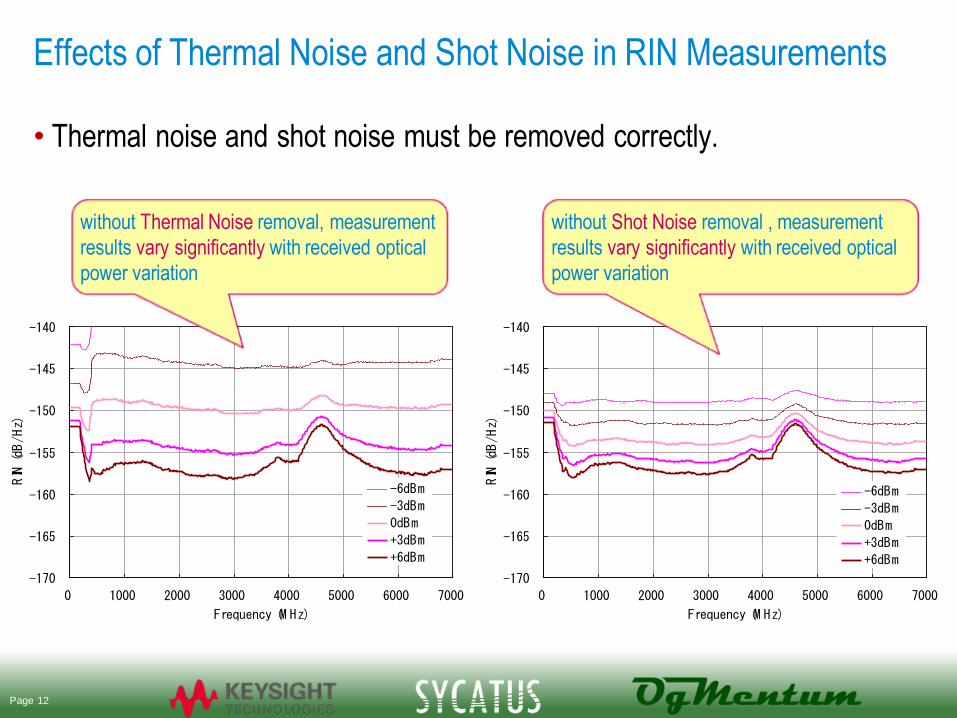
Effects of Thermal Noise and Shot Noise in RIN Measurements
• Thermal noise and shot noise must be removed correctly.
-170
-165
-160
-155
-150
-145
-140
0 1000 2000 3000 4000 5000 6000 7000
Frequency (M Hz)
RIN (dB
/Hz)
-6dBm
-3dBm
0dBm
+3dBm
+6dBm
without Thermal Noise removal, measurement
results vary significantly with received optical
power variation
without Shot Noise removal , measurement
results vary significantly with received optical
power variation
Page 12
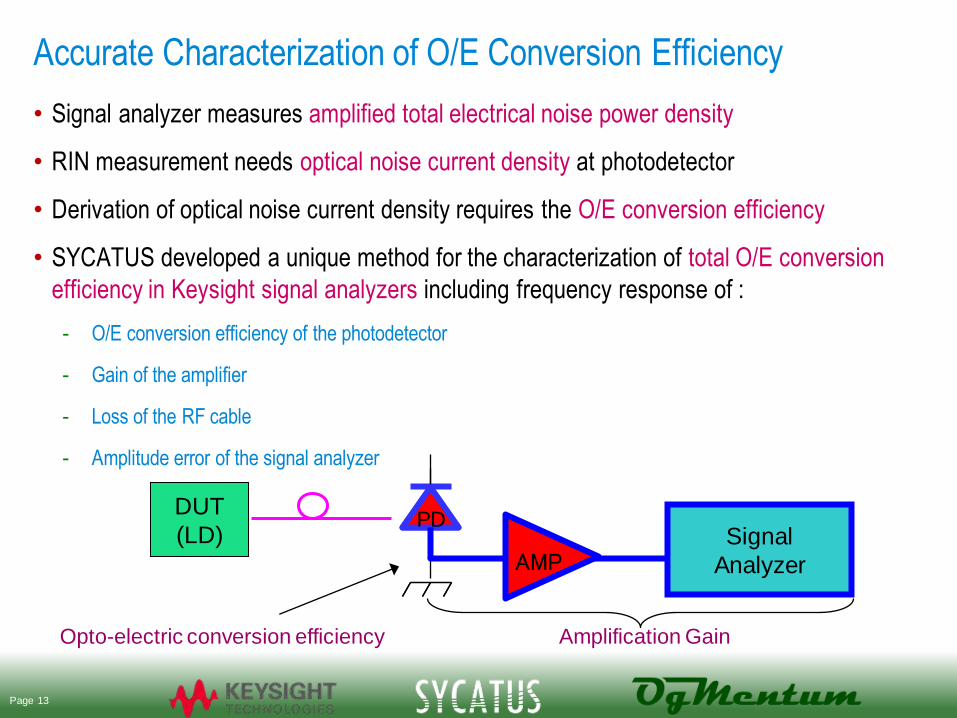
Accurate Characterization of O/E Conversion Efficiency
• Signal analyzer measures amplified total electrical noise power density
• RIN measurement needs optical noise current density at photodetector
• Derivation of optical noise current density requires the O/E conversion efficiency
• SYCATUS developed a unique method for the characterization of total O/E conversion
efficiency in Keysight signal analyzers including frequency response of :
- O/E conversion efficiency of the photodetector
- Gain of the amplifier
- Loss of the RF cable
- Amplitude error of the signal analyzer
Signal
Analyzer
DUT
(LD) PD
AMP
Opto-electric conversion efficiency Amplification Gain
Page 13
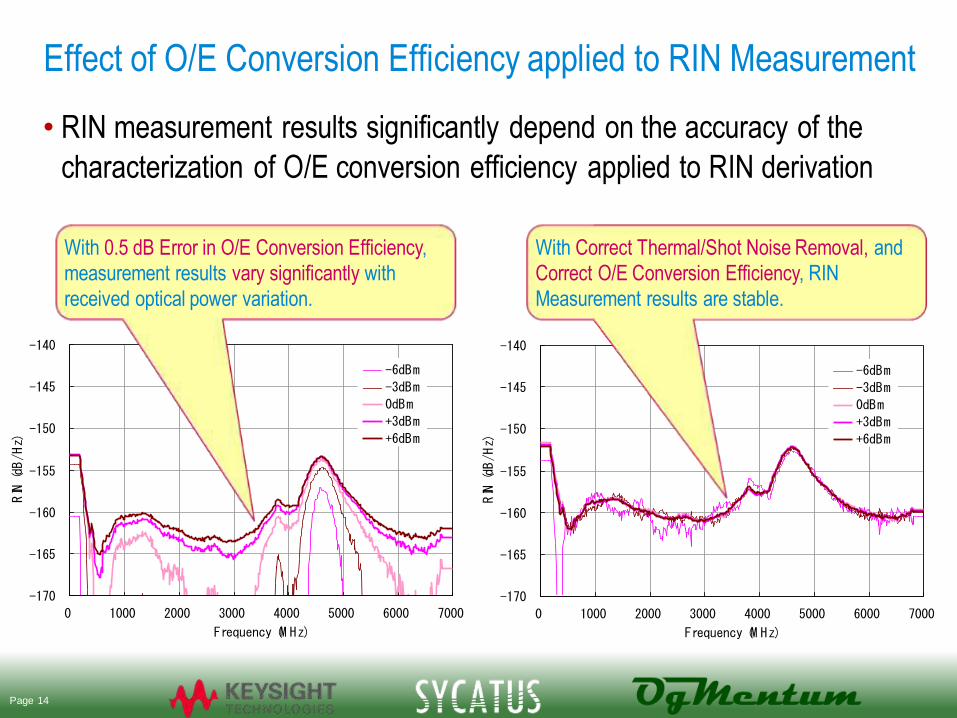
Effect of O/E Conversion Efficiency applied to RIN Measurement
• RIN measurement results significantly depend on the accuracy of the
characterization of O/E conversion efficiency applied to RIN derivation
-170
-165
-160
-155
-150
-145
-140
0 1000 2000 3000 4000 5000 6000 7000
Frequency (M Hz)
RIN (dB
/Hz)
-6dBm
-3dBm
0dBm
+3dBm
+6dBm
-170
-165
-160
-155
-150
-145
-140
0 1000 2000 3000 4000 5000 6000 7000
Frequency (M Hz)
RIN (dB
/Hz)
-6dBm
-3dBm
0dBm
+3dBm
+6dBm
With 0.5 dB Error in O/E Conversion Efficiency,
measurement results vary significantly with
received optical power variation.
With Correct Thermal/Shot Noise Removal, and
Correct O/E Conversion Efficiency, RIN
Measurement results are stable.
Page 14
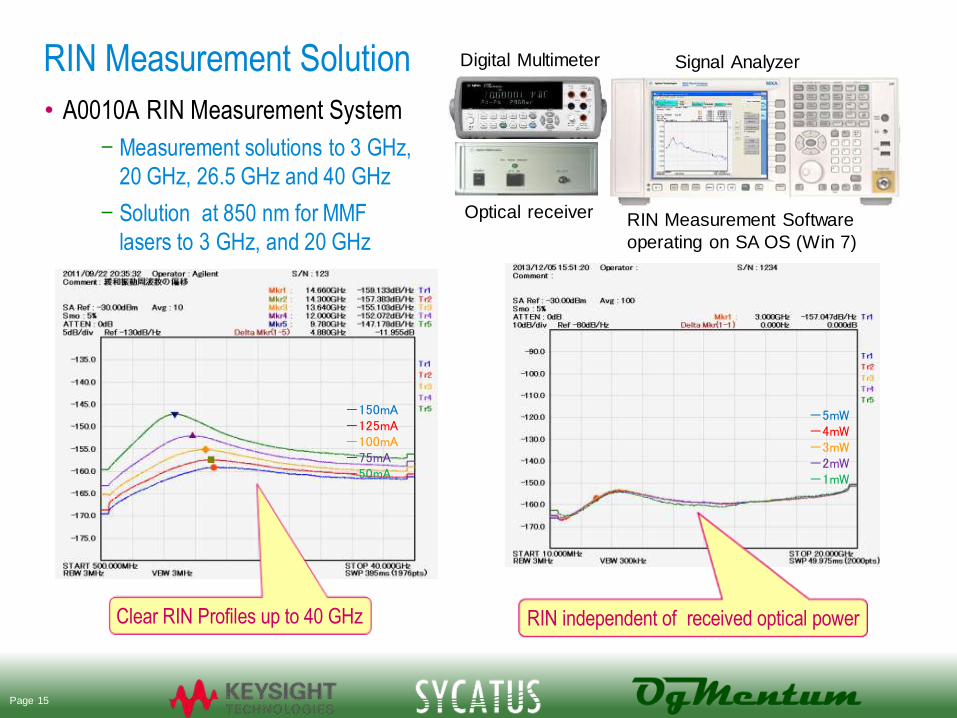
RIN Measurement Solution
• A0010A RIN Measurement System
– Measurement solutions to 3 GHz,
20 GHz, 26.5 GHz and 40 GHz
– Solution at 850 nm for MMF
lasers to 3 GHz, and 20 GHz
Digital Multimeter Signal Analyzer
Optical receiver RIN Measurement Software
operating on SA OS (Win 7)
-150mA -125mA -100mA -75mA -50mA
-5mW -4mW -3mW -2mW -1mW
Clear RIN Profiles up to 40 GHz RIN independent of received optical power
Page 15
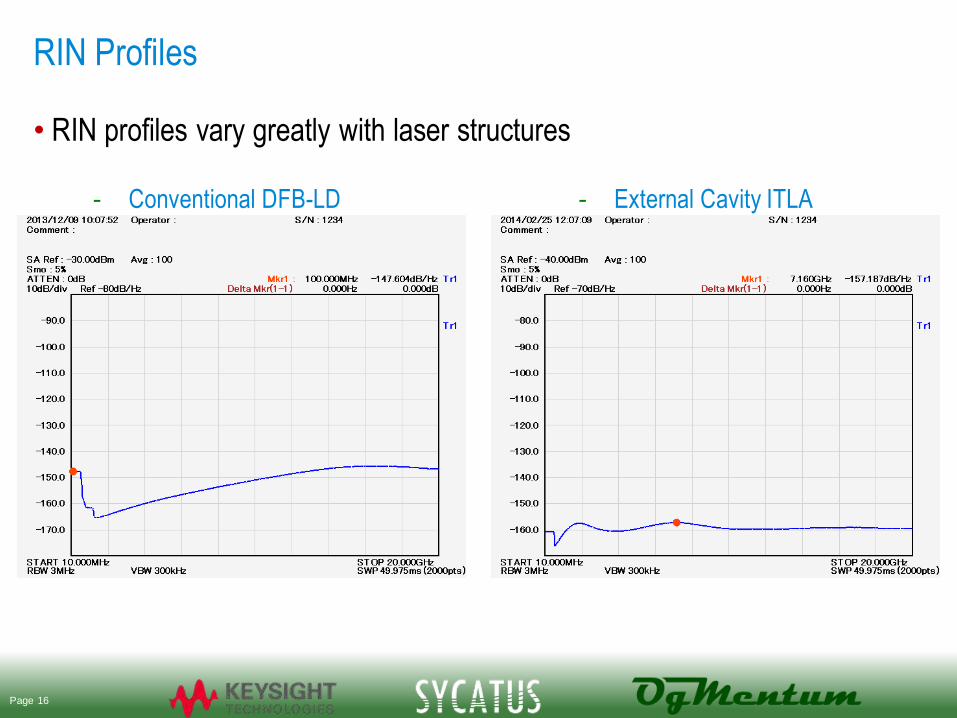
RIN Profiles
- Conventional DFB-LD - External Cavity ITLA
• RIN profiles vary greatly with laser structures
Page 16
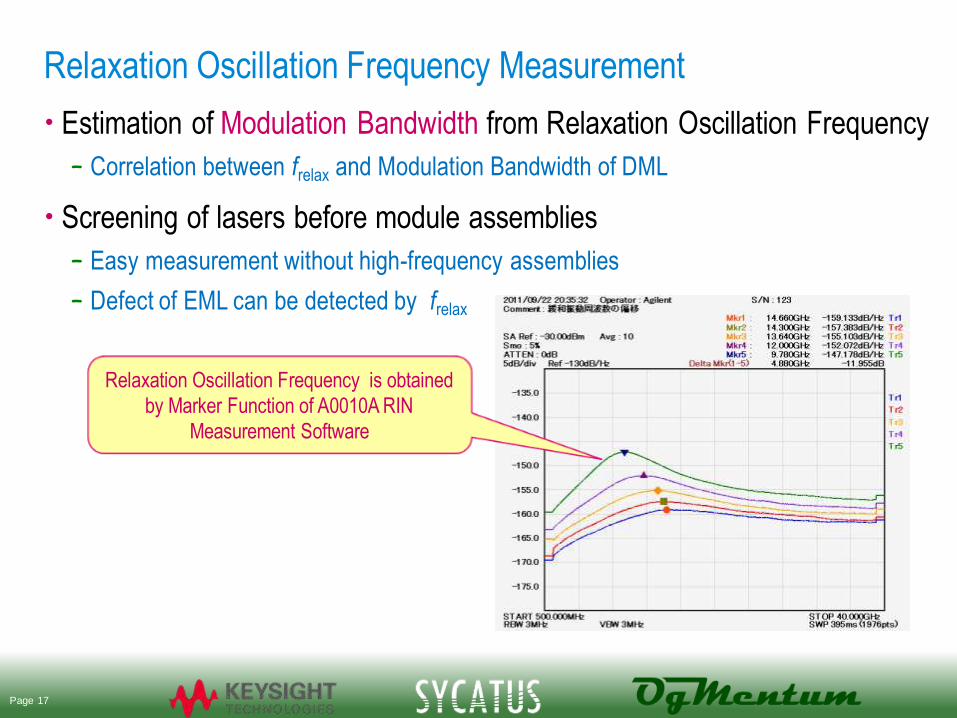
Relaxation Oscillation Frequency Measurement
• Estimation of Modulation Bandwidth from Relaxation Oscillation Frequency
– Correlation between frelax and Modulation Bandwidth of DML
• Screening of lasers before module assemblies
– Easy measurement without high-frequency assemblies
– Defect of EML can be detected by frelax
Relaxation Oscillation Frequency is obtained
by Marker Function of A0010A RIN
Measurement Software
Page 17
Measuring Optical Frequency
Noise and Linewidth
Page 18
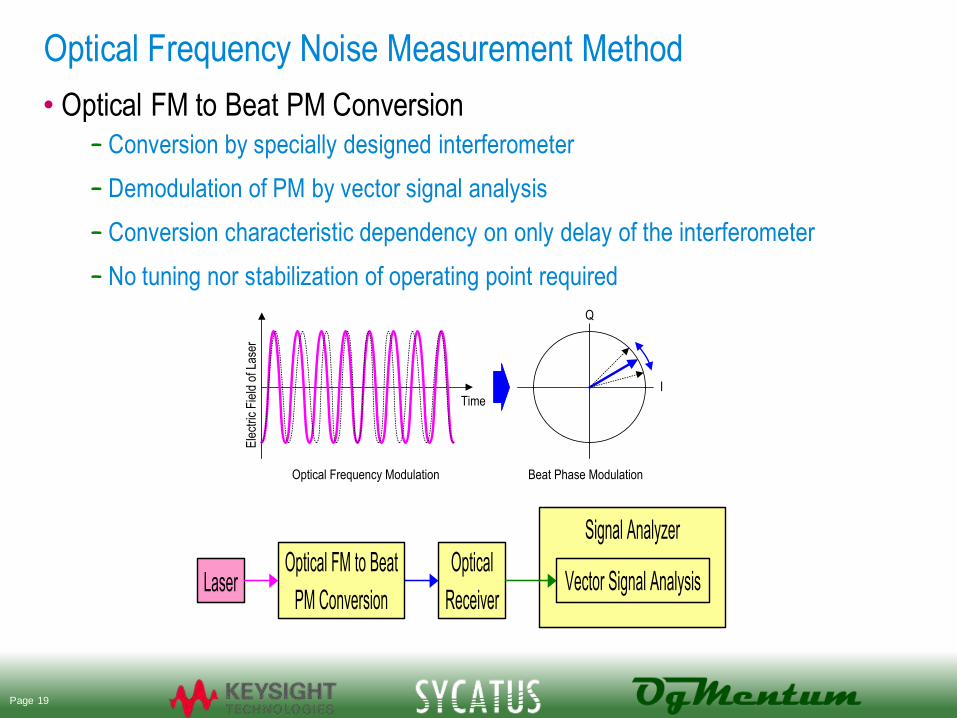
Optical Frequency Noise Measurement Method
• Optical FM to Beat PM Conversion
– Conversion by specially designed interferometer
– Demodulation of PM by vector signal analysis
– Conversion characteristic dependency on only delay of the interferometer
– No tuning nor stabilization of operating point required
Signal Analyzer
LaserOptical FM to Beat
PM Conversion
Optical
ReceiverVector Signal Analysis
Ele
ctric
Fie
ld o
f Las
er
TimeI
Q
Optical Frequency Modulation Beat Phase Modulation
Page 19
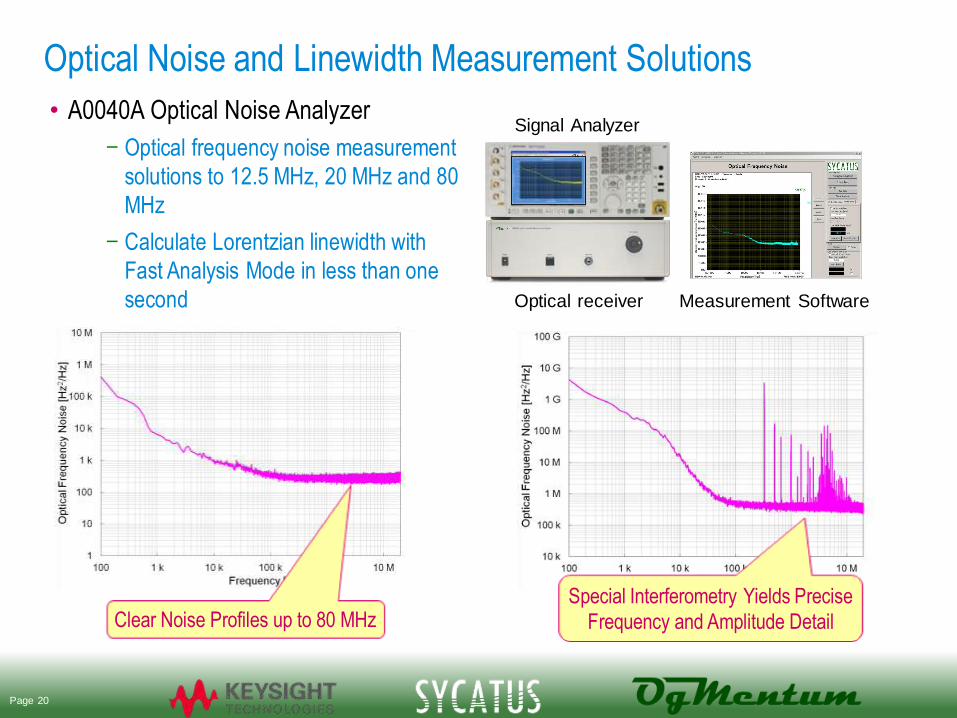
Optical Noise and Linewidth Measurement Solutions
Signal Analyzer
Optical receiver Measurement Software
• A0040A Optical Noise Analyzer
– Optical frequency noise measurement
solutions to 12.5 MHz, 20 MHz and 80
MHz
– Calculate Lorentzian linewidth with
Fast Analysis Mode in less than one
second
Clear Noise Profiles up to 80 MHz Special Interferometry Yields Precise
Frequency and Amplitude Detail
Page 20
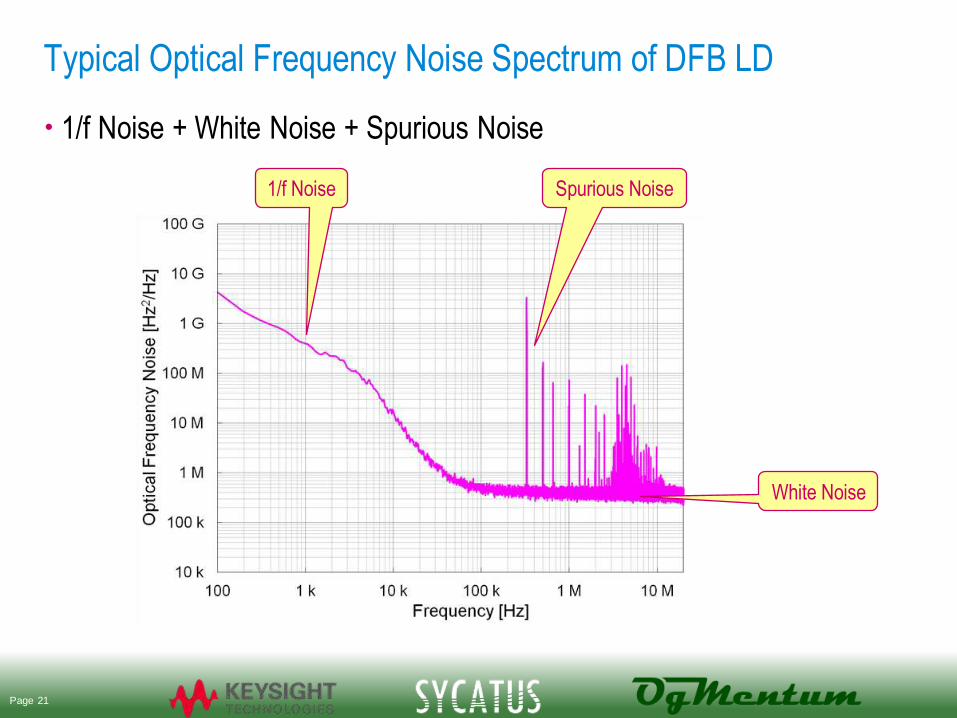
Typical Optical Frequency Noise Spectrum of DFB LD
• 1/f Noise + White Noise + Spurious Noise
White Noise
1/f Noise Spurious Noise
Page 21

Measuring Optical Frequency Noise vs. SOA Injection Current
• Optical Frequency Noise Depends on SOA Injection Current
I2→16 dBm
I1→ 11 dBm
Page 22
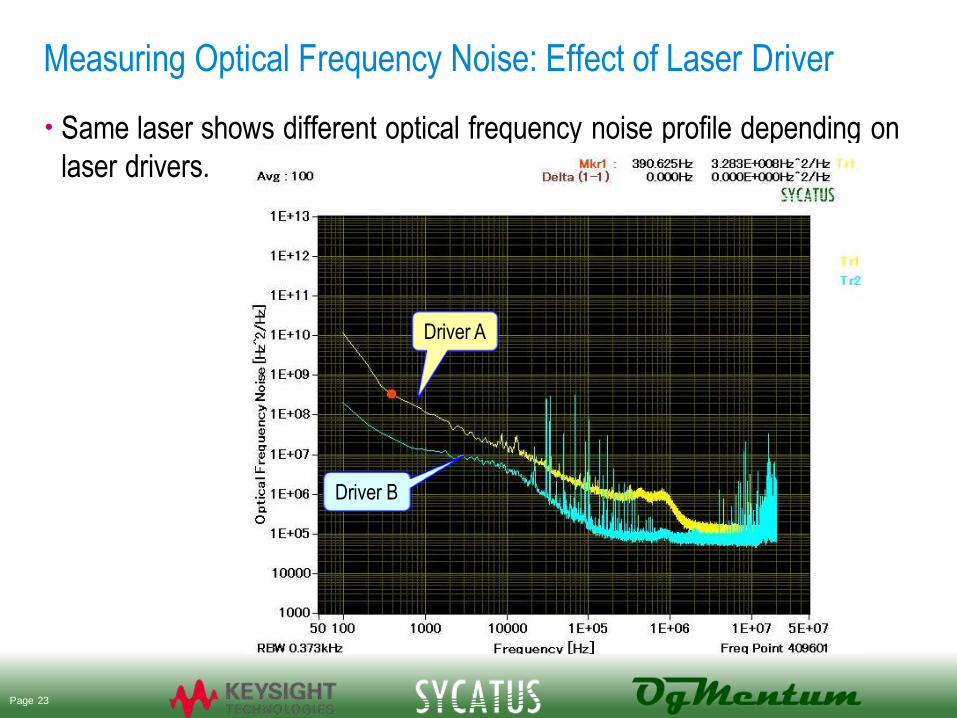
Measuring Optical Frequency Noise: Effect of Laser Driver
• Same laser shows different optical frequency noise profile depending on
laser drivers.
Driver B
Driver A
Page 23
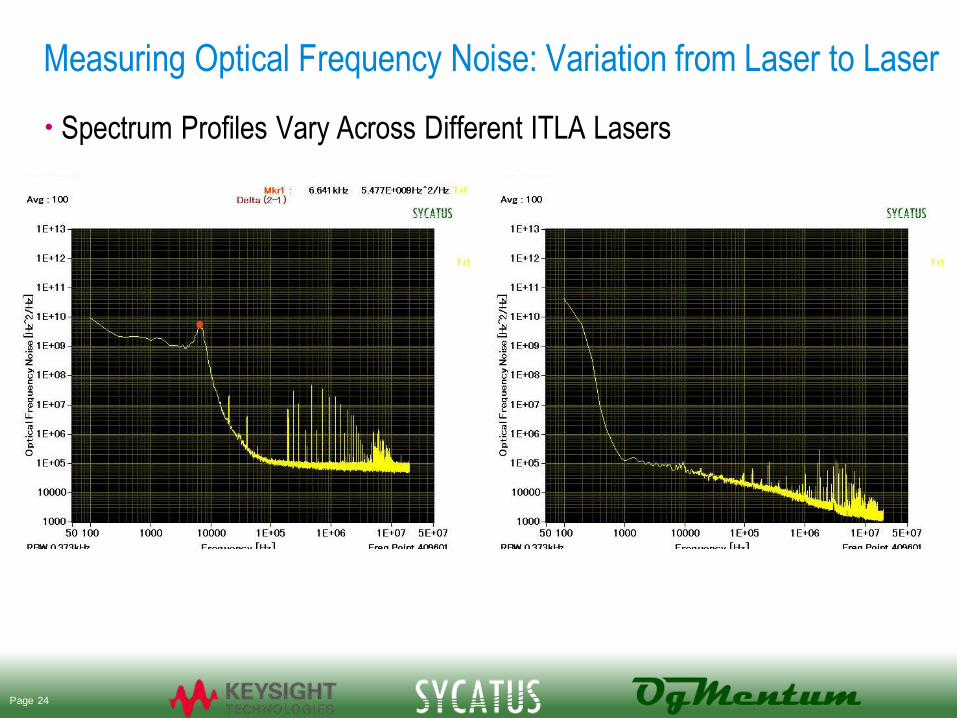
Measuring Optical Frequency Noise: Variation from Laser to Laser
• Spectrum Profiles Vary Across Different ITLA Lasers
Page 24
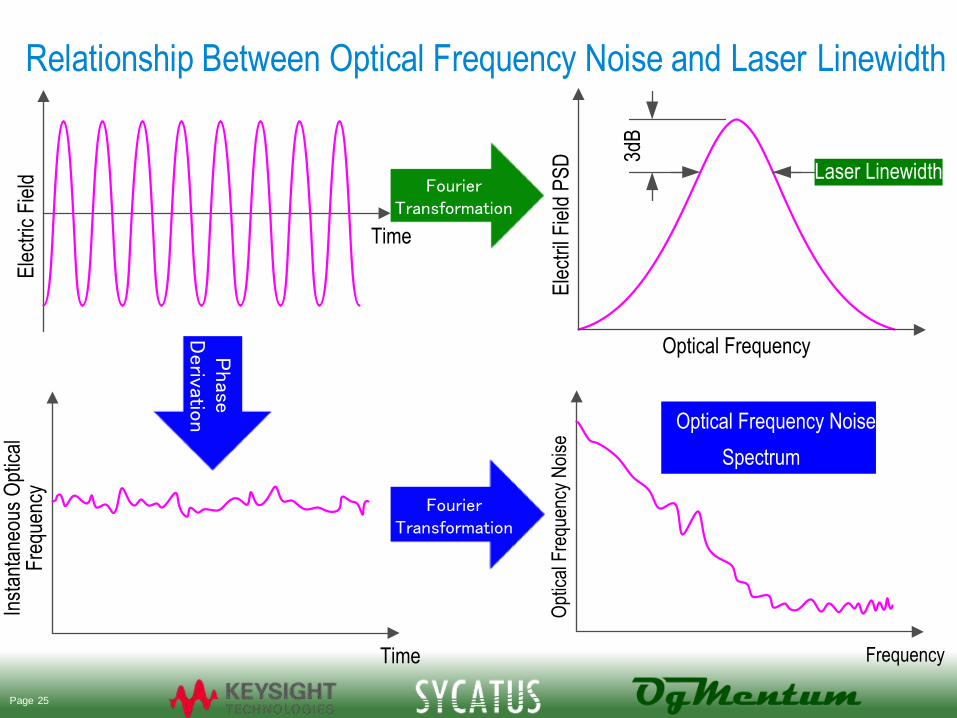
Relationship Between Optical Frequency Noise and Laser Linewidth
Phase
D
erivatio
n
Fourier Transformation
Fourier Transformation
Ele
ctril
Fie
ld P
SD
Optical Frequency
Laser Linewidth
3dB
Ele
ctric
Fie
ld
Time
Inst
anta
neou
s O
ptic
al
Fre
quen
cy
Time
Opt
ical
Fre
quen
cy N
oise
Frequency
Optical Frequency Noise
Spectrum
Page 25
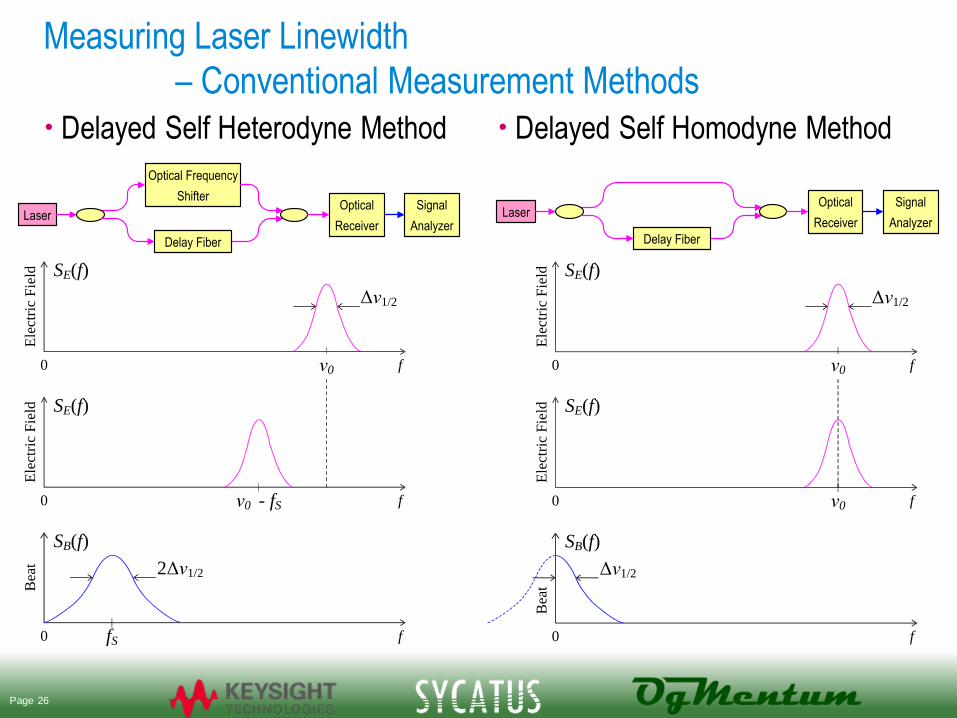
Measuring Laser Linewidth
– Conventional Measurement Methods
• Delayed Self Heterodyne Method
• Delayed Self Homodyne Method
0 f
SB(f)
ν0 f
Ele
ctri
c F
ield
f
SE(f)
Δν1/2
Δν1/2
Bea
t
SE(f)
Ele
ctri
c F
ield
ν0
0
0
0 fS f
SB(f)
ν0 - fS f
Ele
ctri
c F
ield
f
SE(f)
Δν1/2
2Δν1/2
Bea
t
SE(f)
Ele
ctri
c F
ield
ν0
0
0
LaserSignal
Analyzer
Optical Frequency
ShifterOptical
Receiver
Delay Fiber
LaserSignal
Analyzer
Optical
Receiver
Delay Fiber
Page 26
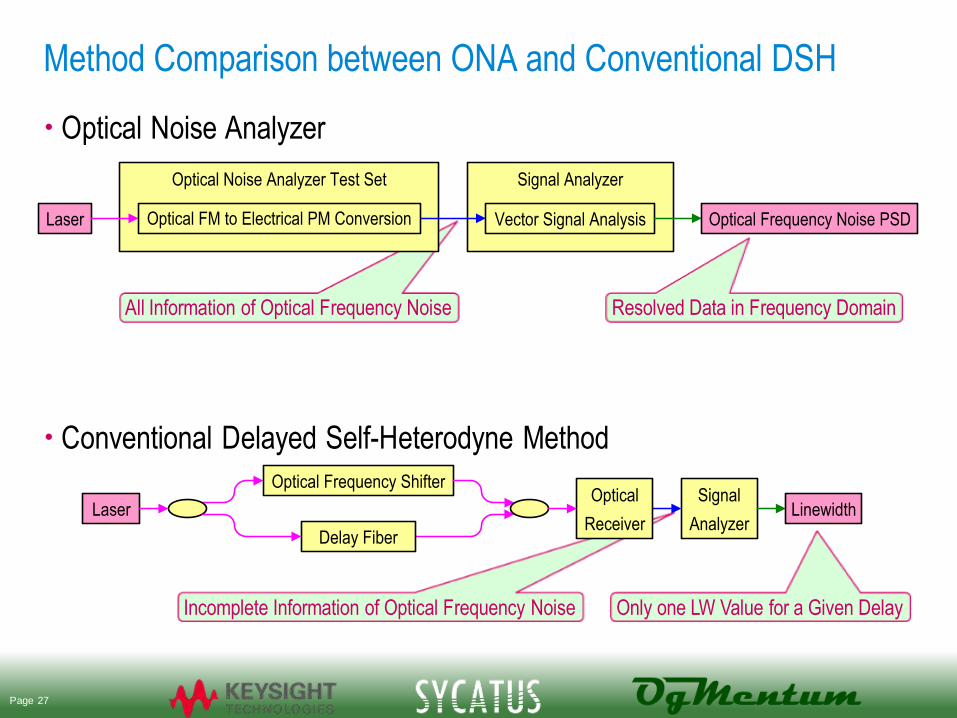
Method Comparison between ONA and Conventional DSH
• Optical Noise Analyzer
• Conventional Delayed Self-Heterodyne Method
Incomplete Information of Optical Frequency Noise Only one LW Value for a Given Delay
Resolved Data in Frequency Domain All Information of Optical Frequency Noise
LaserSignal
Analyzer
Optical Frequency ShifterOptical
ReceiverDelay Fiber
Linewidth
Optical Noise Analyzer Test Set
Laser
Signal Analyzer
Optical FM to Electrical PM Conversion Vector Signal Analysis Optical Frequency Noise PSD
Page 27
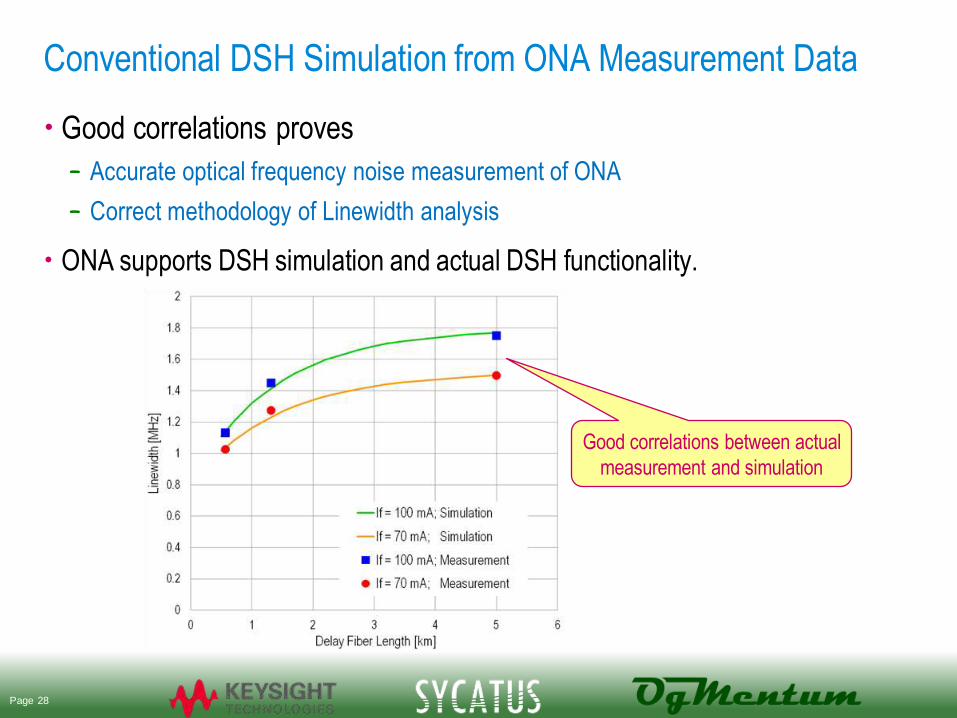
Conventional DSH Simulation from ONA Measurement Data
• Good correlations proves
– Accurate optical frequency noise measurement of ONA
– Correct methodology of Linewidth analysis
• ONA supports DSH simulation and actual DSH functionality.
Page 28
Good correlations between actual
measurement and simulation
Lorentzian Linewidth
• OIF-ITLA-MSA-01.2
11.1.1.5 The linewidth specified is the Lorentzian component and is related to
white phase noise component of the optical field. It is defined as the
-3dB full width of a self-heterodyne (3.5us delay) measurement.
Typically one arm of the interferometer is shifted in frequency.
• It is impossible to extract white noise portion by delayed self heterodyne
method.
• Practical method is to extract white noise portion from optical frequency
noise spectrum and calculate laser linewidth.
Page 29
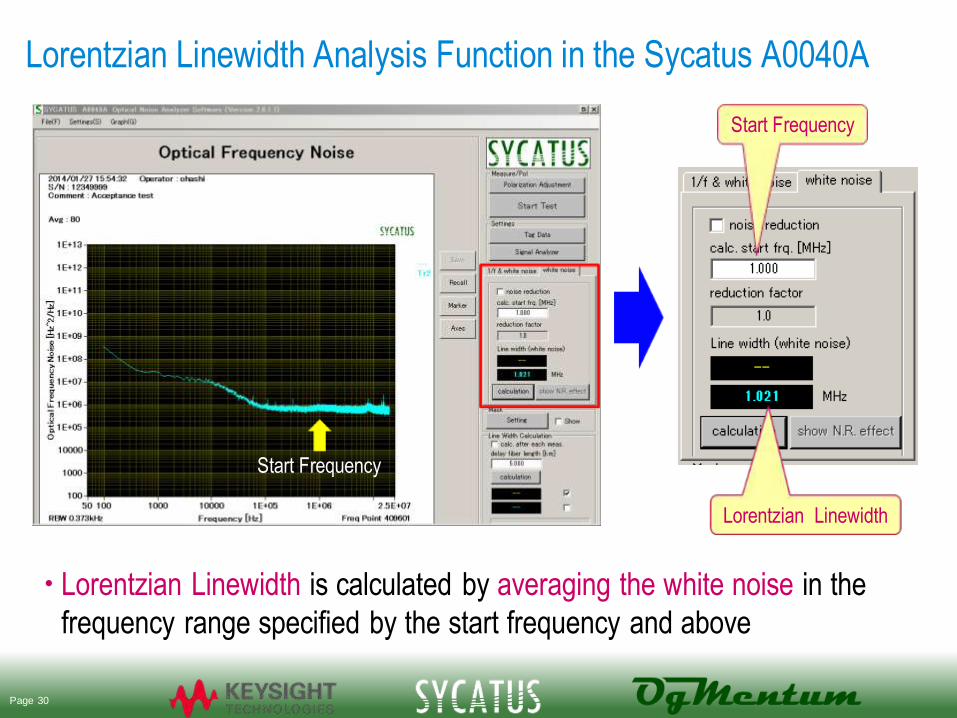
Lorentzian Linewidth Analysis Function in the Sycatus A0040A
• Lorentzian Linewidth is calculated by averaging the white noise in the
frequency range specified by the start frequency and above
Start Frequency
Start Frequency
Lorentzian Linewidth
Page 30
Presentation summary
Page 31
Fiber Optic Telecom and Datacom Networks Demand Laser
Transmitters with… • Low RIN
– Important factor in SNR and identifies the Relaxation Oscillation Frequency
– Not effected by network attenuation
– Need to account for O/E conversion efficiency and remove the Thermal and Shot Noise
• A Clean Optical Frequency Noise Spectrum
– Low 1/f , spurious and white noise required for high-capacity systems
– Optical frequency noise vs. frequency gives a complete characterization of frequency noise
performance
– Optical frequency modulated noise can be converted to beat phase modulated noise with
special interferometry and measured on a calibrated Vector Signal Analyzer
• Narrow Laser Linewidth
– Critical for multilevel modulation and an OIF requirement
– Conventional LW measurement methods do not yield Lorentzian LW
– Lorentzian LW can be measured from the white noise portion of the optical noise spectrum
Page 32
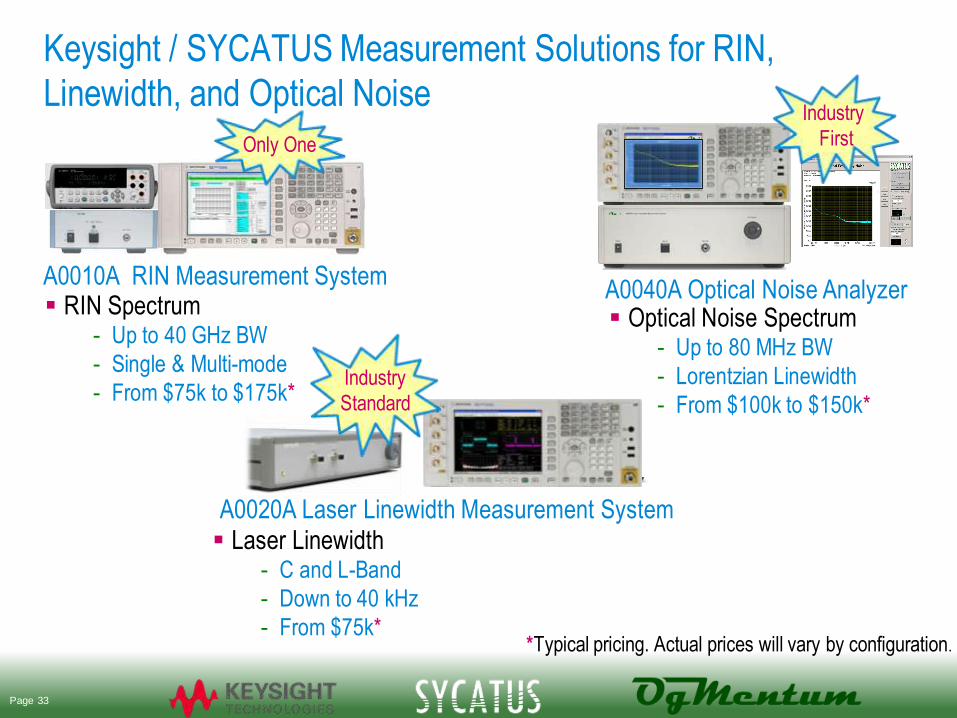
Keysight / SYCATUS Measurement Solutions for RIN,
Linewidth, and Optical Noise
Only One
Industry
Standard
Industry
First
A0010A RIN Measurement System A0040A Optical Noise Analyzer
A0020A Laser Linewidth Measurement System
RIN Spectrum - Up to 40 GHz BW
- Single & Multi-mode
- From $75k to $175k*
Optical Noise Spectrum - Up to 80 MHz BW
- Lorentzian Linewidth
- From $100k to $150k*
Laser Linewidth - C and L-Band
- Down to 40 kHz
- From $75k* *Typical pricing. Actual prices will vary by configuration.
Page 33

Finding Out More About Measurement Alternatives
– TEL: +81-42-660-0881
– FAX: +81-42-660-0882
– Email: [email protected]
– URL: www.sycatus.com
– TEL: +1-775-473-9907
– FAX: +1-775-473-9916
– Email: [email protected]
– URL: www.ogmentum.com
– TEL: +1-800-829-4444
– FAX: +1-800-829-4433
– Email: [email protected]
– URL: www.keysight.com
Page 34