Embed Size (px)
Citation preview
The 6th Symposium on Smart Control of Turbulence March 6 - 9, 2005, Josui Kaikan (Tokyo), Japan
1
Advances in Laser-based Sensors for Combustion Systems
Ronald K. Hanson and Jay B. Jeffries Department of Mechanical Engineering, Stanford University, Stanford, CA, 94305, USA
Laser-based spectroscopic diagnostics provide unique capabilities for in situ sensing of reactive flows, and as a result such sensors are increasingly utilized in the development and control of advanced combustion systems. This paper will overview recent progress in the evolution of two of the most widely used diagnostic concepts: planar laser-induced fluorescence (PLIF) imaging, which can provide instantaneous measurements at a large number of flowfield points in a laser-illuminated plane; and tunable diode laser (TDL) absorption, which is a line-of-sight technique with the capability of fast or even continuous measurements of multiple flowfield quantities. Of note with regard to PLIF imaging is the progress in two areas: imaging of fuel distributions and fuel-air mixing through the use of flow tracers, and the extension of PLIF to high-pressure combustion gases. There have been many recent advances in TDL sensing, but here we will emphasize three aspects: the development of wavelength-multiplexed absorption concepts, allowing multiple measurements along each line of sight; the development of real-time TDL sensors for control applications; and the rapid growth in applications of TDL methods to the development of new concepts for practical combustors and propulsion systems.
1. Background Interest in cleaner-burning and higher-performance combustion and propulsion systems has been a major driver in the development of advanced measurement techniques based on lasers. Of the numerous methods developed thus far, spectrally-resolved absorption and laser-induced fluorescence are especially attractive owing to high signal strength, species specificity, and relative simplicity of equipment and data interpretation. In addition, variations of these non-invasive methods have been developed that allow sensing of multiple flowfield parameters, including species concentrations, temperature, pressure and velocity. Absorption is a line-of-sight (LOS) method, and utilizes either fixed-wavelength or rapidly tuned, variable-wavelength laser sources, while fluorescence affords spatially resolved measurements. Typically a continuous wave (cw) or quasi-cw laser is used as the light source for absorption while a pulsed laser (tunable or fixed-wavelength) is used for fluorescence excitation. It is increasingly common to use multiple lasers for simultaneous absorption measurements; we term this approach “wavelength-multiplexing,” consistent with terminology for telecommunications. When laser-induced fluorescence is conducted with a sheet of laser light and a 2-D detector array, the method is termed planar laser-induced fluorescence (PLIF). These detector arrays may be operated with or without a gated intensifier; the latter is common for applications in luminous environments such as flames. The underlying theory for both absorption and fluorescence is well understood, though quantitative measurements require knowledge of spectroscopic and collisional parameters that may be poorly known. These parameters are often the target of complementary studies in our laboratory.
Laser absorption is a relatively mature technique that may be executed using ultraviolet, visible or infrared lasers, and important results have been obtained in all these spectral domains. However, over the last decade, there has been a growing emphasis on the use of near-infrared (NIR, i.e., the wavelength interval from approximately 700 nm to 3 microns) diode laser sources developed for use in the telecommunications industry. These lasers can be quite economical and extremely robust, and can generally be coupled to optical fibers to allow transmission of light to and from the measurement location, e.g. stationary combustors or the engine of a propulsion system. Unfortunately, lasers are not available at all wavelengths of interest, although access over much of the wavelength range from about 750 nm to 2.3 microns is improving and is sufficient for many applications. The relatively low cost and robustness of TDL sensors, combined with fast response and relative simplicity of operation and data interpretation, have led to rapid progress in the application of these sensors in real combustors, including combustion control.
In sections 2 and 3, we highlight noteworthy examples of recent progress in the areas of PLIF Imaging and TDL Absorption. The paper will conclude with a short section on Future Developments.

The 6th Symposium on Smart Control of Turbulence March 6 - 9, 2005, Josui Kaikan (Tokyo), Japan
2
2. Planar Laser-Induced Fluorescence Imaging Laser diagnostics capable of providing 2-D images of key flowfield parameters are extremely valuable tools in fundamental studies of reactive gasdynamics and in applied studies of combustion and propulsion systems, especially when these flows are turbulent and spatially nonuniform. The distribution of fuel in a combustor is of obvious import, and hence considerable research has been done to evaluate and develop schemes for monitoring fuel concentration via PLIF. A particularly successful strategy has been to utilize a fuel tracer with desirable fluorescence excitation/emission characteristics. Here we report recent work to extend the use of ketone tracers from acetone to 3-pentanone. We then summarize progress toward another critical measurement goal, namely the extension of PLIF to high-pressure combustion gases, including measurements of temperature and concentrations of NO and CO2.
A. Advances in Tracer Photophysics Over about the last decade, particular success has been obtained in monitoring the mixing of gases, including
fuels, via additive tracers. Acetone is a particularly convenient additive in that it is relatively volatile (vapor pressure of about 200 Torr at room temperature) and is easy and safe to handle. From a fluorescence perspective, acetone is attractive because of its relatively strong absorption and near-constant fluorescence yield, even in the presence of oxygen, when the temperature is held constant. This means that the fluorescence signal from acetone is relatively independent of composition and is determined almost entirely from the laser intensity and acetone concentration. As a result, following the first papers on PLIF of acetone in the early 1990’s1, the method quickly gained wide acceptance owing to the high quality images of mixture fraction which could be obtained. Subsequently, it was realized that the fluorescence signal from acetone varied with excitation wavelength and temperature. The discovery of these dependencies led to the development of a simple photophysical model for acetone that incorporates effects of wavelength, gas mixture, temperature and pressure2, as well as to a demonstration of simultaneous imaging of acetone concentration and temperature through use of two lasers and a single inter-line transfer camera3.
More recently, the successful use of acetone for fuel imaging was extended to the use of 3-pentanone, a larger member of the ketone family, to more closely match the boiling point of the tracer to that of iso-octane, a typical fuel. All the species in this family have a carbonyl bond, which is thought responsible for fast intersystem crossing between excited electronic states and hence a near-constant quantum yield (at fixed temperature, pressure, and excitation wavelength). Although 3-pentanone has been used effectively in practical engines, little has been done to evaluate the fundamental photophysics of 3-pentanone and to verify its similarity to acetone. Recent work at Stanford has sought to address the photophysics of 3-pentanone using variable excitation wavelengths and thermodynamic conditions (temperature, pressure, and mixture). We find the photophysical behavior of 3-pentanone4 to be qualitatively similar but quantitatively different from acetone previously observed in our group2. The key differences are highlighted in Fig. 1, which provides a plot of the fluorescence ratio obtained for different excitation wavelength pairs commonly used for both acetone and 3-pentanone. It is clear that the temperature sensitivity of 3-pentanone is greater than acetone. Also, the absolute values of the fluorescence yield in 3-pentanone are slightly greater.
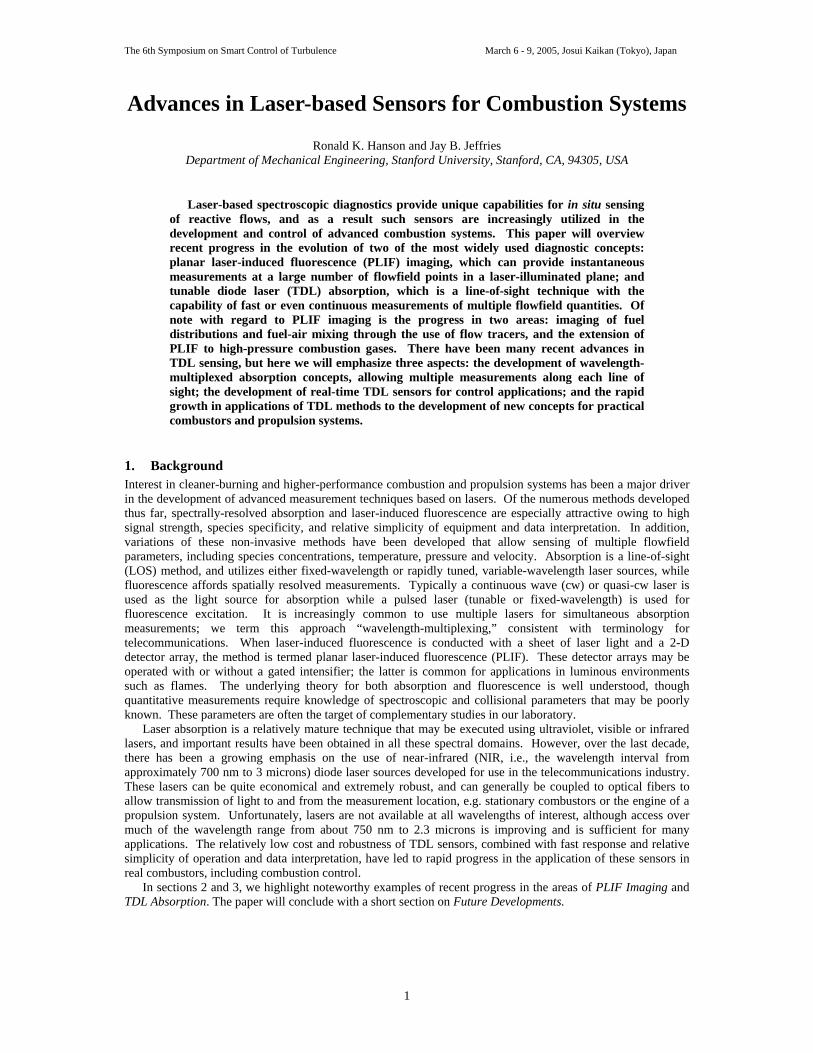
We illustrate the potential use of dual-wavelength (308/266nm) excitation of 3-pentanone in Fig. 2, which provides instantaneous images of temperature and 3-pentanone mole fraction in a heated turbulent jet4. The flowfield studied is a jet of 3-pentanone/air (about 4% 3-pentanone) into an ambient environment of air traced with a low level of 3-pentanone. The images were obtained using a single CCD camera (interline transfer, Roper Scientific Micromax, 2 images in ~ 2 µs) and laser pulse energies ~50 mJ formed into a sheet (0.07 cm thick x 7.5 cm tall).
Current work with 3-pentanone is directed toward assembling a quantitative photophysical model to explain the observed effects of wavelength, temperature, mixture (including oxygen) and pressure on the fluorescence signal5. These studies include collaborations with the University of Michigan and the University of Heidelberg.
300 400 500 600 700 800 900 1000
5
10
15
20
25 308/248 nm excitation 3-pentanone Acetone: Thurber
308/266 nm excitation 3-pentanone Acetone: Thurber
Rel
ativ
e Fl
uore
scen
ce R
atio
Temperature [K]
Figure 1. Normalized fluorescence ratio for LIF from 3-pentanone (308/248nm black and 308/266nm red) and acetone (306/248nm green and 308/266nm blue).
The 6th Symposium on Smart Control of Turbulence March 6 - 9, 2005, Josui Kaikan (Tokyo), Japan
3
Recently, we have begun the study of aromatic hydrocarbon tracers such as toluene5,6. Toluene is present in gasoline and its volatility matches well with the mid-to-high boiling point compounds in standard fuels, and has been used to image fuel/air ratio in IC engines7. Recent model predictions at engine conditions using detailed chemical reaction mechanisms suggest that aromatic molecules are more stable than ketones and thus will enable measurements to higher temperatures.
B. PLIF in High-Pressure Combustion Gases During the past decade extension of PLIF to high pressures and detection of NO have become key targets for PLIF measurements in the combustion gases of practical stationary combustors and piston and gas turbine engines. Interests include quantitative measurements of naturally formed NO and the use of seeded NO as a tracer. Natural NO is formed in the flame and is present in the post-combustion gases. PLIF measurements of the spatial distribution of naturally formed NO provide a diagnostic that can be used to minimize the amount of pollutant NO produced. NO can also be seeded into both fuel and oxidizer flows, and PLIF of the seeded NO can then be used to determine the temperature and to quantify fuel/oxidizer mixing. Thus PLIF of NO provides the engine designer an extremely useful tool to validate numerical models, optimize performance, minimize pollution, and to evaluate combustion control strategies.
Quantitative NO LIF/PLIF is complicated by interference from competing signals from O2 and CO2. Although this interference can be minimized at atmospheric pressure by proper selection of excitation and detection wavelengths, the inference rapidly increases with pressure because of the pressure dependence of the fluorescence quantum yield (FQY) and pressure broadening of individual transitions. First, the NO FQY decreases as pressure increases, while the FQY of O2 and CO2 fluorescence remain nearly constant, and thus the ratio of NO LIF signal to the LIF signals from O2 and CO2 decreases as pressure increases. Second, pressure broadening increases the overlap between the NO absorption features and those of O2, making it difficult to select excitation wavelengths for NO that do not also produce a strong O2 LIF signal in the flame zone and the burnt gases of fuel lean flames.
To develop and validate design rules for quantitative LIF in high-pressure combustion gases, we have conducted a systematic study8-10 of NO LIF in the burnt gases of a premixed flame at pressures ranging from 1-60 bar. The UV absorption by hot CO2 becomes very strong at short wavelengths11, and quantitative NO PLIF using D-X excitation at 193 nm at elevated pressures becomes nearly impossible12. Therefore, we have concentrated on NO LIF diagnostic schemes using selected rotational transitions in specific vibrational bands of the A-X electronic system.
The high-pressure burner was designed for optical studies and has four orthogonal viewports. Flames are stabilized on an 8 mm diameter porous plug, and this stable high-pressure laminar flame provides a well-understood test environment to develop high-pressure combustion diagnostics. NO is excited in burnt gases with wavelength-tunable light from an ND:YAG laser (Quanta Ray GCR250) that pumps a frequency-doubled dye laser (LAS,
750
700
650
600
550
500
450
400
350
300
Te
mp
era
ture
[K]
1.0
0.9
0.8
0.7
0.6
0.5
0.4
0.3
0.2
0.1
Je
tF
luid
Fra
ctio
n
1.1
0.0
Figure 2. Images from ref. 4 of a heated, turbulent jet using 308/266nm excitation of 3-pentanone. The jet core contains about 4.5% 3-pentanone while the co-flow contains 1.5%. RMS resolutions are 15K and 5% jet fluid fraction while peaktemperatures are close to 670K (limited by capabilities of theheated jet facility).
220 240 260 280 3000
10
20
30
40
50
60
Rayleigh scattering
Sum
CO2 LIF
O2 LIF
NOLIFLI
F in
tens
ity [a
.u.]
Wavelength [nm]
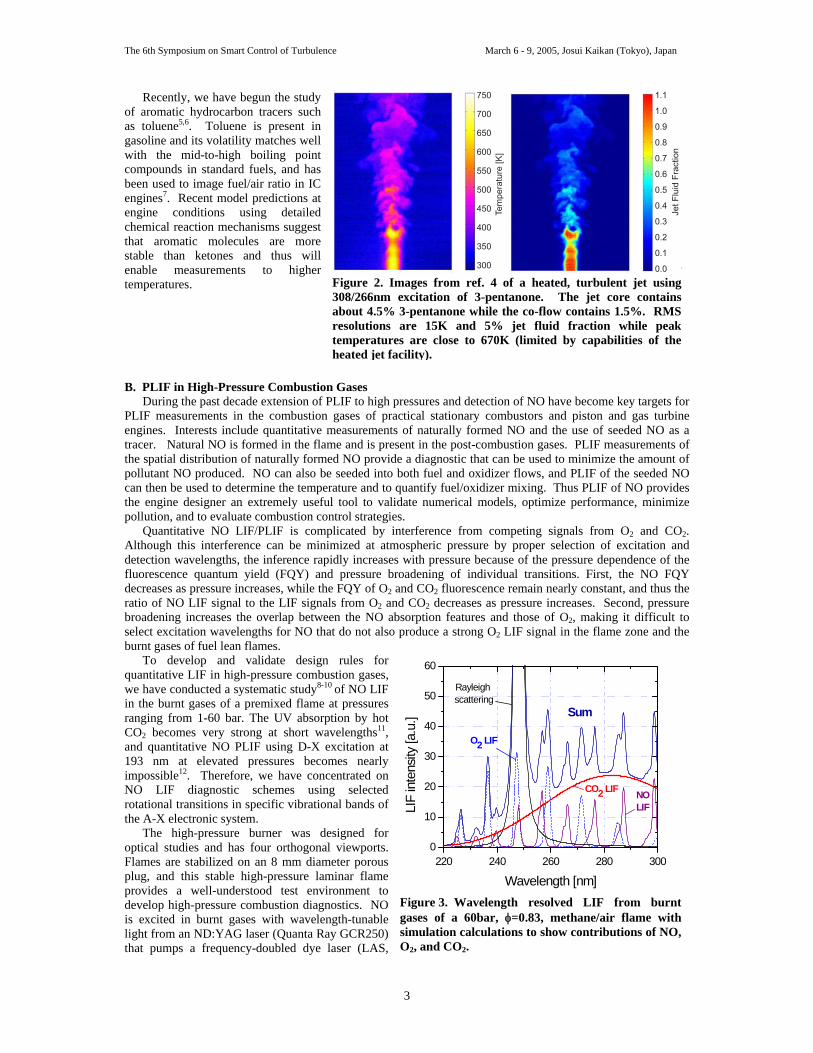
Figure 3. Wavelength resolved LIF from burnt gases of a 60bar, φ=0.83, methane/air flame with simulation calculations to show contributions of NO, O2, and CO2.
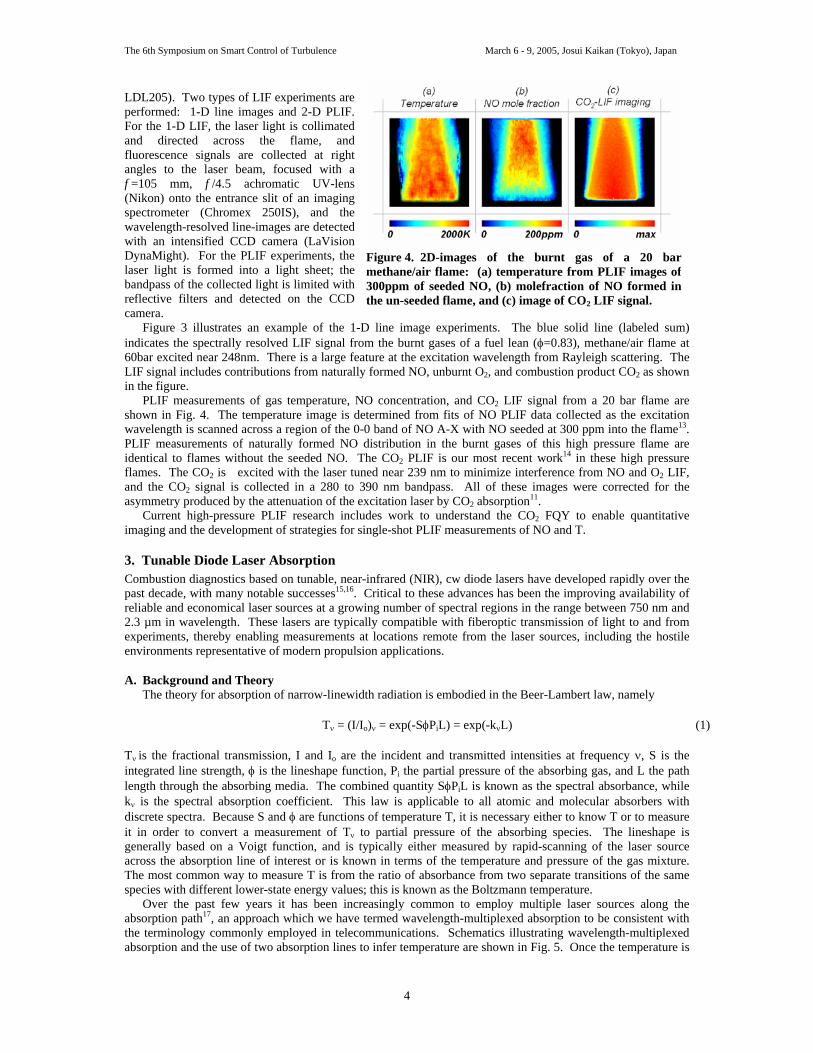
Figure 4. 2D-images of the burnt gas of a 20 bar methane/air flame: (a) temperature from PLIF images of 300ppm of seeded NO, (b) molefraction of NO formed in the un-seeded flame, and (c) image of CO2 LIF signal.
750
700
650
600
550
500
450
400
350
300
Te
mp
era
ture
[K]
1.0
0.9
0.8
0.7
0.6
0.5
0.4
0.3
0.2
0.1
Je
tF
luid
Fra
ctio
n
1.1
0.0
Figure 2. Images from ref. 4 of a heated, turbulent jet using 308/266nm excitation of 3-pentanone. The jet core contains about 4.5% 3-pentanone while the co-flow contains 1.5%. RMS resolutions are 15K and 5% jet fluid fraction while peaktemperatures are close to 670K (limited by capabilities of theheated jet facility).
The 6th Symposium on Smart Control of Turbulence March 6 - 9, 2005, Josui Kaikan (Tokyo), Japan
4
LDL205). Two types of LIF experiments are performed: 1-D line images and 2-D PLIF. For the 1-D LIF, the laser light is collimated and directed across the flame, and fluorescence signals are collected at right angles to the laser beam, focused with a f =105 mm, f /4.5 achromatic UV-lens (Nikon) onto the entrance slit of an imaging spectrometer (Chromex 250IS), and the wavelength-resolved line-images are detected with an intensified CCD camera (LaVision DynaMight). For the PLIF experiments, the laser light is formed into a light sheet; the bandpass of the collected light is limited with reflective filters and detected on the CCD camera.
Figure 3 illustrates an example of the 1-D line image experiments. The blue solid line (labeled sum) indicates the spectrally resolved LIF signal from the burnt gases of a fuel lean (φ=0.83), methane/air flame at 60bar excited near 248nm. There is a large feature at the excitation wavelength from Rayleigh scattering. The LIF signal includes contributions from naturally formed NO, unburnt O2, and combustion product CO2 as shown in the figure.
PLIF measurements of gas temperature, NO concentration, and CO2 LIF signal from a 20 bar flame are shown in Fig. 4. The temperature image is determined from fits of NO PLIF data collected as the excitation wavelength is scanned across a region of the 0-0 band of NO A-X with NO seeded at 300 ppm into the flame13. PLIF measurements of naturally formed NO distribution in the burnt gases of this high pressure flame are identical to flames without the seeded NO. The CO2 PLIF is our most recent work14 in these high pressure flames. The CO2 is excited with the laser tuned near 239 nm to minimize interference from NO and O2 LIF, and the CO2 signal is collected in a 280 to 390 nm bandpass. All of these images were corrected for the asymmetry produced by the attenuation of the excitation laser by CO2 absorption11.
Current high-pressure PLIF research includes work to understand the CO2 FQY to enable quantitative imaging and the development of strategies for single-shot PLIF measurements of NO and T.
3. Tunable Diode Laser Absorption Combustion diagnostics based on tunable, near-infrared (NIR), cw diode lasers have developed rapidly over the past decade, with many notable successes15,16. Critical to these advances has been the improving availability of reliable and economical laser sources at a growing number of spectral regions in the range between 750 nm and 2.3 µm in wavelength. These lasers are typically compatible with fiberoptic transmission of light to and from experiments, thereby enabling measurements at locations remote from the laser sources, including the hostile environments representative of modern propulsion applications.
A. Background and Theory The theory for absorption of narrow-linewidth radiation is embodied in the Beer-Lambert law, namely
Tν = (I/Io)ν = exp(-SφPiL) = exp(-kνL) (1)
Tν is the fractional transmission, I and Io are the incident and transmitted intensities at frequency ν, S is the integrated line strength, φ is the lineshape function, Pi the partial pressure of the absorbing gas, and L the path length through the absorbing media. The combined quantity SφPiL is known as the spectral absorbance, while kν is the spectral absorption coefficient. This law is applicable to all atomic and molecular absorbers with discrete spectra. Because S and φ are functions of temperature T, it is necessary either to know T or to measure it in order to convert a measurement of Tν to partial pressure of the absorbing species. The lineshape is generally based on a Voigt function, and is typically either measured by rapid-scanning of the laser source across the absorption line of interest or is known in terms of the temperature and pressure of the gas mixture. The most common way to measure T is from the ratio of absorbance from two separate transitions of the same species with different lower-state energy values; this is known as the Boltzmann temperature.
Over the past few years it has been increasingly common to employ multiple laser sources along the absorption path17, an approach which we have termed wavelength-multiplexed absorption to be consistent with the terminology commonly employed in telecommunications. Schematics illustrating wavelength-multiplexed absorption and the use of two absorption lines to infer temperature are shown in Fig. 5. Once the temperature is
Figure 4. 2D-images of the burnt gas of a 20 bar methane/air flame: (a) temperature from PLIF images of 300ppm of seeded NO, (b) molefraction of NO formed in the un-seeded flame, and (c) image of CO2 LIF signal.

The 6th Symposium on Smart Control of Turbulence March 6 - 9, 2005, Josui Kaikan (Tokyo), Japan
5
known, either the peak signals or integrated areas of absorption features can be used to determine the concentration of individual species.
The near-infrared region is especially attractive for measurements in propulsion systems as most of the key reactant and product species absorb at these wavelengths. Figure 6 provides a plot of the absorption line strengths of H20 vapor, CO2 and CO as a function of wavelength in the near-infrared, evaluated at a representative combustion temperature of 1500 K. Note that each of these species has multiple absorption bands in this spectral region, but water vapor is especially prominent owing to numerous combination and overtone bands. Hence water vapor has been a primary target of many TDL combustion sensors, particularly to determine temperature but also to measure the concentration of combustion products. Although not shown, molecular oxygen also has a useful absorption band, centered near 760 nm18, and hydrocarbon fuels typically have strong absorption bands centered near 3 microns (vibrational fundamental bands)19 and weaker absorption bands near 1.6-1.7 microns (first overtone)19. The spectral database, HITRAN20,21, has proven very useful in the design of absorption sensors. In recognition of the wide range of operating conditions and absorption path lengths, we have elucidated design rules and developed a computer program to select optimum water vapor transitions22. It is typically necessary to verify23 the database values for the selected transitions including
Detect light
Multiplexed lasers
Disperse transmitted
lightλ1
λ2λ3λ4 λ1 λ3λ2 λ4
λ
Abs
orba
nce
λ2
λ1Absorbance ∝ kν
Temp
k ν2/k
ν1
Ratio of peak heightyields gas temperature
Detect light
Multiplexed lasers
Disperse transmitted
lightλ1
λ2λ3λ4 λ1 λ3λ2 λ4
λ
Abs
orba
nce
λ2
λ1Absorbance ∝ kν
Temp
k ν2/k
ν1
Ratio of peak heightyields gas temperature
λ
Abs
orba
nce
λ2
λ1Absorbance ∝ kν
λ
Abs
orba
nce
λ2
λ1
λ
Abs
orba
nce
λ2
λ1Absorbance ∝ kν
Temp
k ν2/k
ν1
Ratio of peak heightyields gas temperature
Temp
k ν2/k
ν1
Temp
k ν2/k
ν1
Ratio of peak heightyields gas temperature
Figure 5. Wavelength-multiplexed absorption arrangement and the use of
absorbance on two transitions to determine temperature.
10-510-410-310-2
Line
stre
ngth
[cm
-2at
m-1
]
3.02.52.01.51.0Wavelength [µm]
10-310-210-1
10-510-410-310-2
H2O
CO2
T = 1500 KCO
2ν1, ν1+ν3ν1+ν2, ν2+ν3
ν1ν3
2ν1+2ν2+ν3
ν1+2ν2+ν3 ν1+ν3
2ν2+ν3
3ν
2ν
Figure 6. Near-infrared absorption line strengths for H20, CO2 and CO at 1500K.
The 6th Symposium on Smart Control of Turbulence March 6 - 9, 2005, Josui Kaikan (Tokyo), Japan
6
linestrength measurements at elevated temperatures to validate the line assignment. It is especially important to determine the collision-broadening and –shift parameters as there is relatively little data available for these parameters at elevated temperatures and for combustion gas mixtures. Several atomic species (including K, In, N, O, Cs and others) also have been probed with TDL absorption in various applications24-26.
In section B below, we will illustrate the use of TDL direct absorption sensors of temperature for combustion research with examples from our measurements of fuel in pulse detonation engines (PDEs) and in gas turbine combustors. In section C, we discuss an extension of direct-absorption TDL spectroscopy, namely wavelength-modulation with 2f detection, to determine gas temperature. Detection of the 2f wavelength-modulation absorption signal lends itself to the real-time signal processing needed to extend these sensors to combustion control applications. High-speed (2 kHz) gas temperature measurements in a liquid-fueled swirl-stabilized model gas turbine combustor are shown to demonstrate the potential of these sensors for use in control systems.
B. TDL Sensor Applications to Pulse Detonation Engines and Gas Turbine Combustors The past two years have seen the first applications of TDL sensors to realistic aeropropulsion combustors, including a variety of PDEs at Stanford University27, the Naval Postgraduate School28, and GE Research Laboratory29, as well as our first measurements30,31 in a scramjet combustor and a gas turbine sector rig, both located at the Air Force Research laboratory at Wright-Patterson AFB, OH. Independent measurements of fuel and gas temperature provide tools to investigate new combustor design concepts and have the potential for eventual use to control the next generation of propulsion combustion systems. A wavelength-scanned technique is used to monitor fuel filling in the PDEs and a wavelength-multiplexed sensor is used to measure gas temperature in the scramjet and gas turbine combustors. Details of the work can be found in the individual references27-31; here we offer only a brief overview. The simplest PDE is a closed-end tube filled with fuel/oxidizer mixture, which is ignited to form a combustion wave; a thrust advantage can be realized if this combustion wave transitions to a detonation wave. Successful propulsion use of PDEs will require repetitively pulsed engine cycles, which requires rapid, precise, control of the fuel filling. Ethylene is an attractive test fuel for PDE research because of the wide range of conditions where ethylene/oxidizer mixtures will transition from deflagration to detonation. To monitor ethylene fuel filling of PDEs, we have developed a TDL sensor that rapidly scans the Q-branch of the ethylene vibrational overtone band near 1.63 µm, illustrated in Fig. 7 from reference 28. The 10 cm-1 region between 1.628 um (6142 cm-1) to 1.626 um (6152 cm-1) is scanned at 5 kHz, and the integrated absorbance across the gas flow in a PDE is used to provide a quantitative measure of the fuel concentration as a function of time.
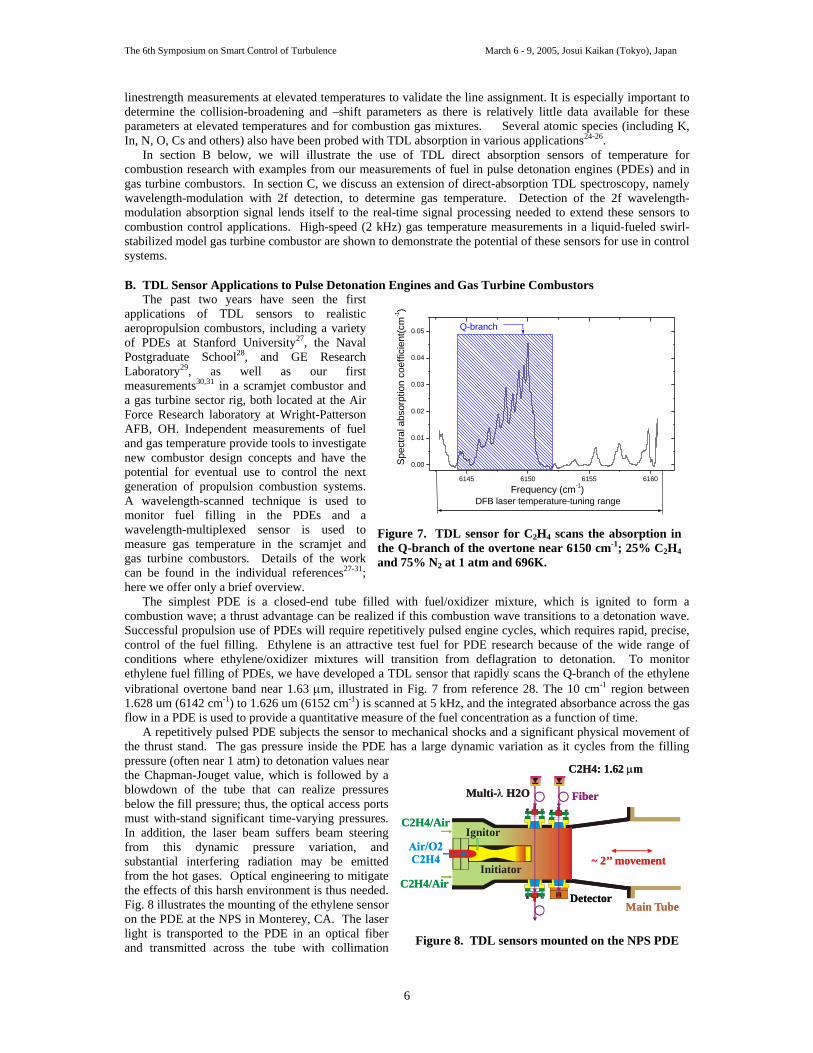
A repetitively pulsed PDE subjects the sensor to mechanical shocks and a significant physical movement of the thrust stand. The gas pressure inside the PDE has a large dynamic variation as it cycles from the filling pressure (often near 1 atm) to detonation values near the Chapman-Jouget value, which is followed by a blowdown of the tube that can realize pressures below the fill pressure; thus, the optical access ports must with-stand significant time-varying pressures. In addition, the laser beam suffers beam steering from this dynamic pressure variation, and substantial interfering radiation may be emitted from the hot gases. Optical engineering to mitigate the effects of this harsh environment is thus needed. Fig. 8 illustrates the mounting of the ethylene sensor on the PDE at the NPS in Monterey, CA. The laser light is transported to the PDE in an optical fiber and transmitted across the tube with collimation
6145 6150 6155 6160
0.00
0.01
0.02
0.03
0.04
0.05 Q-branch
DFB laser temperature-tuning rangeFrequency (cm-1)
Spec
tral a
bsor
ptio
n co
effic
ient
(cm
-1)
Figure 7. TDL sensor for C2H4 scans the absorption in the Q-branch of the overtone near 6150 cm-1; 25% C2H4and 75% N2 at 1 atm and 696K.
C2H4/Air
C2H4/AirDetector
Fiber
Ignitor
Initiator
C2H4: 1.62 m 3.39 m
µµ
Main Tube
~ 2’’ movement
A
A
Multi- H2Oλ
C2H4/Air
C2H4/AirDetector
Fiber
Ignitor
Initiator
C2H4: 1.62 m 3.39 m
µµ
Main Tube
~ 2’’ movement
A
A
Multi- H2Oλ
Figure 8. TDL sensors mounted on the NPS PDE

The 6th Symposium on Smart Control of Turbulence March 6 - 9, 2005, Josui Kaikan (Tokyo), Japan
7
optics. The transmitted beam is collected in an integrating sphere, filtered to limit the optical bandpass, and detected; this detector package is mounted directly to the engine. The fuel sensor can then be used to adjust the valve timing to insure that the PDE is precisely filled with fuel/oxidizer, and Fig. 9 shows a typical measurement of the delay between the valve timing signals and the arrival of the fuel at the measurement location. These measurements are used to synchronize the valve timing and ignition pulse to insure optical fuel/oxidizer distribution in the PDE, and are crucial to optimize PDE performance. Integration of the wavelength-scanned absorbance is used to calibrate the fuel delivery system to provide a known fuel/oxidizer stoichiometry. These measurements are required to connect PDE test data with model predictions of PDE performance. The single-laser absorption measurement used for ethylene in PDEs has been extended to a wavelength-multiplexed approach illustrated in Fig 5 to monitor water vapor and water vapor temperature in model propulsion combustors. A schematic of the measurement location and environment for gas turbine combustor measurements30 is given in Fig. 10. This was a challenging measurement campaign in that the gas turbine sector rig operates at elevated pressures and temperatures and is located inside a large pressure vessel. Hence it was necessary to utilize specialty fiber optic components, fabricated into customized stainless steel probes that were fed through the pressure vessel wall and into a “window frame” mount at the combustor exit plane. These custom optical systems were required to transmit the laser light to the test region, collimate and “pitch” the light across the width (3 inches) of the combustor exit plane, and then “catch” the light and transmit it through custom fiber optics to the separate detectors used to characterize absorption at each of the three wavelengths used. Critical parts of the optical train were cooled with water or air. Although some adjustments to our initial design were required during the week while these tests were conducted, this first-generation sensor system successfully yielded useful laser absorption data, and we are very optimistic that a second-generation system incorporating some of the lessons-learned will yield data of even higher quality in future high-pressure combustor applications. The first measurement campaign was aimed at demonstrating feasibility of measuring temperature at multiple locations in the combustor rig exit plane. The eventual goal would be to utilize TDL sensors in a control scheme to minimize temperature non-uniformities. Representative results at one test condition, at 100 psi pressure, are shown in Fig. 11. These data were obtained using scanned-wavelength (1 kHz scan rate) direct absorption, with an effective time response of 0.1 seconds. Note that the sensor successfully captures the level of nonuniformity in temperature across the exit plane. Future work would be aimed at improving the time response of the TDL sensor to enable measurements of fluctuations up to a few kHz. We believe that this is feasible, even at increased operating pressures, using the wavelength-modulation methods to be discussed in the next sub-section.
Our group has performed similar feasibility measurements of water vapor temperature in other propulsion systems, most notably the scramjet engine test rig at WPAFB30,31 and in multiple pulse detonation engine test rigs (at Stanford32, at the Naval Postgraduate School28, and at the Naval Air Weapons Station at China Lake). The range of flow conditions encountered in these PDE and propulsion combustor tests is large, and yet success has been achieved in all cases. In the detonation examples, temperatures can exceed 3000 K, while in supersonic combustion the temperatures may be as low as 1000 K, with equally wide variations in pressure and
0 50 100 150 200
0.00
0.05
0.10
0.15
0.20
0.25
0.30
Valve closed
C2H
4 con
cent
ratio
n
Time after first fuel valve opening (ms)
C2H4 concentration Fuel valve control signal
Valve opened Spark
Φ =1.
Figure 9. Measurements of C2H4 from the TDLsensor and valve timing signals from the repetitively pulsed PDE at NPS.
Combustor exit plane
λ3λ1
Multiple measurementchannels at exit plane
Air flow in
Individual fuel nozzles P=5-50 bar
λ2
λ1 λ2 λ3
Multiplexed diode laser temperature sensor
Combustor exit plane
λ3λ1
Multiple measurementchannels at exit plane
Air flow in
Individual fuel nozzles P=5-50 bar
λ2
λ1 λ2 λ3
λ3λ1
Multiple measurementchannels at exit plane
Air flow in
Individual fuel nozzles P=5-50 bar
λ2
λ1 λ2 λ3
Multiplexed diode laser temperature sensor
Figure 10. Schematic of TDL implementation in high-pressure gas turbine sector rig at WPAFB.

The 6th Symposium on Smart Control of Turbulence March 6 - 9, 2005, Josui Kaikan (Tokyo), Japan
8
flow velocity. The variation in test environments has been extreme, ranging from a clean university setting to remote operation in the desert with the lasers and personnel located far from the test engine. Each test facility has presented challenges, in terms of dealing with heat transfer, beam-steering, interference emission and electrical effects, but these challenges have been met successfully, leading to a useful body of experience as to how TDL sensors can be optically engineered to provide quantitative data for temperature and species concentration, and with fast time response.
The successes achieved with these early TDL sensors, in a variety of practical propulsion facilities, augurs well for a growing role of these sensors in the development and testing of advanced propulsion systems.
C. Extension to 2f Detection for Real-Time Temperature Sensing Wavelength modulation, in conjunction with second-harmonic (2f) detection, is well-known as a means to
increase signal to noise ratios (SNR), but typically at the expense of ease of signal interpretation and simplicity of experimental design33-35. However, significant simplifications in 2f schemes have been demonstrated recently that make this general approach very attractive for many propulsion applications. For example, for the purpose of measuring temperature, taking 2f peak ratios of absorption features, while making a judicious choice of modulation indices, can greatly simplify signal interpretation and calibration30. Also, with the advent of modern computer technologies and software, it is possible to perform wavelength modulation spectroscopy using digital waveform generation and lock-in detection at hundred-kilohertz rates without dedicated signal generation or lock-in hardware30,36-39.
The wavelength of the TDL can be modulated by adding a sinusoidal variation to the injection current, and the time-varying laser frequency is given by: ( ) ( )ftat πνν 2cos×+= , where f is the modulation frequency and a is the modulation amplitude. It is common to characterize the signal observed at 2f in terms of a dimensionless modulation index, m = a/∆ ν, where ∆ν is the width (hwhm) of the absorption feature. The optimum value of m, for purposes of signal strength and minimum sensitivity to the specific value of the linewidth, is about 2.2. For purposes of temperature sensing, 2f spectroscopy is both simple and capable of higher accuracy and bandwidth than direct-absorption measurements alone. In particular, we have shown, through calculations and experimental validations, that the interpretation of 2f peak height ratios to determine gas temperature is closely analogous to using direct absorbance ratios, provided that the modulation indices are optimized39. Thus, at least for temperature measurements, 2f spectroscopy becomes relatively straightforward and practical as a method to supplement or replace direct absorption techniques.
The improvement in absorption detection sensitivity afforded by 2f methods enables us to consider transitions that would be too weak for precise direct absorption measurements with the pathlength available in the compact combustors used in a wide variety of practical applications. Fig. 12 illustrates an example of wavelength-scanned direct absorption and 2f absorption on two neighboring absorption features in the water vapor overtone region near 1.4 µm. These two features are attractive for line ratio determination of combustion temperature because the ratio of the absorbance of these two features has good sensitivity in the range 1000-2000K, neither feature has significant absorption at room temperature, and the absorption at combustion temperatures is larger than at colder temperatures expected at edge of combustion regions. In addition these two neighboring absorption features can be scanned by a single laser, which greatly simplifies the sensor design. Unfortunately, even for 10% mole fraction of water vapor expected in combustion gases, the peak absorption is only ~0.2%/cm. However, the detection improvement afforded by wavelength modulation detection makes this line pair an attractive sensor candidate even for combustors with only 5-10 cm of available pathlength.
Fig. 12 also illustrates the data reduction simplification achieved with 2f detection. The baseline fitting that is required to extract absorption line shapes in scanned direct-absorption measurements can be a large source of uncertainty and computational complexity. Baseline fitting becomes especially problematic when absorption is weak, as it is difficult to determine where a zero-absorption baseline begins and ends. These are important effects, since small changes in the fitted baseline can significantly alter the apparent shape and integrated
Multiplexeddiodelasers
CombustorExit
Plane
λ1 λ2 λ3
λ1λ2
λ3
Laser detectors
1 2 3 4 5 6 7
Fuel injector 3Fuel injector 2
(Channel numbers)
T ~ 2200 ± 300K(3500F)
T ~ 1700 ± 200K(2600F)
T ~ 2000 ± 250K(3140F)
Multiplexeddiodelasers
CombustorExit
Plane
λ1 λ2 λ3
λ1λ2
λ3
Laser detectors
1 2 3 4 5 6 7
Fuel injector 3Fuel injector 2
(Channel numbers)
T ~ 2200 ± 300K(3500F)
T ~ 1700 ± 200K(2600F)
T ~ 2000 ± 250K(3140F)
Figure 11. Combustor “window frame” optical mount and first TDL measurements of temperature in a gas turbine combustor test rig at WPAFB for a run at P = 100 psi.

The 6th Symposium on Smart Control of Turbulence March 6 - 9, 2005, Josui Kaikan (Tokyo), Japan
9
absorption of a feature, especially when absorption is weak and/or fluctuations in transmitted intensity are present owing to interference effects and beam-steering.
As illustrated in Fig. 12, the second-harmonic signal, typically evaluated at the peak of an absorption feature, is relatively uninfluenced by these baseline issues as it is primarily sensitive to the shape of the absorption feature, and for an isolated feature the scanned 2f has a zero baseline. Hence, in addition to the advantages of increased SNR, 2f detection is an attractive means of dealing with noisy signals and/or weak absorption signals.
In practice, 2f spectroscopy can be done in either of two modes: scanned-wavelength (as illustrated in Fig. 12 from ref. 38), which allows recording of the complete 2f lineshape, or fixed-wavelength, in which case only the peak 2f signal is recorded. The latter method is employed when maximum measurement bandwidth is needed. The single-laser, scanned-2f temperature sensor was compared with thermocouple measurements in a simple furnace. The DFB diode laser operating near 1.398 µm is driven by a 2 kHz saw-tooth ramp summed with a faster 100 kHz sinusoidal modulation signal. The transmission signals are transferred to a lock-in amplifier, and the output 2f signals of the lock-in are fed into a computer for on-line data analysis. A laboratory code (written in C++) is used to provide real-time temperature measurements. The 4% scatter in the data is well within the uncertainty of the thermocouple, providing confirmation of the accuracy of this fast (2 kHz) scanned-wavelength 2f temperature sensor.
Fiber-Coupled Diode Laser
Collimator
Filtered Detector
Fiber-Coupled Diode Laser
Collimator
Filtered Detector
4000
3000
2000
1000
0
Tem
pera
ture
[K]
0.50.40.30.20.10.0Time [s]
2kHz Real-Time
Figure 13. Swirl-stabilized Jet-A flame in a round duct with example 2 kHz temperature data from a
single-laser wavelength-scanned 2f absorption sensor. Fig. 13 illustrates the harsh environment of a swirl-stabilized model gas turbine combustor using a liquid
(spray) Jet-A fuel at the University of Cincinnati. The real-time 2 kHz temperature measurements using the
10x10-3
9
8
7
6
5
4
3
2
1
0
Abs
orpt
ion
coef
ficie
nt [c
m-1
]
1398.001397.901397.801397.701397.60Wavelength [nm]
T = 296 K T = 1000 K T = 2000 K
P = 1 atmX = 10%
3.0x10⁻³
2.5
2.0
1.5
1.0
0.5
0.0
-0.5
-1.0
-1.5
2f s
igna
l [ar
b.un
its]
1398.001397.901397.801397.701397.60Wavelength [nm]
T = 296 K T = 1000 K T = 2000 K
P = 1 atmX = 10%
a = 0.06 cm-1
Figure 12. Wavelength scanned absorption for a 1 cm path length in air at 1 atm pressure with 10% water vapor for three different temperatures, 296, 1000, and 2000K. Panel on the right is direct absorption and on the left is wavelength modulated absorption detected at 2f with a=0.06 cm-1.

The 6th Symposium on Smart Control of Turbulence March 6 - 9, 2005, Josui Kaikan (Tokyo), Japan
10
scanned-wavelength 2f sensor illustrate the potential of this sensor. The power spectrum of the time series of temperature measurements clearly shows evidence of the 364 Hz fundamental instability of this flame.
These demonstration measurements illustrate the excellent potential of TDL sensors for practical combustion monitoring and control applications.
4. Future Developments Continued advances may be expected with both PLIF and TDL sensing, resulting in expanded use by scientists and engineers engaged in combustion and propulsion research and development. PLIF is likely to remain an expensive, relatively complex diagnostic tool, best-suited for use in a controlled laboratory environment, but the high value of PLIF images to guide understanding of complex, time-varying combustion flows ensures a continued and expanding role for PLIF. TDL sensing, by contrast, offers good potential to provide economical, rugged and simple systems which will begin to see use as standard laboratory tools and should also find eventual application in control schemes to improve performance of combustion and propulsion systems. It is likely that TDL sensing will enable measurements of an expanding number of relevant species as well as flowfield quantities such as temperature and even velocity. Remote measurements have been demonstrated in a range of hostile environments, and it is clear that there is considerable untapped potential for further applications, even including flight systems. The ability of TDL sensing to measure many molecular and atomic species, over a wide range of conditions, ensures that the number of applications will grow well beyond current demonstrations.
In terms of specific new frontiers for PLIF, two directions may be cited. First is the extension of PLIF to the infrared, using IR light sources and cameras40,41. IR PLIF offers great potential to allow imaging of species not amenable to UV and visible excitation, including particularly fuel species and combustion products such as CO2. Secondly, the use of tracers for PLIF imaging will grow, with fuel tracers such as ketones and toluene as good examples. Improved understanding of the underlying photophysics of such tracers will lead to increasingly quantitative data for propulsion flows using PLIF in conjunction with flow tracers.
There are many likely new applications of TDL sensing on the horizon including a variety of propulsion systems, as well as many engineering systems outside the propulsion domain. In terms of new sensing strategies, one emerging approach can be mentioned, and that is the movement toward increasing the number of wavelengths utilized for simultaneous measurements. As was indicated in Fig. 5, it is now feasible to combine the light from multiple lasers into a common measurement path. We currently utilize up to 5 lasers in a single set-up in our laboratory, but it is reasonable to consider increasing this number substantially. We term this approach “dense-wavelength-multiplexed absorption,” or DWMA, consistent with the terminology employed in telecommunications. (In situations where light is attenuated due to combined effects of scattering and absorption, as in the case of droplets or particulates, we would use the term DWME, for dense-wavelength-multiplexed extinction.) We are now designing DWMA and DWME systems based on these ideas and have begun to explore the ways that the data obtained might be used to infer new quantities. Certainly, as the amount of data obtained along a common measurement path is increased, it is no longer necessary to think of absorption or extinction measurements as capable of yielding only path-averaged information, but rather it may be feasible to characterize distribution function of properties along the measurement path.
5. Acknowledgements The authors wish to acknowledge with thanks the many past and current students who have contributed to Stanford’s research program on laser-based diagnostics for propulsion, including particularly Mark Thurber, Antonio Lozano, Jon Koch, Brian Kirby, David Rothamer, Tonghun Lee, and Brian Cheung for their efforts on PLIF, and Doug Baer, Ted Furlong, Michael Webber, Scott Sanders, Radu Mihalcea, Jon Liu, Greg Rieker, Lin Ma, Suhong Kim, Sherry Liu, Xin Zhou, Dan Mattison and Dr. Louis Philippe for their involvement with TDL sensing. We are also grateful to colleagues from the University of Heidelberg who have collaborated in our PLIF research, including Professor Christof Schulz (now at the University of Duisberg), Dr. Wolfgang Bessler, Wieland Koban and Helmut Kronemayer.
Finally, we thank our sponsors, the Air Force Office of Scientific Research, the Office of Naval Research
(Programs on Emissions Control and Pulse Detonation Engines), and the Global Climate Energy Program at Stanford University with special thanks for the encouragement of our technical monitors, Dr. Julian Tishkoff (AFOSR) and Dr. Gabriel Roy (ONR).

The 6th Symposium on Smart Control of Turbulence March 6 - 9, 2005, Josui Kaikan (Tokyo), Japan
11
6. References 1Lozano, A.; Yip, B.; Hanson, R. K., “Acetone: A tracer for concentration measurements in gaseous flows by planar
laser-induced fluorescence,” Experiments in Fluids, Vol. 13, 1992, pp. 369-76. 2Thurber, M.C.; Grisch, F.; Kirby, B.J.; Votsmeier, M.; Hanson, R.K., “Measurements and modeling of acetone laser-
induced fluorescence with implications for temperature-imaging diagnostics,” Applied Optics, Vol. 37, 1998, pp. 4963-4978. 3Thurber, M.C.; Hanson, R.K., "Simultaneous Imaging of Temperature and Mole Fraction using Acetone Laser-Induced
Fluorescence," Experiments in Fluids, Vol. 30, 2001, pp. 93-101. 4Koch, J.D.; Hanson, R.K., "Temperature and Excitation Wavelength Dependences of 3-Pentanone Absorption and
Fluoresence for PLIF Applications," Applied Physics B, Vol. 76, 2003, pp. 319-324. 5Koban, W.; Koch, J.D.; Sick, V.; Wermuth, N.; Hanson, R.K.; Schulz, C., "Predicting LIF Signal Strength for Toluene
and 3-Pentanone under Transient Temperature and Pressure Conditions," Proc. Comb. Inst., Vol. 30, in press. 6Koban, W.; Koch, J. D.; Hanson, R. K.;Schulz , C., "Absorption and Fluorescence of Toluene Vapor at Elevated
Temperatures," Physical Chemistry Chemical Physics, Vol. 6, 2004, pp. 2940-2945. 7Einecke, S.; Schulz, C.; Sick, V., “Measurement of temperature, fuel concentration and equivalence ratio fields using
tracer LIF in IC engine combustion,” Applied Physics B Vol. 71, 2000, pp. 717-723. 8Bessler, W.; Schulz, C.; Lee, T.; Jeffries, J.B.; Hanson, R.K., "Strategies for laser-induced fluorescence detection of
nitric oxide in high-pressure flames: I. A-X (0,0) excitation," Applied Optics, Vol. 41, 2002, pp. 3547-3557. 9Bessler, W.; Schulz, C.; Lee, T.; Jeffries, J.B.; Hanson, R.K., “Strategies for Laser-Induced Fluorescence Detection of
Nitric Oxide in High-Pressure Flames: II. A-X (0,1) Excitation,” Applied Optics, Vol. 42, 2003, pp. 2031-2042. 10Bessler, W.; Schulz, C.; Lee, T.; Jeffries, J.B.; Hanson, R.K., “Strategies for Laser-Induced Fluorescence Detection of
Nitric Oxide in High-Pressure Flames: III. Comparison of A-X Detection Schemes,” Applied Optics, Vol. 42, 2003, pp. 4922-4936.
11Schulz, C.; Koch, J.D.; Davidson, D.F.; Jeffries, J.B.; Hanson, R.K., "Ultraviolet Absorption Spectra of Shock-Heated Carbon Dioxide and Water between 900 and 3050 K," Chemical Physics Letters, Vol. 355, 2002, pp. 82-88.
12Schulz, C.; Jeffries, J.B.; Davidson, D.F.; Koch, J.D.; Wolfrum, J.; Hanson, R.K., "Impact of UV Absorption by CO2 and H2O on NO LIF in High-Pressure Combustion Applications,” Proc. Comb. Inst., Vol. 29, 2002, pp. 2735-2742.
13Bessler, W.G.; Schulz, C.; Lee, T.; Shin, D-I.; Hofmann, M.; Jeffries, J.B.; Wolfrum, J.;Hanson, R.K., “Quantitative NO-LIF Imaging in High-pressure Flames,” Applied Physics B, Vol. 75, 2002, pp. 97-102.
14Lee, T.; Bessler, W.G.; Schulz, C.; Patel, M.; Jeffries, J.B.;Hanson, R.K., “UV Planar Laser Induced Fluorescence Imaging of Hot Carbon Dioxide in a High-Pressure Flame,” Applied Physics B, (to be published).
15Allen, M.G., “Diode Laser Absorption Sensors for Gas-Dynamic and Combustion Flows,” Meas. Sci. Technol. Vol. 9, 1998, pp. 545-562.
16Allen, M.A.; Furlong, E.R.; Hanson, R.K.,“Tunable diode laser sensing and combustion control,” in Applied Combustion Diagnostics, edited by K. Kohse-Höinghaus and J.B. Jeffries, Taylor and Francis, New York, 2002, pp. 479-498.
17Baer, D.S.; Nagali, V.; Furlong, E.R.; and Hanson, R.K., “Scanned- and Fixed-Wavelength Absorption Diagnostics for Combustion Measurements Using Multiplexed Diode Lasers,” AIAA Journal. Vol. 34, 1996, pp. 489-793.
18Philippe, L.C.; Hanson, R.K., “Laser-absorption mass flux sensor for high-speed airflows,” Optics Letters, Vol. 16, 1991, pp. 2002-4.
19Kuhn, W.E.; Beeck, D.; Egloff, G.; Kurtz Jr., S.S., “Collection, Analysis, and Distribution of the Properties of Hydrocarbons, American Petroleum Institute Research Project 44, National Bureau of Standards, Gaithersburg, Md., 1945.
20Rothman, L. S.; Barbe, A.; Benner, D. Chris; Brown, L. R.; Camy-Peyret, C.; Carleer, M. R.; Chance, K.; Clerbaux, C.; Dana, V.; Devi, V. M.; Fayt, A.; Flaud, J.-M.; Gamache, R. R.; Goldman, A.; Jacquemart, D.; Jucks, K. W.; Lafferty, W. J.; Mandin, J.-Y.; Massie, S. T.; Nemtchinov, V.; Newnham, D. A.; Perrin, A.; Rinsland, C. P.; Schroeder, J.; Smith, K. M.; Smith, M. A. H.; Tang, K.; Toth, R. A.; Vander Auwera, J.; Varanasi, P.; Yoshino, K.; “The HITRAN molecular spectroscopic database: edition of 2000 including updates through 2001,” J. Quant Spec. Rad. Trans., Vol 82, 2003, pp.5-44.
21Rothman, L.S.; Jacquemart, D.; Barbe, D.A.; D.Chris Benner, D.Chris.; Birk, M.; Browne, L.R.; Carleer, M.R.; Chackerian, C. Jr.; K. Chance, K.; Coudert, L.H.; Dana, V.; Devi, V.M.; Flaud, J-M.; Gamache, R.R.; Goldman, A.; Hartmann,J-M.; Jucks, K.W.; Maki, A.G.; Mandin, J-Y.; Massien, S.T.; Orphal, J.; Perrin, A.; Rinsland, C.P.; Smith, M.A.H.; Tennyson, J.; Tolchenov, R.N.; Toth, R.A.; Vander Auwera, J.;Varanasi, P.; Wagner, G.; The HITRAN 2004 Molecular Spectroscopic Database, http://cfa-www.harvard.edu/HITRAN/JQSRT, 2005, in press.
22Zhou, X.; Liu, X.; Jeffries, J.B.; Hanson, R.K., “Development of a Sensor for Temperature and Water Concentration in Combustion Gases Using a Single Tunable Diode Laser,” Meas. Sci. Technol., Vol. 14, 2003, pp. 1459-1468.
23Liu, X.; Zhou, X.; Jeffries, J.B.; Hanson, R.K., “Experimental Study of H2O Spectroscopic Parameters in the NIR,” 43rd Aerospace Sciences Meeting, AIAA 2005-829, 2005.
24Wehe, S.D.;Baer, D.S.; Hanson, R.K., "Diode-Laser Sensor for Velocity Measurements in Hypervelocity Flows," AIAA Journal, Vol. 37, 1999, pp. 1013-1015.
25Baer, D.S.; Chang, H.A.; Hanson, R.K., "Semiconductor Laser Diagnostics of Atomic Oxygen in Atmospheric Pressure Plasmas," J. Quant. Spectrosc. Radiat. Transfer, Vol. 50, 1993, pp. 621-633.
26Sanders, S. T.; Mattison, D.W.; Ma, L.; Jeffries, J.B.; Hanson, R.K., “Wavelength-Agile Diode-Laser Sensing Strategies for Monitoring Gas Properties in Optically Harsh Flows: Application in Cesium-Seeded Pulse Detonation Engine,” Optics Express, Vol. 10, 2002, pp. 505-514.
27Ma, L.; Sanders, S.T.; Jeffries, J.B.; Hanson, R.K., "Monitoring and Control of a Pulse Detonation Engine using a Diode-Laser Fuel Concentration and Temperature Sensor," 29th Int. Symp. on Combustion, Sapporo, Japan, July 2002; Proc. of the Comb. Inst., Vol. 29, 2002, pp. 161-166.

The 6th Symposium on Smart Control of Turbulence March 6 - 9, 2005, Josui Kaikan (Tokyo), Japan
12
28Mattison, D.W.; Brophy, C.M.;. Sanders, S.T.; Ma, L.; Hinckley, K.M.; Jeffries, J.B.; Hanson, R.K., "Pulse detonation engine characterization and control using tunable diode-laser sensors," Journal of Propulsion and Power, Vol. 19, 2003, pp. 568-572.
29L. Ma, J.B. Jeffries, R.K. Hanson, K.M. Hinckley, P.F. Pinard, and A.J. Dean, "Characterization of the Fuel Fill Process in a Multi-cycle Pulse Detonation Engine using a Diode-Laser Sensor," 41st Joint Propulsion Conf., Tucson, AZ, July 2005.
30Liu, J.T.C.; Jeffries, J.B.; Hanson, R.K.;Creighton, S.; Lovett, J.A.; Shouse, D.T., “Diode Laser Absorption Diagnostics for Measurements in Practical Combustion Flow Fields,” 39th AIAA/ASME/SAE/ASEE Joint Propulsion Conference, AIAA 2003-4581, 2003.
31Rieker, G.B.; Liu, J.T.C.; Jeffries, J.B.; Hanson, R.K.; Mathur, T.; Gruber, M.R.; and Carter, C., "Wavelength-Multiplexed Tunable Diode Laser Sensor for Temperature and Water Concentration in a Scramjet Combustor," 41st Joint Propulsion Conf., Tucson, AZ, July 2005.
32Sanders, S.T.; Baldwin, J.A.; Jenkins, T.P.; Baer, D.S.; Hanson, R.K., "Diode-Laser Sensor for Monitoring Multiple Combustion Parameters in Pulse Detonation Engines," Proceedings of the Combustion Institute 28, 587-593, (2000).
33Bomse, D.S.; Stanton, A.S.; and Silver, J.A., “Frequency Modulation and Wavelength Modulation Spectroscopies: Comparison of Experimental Methods Using a Lead-Salt Diode Laser,” Applied Optics, Vol. 31, 1992, pp. 718-731.
34Reid, J.; and Labrie, D., “Second-Harmonic Detection with Tunable Diode Lasers – comparison of experiment and theory,” Applied Physics B., Vol. 26, 1981, pp. 203-210.
35Philippe, L.C.; and Hanson, R.K., “Laser Diode Wavelength-Modulation Spectroscopy for Simultaneous Measurement of Temperature, Pressure, and Velocity in Shock-Heated Oxygen Flows,” Applied Optics, Vol. 32, 1993, pp. 6090-6103.
36Fernholtz, T.; Teichert, H.; and Ebert, V., “Digital, Phase-Sensitive Detection for in situ Diode-Laser Spectroscopy Under Rapidly Changing Transmission Conditions,” Applied Physics B., Vol. 75, 2002, pp. 229-236.
37Liu, J.T.C.; Jeffries, J.B.; Hanson, R.K. “Wavelength Modulation Absorption Spectroscopy with 2f Detection for Combustion Temperature Measurements Using Multiplexed Near-Infrared Diode Lasers,” 42nd Aerospace Sciences Meeting and Exhibit, AIAA 2004-647, 2004.
38Zhou, X.; Liu, X.; Jeffries, J.B.; Hanson, R.K., "Fast Temperature Sensor for Combustion Control using H2O Diode Laser Absorption near 1.4 µm,” 43rd Aerospace Sciences Meeting, AIAA-2005-627, 2005.
39Liu, J.T.C.; Jeffries, J.B.; Hanson, R.K., “Wavelength Modulation Absorption Spectroscopy with 2f Detection using Multiplexed Diode Lasers for Rapid Temperature Measurements in Gaseous Flows, Applied Physics B, Vol. 78, 2004, pp. 503-511.
40Kirby, B.J.; Hanson, R.K., “CO2 imaging with saturated planar laser-induced vibrational fluorescence,” Applied Optics, Vol. 40, 2001, pp. 6136-6144.
41Kirby, B.J.; Hanson, R.K., “Imaging of CO and CO2 using infrared planar laser-induced fluorescence,” Proc.Comb. Inst., Vol. 28, 2000, pp. 253-259.