Embed Size (px)
Citation preview

JOURNAL OF MASS SPECTROMETRYJ. Mass Spectrom. 35, 289–304 (2000)
SPECIAL FEATURE:TUTORIAL
Laser mass spectrometry for environmental andindustrial chemical trace analysis
Ulrich Boesl*Institut fur Physikalische und Theoretische Chemie, Technische Universitat Munchen, Lichtenbergstrasse 4, 85748Garching, Germany
Resonant laser mass spectrometry is a promising method for chemical trace analysis since it combines selectivity,sensitivity and rapidity of measurement. It is a two-dimensional technique incorporating medium- or high-resolution UV spectroscopy and time-of-flight mass spectrometry. No sample preparation and chemical clean-upis necessary to reach detection limits in the sub-ppb range even when highly complicated mixtures of chemicalspecies are analyzed. After an introduction to the principles of resonant laser mass spectrometry, illustrativeexamples of applications are presented. Drawbacks, possibilities of overcoming them, some interesting featuresand future developments of resonant laser mass spectrometry are discussed. Copyright 2000 John Wiley &Sons, Ltd.
KEYWORDS: laser mass spectrometry; environmental analysis; industrial analysis; trace analysis
INTRODUCTION
Emissions of many different pollutants caused by mankinddisturb or even destroy the atmosphere of our planet.Problems such as the ozone hole, greenhouse effect, acidicrain and high ozone concentrations in the troposphere arethe consequences. Many trace pollutants are emitted bycombustion processes taking place in motorized vehiclesor industrial incinerators. They contribute to the smog incities and the sunlight-driven chemical formation of ozoneor are harmful to humans in themselves. These compoundsdiffer strongly in toxicity (e.g. the isomeric compoundsharmless perylene and carcinogenic benzo[a]pyrene) andin concentrations.
In view of increasing environmental problems, efficientcountermeasures have to be developed and have beenstarted already to reduce the emission of air pollutants(quite apart from problems in water and soil). Thus, thegas cleaning in modern waste incinerators is performed inunits which are considerably larger than the combustionkilns themselves and are responsible for the major partof the permanent costs of the incinerator. On the otherhand, besides catalytic converters, low-emission vehiclesare going to be developed to cope with the air pollu-tion problem. However, for further technological devel-opments in this field, be it for better control of industrialcombustion processes (and thus a reduction in gas clean-ing efforts), for more efficient catalytic converters (e.g.
* Correspondence to: U. Boesl, Institut fur Physikalische und Theo-retische Chemie, Technische Universitat Munchen, Lichtenbergstrasse4, 85748 Garching, Germany.E-mail: [email protected]
for diesel engines) or a more efficient electronic controlsystem for combustion engines, the appropriate analyticaltool is necessary in any case.
One of the most promising methods for trace air pollu-tant analysis is resonant laser mass spectrometry. It com-bines selectivity, sensitivity and rapidity of measurement.In the following sections, its principles and examples ofapplications are described. These examples comprise theevaluation of maximum sensitivity of the method, thestudy of molecular traces of motor oil in the exhaust ofmotor cars, the measurement of polycyclic aromatic com-pounds in aerosols and the study of the possibilities ofmeasuring chlorinated dioxins on-line via chemical pre-cursors by on-site experiments in the flue gas of industrialincinerators.
For a general introduction to the application of lasers inmass spectrometry, see Refs 1–4. More information con-cerning the multiphoton ionization process can be foundin Refs 5–8 and in early publications.9–14 Reviews onresonant laser mass spectrometry are available.1,2,6,15–21
PRINCIPLES OF RESONANT LASER MASSSPECTROMETRY
Resonant laser mass spectrometry (MS) is the combina-tion of two analytical tools, gas-phase UV spectroscopyand mass spectrometry (in particular time-of-flight massspectrometry). Resonance-enhanced multiphoton ioniza-tion (REMPI) represents the linking element and gives riseto the two-dimensionality of resonant laser MS with theparameters mass and UV wavelength. Therefore, this dis-cussion is separated into sections on spectroscopic aspects,
Copyright 2000 John Wiley & Sons, Ltd. Received 3 November 1999Accepted 22 December 1999

290 U. BOESL
multiphoton ionization principles, and time-of-flight massspectrometric considerations.
Aspects of gas-phase UV spectroscopy
The wavelength range of UV spectroscopy is determinedby the energy of the electronic states involved in theabsorption process. In general, these electronic states aresimilar for molecular species of one ‘molecular class’such as alkanes, alkenes, alkynes, alcohols, aromaticcompounds, aldehydes and so on. Some typical absorp-tion ranges and UV spectra are shown in Fig. 1. Thus,the first (i.e. long-wavelength) absorption bands of aro-matic compounds lie in the range from 260 nm (alkylatedbenzenes) to 350 nm (polycyclic aromatic compounds(PAMs)) while those of aldehydes are to be found in therange from 300 nm to even longer wavelengths. Thesewavelength ranges are particularly well attainable withtunable lasers. In contrast to larger molecules, many small(in particular two-, three- and four-atomic) moleculesshow a large enough separation of vibronic bands to beselectively excited even by medium-resolution UV radia-tion (medium resolution: 1–10 cm�1). For a general intro-duction to analytical UV spectroscopy, see Ref. 22.
Using lasers, the question rises of how to access the dif-ferent energy ranges by laser wavelengths. While tunablelaser wavelengths are available down to about 370 nm,frequency doubling by non-linear optics is necessary toaccess the wavelength range down to about 200 nm.Beyond this limit multiphoton absorption (mostly two- orthree-photon absorption) spectroscopy has to be involved.For an overview, these details (laser light source, wave-length range and classes of absorbing molecules etc.)
are presented in Fig. 1 together with typical medium-resolution laser UV spectra of some alkylated benzenesand aldehydes.
For some special problems of trace analysis, medium-resolution spectroscopy is not sufficient, even for two-dimensional resonant laser mass spectrometry. One impor-tant example is the analysis of structural isomers (e.g. theharmful benzo[a]pyrene and the harmless perylene, bothwith mass 252 u). In principle, the vibrational fine struc-ture of gas-phase UV spectra would allow this distinctionin many cases, since it has a similar fingerprint qualityto IR spectroscopy. Unfortunately, at room temperaturemany rotational and some low-frequency vibrational lev-els are excited in the electronic ground state. This givesrise to congestion of overlapping absorption bands withsimilar energy and thus a loss of spectroscopic fine struc-ture. As a result, the high selectivity possible for largemolecules will be frustrated. To cope with this prob-lem, molecular cooling in supersonic gas beams may beapplied. With this technique, ‘rotational temperatures’ of afew kelvin can be achieved while isolated molecules (con-densation can be avoided) are still present. This coolingeffect is illustrated in Fig. 2 for the case of monochlori-nated anthracene. A single vibronic band has been excitedwhich exhibits large ‘rotational broadening’ at room tem-perature and a substantial narrowing for the same band in asupersonic beam. This spectral narrowing now allows iso-meric separation, in favorable cases even the separationof isotopomers where isotopes (e.g.13C) are substituted atchemically different positions of the molecule. For moreinformation about molecular spectroscopy in supersonicbeams, see Refs 23–25.
To summarize the UV spectroscopic aspects, for mostcases where resonant laser MS may be applied in real
Figure 1. UV spectroscopy in the gas phase: medium resolution. Wavelength ranges of absorption are indicated for several types ofmolecules and for some small molecules. In the row ‘light source,’ the way to reach these wavelength ranges by laser light is indicated.In addition, medium-resolution gas-phase UV spectra are shown for the aromatic compounds toluene (a), p-xylene (b), ethylbenzene(c) and 1,3,5-trimethylbenzene (d), and for the aldehydes formaldehyde (e), acetaldehyde (f), acrolein (g) and propionaldehyde (h).These spectra were measured in an effusive molecular beam at room temperature by multiphoton ionization spectroscopy (instead ofUV absorption the ion current is recorded as a function of laser wavelength at a fixed mass; in other words, these spectra representmass-selected UV spectra).
Copyright 2000 John Wiley & Sons, Ltd. J. Mass Spectrom. 35, 289–304 (2000)

LASER MS FOR ENVIRONMENTAL AND INDUSTRIAL TRACE ANALYSIS 291
Figure 2. UV spectroscopy in the gas phase: high resolution. At room temperature many rovibrational levels (vibrational levels withtheir rotational sublevels) are excited in the ground state. This results in the congestion of the UV spectrum due to vibrational hotbands. In addition, many rotational sublevels of vibrations in the ground state cause a broadening of single vibrational bands sincethe number of allowed rotational transitions increases considerably. In the schematics on the left, transitions are indicated by arrowswhich cause vibrational hot bands at a similar wavelength as the cold band; this would give rise to overlapping bands in a hypotheticalUV spectrum. The two spectra of chloroanthracene illustrate the effect of rotational broadening: the vibronic band at 367.4 nm isrotationally broadened in the effusive beam. Cooling of internal molecular degrees of freedom (rotation, vibration) in a supersonicbeam results in a very narrow line allowing high-resolution gas-phase UV spectroscopy to be performed by varying �exc.
practical problems,medium resolution(i.e. � D a fewcm�1, roomtemperaturemolecularbeam)is sufficient.Forspecial problems, high-resolution (i.e. � < 0.1 cm�1,supersonicbeamcooling) UV spectroscopysuppliesthenecessaryselectivity. In other words, in most caseslesssophisticatedlaser gas inlet and vacuum systemsaresufficient for trace pollutant analysiswith the favorableresult of a morepractical,user-friendlyandevenmobileanalyticalinstrument.
Resonance-enhancedmultiphoton ionization
Thespectroscopicfeaturesdiscussedabovecanbeutilizedin a ionizationprocessvia resonance-enhancedmultipho-ton ionization. In the caseof the most favorable(1C 1)ionization,thefirst photonis absorbedinto anexcitedelec-tronic state.This stateactsasanintermediatestatefor themultiphotonionizationprocess;its excitationis subjecttomoreor lesssharpresonanceconditionsdependingon thestructureof its gasphaseUV spectrum(narrow lines forcold molecules,broadonesfor hot moleculesasdiscussedabove).Only when the resonanceconditionsfor the first(spectroscopic)absorptionstepare fulfilled andselectiveexcitation takesplacecan a secondphoton be absorbedup to the ionization continuumwith adequateefficiency.Resonance-enhancedandthereforespecies-selectivemul-tiphoton ionization,appliedto a mixture of gaseslocatedin the electric field betweentwo electrodes,thereforeresultsin a species-selectiveion source.
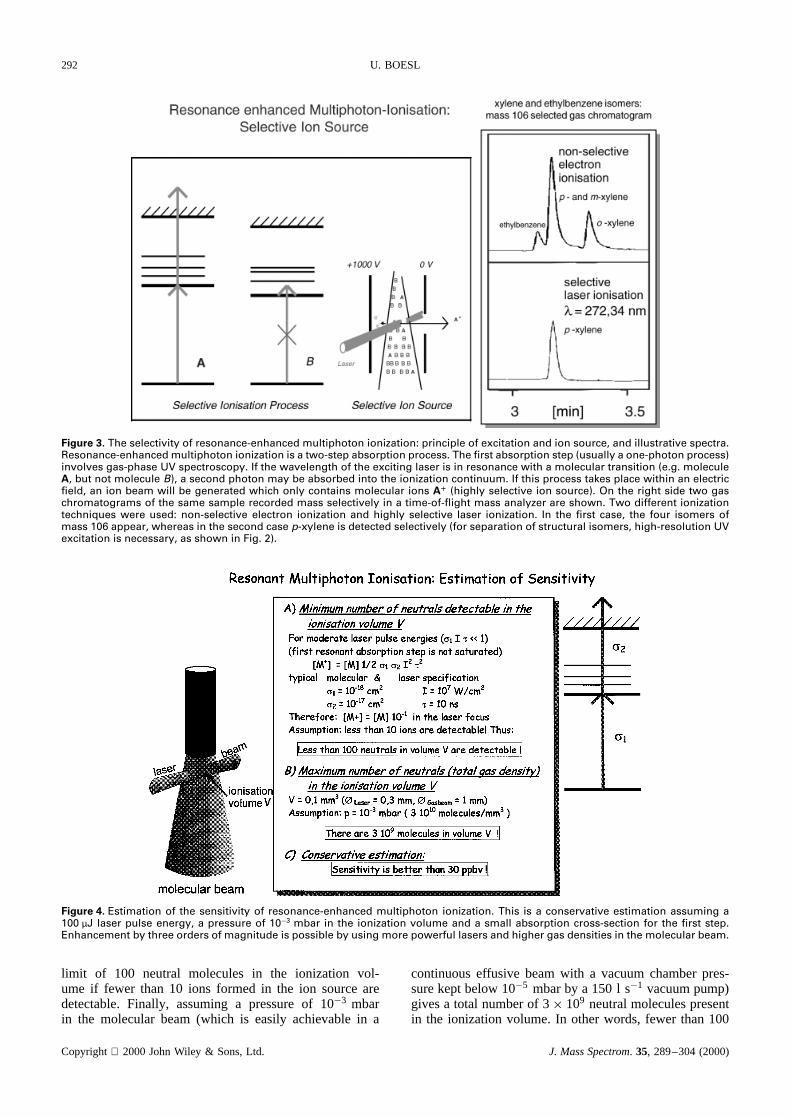
This wholeschemeof ionizationis illustratedin Fig. 3,where, in addition, on the right-hand side an example
demonstratesthe possibilities and quality of this selec-tive ion source.Two gas chromatographicspectraareshown,which arepart of a measurementmadein the gasphaseabovea gasolinesample.They representthe fourisomericspeciesethylbenzeneandp-, m- and o-xylene,all of themwith the molecularmass106 u. Conventionalmassspectrometrywould not be able to separatetheseisomericcomponents.In the fast, medium-resolutiongaschromatographused here, p- and m-xylene also couldnot be separated.The uppergaschromatogramshowsallfour compoundsdetectedby non-selectiveelectronion-ization in a massspectrometersetto monitormass106 u.The lower gas chromatogramshows a single GC peakdue to p-xyleneobtainedby (1C 1) multiphotonioniza-tion at 272.34nm. This wavelengthis resonantwith avibronicbandof p-xyleneonly. UV spectroscopyemploy-ing molecularcooling in a supersonicbeamnecessaryforthis high selectivity was achievedby a specialcouplingof GC columnandsupersonicbeamvalve.26
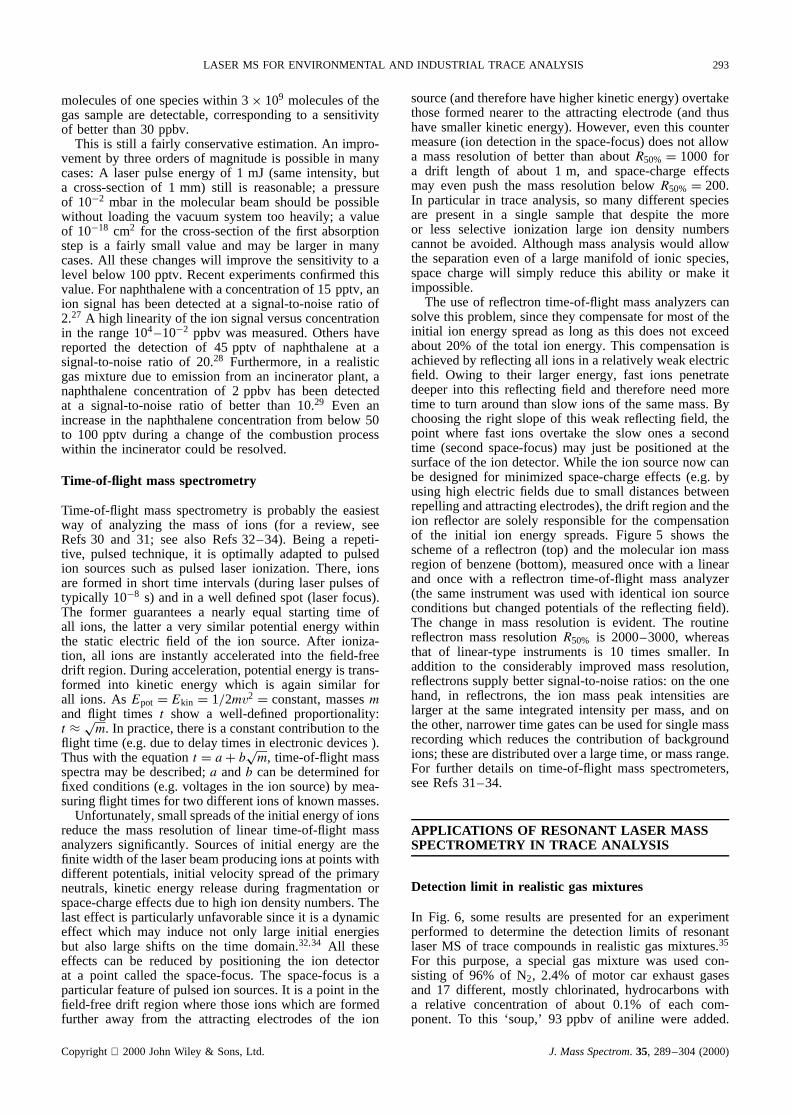
In Fig. 4, an estimationof the sensitivity for (1C 1)ionization is given. Non-saturationof the first absorptionstep is assumed(�1I� − 1, where �1 is the absorptioncross-section,I the laser intensity and � the laserpulselength), and also typical crosssections�1 for S0 S1absorptionof aromaticcompoundsand�2 for absorptionto the ionization continuum. Finally focusing a 100 µJlaserpulse(10 ns pulselength) on to a spot of 0.1 mm2
gives a very reasonablelaser power of 107 W cm�2.Under these conditions, 10% of all neutral moleculeswithin the ionization volume (i.e. cross-sectionof laserandmolecularbeam,in Fig. 4 the ionizationvolumeV is0.1 mm3) are ionized. This is equivalentto a detection
Copyright 2000JohnWiley & Sons,Ltd. J. MassSpectrom. 35, 289–304 (2000)
292 U. BOESL
Figure 3. The selectivity of resonance-enhanced multiphoton ionization: principle of excitation and ion source, and illustrative spectra.Resonance-enhanced multiphoton ionization is a two-step absorption process. The first absorption step (usually a one-photon process)involves gas-phase UV spectroscopy. If the wavelength of the exciting laser is in resonance with a molecular transition (e.g. moleculeA, but not molecule B), a second photon may be absorbed into the ionization continuum. If this process takes place within an electricfield, an ion beam will be generated which only contains molecular ions AY (highly selective ion source). On the right side two gaschromatograms of the same sample recorded mass selectively in a time-of-flight mass analyzer are shown. Two different ionizationtechniques were used: non-selective electron ionization and highly selective laser ionization. In the first case, the four isomers ofmass 106 appear, whereas in the second case p-xylene is detected selectively (for separation of structural isomers, high-resolution UVexcitation is necessary, as shown in Fig. 2).
Figure 4. Estimation of the sensitivity of resonance-enhanced multiphoton ionization. This is a conservative estimation assuming a100 µJ laser pulse energy, a pressure of 10�3 mbar in the ionization volume and a small absorption cross-section for the first step.Enhancement by three orders of magnitude is possible by using more powerful lasers and higher gas densities in the molecular beam.
limit of 100 neutral molecules in the ionization vol-ume if fewer than 10 ions formed in the ion sourcearedetectable.Finally, assuminga pressureof 10�3 mbarin the molecularbeam(which is easily achievablein a
continuouseffusive beamwith a vacuumchamberpres-surekeptbelow10�5 mbarby a 150 l s�1 vacuumpump)givesa total numberof 3ð 109 neutralmoleculespresentin the ionizationvolume.In otherwords,fewer than100
Copyright 2000JohnWiley & Sons,Ltd. J. MassSpectrom. 35, 289–304 (2000)
LASER MS FOR ENVIRONMENTAL AND INDUSTRIAL TRACE ANALYSIS 293
molecules of one species within 3ð 109 molecules of thegas sample are detectable, corresponding to a sensitivityof better than 30 ppbv.
This is still a fairly conservative estimation. An impro-vement by three orders of magnitude is possible in manycases: A laser pulse energy of 1 mJ (same intensity, buta cross-section of 1 mm) still is reasonable; a pressureof 10�2 mbar in the molecular beam should be possiblewithout loading the vacuum system too heavily; a valueof 10�18 cm2 for the cross-section of the first absorptionstep is a fairly small value and may be larger in manycases. All these changes will improve the sensitivity to alevel below 100 pptv. Recent experiments confirmed thisvalue. For naphthalene with a concentration of 15 pptv, anion signal has been detected at a signal-to-noise ratio of2.27 A high linearity of the ion signal versus concentrationin the range 104–10�2 ppbv was measured. Others havereported the detection of 45 pptv of naphthalene at asignal-to-noise ratio of 20.28 Furthermore, in a realisticgas mixture due to emission from an incinerator plant, anaphthalene concentration of 2 ppbv has been detectedat a signal-to-noise ratio of better than 10.29 Even anincrease in the naphthalene concentration from below 50to 100 pptv during a change of the combustion processwithin the incinerator could be resolved.
Time-of-flight mass spectrometry
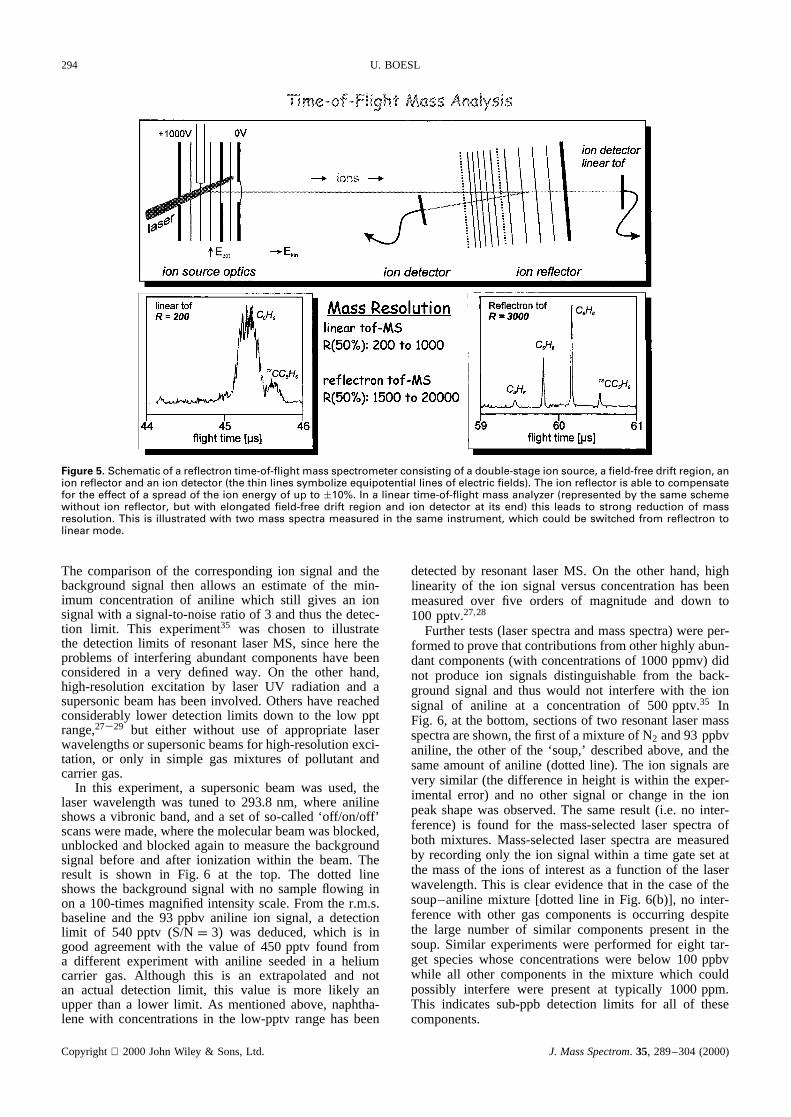
Time-of-flight mass spectrometry is probably the easiestway of analyzing the mass of ions (for a review, seeRefs 30 and 31; see also Refs 32–34). Being a repeti-tive, pulsed technique, it is optimally adapted to pulsedion sources such as pulsed laser ionization. There, ionsare formed in short time intervals (during laser pulses oftypically 10�8 s) and in a well defined spot (laser focus).The former guarantees a nearly equal starting time ofall ions, the latter a very similar potential energy withinthe static electric field of the ion source. After ioniza-tion, all ions are instantly accelerated into the field-freedrift region. During acceleration, potential energy is trans-formed into kinetic energy which is again similar forall ions. AsEpot D Ekin D 1/2mv2 D constant, massesmand flight timest show a well-defined proportionality:t ³ pm. In practice, there is a constant contribution to theflight time (e.g. due to delay times in electronic devices ).Thus with the equationt D aC bpm, time-of-flight massspectra may be described;a andb can be determined forfixed conditions (e.g. voltages in the ion source) by mea-suring flight times for two different ions of known masses.
Unfortunately, small spreads of the initial energy of ionsreduce the mass resolution of linear time-of-flight massanalyzers significantly. Sources of initial energy are thefinite width of the laser beam producing ions at points withdifferent potentials, initial velocity spread of the primaryneutrals, kinetic energy release during fragmentation orspace-charge effects due to high ion density numbers. Thelast effect is particularly unfavorable since it is a dynamiceffect which may induce not only large initial energiesbut also large shifts on the time domain.32,34 All theseeffects can be reduced by positioning the ion detectorat a point called the space-focus. The space-focus is aparticular feature of pulsed ion sources. It is a point in thefield-free drift region where those ions which are formedfurther away from the attracting electrodes of the ion
source (and therefore have higher kinetic energy) overtakethose formed nearer to the attracting electrode (and thushave smaller kinetic energy). However, even this countermeasure (ion detection in the space-focus) does not allowa mass resolution of better than aboutR50%D 1000 fora drift length of about 1 m, and space-charge effectsmay even push the mass resolution belowR50%D 200.In particular in trace analysis, so many different speciesare present in a single sample that despite the moreor less selective ionization large ion density numberscannot be avoided. Although mass analysis would allowthe separation even of a large manifold of ionic species,space charge will simply reduce this ability or make itimpossible.
The use of reflectron time-of-flight mass analyzers cansolve this problem, since they compensate for most of theinitial ion energy spread as long as this does not exceedabout 20% of the total ion energy. This compensation isachieved by reflecting all ions in a relatively weak electricfield. Owing to their larger energy, fast ions penetratedeeper into this reflecting field and therefore need moretime to turn around than slow ions of the same mass. Bychoosing the right slope of this weak reflecting field, thepoint where fast ions overtake the slow ones a secondtime (second space-focus) may just be positioned at thesurface of the ion detector. While the ion source now canbe designed for minimized space-charge effects (e.g. byusing high electric fields due to small distances betweenrepelling and attracting electrodes), the drift region and theion reflector are solely responsible for the compensationof the initial ion energy spreads. Figure 5 shows thescheme of a reflectron (top) and the molecular ion massregion of benzene (bottom), measured once with a linearand once with a reflectron time-of-flight mass analyzer(the same instrument was used with identical ion sourceconditions but changed potentials of the reflecting field).The change in mass resolution is evident. The routinereflectron mass resolutionR50% is 2000–3000, whereasthat of linear-type instruments is 10 times smaller. Inaddition to the considerably improved mass resolution,reflectrons supply better signal-to-noise ratios: on the onehand, in reflectrons, the ion mass peak intensities arelarger at the same integrated intensity per mass, and onthe other, narrower time gates can be used for single massrecording which reduces the contribution of backgroundions; these are distributed over a large time, or mass range.For further details on time-of-flight mass spectrometers,see Refs 31–34.
APPLICATIONS OF RESONANT LASER MASSSPECTROMETRY IN TRACE ANALYSIS
Detection limit in realistic gas mixtures
In Fig. 6, some results are presented for an experimentperformed to determine the detection limits of resonantlaser MS of trace compounds in realistic gas mixtures.35
For this purpose, a special gas mixture was used con-sisting of 96% of N2, 2.4% of motor car exhaust gasesand 17 different, mostly chlorinated, hydrocarbons witha relative concentration of about 0.1% of each com-ponent. To this ‘soup,’ 93 ppbv of aniline were added.
Copyright 2000 John Wiley & Sons, Ltd. J. Mass Spectrom. 35, 289–304 (2000)
294 U. BOESL
Figure 5. Schematic of a reflectron time-of-flight mass spectrometer consisting of a double-stage ion source, a field-free drift region, anion reflector and an ion detector (the thin lines symbolize equipotential lines of electric fields). The ion reflector is able to compensatefor the effect of a spread of the ion energy of up to š10%. In a linear time-of-flight mass analyzer (represented by the same schemewithout ion reflector, but with elongated field-free drift region and ion detector at its end) this leads to strong reduction of massresolution. This is illustrated with two mass spectra measured in the same instrument, which could be switched from reflectron tolinear mode.
The comparisonof the correspondingion signal and thebackgroundsignal then allows an estimateof the min-imum concentrationof aniline which still gives an ionsignalwith a signal-to-noiseratio of 3 andthusthedetec-tion limit. This experiment35 was chosen to illustratethe detectionlimits of resonantlaserMS, sinceheretheproblemsof interfering abundantcomponentshavebeenconsideredin a very defined way. On the other hand,high-resolutionexcitation by laser UV radiation and asupersonicbeamhasbeeninvolved. Othershavereachedconsiderablylower detectionlimits down to the low pptrange,27–29 but either without use of appropriatelaserwavelengthsor supersonicbeamsfor high-resolutionexci-tation, or only in simple gas mixtures of pollutant andcarriergas.
In this experiment,a supersonicbeamwas used,thelaser wavelengthwas tuned to 293.8nm, where anilineshowsa vibronic band,anda setof so-called‘off/on/off’scansweremade,wherethemolecularbeamwasblocked,unblockedandblockedagainto measurethe backgroundsignal before and after ionization within the beam.Theresult is shown in Fig. 6 at the top. The dotted lineshowsthe backgroundsignal with no sampleflowing inon a 100-timesmagnifiedintensityscale.From the r.m.s.baselineand the 93 ppbv aniline ion signal, a detectionlimit of 540 pptv (S/ND 3) was deduced,which is ingood agreementwith the value of 450 pptv found froma different experimentwith aniline seededin a heliumcarrier gas. Although this is an extrapolatedand notan actual detection limit, this value is more likely anupperthan a lower limit. As mentionedabove,naphtha-lene with concentrationsin the low-pptv rangehasbeen
detectedby resonantlaserMS. On the other hand,highlinearity of the ion signal versusconcentrationhasbeenmeasuredover five orders of magnitudeand down to100 pptv.27,28
Furthertests(laserspectraandmassspectra)wereper-formedto provethatcontributionsfrom otherhighly abun-dantcomponents(with concentrationsof 1000ppmv) didnot produceion signals distinguishablefrom the back-groundsignal and thus would not interferewith the ionsignal of aniline at a concentrationof 500 pptv.35 InFig. 6, at the bottom,sectionsof two resonantlasermassspectraareshown,thefirst of amixtureof N2 and93 ppbvaniline, the otherof the ‘soup,’ describedabove,and thesameamountof aniline (dottedline). The ion signalsarevery similar (the differencein height is within the exper-imental error) and no other signal or changein the ionpeakshapewasobserved.The sameresult (i.e. no inter-ference)is found for the mass-selectedlaser spectraofboth mixtures.Mass-selectedlaserspectraare measuredby recordingonly the ion signalwithin a time gatesetatthe massof the ions of interestasa function of the laserwavelength.This is clearevidencethat in the caseof thesoup–aniline mixture [dotted line in Fig. 6(b)], no inter-ferencewith other gas componentsis occurring despitethe large number of similar componentspresentin thesoup.Similar experimentswere performedfor eight tar-get specieswhoseconcentrationswere below 100 ppbvwhile all other componentsin the mixture which couldpossibly interfere were presentat typically 1000ppm.This indicatessub-ppbdetectionlimits for all of thesecomponents.
Copyright 2000JohnWiley & Sons,Ltd. J. MassSpectrom. 35, 289–304 (2000)

LASER MS FOR ENVIRONMENTAL AND INDUSTRIAL TRACE ANALYSIS 295
Figure 6. Determination of the sensitivity of resonance-en-hanced multiphoton ionization: off on off switching of amolecular beam due to a complicated gas mixture (soup) with93 ppb of aniline after aniline-selective laser ionization (a) andmass spectrum with aniline-selective laser ionization of nitrogenseeded with 93 ppbv of aniline and of the complex mixture with93 ppbv of aniline (b). Comparison of background (off-signal)and aniline (on-signal) gives a detection limit (signal-to-noiseratio of 3) of 540 pptv of aniline in the complex mixture.Reprinted from T. N. Tanada, J. Velazquez, N. Hemmi, T. Cool,Ber. Bunsen-Ges. Phys. Chem. 97, 1516 1527 (1993) withpermission of Wiley-VCH, Weinheim.
Detection of traces of motor oil in the exhaustofmotor cars
The detectionof motor oil in the exhaustof combus-tion enginesis of interestfor severalreasons.On the onehand,suchexperimentsmayprovideinformationaboutoilconsumptionmechanisms,or evenallow the fastdetermi-nation of oil components;on the other handlarge PAHs(which mostly aredueto motor oil) maydegradethesur-faceof electrochemicalsensorswhich allow oneto moni-tor theoxygencontentof exhaustgasin motorcars.Thesesensorsare neededto control the oxygen concentrationfor optimum catalytic converterefficiency. To discrimi-nate PAHs from gasolineand from motor oil, laserMShas been applied to the exhaustof a hydrogenmotor(sameengineas for gasolinewith only minor changes)at a BMW test facility.36,37 The total PAH contentin theexhaustdue to motor oil was found to be in the 1 ppmvrange.The resonantlasermassspectrumof thesePAH isshownin Fig. 7(a). In this massspectrummore than 15peakswith a signal-to-noiseratio of better than 10 con-tribute to the total of 1 ppmv.This indicatesa sensitivity
of better than 10 ppbv of single molecularcomponentsdespitethehigh speedof measurement.Massspectrasuchasthosein Fig. 7(a)areachievableat singlelasershots,inprinciple. For a reasonablelaserrepetitionrateof 20 Hz,this would mean that dynamic motor processescan bemonitoredby massspectrometrywith a time resolutionof50 ms.For reasonsof betterabsoluteaccuracy,averagingover 50–100 lasershotsis usual,however.
Comparisonof gasolineand hydrogenmotor experi-mentsallowed the assignmentof the high-masspeakstomotor oil components.In Fig. 7(a), at the top, a smallpartof thehigh-massrangeof a massspectrummeasured
Figure 7. Traces of motor oil in exhaust gas. (a) Mass spectrumof PAHs in the exhaust of a hydrogen fueled motor (motor oilis the only source of PAHs) and two mass spectra (reducedsensitivity of ion detector) of a gasoline-fueled motor: onemeasured without tracer and one with 1% of tracer (pyreneat mass 202) in the motor oil. (b) The tracer signal as a functionof speed and load during a test drive of a car. Fast dynamicchanges of the tracer (pyrene) signal indicate a highly dynamicvariation of motor oil consumption. (c) Quantitative motor oilconsumption as a function of speed and load. The decreaseabove 5500 l min�1 is due to destruction of the tracer (highcombustion temperature). The modulations are due to changingthickness of the motor oil film at the inner walls of the cylinder.See also Refs 36 and 37.
Copyright 2000JohnWiley & Sons,Ltd. J. MassSpectrom. 35, 289–304 (2000)

296 U. BOESL
Figure 7. (continued).
in the exhaustof a gasolineengineis shown (the massresolutionis reducedowing to theuseof a linear time-of-flight massanalyzer;seespace-charge effects discussedabove).Whereasthe lower traceshowsa massspectrumwithout additionof a moleculartracerto themotoroil, theuppertraceis dueto the additionof 1% of pyrene,whichresultedin a significantpeakat mass202.This peakwasstablefor many hours, indicating that the concentrationof pyrenein the motor oil wasnot rapidly reducedowingto strongevaporation.Pyrenewasoneof severalpossiblespeciesconsideredastracermolecules.Oneadvantageofpyreneis its low cost. In addition, it canbe ionizedeffi-ciently with a wavelengthof 266 nm, thefourth harmonicof an Nd: YAG laser.
Comparisonof thepyrenemasspeakwith conventionalhydrocarbonanalysisundervarious,stationarymotorcon-ditions resulted in the following conclusions:(i) mostmotor oil loss is due to evaporationwithin the combus-tion chamber(i.e. the cylinder of the engine);(ii) nearly90% of the evaporatedoil componentsstay unburnedand are found as such in the exhaust (this amountdecreasesin extreme situations such as at high speedabove5500rpm); (iii) consequently,the concentrationofa tracer(e.g.pyrene)is a reliablemeasureof the overalloil consumption.Two differentapplicationsof pyreneasatracerin motor oil arealsoshownin Fig. 7. Onedisplaysfast dynamic effects of oil consumption[Fig. 7(b)] andthe other representsmeasurementsat different stationarymotor conditions and allows a speed–load mapping ofoil consumption[Fig. 7(c)]. Figure7(b) showsfour sig-nalsasa functionof time: (i) thespeedbetween1000and3000rpm, (ii) the load between20 and200 Nm, (iii) thetracer signal and (iv) the relative oxygen concentration.It can be clearly seenthat high motor oil consumptionoccurswhenboth speedand load havedecreasedrapidlyfrom a high level to a minimumvalue,which is correlatedwith a strongdecreasein the combustionprocess.Theseshortmomentsof reductionof thrust force arecharacter-ized by sharpoxygenpeaks.The sharpincreasein motoroil consumptionat thesetimescanbeexplainedby a sud-denpressurereductionin the cylinder inducingenhancedevaporationof oil componentsfrom the walls within thecylinder.Theoil consumptionmeasurementshavenot yet
beenquantified,sinceat the momentno adequatemeth-ods exist to measurethe total massflow of the exhaustwith 50 Hz time resolution.Nevertheless,even qualita-tive resultsabout highly dynamic oil consumptionmaybe very valuablefor engineersdevelopingmoderncom-bustionengines.
Theresultsin Fig. 7(c) differ from thosein Fig. 7(b) inseveralrespects.Now the motor operatesunder station-ary conditions,eachof which is characterizedby a pairof valuesof speedand load andwhich arekept constantfor severalminutes.The motor oil consumptionis mea-suredfor eachof thesestationaryconditionsand couldnow be quantified(given in g h�1). For different speedsand constantload, a curve of oil consumptioncould bemeasured.Varying the load resultedin groupsof oil con-sumptioncurves.Insteadof a smooth,steadyincreaseinoil consumptionwith speed(which one might expect),thesecurvesshowa moreor lessperiodicmodulationofoil consumption.Oneexplanationis that the piston ringsnot only move with the piston but also are subject tosecondaryforcesresulting in rotation and twisting. Thisinfluencesthefunctionof thepistonring asascraperof theoil andfinally leadsto a varying thicknessof the oil filmat the inner walls of the cylinder. Thick films then giverise to an increasedamountof evaporatedoil andthusanincreasedmotoroil consumption.Oneshouldnotethatthemeasurementof the whole oil consumption–speed–loadmap took 1 day with resonantlaser massspectrometry,but takes1 monthor evenlongerwith conventionaltech-niques(e.g.weighing of oil beforeandafter running themotor understationarymotor conditions).
Trace analysisof PAHs in aerosols
PAHs in the troposphereare mostly incompletelyburntor evenunburnedcomponentsof all kinds of combustionprocesses,such as motorizedtraffic, waste incinerators,industrialproductionprocesses,powerplantsandprivateheating.Most of thesePAHs arenotpresentasfreemolec-ular speciesin the gasphasebut areadsorbedon particlesurfaces.For environmentalanalysisof the atmosphere,therefore,not only the gas phase,but also the aerosolshaveto be investigated.Thesestudiesshouldbe speciesselective,since PAHs differ strongly in toxicity, somebeing well known as carcinogenicswhereasothers aremore or lessharmless.An adequateanalytical techniquethereforeshouldbe outstandingnot only in termsof itssensitivity but also in particular in terms of its selec-tivity. Most conventionaltechniquesthereforeinclude achemicalclean-upto reachthis sensitivity.This clean-upprocedureis very time consumingandexpensive,besidesimposingotherrestrictions.ResonantlaserMS combinedwith laser desorption enablesone to study molecularspeciesabsorbedon surfaceswith no chemical clean-up being necessaryowing to its high (two-dimensional)selectivity.Singlesamplesmaynow beanalyzedwithin afew minutes.In themeasurementpresentedin Fig. 8, thismethodwasappliedto comparethePAH loadsof aerosolsat differentsites.38
For laserdesorption,a pulsedCO2 laserandfor ioniza-tion a XeCl excimerlaserwereused.The latteremitsat awavelengthof 308 nm,wherePAHs absorb.For samplingaerosolsin the atmosphereabout19 l min�1 of air werepassedthroughfilter materialconsistingof quartzfiber for
Copyright 2000JohnWiley & Sons,Ltd. J. MassSpectrom. 35, 289–304 (2000)

LASER MS FOR ENVIRONMENTAL AND INDUSTRIAL TRACE ANALYSIS 297
Figure 8. Laser desorption laser/post-ionization mass spectra of aerosol samples from different locations: (a) rural site, 100 m from afarmhouse in a harvested field; (b) industrial zone, close to a material recycling plant with only electric power; (c) downtown road, 2 maway from a main road; (d) blank filter. Reprinted from Q. Zhan, P. Voumard, R. Zenobi, Rapid Commun. Mass Spectrom. 9, 119 127(1995) with permission of John Wiley & Sons, Chichester.
1 h andat a heightof 45 cm abovethe ground.The cov-eredfilter wascut, mountedon the tip of a sampleholderandintroducedinto the massspectrometerthrougha vac-uum interlock. This proceduretakesonly a few minutes.No additionalextraction,purificationor preconcentrationwasperformed.
Figure8 showsthemassspectraof aerosolsfrom threedifferent locations and also that of a blank filter. It isobviousthat thespectrafor thecountrysideandthe indus-trial zoneshowa differentrangeof themostintensemasspeaks(namely200to 230 u) thanthemassspectrumof thedowntown road (mass200–400 u). Also, the integratedsignal intensity differs substantially;however,it was notpossibleto measurethe PAH load per aerosolparticle.Even the few intensemasspeaksin the rural site andindustrial zonespectra(i.e. 202, pyreneor fluoranthene;116,230,methylatedandethylatedmass202species)maybeexplainedby aerosoltransportoverlongdistancesfrom
regionsof high traffic or intenseresidentialheating.Any-way, traffic seemsto beoneof themainsourcesof PAHsin aerosols.
We shouldmentiononeimportantdifferencefrom othermass spectrometricdesorptiontechniquessuch as sec-ondaryion massspectrometry(SIMS),fastatombombard-ment(FAB), laserdesorption/ionization(LDI) andmatrix-assistedlaserdesorption/ionization(MALDI). In resonantlaser ionization performedafter laserdesorption,ioniza-tion anddesorptionareseparated.Therefore,they canbeoptimizedseparatelyand selectiveionization is possible;matrix or substrateeffectsdo not play an importantrole.SIMS, FAB andLDI aremostly not selectiveenoughandoften evennot ‘soft’ enough(concerningfragmentation)desorption/ionizationtechniquesto avoid interferenceofthe manydifferent tracecompoundsof an environmentalsampledue to the similar massesof molecularor frag-ment ions.Evenion–moleculereactionsin the densegas
Copyright 2000JohnWiley & Sons,Ltd. J. MassSpectrom. 35, 289–304 (2000)

298 U. BOESL
phase of the plume directly above the sample surface afterdesorption may influence the signal intensity of specialtrace compounds and falsify quantitative analysis in thecase of these desorption/ionization techniques. The miss-ing selectivity of these desorption/ionization techniquescan be compensated by tandem MS techniques (as usedin post-source decay MS;39 for an introduction to tandemMS, see also Ref. 40). This works out for analytical pur-poses if few molecular species are present in a sample.If a highly complicated mixture of hundreds of differ-ent species has to be analyzed, time-consuming chemicalclean-up and high-resolution GC/MS are necessary whichis not compatible with pulsed desorption methods. Onthe other hand, the high accuracy of quantifying and thelow detection limit of this highly sophisticated analyticalmethod is not reached by state-of-the-art laser desorp-tion/laser ionization mass spectrometry. The benefit of thelatter is a high speed of recording mass spectra combinedwith high selectivity.
On-line dioxin analysis via chemical precursors
Since the chemical accident in the Italian town Seveso,chlorinated dibenzodioxins (in particular 2,3,7,8-tetra-chlorodibenzodioxin) are known to rank among the mostpoisonous environmental pollutants and a great deal ofenergy has been expended on the development of ade-quate trace analysis methods. The main problems in dioxinanalysis are the extremely low concentrations and thelarge number of structural isomers belonging to eachgroup of dioxins with equal numbers of substituted chlo-rine atoms. For instance, 22 structural isomers of tetra-chlorodibenzodioxins exist. The toxicity of these isomersdiffers by several orders of magnitude. Therefore, only anisomer-selective dioxin analysis is informative enough tostudy the risks of dioxin. Highly sophisticated techniques(mostly combining GC and high-resolution MS) have beendeveloped with excellent sensitivity and selectivity. Theirmain restriction, however, is the very time-consumingchemical clean-up procedure which makes any rapid anal-ysis (even on the time-scale of hours) impossible, not tospeak about on-line analysis. In many situations, a rapiddioxin analysis is very desirable, e.g. in the case of chem-ical accidents or for controlling the exhaust of industrialcombustion processes.
Resonant laser MS may allow new solutions to thisproblem. Thus, the separation of dioxin isomers by highlyselective UV spectroscopy in supersonic beams could betried. For some dichlorinated dibenzodioxins this has beendemonstrated already, so that there may exist a certainprobability of successful selective ionization of dioxin iso-mers. However, the extremely low concentrations to bedetected (the legal limits of dioxin emissions lie in therange of sub-ppq: ppq corresponds to 1 in 1015) makethis solution of the analytical problem very unreasonablefor a practical application. On the other hand, severalresearch groups have found good correlations betweensome chemical precursors and the so-called internationaltoxicity equivalent (I-TEQ) for polychlorinated dibenzo-dioxins and -furans (PCDD/F). This I-TEQ is an averageconcentration to which all dioxins weighted by their tox-icity contribute. In addition to special highly chlorinatedphenol and benzene isomers, it was found recently thatmonochlorobenzene belongs to these special precursors.41
This correlation is shown in Fig. 9 at the top. Note that theprecursor concentration is in the pptv range which is about1000 times larger than that of the chlorinated dioxins.
Owing to this correlation, an experiment has been per-formed to find out if monochlorobenzene is detectableon-line in the flue gas of a waste incinerator by reso-nant laser mass spectrometer.42 The idea behind an on-linetrace analysis of the flue gas emitted from the combustionchamber of an incinerator is that a fast on-line pollutantanalysis could permit much better (since it is faster) con-trol of the combustion process, thus avoiding pollutants ata very early stage. The experiment was performed with alaser mass spectrometer specially equipped for hot emis-sion gases of an incinerator. The sampling line from thecombustion chamber to the ion source was heated to morethen 550 K. A quartz filter protected the mass spectrom-eter from the heavy dust load of the emission gases.
Figure 9. Correlation between monochlorobenzene and theinternational toxicity equivalent of polychlorinated dibenzodi-oxins and -furans (I-TEQ (PCDD/F)), measured by conventionaltrace analysis procedure (i.e. sampling, chemical clean-up,high-resolution GC/MS). Regression line and 95% confidenceinterval are displayed. The correlation coefficient of the measure-ment is r D 0.91. Below: resonant laser mass spectrum of the fluegas of a special waste incinerator plant measured at 269.8 nmlaser wavelength, revealing PAHs and a monochlorobenzenesignal. Inset: part of the mass spectrum measured at 269.8 nm(b) and at 266 nm (a). Reprinted from R. Zimmermann et al.,Rapid Commun. Mass Spectrom. 13, 307 314 (1999) with per-mission of John Wiley & Sons, Chichester.
Copyright 2000JohnWiley & Sons,Ltd. J. MassSpectrom. 35, 289–304 (2000)

LASER MS FOR ENVIRONMENTAL AND INDUSTRIAL TRACE ANALYSIS 299
The whole instrument (containing a tunable laser sys-tem, mass spectrometer, power supplies and data acquisi-tion system) was positioned just beside the combustionchamber of a special waste incinerator on a walkingmetal grid some 20 m above ground. The result ofthe experiment is shown in Fig. 9(b). The mass spec-trum was taken with a laser wavelength of 269.8 nm,where monochlorobenzene has a resonance and is ion-ized particularly efficiently. In fact, a distinct ion signal isobserved at the mass 112 of chlorobenzene in the midstof many considerably stronger ion signals, mostly dueto methylated benzenes. To verify whether the ion signalat mass 112 is due to monochlorobenzene, mass spec-tra were measured with two different laser wavelengths,266 and 269.8 nm. Although the overall mass spectrumdid not change strongly, the peak at mass 112 disap-peared at 266 nm [see the inset in Fig. 9(b)]. In addition,the corresponding37Cl1C6H5 peak at mass 114 u andthe 35Cl13
1 C1C5H5 peak at mass 113 also disappeared at266 nm. Hence the isotope pattern and wavelength depen-dence clearly prove the identity of the mass 112 peak.Using 269.8 nm, the sensitivity for monochlorobenzeneimproves to 25 pptv, whereas with 266 nm it is only2 ppbv. From high-resolution GC/MS measurements, oneknows that the average concentration is about 100 pptvand therefore below the detection limit for 266 nm laserionization.
The mass spectra were taken within a few secondswithout any sample clean-up, preparation, or preconcen-tration, demonstrating that resonant laser MS is appropri-ate for the fast control of pollutants during combustionprocesses on a large industrial scale. Time-resolved mea-surements of monochlorobenzene revealed that even forthese large-scale processes, concentrations of pollutants(e.g. of polycylic and substituted aromatic compounds)may be subject to fast fluctuations on a time-scale ofseconds. The spectrum in Fig. 9(b) is one out of a fastcycle of laser MS experiments, which showed this tem-poral behavior.
DRAWBACKS OF RESONANT LASER MASSSPECTROMETRY AND APPROACHES TOOVERCOMING THEM
As for most analytical techniques, there are also restric-tions on resonant laser MS. They mostly arise fromthe particular photophysical behavior of some molecularspecies. The main problems for the most reasonable res-onant laser ionization process (i.e. one color, nanosecondtwo-photon ionization) are illustrated in Fig. 10. Whileproblems (a), (b) and (c) are due to unfavorable energiesor molecular structure (i.e. case (c)) of the intermediatestate or ion ground state, problem (d) is caused by fastintramolecular dynamic processes.
There are two ways to overcome problems (a) and (c). Ifa reduced selectivity of the ionization (due to a high den-sity of states) is acceptable, a higher electronic or vibronicstate may be chosen as an intermediate state. In case (a),where the intermediate state energy is too small, a higherelectronic state (which fortunately often is subject to alarger absorption cross-section, such as the S2 state ofaromatic compounds) has to be chosen. In case (c), wheresmall Franck–Condon factors result in inefficient ioniza-tion, the excitation of an appropriate vibrational modein the first excited electronic state (involving appropri-ate molecular structure changes) might help. The secondway to cope with problems (a) and (c) is two-color ion-ization using two separate lasers. In most cases the secondlaser does not need to be tunable, but should supply pho-ton energies further in the UV than the first laser. Oftentunable lasers are pumped by fixed frequency lasers (e.g.excimer or YAG lasers) which supply photons of the nec-essary wavelength.
Case (b) is caused by too large an intermediate stateenergy. The real problem is the availability of tun-able laser wavelengths. With frequency doubling in non-linear optics, tunable UV laser light down to about200 nm can be generated. If the first intermediate statelies at higher energies (which is the case for several
Figure 10. Four cases where one-color (1C 1) two-photon ionization with nanosecond pulse lasers (the most reasonable realization ofresonance-enhanced multiphoton ionisation) does not work (a, b) or is subject to strongly reduced efficiency (c, d). Increasing laserintensity may result in multiphoton processes of higher order (allowing ionization in case (a) or (b)) or in higher efficiency ((c),(d)) butmostly induces multiphoton absorption of the molecular ions causing more or less strong fragmentation. FC D Franck Condon.
Copyright 2000JohnWiley & Sons,Ltd. J. MassSpectrom. 35, 289–304 (2000)

300 U. BOESL
small molecules, alkanes, etc.; see Fig. 1), multiphotonabsorption to this intermediate state (corresponding to an(nC m)-multiphoton ionization) has to be involved. Forinstance, CO is efficiently ionized by (2C 1) MPI with alaser wavelength of 230 nm; even methanol can be ionizedby (3C 1) MPI at 457 nm, but with reduced sensitivity.
Cases (a), (b) and (c) become much less problematicif only semi-selective ionization of types of molecules(and not of single molecular species) is wanted. In thiscase, fixed-frequency lasers with sufficiently short wave-lengths can be used. The most typical example is thewavelength of 266 nm (fourth harmonic of an Nd : YAGlaser) at which most polycyclic and methylated aromat-ics are efficiently ionized. Excimer lasers also are welladapted for fixed-frequency, quasi-resonant laser ioniza-tion, e.g. the KrF laser emitting at 248 nm and the ArFlaser at 193 nm.
In contrast to cases (a), (b) and (c) in Fig. 10, case(d) is not attributed to an energetic or structural problembut to a dynamic one. Fast relaxation processes emptythe population of the intermediate state before secondaryabsorption into the ionization continuum can take place.Choosing a different intermediate state is usually nota solution since it is improbable that higher electronicstates will show considerably longer lifetimes. One ele-gant way to overcome these short lifetimes is to performthe ionization step on an even shorter time-scale. Since
femtosecond lasers are commercially available, this is notjust a hypothetical but a practical solution of the problem.In Fig. 11, two examples are displayed where nanosec-ond and femtosecond laser ionization are compared. Themolecular species investigated in Fig. 11 are representa-tive of molecules which are especially known for theirvery fast and efficient dissociation from electronicallyexcited states, namely organometallic and nitroaromaticcompounds.
In Fig. 11, diphenylmercury was studied by nano- andfemtosecond excitation.43 Wavelengths between 250 and265 nm are available for both experiments. It is obviousthat for nanosecond excitation no signal at the molecularmass is detectable, but strong peaks due to small frag-ments appear; these fragment ions are caused by primaryejection of the metal atom and secondary fragmentation ofthe phenyl group. In contrast to the nanosecond spectrum,at femtosecond excitation the molecular ion represents thedominant mass peak with only one further fragment ion(which is due to ejection of phenylmercury). On the rightside of Fig. 11, nitrotoluene has been ionized by nanosec-ond and femtosecond laser light.44 In the nanosecond massspectrum, NOC appears nearly exclusively. The inset illus-trates the ionization pathway for this fragmentation. Fastdissociation of the neutral intermediate state results in neu-tral NO fragments, which (more or less accidentally) areionized by 226 nm light very efficiently. No parent ion can
Figure 11. Ionization with very short pulse lasers. Left: laser mass spectra of diphenylmercury ionized by nanosencond (a) and bysub-picosend (b) laser pulses (laser wavelength 250 265 nm). Reprinted from C. Weickhardt, C. Grun, J. Grotemeyer, Eur. MassSpectrom. 4, 239 244 (1998) with permission of IM Publications, Chichester. Right: laser mass spectra of nitrotoluene ionized bynanosencond (c) and by femtosecond (d) laser pulses. Reprinted from K. W. D. Ledingham et al., Rapid Commun. Mass Spectrom.9, 1522 1527 (1995) with permission of John Wiley & Sons, Chichester. The high NOC signal in spectrum (c) is due to a secondarymultiphoton ionization of neutral NO fragments. A similar process is inducing the HgC signal in spectrum (a). It is obvious thationization with ultra-short laser pulses is able to solve problem (d) in Fig. 10. In favorable cases, nanosecond laser ionization is able toproduce fragment ions which are typical for molecular classes.
Copyright 2000JohnWiley & Sons,Ltd. J. MassSpectrom. 35, 289–304 (2000)

LASER MS FOR ENVIRONMENTAL AND INDUSTRIAL TRACE ANALYSIS 301
be detected at all. In contrast with this spectrum, the fem-tosecond mass spectrum clearly reveals a parent ion (andthus allows its identification), although dominant fragmen-tation could not be avoided even for laser pulses as shortas 50 fs.
In Fig. 12, the resonant laser ionization of dibenzofuran,which is a textbook example including cases (a), (c) and(d) in Fig. 10, is displayed.45 As shown in the excitationscheme, resonant excitation of the intermediate state with312 nm radiation (from a frequency-doubled, Nd : YAGlaser-pumped dye laser) does not allow the ionizationthreshold to be reached with a second 312 nm photon(case (a), Fig. 10). Two-color excitation with a 312 and a266 nm photon should allow ionization from an energeticpoint of view. However, a very low efficiency is observedfor this excitation scheme. The reason (see the experimentdiscussed below) is fast relaxation to the nearby tripletstate (case (d), Fig. 10). Since this relaxation process is
Figure 12. Two-color resonant laser ionization. (a) Scheme oftwo-color ionization of dichloro-dibenzofuran: resonant excita-tion of the S1 intermediate state by 312 nm (a second 312 nmphoton does not reach the ionization continuum: case (a),Fig. 10). Also, a second 266 nm photon does not induce efficientionization owing to fast energy relaxation to the vibrationallyexcited triplet state (intersystem crossing; see case (d), Fig. 10).The 266 nm photon does not ionize the vibrationally excitedtriplet state either (although energetically allowed) owing to verysmall Franck Condon factors (case (c), Fig. 10). This problem issolved by a 213 nm photon. (b) Illustration of this processesby a 312C 266 nm and a 312C 213 nm ionization with temporaldelay of first and second photons. Efficient ionization only atshort delay times is a hint of fast relaxation processes (e.g. tothe triplet state); the efficient ionization even at long delay timesindicates that now the triplet state is efficiently ionized also. Seealso Ref. 45.
isoenergetic in the isolated gas phase,absorptionof a266 nm photonshouldstill beableto ionizethemolecule.However,sincethetriplet stateT1 is energeticallyloweredin comparisonwith the first excitedsinglet stateS1, thisrelaxation leads to a vibrationally excited triplet state.Therefore, the vibrational wavefunctionsof the initialand final statesof the transition I.P. T1 show a verysmalloverlap(FC factors)(case(c), Fig. 10). This canbeimproved by an even shorterwavelengthof the secondphoton thus reaching higher vibrational levels of themolecularion. Goodresultshavebeenachievedwith thefifth harmonicof an Nd: YAG laserat 213 nm.
In the lower part of Fig. 10, an experimentis shownwhich provesthis argument.In this experiment,a primarylaserwith 312 nmandsecondarylaserwith 266or 213 nmwere delayedin time. Using 266 nm as the wavelengthof the secondlaser, the maximum ion signal is smalland vanishesafter very short delay times in the rangeof the laserpulse length (10 ns). This indicatesthat theshort lifetime of the intermediateS1 state is the reasonfor low ionization efficiency at 266 nm (ionization ofthe triplet T1 by 266 nm is not efficient). When 213 nmis chosen as the wavelength of the second laser, anintensityincreaseof morethana factorof five is observed.This intensity staysnearly unchangedfor delay times inthe microsecondrange correspondingto typical tripletlifetimes. This secondresult indeedprovesthat evenforfast intramoleculardynamic processes,two-color, two-photonionization is an optimumionizationscheme.Thisis trueaslong asdissociationprocessesarenot activeanddestroymolecularmassinformation.
In addition to two-color ionization, fixed-frequencyionization(reducedselectivity),femtosecondexcitationor(nC m) multiphotonionization(with n > 1), someotherlaser-inducedgas-phaseionization techniquesshould bementioned. One is laser-inducedvacuum UV(VUV),which is generatedby focusing laser light into a gascell filled with noble gas (e.g. Kr, Ar). The veryuseful wavelengthof 118 nm for semi-selectivesinglephoton ionization is generatedwith the third harmonicof an Nd: YAG laserat 355 nm (for generalinformationaboutlasertechniquesfor spectroscopy,seeRef. 46 andreferencescitedtherein).At 118 nmmostlargermoleculesare ionized while the ionization thresholdof thosesmallmoleculeswhich representby far the main part of airsampleslies above this energy. A further advantageoflaser-inducedVUV ionization is that it is not affectedbythe problemsaddressedin Fig. 10 (at too small excessenergies abovethe ionization threshold,Franck–Condonfactors might be small in somecases).Owing to smallphotonnumbersper laserpulse,the sensitivity is reducedin comparisonwith resonantlaserionization.
Similar argumentsconcerningsensitivityandthe prob-lemsaddressedin Fig. 10 arevalid for laser-inducedelec-tron ionization.47 Electron ionization is very useful as anon-selectiveionizationmethoddeliveringa generalsur-vey about the main componentsof a gas sample.Evenmoreuseful is the combinationof electronionizationandresonantlaser ionization in the same ion source.Thiscombinationallows one to obtain the above-mentionedsurvey information and also very selectiveinformation(e.g.specialtracecompounds)within onemassspectrum.In Fig. 13, a possiblearrangementto achievesucha par-allel ionizationis displayed.A laserbeamis coupledinto
Copyright 2000JohnWiley & Sons,Ltd. J. MassSpectrom. 35, 289–304 (2000)

302 U. BOESL
Figure 13. The combination of electron ionization and resonance-enhanced multiphoton ionization as an example of the flexibility oflaser-induced ionization. Laser-induced electron ionization (LEI) is achieved by a metal (with low work function, e.g. hafnium) wire tipwhich is hit by the laser and then emits a burst of electrons. Resonant laser ionization (resonant LI) takes place in a molecular beamjust at the end of a thin tube. The combination of LEI and resonant LI is achieved by reflecting the laser beam back into the ion source.Two arrangements are realized: first LEI, then resonant LI (a), and first resonant LEI, then LEI (b). Four mass spectra of an air argongas mixture with traces of toluene are shown. For both arrangements, the reflected laser beam can be blocked giving rise to singly LEIor singly resonant LI mass spectra. The effects of both ionization processes are obvious, and also the fact that ions from two differentionization processes appear in a single mass spectrum. H. Nagel, M. Grandl, U. Boesl, unpublished results.
a molecularbeamjust below the end of a gasinlet tub-ing and then is reflectedby a prism which additionallycausesa parallelshift. Thus,the laserbeamentersthe ionopticsa secondtime andproducesphotoelectronsfrom awire with a low work function (e.g.hafnium).By apply-ing a pulsednegativevoltage of about 70–100 V withrespectto the gas inlet tubing, the electronsare accel-eratedtowardsthe molecularbeamand causeadditionalionization. Both processescan be controlled separatelyandoptimizedfor theactualanalyticalsituations.To checktheeffectof bothionizationprocesses,thedirectionof thelaserbeamcanbe turned,hitting the wire first andpass-ing under the gas inlet tubing afterwards.In both cases,the laser beamcan be blocked after the first ionizationprocess(resonantlaser ionization or electronionization,
respectively).The massspectradue to thesefour differ-ent ionization arrangementsare shown at the bottom ofFig. 13. A mixtureof air andargonwith tracesof tolueneservesas illustrative gas sample.It is shown how eachionizationprocesscanbeswitchedon or off separatelyorcan be combined.This switching may take placewithin0.1 s. In addition, the differenteffectsof the two ioniza-tion methodsis obvious:themaingascomponentsappearupon electron ionization and selectedtrace compoundsoccuron resonantlaserionization.
Finally, thereexists the possibility of performingtan-dem massspectrometrywith laserexcitationand reflec-tron time-of-flight mass analyzers without substantialadditional hardware.Tandemmassspectrometryis oneof the most important conventionaltechniquesof trace
Copyright 2000JohnWiley & Sons,Ltd. J. MassSpectrom. 35, 289–304 (2000)

LASER MS FOR ENVIRONMENTAL AND INDUSTRIAL TRACE ANALYSIS 303
analysis; however, the instrumental effort is large. Reflec-tron time-of-flight mass analyzers have an intrinsic secondpoint of mass selectivity (namely the so-called space-focusof the ion source). Here, secondary laser excitation allowsmass-selective fragmentation.34,48 In addition, laser exci-tation may induce metastable decay of molecular ions;in this case, the special features of reflectron time-of-flight mass analyzers with respect to metastable decay inthe field-free region39,49,50 (sometimes called post-sourcedecay) allow tandem mass spectrometry with low addi-tional effort, again. Whichever method is used, if isobaricmolecular species have different secondary mass spectra,then this is another method of selective laser-induced massspectrometry, which may compensate for reduced selec-tivity of the ionization step (e.g. due to fixed-frequency,medium-resolution or single-photon ionization). The nec-essary double laser pulses with adequate separation (e.g.some tens ofµs) are available from some commercialNd : YAG lasers by switching the quality of the laser res-onator twice during one flash lamp pulse.
CONCLUSION
The typical applications described above demonstrate thatresonant laser mass spectrometry is valuable in actual
analytical problems which cannot be solved by conven-tional techniques of trace analysis. This involves fast,rapidly changing combustion processes (e.g. combustionengines), fast on-site analysis of single chemical species(e.g. the PAH load of aerosols, pollutants due to chemi-cal accidents), on-line analysis of trace compounds whichmay act as indicators for highly poisonous substances (e.g.polychlorinated dioxins) with far lower concentrations orthe fast measurement of whole chemical patterns (withsingle species selectivity and not overall sum values suchas the ‘total hydrocarbon content’) to identify and controlthe state of technical incinerators or even chemical plants.
This tendency will be supported and, hopefully, accel-erated by new generations of lasers. Thus, very smallbut nevertheless powerful Nd : YAG lasers now are com-mercially available, in addition to reliable, small excimerlasers with high repetition rates of up to 500 Hz andof reasonable cost. This development is completed bynew tunable lasers (e.g. OPO lasers) with good wave-length resolution of a few wavenumbers and very smallsize. However, also on the side of the mass spectrome-ter and vacuum system, a considerable reduction in sizeis possible. To summarize, mobile instruments equippedfor rough, every-day environmental conditions in industry(maybe at the expense of ultra-high selectivity or evensensitivity, but not of rapidity) are one goal for the futuredevelopment of resonant laser mass spectrometry.
REFERENCES
1. Lubman D. Lasers in Mass Spectrometry. New York: OxfordUniversity Press, 1990.
2. Vertes A, Gijbels R, Adams F. Laser Ionization Mass Analy-sis. New York: John Wiley & Sons, 1993.
3. Cotter R. Anal. Chem. 1984; 56: 485A.4. Lubman D. Anal. Chem. 1984; 56: 1256A.5. Lin S, Fujimura Y, Neusser H, Schlag E. Multiphoton Spec-
troscopy of Molecules. Orlando, FL: Academic Press, 1984.6. Letokhov V. Laser Photoionization Spectroscopy. Orlando,
FL: Academic Press, 1987.7. Boesl U. J. Phys. Chem. 1991; 95: 2949.8. Boesl U. In Encyclopedia of Spectroscopy and Spectrometry,
McNeil C (ed.). New York: Academic Press, in press.9. Johnson P. Appl. Opt. 1980; 19: 3920.
10. Boesl U, Neusser H, Schlag E. J. Chem. Phys. 1980; 72: 4327.11. Bernstein R. J. Phys. Chem. 1982; 86: 1178.12. Lubman D, Kronick M. Anal. Chem. 1982; 54: 660.13. Gedanken A, Robin M, Kuebler N. J. Phys. Chem. 1982; 86:
4096.14. Gobeli D, Yang J, El-Sayed M. Chem. Rev. 1985; 85: 529.15. Grotemeyer J, Schlag E. Angew. Chem., Int. Ed. Engl. 1988;
27: 447.16. Boesl U, Weinkauf R, Weickhardt C, Schlag E. Int. J. Mass
Spectrom. Ion Processes 1994; 131: 87.17. Zenobi R. Int. J. Mass Spectrom. Ion Processes 1995; 145:
51.18. Zenobi R, Zhan Q, Voumard P. Mikrochim. Acta 1996; 124:
273.19. Ledingham K, Singhal R. Int. J. Mass Spectrom. Ion Pro-
cesses 1997; 163: 149.20. Haefliger O, Zenobi R. Anal. Chem. 1998; 70: 2660.21. Boesl U, Heger H, Zimmermann R, Puffel P, Nagel H. In
Encyclopedia of Chemical Analysis, Meyers RA (ed.). NewYork: John Wiley & Sons, in press.
22. Jaffe H, Orchin M. Theory and Applications of UltravioletSpectroscopy. New York: John Wiley & Sons, 1962.
23. Dietz TG, Duncan MA, Livermann MG, Smalley RE. J. Chem.Phys. 1980; 73: 4816.
24. Amirav A, Even U, Jortner J. Anal. Chem. 1982; 1666.25. Hayes J. Chem. Rev. 1987; 87: 745, 760.26. Zimmermann R, Lermer C, Schramm K, Kettrup A, Boesl U.
Eur. Mass Spectrom. 1995; 1: 341.27. Oser H, Thanner R, Grotheer H. Combust. Sci. Technol. 1996;
116/117: 567.28. Castaldi M, Senkan S. J. Air Waste Manage. Assoc. 1998; 48:
77.29. Heger H, Zimmermann R, Dorfner R, Beckmann M, Grie-
bel H, Kettrup A, Boesl U. Anal. Chem. 1999; 71: 46.30. Guilhaus M. J. Mass Spectrom. 1995; 30: 1519.31. Schlag E (ed.). Time-of-Flight Mass Spectrometry and its
Applications. Int. J. Mass Spectrom. Ion Processes 1994;131.
32. Wiley W, McLaren I. Rev. Sci. Instrum. 1955; 26: 1150.33. Mamyrin B, Karataev V, Shmikk D, Zagulin V. Sov. Phys.
JETP 1973; 37: 45.34. Boesl U, Weinkauf R, Schlag E. Int. J. Mass Spectrom. Ion
Processes 1992; 112: 121.35. Tanada T, Valezquez, Hemmi N, Cool T. Ber. Bunsen-Ges.
Phys. Chem. 1993; 97: 1516.36. Puffel P, Thiel W, Frey R, Boesl U. SAE Tech. Pap. Ser. 1998;
No. 982438: 1.37. Puffel P, Boesl U. VDI Ber. 1999; 1470: 215.38. Zhan Q, Voumard P, Zenobi R. Rapid Commun. Mass Spec-
trom. 1995; 9: 119.39. Spengler B. J. Mass Spectrom. 1997; 32: 1019.40. deHoffmann E. J. Mass Spectrom. 1996; 31: 129.41. Blumenstock M, Zimmermann R, Schramm K, Kaune A,
Nikolai U, Lenoir D, Kettrup A. J. Anal. Appl. Pyrol. 1999;49: 179.
42. Zimmermann R, Heger H, Blumenstock M, Dorfner R, Sch-ramm K, Boesl U, Kettrup A. Rapid Commun. Mass Spec-trom. 1999; 13: 307.
43. Weickhardt C, Grun C, Grotemeyer J. Eur. Mass Spectrom.1998; 4: 239.
Copyright 2000 John Wiley & Sons, Ltd. J. Mass Spectrom. 35, 289–304 (2000)

304 U. BOESL
44. Ledingham K, Kilic H, Kosmidis C, Deas R, Marshall A, Mc-Canny T, Singhal R, Langley A, Shaikh W. Rapid Commun.Mass Spectrom. 1995; 9: 1522.
45. Zimmermann R, Lenoir D, Kettrup A, Nagel H, Boesl U. In27th Symposium on Combustion. The Combustion Institute,Pittsburgh: 1996; D2859 2868.
46. Demtroder W. Laser Spectroscopy (2nd edn). Berlin: Sprin-ger, 1996.
47. Rohwer E, Beavis R, Koster C, Lindner J, Grotemeyer J,Schlag E. Z. Naturforsch., Teil A 1988; 43: 1151.
48. Boesl U, Weinkauf R, Walter K, Weickhardt C, Schlag E.J. Phys. Chem. 1990; 94: 8567.
49. Boesl U, Neusser HJ, Weinkauf R, Schlag E. J. Phys. Chem.1982; 86: 4857.
50. Ioanoviciu D, Yefchak G, Enke C. Int. J. Mass Spectrom. IonProcesses 1991; 104: 83.
Copyright 2000 John Wiley & Sons, Ltd. J. Mass Spectrom. 35, 289–304 (2000)