Embed Size (px)
Citation preview
December 2005
NASA/TM–2005–212794
Laser Frequency Stabilization for LISA
Guido Mueller, Paul McNamara, Ira Thorpe, and Jordan Camp
https://ntrs.nasa.gov/search.jsp?R=20060012084 2020-06-25T18:42:35+00:00Z
The NASA STI Program Offi ce … in Profi le
Since its founding, NASA has been ded i cat ed to the ad vance ment of aeronautics and space science. The NASA Sci en tifi c and Technical Information (STI) Pro gram Offi ce plays a key part in helping NASA maintain this im por tant role.
The NASA STI Program Offi ce is operated by Langley Re search Center, the lead center for NASA s scientifi c and technical in for ma tion. The NASA STI Program Offi ce pro vides ac cess to the NASA STI Database, the largest col lec tion of aero nau ti cal and space science STI in the world. The Pro gram Offi ce is also NASA s in sti tu tion al mech a nism for dis sem i nat ing the results of its research and de vel op ment ac tiv i ties. These results are published by NASA in the NASA STI Report Series, which includes the following report types:
• TECHNICAL PUBLICATION. Reports of com plet ed research or a major signifi cant phase of research that present the results of NASA pro-grams and include ex ten sive data or the o ret i cal analysis. Includes com pi la tions of sig nifi cant scientifi c and technical data and in for ma tion deemed to be of con tinu ing ref er ence value. NASA s counterpart of peer-re viewed formal pro fes sion al papers but has less stringent lim i ta -tions on manuscript length and ex tent of graphic pre sen ta tions.
• TECHNICAL MEMORANDUM. Scientifi c and tech ni cal fi ndings that are pre lim i nary or of spe cial ized interest, e.g., quick re lease reports, working papers, and bib li og ra phies that contain minimal annotation. Does not contain extensive analysis.
• CONTRACTOR REPORT. Scientifi c and techni-cal fi ndings by NASA-sponsored con trac tors and grantees.
• CONFERENCE PUBLICATION. Collected pa pers from scientifi c and technical conferences, symposia, sem i nars, or other meet ings spon sored or co spon sored by NASA.
• SPECIAL PUBLICATION. Scientifi c, tech ni cal, or historical information from NASA pro grams, projects, and mission, often con cerned with sub-jects having sub stan tial public interest.
• TECHNICAL TRANSLATION. En glish-language trans la tions of foreign sci en tifi c and tech ni cal ma-terial pertinent to NASA s mis sion.
Specialized services that complement the STI Pro-gram Offi ceʼs diverse offerings include cre at ing custom the sau ri, building customized da ta bas es, organizing and pub lish ing research results . . . even pro vid ing videos.
For more information about the NASA STI Pro gram Offi ce, see the following:
• Access the NASA STI Program Home Page at http://www.sti.nasa.gov/STI-homepage.html
• E-mail your question via the Internet to [email protected]
• Fax your question to the NASA Access Help Desk at (301) 621-0134
• Telephone the NASA Access Help Desk at (301) 621-0390
• Write to: NASA Access Help Desk NASA Center for AeroSpace In for ma tion 7121 Standard Drive Hanover, MD 21076–1320
National Aeronautics and Space Ad min is tra tion
Goddard Space Flight CenterGreenbelt, Maryland 20771
December 2005
NASA/TM–2005–212794
Guido Mueller and Ira Thorpe Department of Physics, University of Florida, Gainesville, Florida
Paul McNamara and Jordan CampNASA/Goddard Space Flight Center, Greenbelt, Maryland
Laser Frequency Stabilization for LISA

Available from:
NASA Center for AeroSpace Information National Technical Information Service7121 Standard Drive 5285 Port Royal RoadHanover, MD 21076-1320 Springfi eld, VA 22161Price Code: A17 Price Code: A10
Laser frequency stabilization for LISAGuido Mueller1, Paul McNamara2, Ira Thorpe1, Jordan Camp2
1Department of Physics, University of Florida, Gainesville, FL 32611
2Goddard Space Flight Center, Greenbelt, Md, 20771
Abstract
The requirement on laser frequency noise in the Laser Interferometer Space An-tenna (LISA) depends on the velocity and our knowledge of theposition of each space-craft of the interferometer. Currently, it is assumed that the lasers must have a pre-stabilized frequency stability of 30Hz/
√Hz over LISA’s most sensitive frequency-
band (3 mHz to 30 mHz). The intrinsic frequency stability of even the most stablecommercial lasers is several orders of magnitude above thislevel. Therefore, it isnecessary to stabilize the laser frequency to an ultrastable frequency reference whichmeets the LISA requirements. The baseline frequency reference for the LISA lasersare high finesse optical cavities based on ultralow expansion glass (ULE) spacers. Wemeasured the stability of two ULE spacer cavities with respect to each other. Our cur-rent best results show a noise floor at, or below, 30Hz/
√Hz above 3 mHz. In this
report, we describe the experimental layout of the entire experiment and discuss thelimiting noise sources.
1 Introduction
The Laser Interferometer Space Antenna (LISA) [1], is a joint ESA/NASA mission de-signed to measure low-frequency gravitational radiation emitted from distant super massiveblack hole binaries and mergers, from galactic neutron starand white dwarf binaries, andfrom super massive black holes capturing neutron stars or smaller black holes. Gravita-tional waves, first predicted by Einstein, are a direct consequence of the theory of generalrelativity. Large accelerated masses emit gravitational waves and studying these waves isequivalent to studying the acceleration of these masses.
LISA consists of three spacecraft (s/c) in a heliocentric orbit. The s/c are in a trian-gular constellation with an armlength of 5·109m. Two inertial proof masses within eachspacecraft form the ends of the interferometer arms. The simplest picture is to imaginethat one spacecraft acts like a beam splitter in a conventional Michelson interferometer,while the two other spacecraft are the end mirrors. The interferometer measures relativechanges in the distances between the beam splitter and the end mirrors. If the lengths ofthe interferometer arms are not equal, the accuracy of a direct interferometric measurementof the phase difference between the two return beams is limited by laser frequency noise.A technique called “time delay interferometry” is proposedto cancel up to seven ordersof magnitude of laser frequency noise by post-processing the data streams to artificiallyequalize the armlengths. This technique relaxes the requirements on laser frequency noiseto [2]
δν <30Hz√
Hzat 3 mHz. (1)
1
The frequency reference for the LISA lasers will be a monolithic optical cavity made fromthree mirrors bonded to a piece of Ultra Low Expansion Glass (ULE) [3]. ULE has athermal expansion coefficient of less than 2·10−8K−1 at temperatures between 5 to 35 C.Alternatives to ULE are Zerodur from Schott [4] and Clearceram-Z from Ohara [5] whichhave similar expansion coefficients. The optical path length (OPL) inside the cavity, andtherefore the resonant frequency, depends only on the geometrical stability of the ULEspacer and the bonds between the mirrors and the spacer. The temperature stability of theoptical bench inside the spacecraft is expected to be betterthanµK/
√Hz at frequencies
above 1 mHz. If the OPL is limited by the thermal stability of the spacer, the relative lengthstabilityδL/L of a cavity of lengthL in such an environment is:
δLL
<2 ·10−8
K·
µK√Hz
=2 ·10−14√
Hz. (2)
The absolute frequency changeδν of the resonance frequencyν is then:
δν =δLL
ν <2 ·10−14√
Hz3 ·1014Hz =
6Hz√Hz
. (3)
Obviously, every additional factor in frequency noise reduction will either increase the mar-gin or can help to relax other requirements like timing and arm length knowledge (rang-ing) requirements. In this paper, we will present results that meet LISA’s frequency noiserequirements of 30Hz/
√Hz above 3 mHz. In the following section, we describe the prin-
ciples of the Pound-Drever-Hall (PDH) [6] technique, whichwe use to stabilize the laserfrequency to the resonant frequency of an optical cavity. The third section gives importantdetails about the experimental setup. In the fourth section, we will discuss potential noisesources. The final section describes the measured frequencynoise and puts them in contextwith the measured noise sources and LISA requirements.
2 Frequency Stabilization with a Reference Cavity
Frequency stabilization systems require a reference frequency and a readout system thatutilizes the full stability of the reference frequency. Thetwo most common types of ref-erence frequencies that are used in the optical frequency domain are molecular or atomictransitions and optical cavities. Molecular or atomic transitions like transitions betweenrotational and vibrational eigenstates of the iodine molecule are especially advantageousif the absolute frequency and the long term frequency stability are of particular interest.Optical cavities based on ultralow expansion materials in temperature stable environmentsare especially useful in experiments where the short term frequency stability is important.The cross over between these systems is around measurement times of a few seconds tominutes corresponding to signal frequencies between 10 mHzand 1 Hz [7]. The baselinedesign of the LISA mission uses optical cavities as frequency references for their lasersbecause of their simplicity and simple readout systems.
Optical cavities for laser frequency stabilization are usually either two-mirror linearcavities or three-mirror triangular cavities. One advantage of linear cavities is the reduced
2
number of mirrors and subsequently, a reduced number of lossy reflections per roundtrip.The much simpler support structure - a rod with one drilled bore compared to a triangularstructure with three bore holes - also reduces the cost of linear cavities. One advantage oftriangular cavities is that the reflected beam is automatically separated from the incomingbeam and can be directly detected without any additional optical components. Unfortu-nately, this advantage also makes it more difficult to align triangular cavities compared tolinear cavities where the orientation of the reflected beam with respect to the incomingbeam is often used to accelerate the alignment. Throughout this paper we will focus onlinear two mirror cavities. Some of the following formulas would have to be slightly modi-fied for triangular three mirror cavities. We also ignore a few effects that do not change theoutcome of our research such as the Guoy phase of the spatial Hermite-Gauss eigenmodesof the optical cavities. The interested reader is referred to [8] for detailed information aboutdifferent resonator types and the properties of their spatial eigenmodes.
Optical cavities are characterized by their free spectral range (FSR):
FSR=c
2L, (4)
whereL is the distance between mirrors, and their finesse:
F =π√r1r2
1− r1r2
r1=r2︷︸︸︷≈
πT
, (5)
r1 andr2 are the amplitude reflectivities of the cavity mirrors,T is the intensity transmis-sivity of each of the mirrors. The laser field is resonant in the cavity when the round tripphaseshift is a multiple of 2π. Each cavity has a series of resonances separated by the FSR:
νn
FSR= n nε ℵ . (6)
The width of the resonance is usually given in terms of the Full-Width Half Maximum(FWHM) or Half-Width Half Maximum (HWHM). These values are correlated with theFSR and the finesse as follows:
FWHM=FSR
F= 2 ·HWHM. (7)
The goal of the laser frequency stabilization system is to ensure that the laser frequency isclose to one of the resonances of the cavity and that the difference changes by less than therequired frequency stability. In LISA, this would require arelative stability of 30Hz/
√Hz
over 1000s of the laser frequency with respect to the cavity resonance frequency, assumingthat the cavity resonance frequency has stability better than 30Hz/
√Hz.
3 Experimental Setup
A standard technique to stabilize the laser frequency is anrf reflection locking technique(Pound-Drever-Hall [6]). This technique is extensively discussed in the literature (see forexample [9]) and will not be discussed in this paper. We set uptwo nearly identical and
3
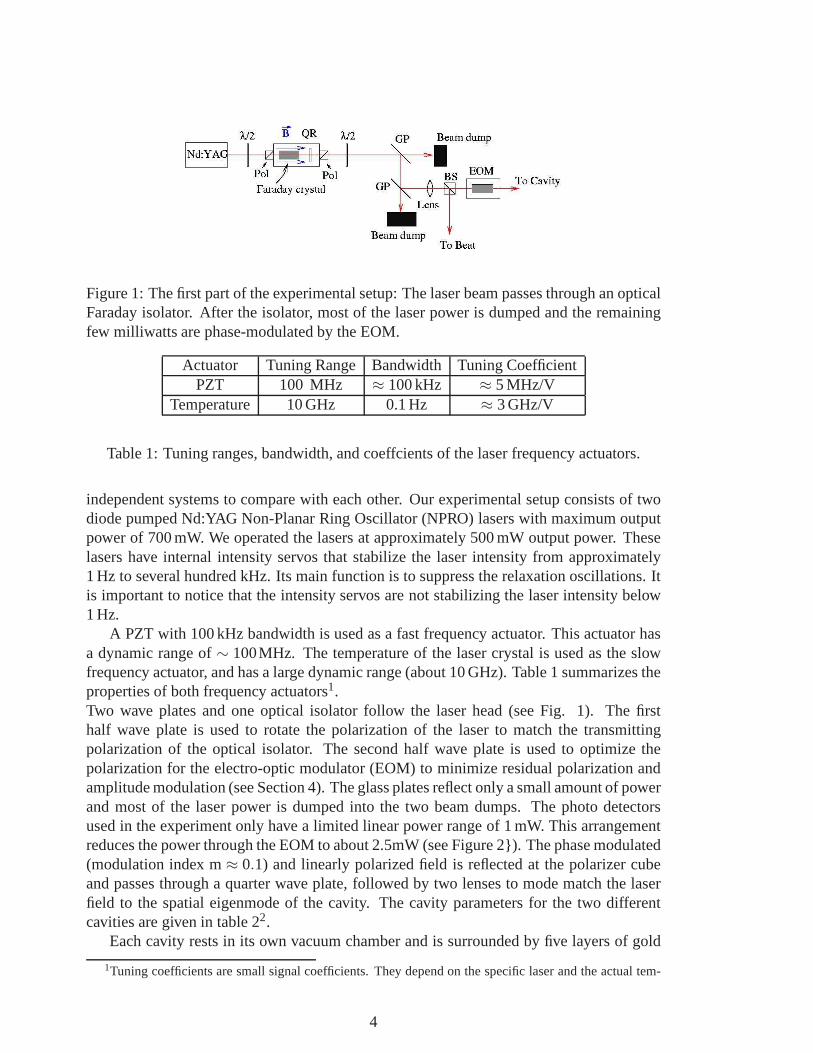
Figure 1: The first part of the experimental setup: The laser beam passes through an opticalFaraday isolator. After the isolator, most of the laser power is dumped and the remainingfew milliwatts are phase-modulated by the EOM.
Actuator Tuning Range Bandwidth Tuning CoefficientPZT 100 MHz ≈ 100 kHz ≈ 5 MHz/V
Temperature 10 GHz 0.1 Hz ≈ 3 GHz/V
Table 1: Tuning ranges, bandwidth, and coeffcients of the laser frequency actuators.
independent systems to compare with each other. Our experimental setup consists of twodiode pumped Nd:YAG Non-Planar Ring Oscillator (NPRO) lasers with maximum outputpower of 700 mW. We operated the lasers at approximately 500 mW output power. Theselasers have internal intensity servos that stabilize the laser intensity from approximately1 Hz to several hundred kHz. Its main function is to suppress the relaxation oscillations. Itis important to notice that the intensity servos are not stabilizing the laser intensity below1 Hz.
A PZT with 100 kHz bandwidth is used as a fast frequency actuator. This actuator hasa dynamic range of∼ 100MHz. The temperature of the laser crystal is used as the slowfrequency actuator, and has a large dynamic range (about 10 GHz). Table 1 summarizes theproperties of both frequency actuators1.Two wave plates and one optical isolator follow the laser head (see Fig. 1). The firsthalf wave plate is used to rotate the polarization of the laser to match the transmittingpolarization of the optical isolator. The second half wave plate is used to optimize thepolarization for the electro-optic modulator (EOM) to minimize residual polarization andamplitude modulation (see Section 4). The glass plates reflect only a small amount of powerand most of the laser power is dumped into the two beam dumps. The photo detectorsused in the experiment only have a limited linear power rangeof 1 mW. This arrangementreduces the power through the EOM to about 2.5mW (see Figure 2). The phase modulated(modulation index m≈ 0.1) and linearly polarized field is reflected at the polarizer cubeand passes through a quarter wave plate, followed by two lenses to mode match the laserfield to the spatial eigenmode of the cavity. The cavity parameters for the two differentcavities are given in table 22.
Each cavity rests in its own vacuum chamber and is surroundedby five layers of gold
1Tuning coefficients are small signal coefficients. They depend on the specific laser and the actual tem-
4
Length FSR Finesse R1 R2
Cavity 1 25.08 cm 597.65 MHz 10150±1000 inf 0.5 mCavity 2 18.968 cm 790.25 MHz 9744±1000 0.5 m 0.5 m
Table 2: The parameters of the two cavities: R1, R2 are the radii of curvature of the twocavity mirrors. The nominal transmission of all cavity mirrors is T = 250 ppm. This wouldresult in a nominal finesse of 12566. The measured finesse of around 10000 correspondseither to a transmission of T = 300 ppm or additional round trip losses due to scattering andabsorption at the mirrors of about 100 ppm.
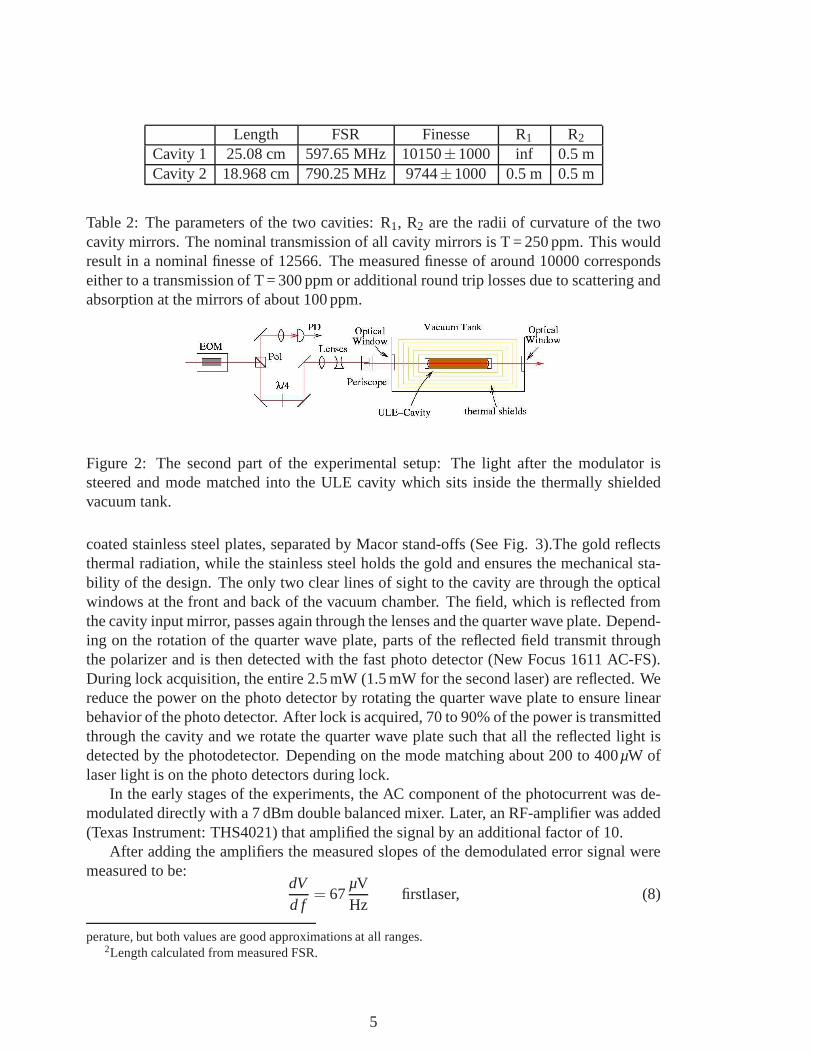
Figure 2: The second part of the experimental setup: The light after the modulator issteered and mode matched into the ULE cavity which sits inside the thermally shieldedvacuum tank.
coated stainless steel plates, separated by Macor stand-offs (See Fig. 3).The gold reflectsthermal radiation, while the stainless steel holds the goldand ensures the mechanical sta-bility of the design. The only two clear lines of sight to the cavity are through the opticalwindows at the front and back of the vacuum chamber. The field,which is reflected fromthe cavity input mirror, passes again through the lenses andthe quarter wave plate. Depend-ing on the rotation of the quarter wave plate, parts of the reflected field transmit throughthe polarizer and is then detected with the fast photo detector (New Focus 1611 AC-FS).During lock acquisition, the entire 2.5 mW (1.5 mW for the second laser) are reflected. Wereduce the power on the photo detector by rotating the quarter wave plate to ensure linearbehavior of the photo detector. After lock is acquired, 70 to90% of the power is transmittedthrough the cavity and we rotate the quarter wave plate such that all the reflected light isdetected by the photodetector. Depending on the mode matching about 200 to 400µW oflaser light is on the photo detectors during lock.
In the early stages of the experiments, the AC component of the photocurrent was de-modulated directly with a 7 dBm double balanced mixer. Later, an RF-amplifier was added(Texas Instrument: THS4021) that amplified the signal by an additional factor of 10.
After adding the amplifiers the measured slopes of the demodulated error signal weremeasured to be:
dVd f
= 67µVHz
firstlaser, (8)
perature, but both values are good approximations at all ranges.2Length calculated from measured FSR.
5
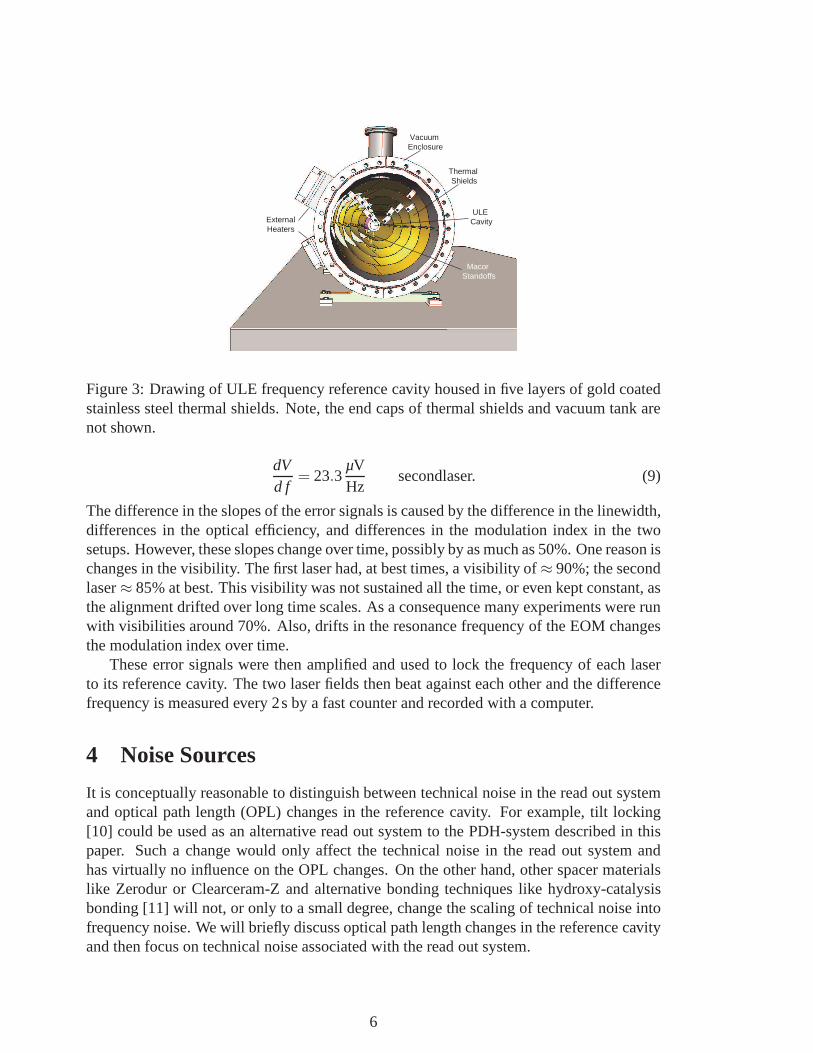
Vacuum Enclosure
Thermal Shields
ULE Cavity
Macor Standoffs
ExternalHeaters
Figure 3: Drawing of ULE frequency reference cavity housed in five layers of gold coatedstainless steel thermal shields. Note, the end caps of thermal shields and vacuum tank arenot shown.
dVd f
= 23.3µVHz
secondlaser. (9)
The difference in the slopes of the error signals is caused bythe difference in the linewidth,differences in the optical efficiency, and differences in the modulation index in the twosetups. However, these slopes change over time, possibly byas much as 50%. One reason ischanges in the visibility. The first laser had, at best times,a visibility of ≈ 90%; the secondlaser≈ 85% at best. This visibility was not sustained all the time, or even kept constant, asthe alignment drifted over long time scales. As a consequence many experiments were runwith visibilities around 70%. Also, drifts in the resonancefrequency of the EOM changesthe modulation index over time.
These error signals were then amplified and used to lock the frequency of each laserto its reference cavity. The two laser fields then beat against each other and the differencefrequency is measured every 2s by a fast counter and recordedwith a computer.
4 Noise Sources
It is conceptually reasonable to distinguish between technical noise in the read out systemand optical path length (OPL) changes in the reference cavity. For example, tilt locking[10] could be used as an alternative read out system to the PDH-system described in thispaper. Such a change would only affect the technical noise inthe read out system andhas virtually no influence on the OPL changes. On the other hand, other spacer materialslike Zerodur or Clearceram-Z and alternative bonding techniques like hydroxy-catalysisbonding [11] will not, or only to a small degree, change the scaling of technical noise intofrequency noise. We will briefly discuss optical path lengthchanges in the reference cavityand then focus on technical noise associated with the read out system.
6
4.1 Stability of Reference Cavity
4.1.1 Laser Independent Changes
The most obvious source for possible length changes of the reference cavity are temper-ature induced changes. The gold-coated thermal-shields inside the vacuum chamber willsuppress ambient temperature fluctuations by several orders of magnitude. In addition tothe insulation, the cavity material itself will average over spatial inhomogeneities in thetemperature fluctuations and the thermal mass of the cavity will low pass filter the fluctua-tions furthermore. Based on the results presented in the following chapter, we assume thatthe temperature fluctuations of the cavity material itself are smaller than a fewµK/
√Hz
over the LISA measurement band.It is also well known that materials like ULE or Zerodur shrink slowly over time. This
creep is sometimes thought to be a series of single spontaneous relaxation processes insidethe material. If this is the case, then it is reasonable to assume that the associated noisedepends on the history of the material, how it was produced and especially how and whenit was machined. Also, the bonds between the mirrors and the spacer can change overtime depending on the type of bond and the surface quality. The long term goal of ourexperiments is to gain at least an empirical understanding how the machining and bondinghistory of the cavities influences their stability.
4.1.2 Length Fluctuations Through Laser Intensity Noise
Parts of the laser field will be absorbed in the substrates andcoatings of the mirrors. Thiswill increase the temperature of the mirrors and subsequentthermal expansion will changethe resonance frequency of the cavity. The circulating power inside the cavity is
Pcav =Pin
T≈ 10W
Pin
[2.5mW]. (10)
We estimate the absorption coefficient of the coatings inside the cavity to be 10ppm. Underthis assumption, each mirror would absorb
Pcoatabs = 100µW. (11)
The local expansion across the beam profile would then be [12]:
∆s=α
4πκPcoat
abs , (12)
whereα is the thermal expansion coefficient andκ is the heat conductivity of the substratematerial. For the fused silica mirrors used in this experiment:
ακ
= 3.7 ·10−7 mW
αFS =5.1 ·10−7
KκFS = 1.38
WmK
. (13)
The local expansion is then:
∆s=3.7 ·10−7m
4πW·100µW ≈ 2.9pm, (14)
7
which changes the resonance frequency of the long cavity by:
∆ν ≈ 2 ·ν∆sL
= 6.5kHz, (15)
while the resonance frequency of the short cavity will change by:
∆ν ≈ 2 ·ν∆sL
= 8.6kHz. (16)
The factor 2 takes into account that both mirrors expand. This deformation, localizedonly across the laser beam, is a result of the limited heat conductivity of the mirror sub-strates. These substrates will also experience a nearly homogeneous expansion generatedby the nearly homogeneous temperature increase across the entire mirror substrate. Thisexpansion is directed outward and will in first order not change the optical path lengthbetween the mirror coatings.
Finally, the heat also increases the temperature of the cavity spacer. In addition tothe light absorbed in the coatings, additional light will also scatter at the surfaces of themirrors and will be absorbed in the spacer. Based on the measured finesse, we estimate thatno more than 100 ppm or 1 mW of the cavity internal field is lost at the two mirrors andwill be absorbed in the spacer.
In equilibrium the entire heat generated by the laser field has to be radiated into theenvironment. We use the black body radiation to estimate thetemperature increase. Theradiation of a black body at a certain temperature is:
Rcav→tank = 5.7 ·10−8 W
m2K4T4cav. (17)
At the same time the environment or tank radiates heat back tothe cavity:
Rtank→cav = 5.7 ·10−8 W
m2K4T4tank. (18)
The net heat exchange has to be equal to the absorbed power (≈ 1mW):
(Rcav→tank−Rtank→cav) ·A = Rtot ·A = 5.7 ·10−8 W
m2K44 ·T3tank∆T ·A≈ 1mW. (19)
The surface area,A, of the long cavity is
Al = 2πrl ≈ 2π ·0.015m·0.3m≈ 0.028m2, (20)
while the short cavity has a surface area of
As = 0.018m2. (21)
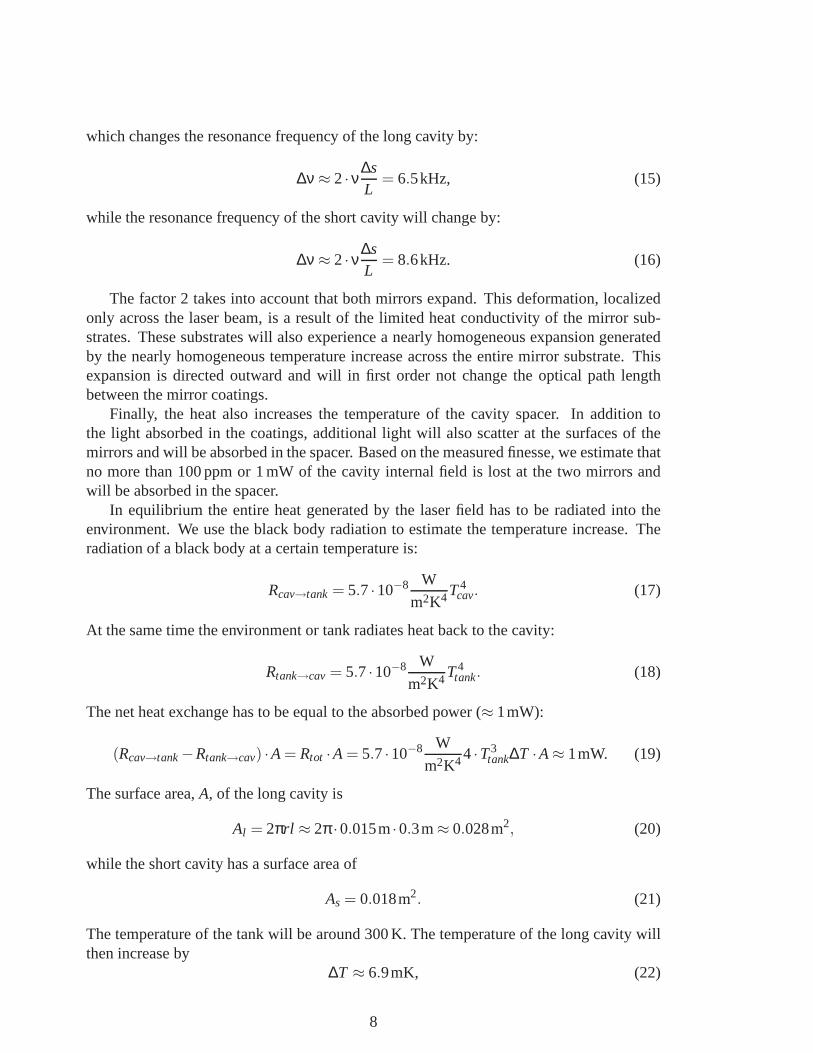
The temperature of the tank will be around 300 K. The temperature of the long cavity willthen increase by
∆T ≈ 6.9mK, (22)
8
Location Surfaces Spacer SpacerTime scale Instantaneous Low pass filtered Time Constant
Long Cavity 6.6 kHzPcoat
abs[100µW]
38 kHz Pabs[1mW]
2.0 ·104s
Short Cavity 8.7 kHzPcoat
abs[100µW]
51 kHz Pabs[1mW]
1.2 ·104s
Table 3: Expected laser induced length changes of the two cavities.
and the temperature of the short cavity will increase by:
∆T ≈ 9mK. (23)
This temperature increase expands both cavities by:
∆L = L ·αULE ·∆T ≤ 34pm αULE ≤2 ·10−8
K, (24)
and changes the resonance frequency of the long cavity by
∆ν ≤ ν∆LL
≈ 38kHz, (25)
and of the short cavity by
∆ν ≤ ν∆LL
≈ 51kHz. (26)
Fluctuations of the laser intensity should be seen instantaneously (compared to peri-ods of LISA signals) in the surface heating of the mirror while the thermal mass of thecavity spacer will act as a low pass filter. The time constant of the ULE spacers can beapproximated by:
τ =qκ
ρ(
L2
)2
, (27)
with q = 776J/kg/K(specific heat),κ = 1.31W/m/K (thermal conductivity), andρ =2210Kg/m3(density) of ULE.L is the length of the spacer. This model assumes that theabsorption takes place on the mirror surfaces. However parts of the scattered light will beabsorbed along the entire cavity material causing a more uniform heating process. Subse-quently, we probably overestimate the time constant of the spacer material. A summary ofthe expected laser induced length changes is shown in Table 3.
Each of these values should be taken with great care as this isonly a very rough thermalmodel. We may overestimate the amount of scattered light (absorbed in the spacer) as wellas the absorption coefficient in the coatings (surfaces) by up to one order of magnitude.However, based on these values we can assume that both processes contribute roughlyequally to length changes in the LISA frequency band and thatboth processes have to beconsidered. The frequency noise requirements of 30Hz/
√Hz in the LISA band set an
upper limit on the relative intensity noise of the laser:
RIN <3 ·10−2√
Hzat 3 mHz. (28)
It should be noted that the requirements on the relative intensity noise of the LISA lasersof 10−4/
√Hz over the LISA band is based on unrelated effects.
9
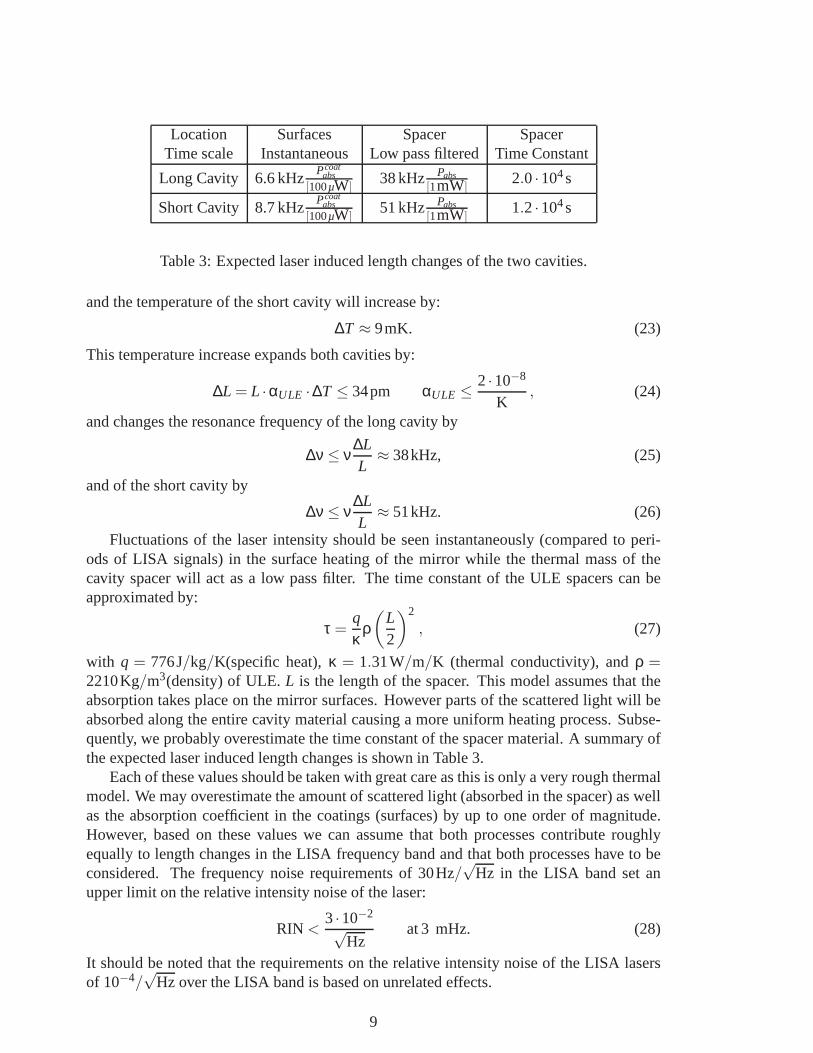
Freq. 1 mHz 3 mHz 10 mHz 30 mHz
short cavity 17Hz· dI/I[10−2]
10Hz· dI/I[10−2]
7Hz· dI/I[10−2]
10Hz· dI/I[10−2]
long cavity 25Hz· dI/I[10−2]
20Hz· dI/I[10−2]
20Hz· dI/I[10−2]
20Hz· dI/I[10−2]
Table 4: Frequency variations of the two cavities due to laser power variations at differentfrequencies.
4.2 Intensity Noise and Frequency Fluctuations
We modulated the intensity of one of the laser fields and monitored the subsequent fre-quency changes. The setup was as follows: Both lasers were locked to their respectivecavity. We modulated the intensity of one of the lasers through its intensity modulationinput and recorded:
1. the beat frequency2. laser intensities
(a) in front of the cavities(b) transmitted through the cavities
3. actuator signals(a) PZT(b) Temperature
The modulation of the intensity of both lasers led to the results presented in Table 4.
Errorbars on these measurements are approximately in the 10to 20% range. In addi-tion, drifts in the alignment and in offsets will also changethe intensity noise to frequencynoise coupling over time. A measurement of the intensity noise at these low frequenciesis non-trivial. The standard procedure is to measure the intensity with a photo receiver,transform the photocurrent into a voltage and subtract thissignal from a constant voltagegenerated by a stable voltage reference. One of the limitations of this measurement are thefluctuations in the voltage reference. We were so far only able to put an upper limit of about5·10−3/
√Hz at 3 mHz on the laser intensity noise. Again, we do not believe that the noise
level is stationary over all measurement times. For example, the alignment of spurious in-terferometers formed between different optical components (for example inside the EOM)will change with room temperature. It is also important to note that this is only the laserintensity in front of the cavity. The above described effectcouples to the changes in the in-tensity inside the cavity, not to the changes in the power in front of the cavity. But changesin the alignment due to temperature or pressure changes in the laboratory will change themode matching efficiency and hence will change the power build up in the cavity withoutchanging the power in front of the cavity.
In addition, we were not able to correlate the intensity noise very well with the fre-quency fluctuations. Therefore, it is probably only safe to say that intensity fluctuationsare one possible noise source which limit our stability but it is not clear that they are thelimiting noise source.
10
0.0001 0.001 0.01 0.1Fourier Frequency [Hz]
0.1
1
10
100
Hz/
rHz
Obelix RFAM (assume 70% visibility)Asterix RFAM (assume 85% visibility)
Expected mixer output (RFAM) during lock
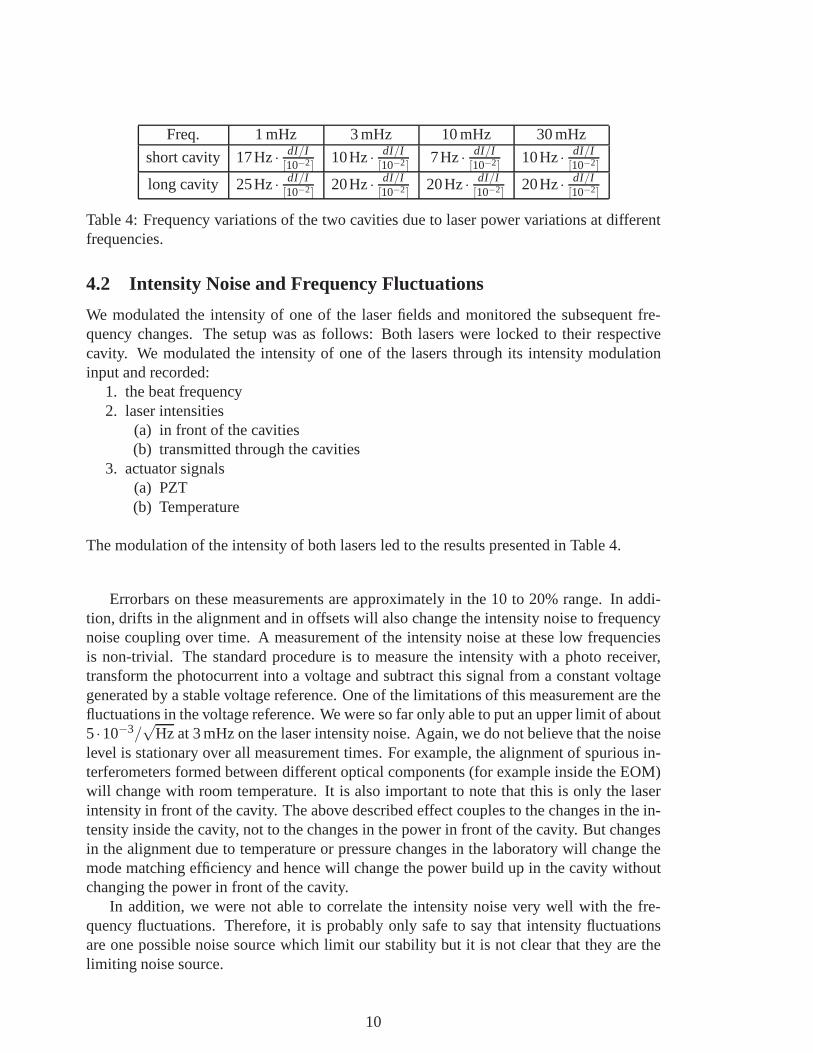
Figure 4: The expected frequency noise calculated from the measured RFAM of the twolasers. As the coupling depends on the mode matching and alignment it is expected thatthis frequency noise contribution changes over time.
4.3 Radio Frequency Amplitude Modulation (RFAM)
Electro-optic modulators not only modulate the phase of theelectric field but also the po-larization. A polarizer following the modulator will transform the latter into amplitudemodulation. This amplitude modulation can be described as:
IRFAM = Io(1 + 2McosΩt) (29)
whereM is the amplitude modulation index, andIo is the intensity of the laser field throughthe modulator. Changes in the amplitude modulation will change the laser frequency by:
δν = HWHMδMm
≈40kHz√
Hz
δMm
(30)
wherem is the phase modulation index. Changes in the amplitude modulation index ofthe orderδM = 10−4 would generate frequency noise at the level of 40Hz/
√Hz. Figure 4
shows a graph of the measured RFAM generated frequency noisefor the two laser systems.
4.4 Electronic Noise in the Read Out System
The noise in the photo detectors is specified to be about 20pW/√
Hz or 16pA/√
Hz. Thetransimpedance of the photodetector of 700Ω transforms this to about 11nV/
√Hz. The
input-referred noise of the RF-Amplifier is also in this range. This has to be comparedwith the 4.7µV/Hz slope of the (non-amplified) errorsignal. Electronic noise in the RFpath should create frequency noise in the order of a few mHz/
√Hz, about three orders of
magnitude below the LISA requirements.Changes in the electronic offsets at the mixer output,Umixer, or the input of the first
amplifier,UDC, would change the laser frequency by
δν ≈ 40δUDC +δUmixer
[mV]
Hz√Hz
. (31)
11
Spectral densities of the voltage noise are usually not available in the LISA band. A roughestimate of the noise based on specifications for offset drifts indicate that this may be oneof our main noise sources. However, if this is the limiting noise source, the frequencyfluctuations should scale with the inverse gain of the RF-amplifier. This was not the case.
DC-offsets in the error signal can be caused by offsets in themixer output or offsetsin the first amplifier. These offsets will offset the laser frequency from the resonance fre-quency of the cavity by
∆ν =d fdV
∆U , (32)
or
∆ν ≈15HzmV
∆U first Laser, (33)
∆ν ≈43HzmV
∆U second Laser. (34)
Here we used the measured slopes of our error signals. Offsets in the order of a few milli-volts or a few 100 Hz are expected, but the fluctuations shouldbe well below 1mV/
√Hz.
Changes in the laser intensity will change the slope of the error signal and subsequently,the DC-offset induced frequency offset. In the preceding section, we derived a limit onthe relative intensity noise (RIN) of 3·10−2/
√Hz for our experiment. Such a RIN-level
would allow DC-offsets in the vicinity of a few hundred millivolts without sacrificing thefrequency stability of the laser.
4.5 Laser Fluctuations
A laser field has several degrees of freedom. Our stabilization system is aiming to stabilizethe frequency of the field. The other degrees of freedom are the polarization, the intensity,and the spatial mode or the propagation direction. Changes in the polarization will onlymanifest itself as changes in the intensity of the laser fieldand can be included in theearlier discussions. The detection scheme is only in secondorder sensitive to changesin the propagation direction or pointing of the laser beam. Pointing to frequency noisecoupling requires a static misalignment of the laser cavitywith respect to the laser beam.This has been discussed in many publications associated with ground based gravitationalwave detectors (see for example [13]).
The basic idea is that a misaligned cavity couples the fundamental and the first orderHermite-Gauss mode of the laser. Any first order mode contentin the laser beam willthen be transferred back into the fundamental mode at the misaligned cavity. The phaseof this contribution is different from the phase of the original fundamental mode insidethe cavity. This is equivalent to an apparent change in the round trip phase inside thecavity. The magnitude of the static misalignment can be approximated based on the onresonance visibility or the ratio between the transmitted intensities of the TEM00-modeand the TEM10-mode. A static tilt ofΘ = 10−5rad would reduce the visibility in the shortcavity by 20% and in the long cavity by 12%. Most of this light would be in the TEM10-mode. Most of the time the tilt should have been closer to the 10−6 rad level as the TEM10-mode is easy to reduce during the alignment and 10−5 rad can be considered an upper limitfor the static tilt during long data runs.
12
0.0001 0.001 0.01 0.1 1Fourier Frequency [Hz]
0.1
1
10
100
Poi
ntin
g [u
m/r
Hz]
FFT (Horizontal 20pt Avg.)FFT (Vertical 20pt Avg.)
Upper limit, most likely limited by Intensity fluctuations
Beam radius at measured position: 930um (nominal)
measured beam radius: Horizontal: 1mm, Vertical: 1.2mm
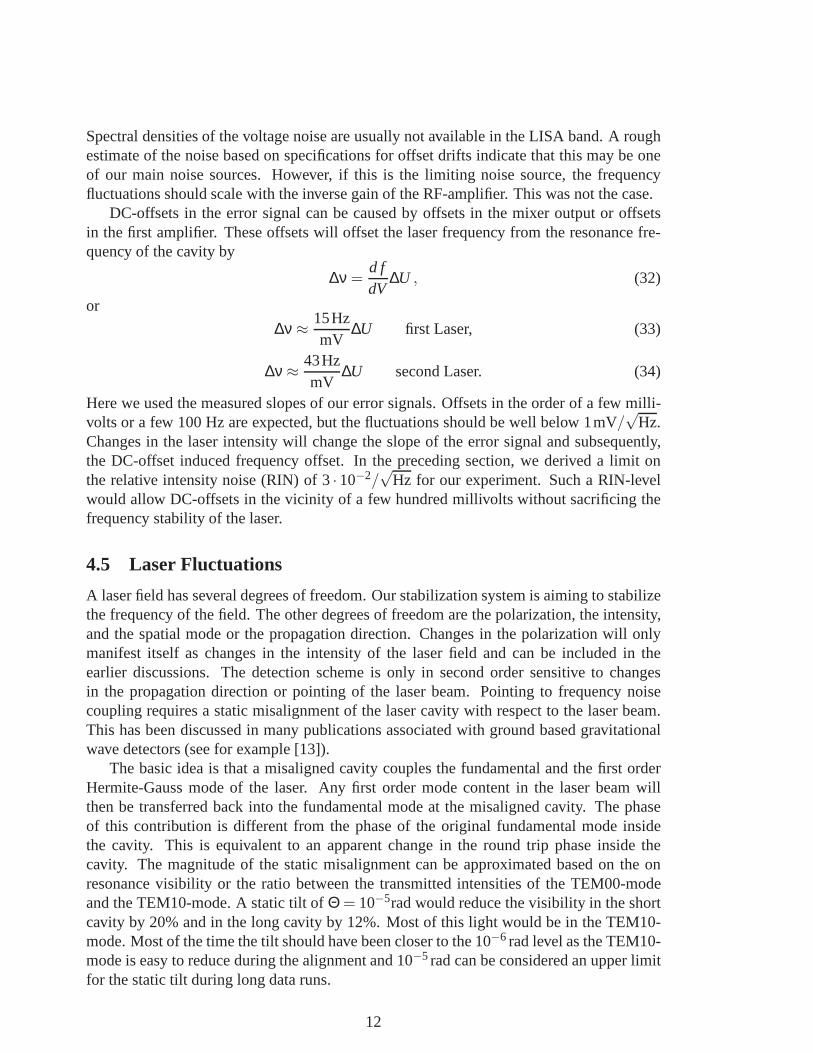
Figure 5: The measured pointing of the two laser beams is in the order of 0.01/√
Hz ofthe beam waist. This is equivalent to a relative amplitude ofthe 10-mode in the order of0.01/
√Hz of the fundamental mode.
The pointing to frequency noise coupling is then approximately:
δνPointing≈Θ
[10−5rad]·
a10
[0.1/√
Hz]·30
Hz√Hz
long cavity, (35)
δνPointing≈Θ
[10−5rad]·
a10
[0.1/√
Hz]·40
Hz√Hz
shortcavity. (36)
An amplitude of 0.1/√
Hz in the TEM10-mode (or intensity of 1%/√
Hz) due to pointingin the laser beam would cause frequency fluctuations of 30-40Hz/
√Hz if the cavity mis-
alignment is in the 10−5 rad range. The amplitude of the TEM10-mode is always withinthe 1% range (see Fig. 5) which indicates that pointing induced frequency fluctuations areabout an order of magnitude below LISA requirements.
4.5.1 Pointing at the Photo Detector
Pointing of the laser beam into the photo detector is anotherpossible coupling mechanismthrough which the frequency of the laser could change. It canchange the intensity depen-dent offsets caused by offset locks or RFAM (see above). Thisis identical to the frequencyfluctuations caused by intensity fluctuations of the laser itself except for the case whereintensity fluctuations change the temperature of the cavitymirrors.
5 Final Frequency Noise
5.1 The 30 Day Run
After installing all optical, vacuum, and electronic components (except for the RF-amplifier),we started a long data run. At that time, one of the lasers was already locked to its cavityfor a few days while we were still working on the feedback and alignment of the second
13
0 5e+05 1e+06 1.5e+06 2e+06 2.5e+06 3e+06Time [s]
-0.5
0
0.5
1
1.5
2
Bea
t Fre
quen
cy/R
oom
Tem
p./In
tens
ity [a
.u.] Refl. Intensity Asterix
Refl. Intensity ObelixBeat Frequency [10MHz]Room temperature (40000 pts average)
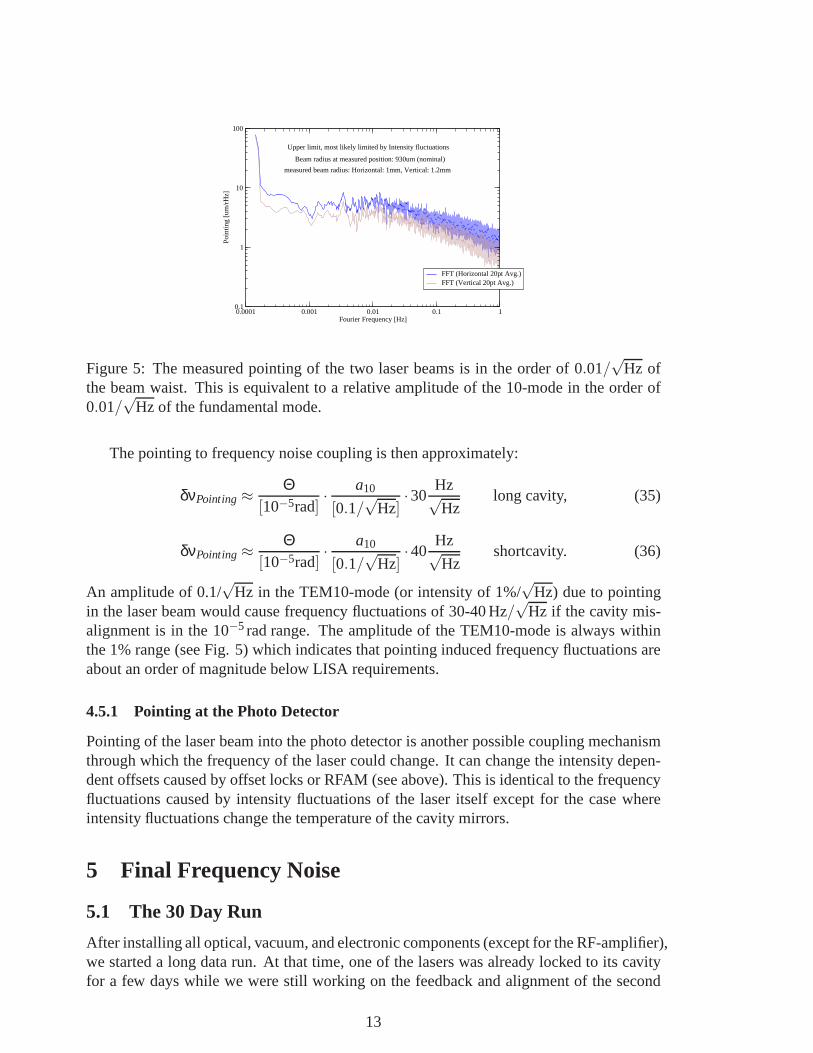
Figure 6: The time series of the frequency of the beat signal,the room temperature, andthe reflected intensities are shown. The correlation between frequency and temperaturechanges is obvious.
laser. It can be assumed that the first cavity was in thermal equilibrium when we started themeasurement. The time series is shown in Fig. 6. We lost locktwice during the first twodays for a few minutes while we were still working around the optical table. The reason forthe following increase in the beat signal frequency and the oscillations with 4 day periodcan be correlated to the room temperature. Changes in the room temperature change thebeat frequency with a delay of about 140000 s or 1.7 days. The reflected intensity, which isa measure of the visibility or alignment is also changing over time.
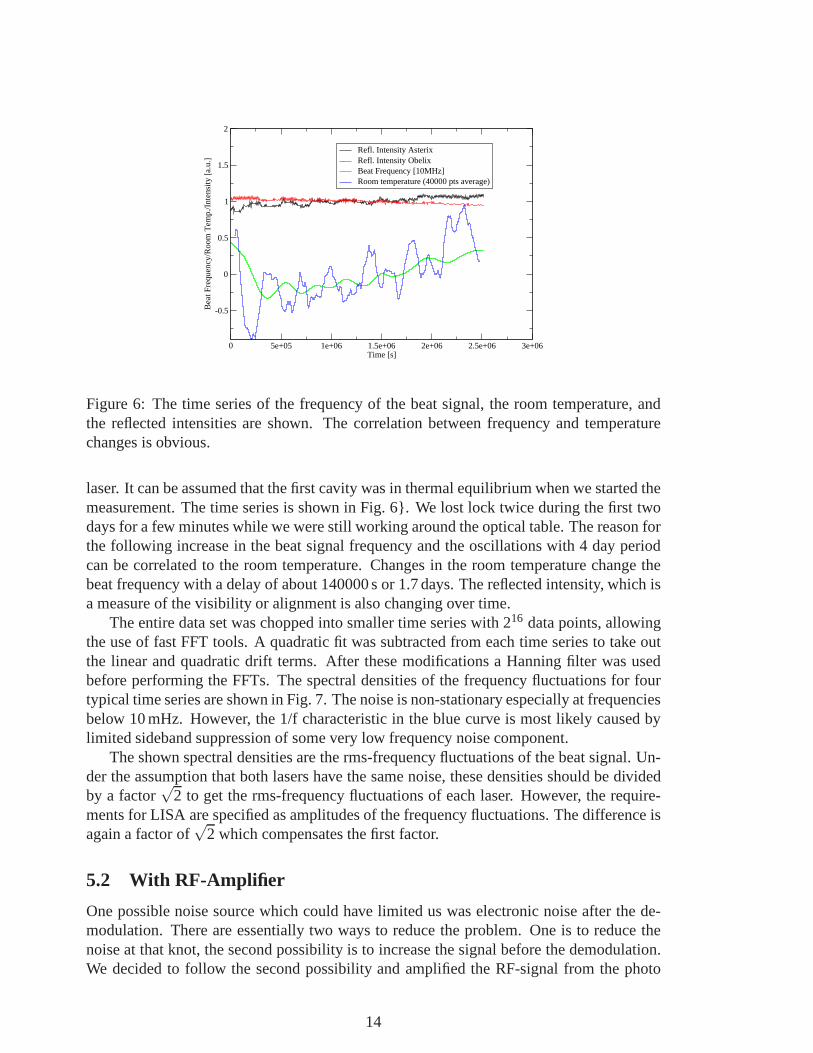
The entire data set was chopped into smaller time series with216 data points, allowingthe use of fast FFT tools. A quadratic fit was subtracted from each time series to take outthe linear and quadratic drift terms. After these modifications a Hanning filter was usedbefore performing the FFTs. The spectral densities of the frequency fluctuations for fourtypical time series are shown in Fig. 7. The noise is non-stationary especially at frequenciesbelow 10 mHz. However, the 1/f characteristic in the blue curve is most likely caused bylimited sideband suppression of some very low frequency noise component.
The shown spectral densities are the rms-frequency fluctuations of the beat signal. Un-der the assumption that both lasers have the same noise, these densities should be dividedby a factor
√2 to get the rms-frequency fluctuations of each laser. However, the require-
ments for LISA are specified as amplitudes of the frequency fluctuations. The difference isagain a factor of
√2 which compensates the first factor.
5.2 With RF-Amplifier
One possible noise source which could have limited us was electronic noise after the de-modulation. There are essentially two ways to reduce the problem. One is to reduce thenoise at that knot, the second possibility is to increase thesignal before the demodulation.We decided to follow the second possibility and amplified theRF-signal from the photo
14
0.0001 0.001 0.01 0.1
Fourier Frequency [Hz]
10
100
1000
10000
Fre
quen
cy N
oise
[Hz/
sqrt
Hz]
0.0001 0.001 0.01 0.1
Requirements
3e+05 4e+05 5e+05 6e+05 7e+05 8e+05 9e+05Time [s]
7.85e+07
7.9e+07
7.95e+07
8e+07
8.05e+07
Bea
t Fre
quen
cy [H
z]
Figure 7: The frequency noise for various parts of the 30 day data run (upper graph) andthe time series (lower graph).
0.001 0.01 0.1Fourier Frequency [Hz]
1 1
10 10
100 100
1000 1000
10000 10000
1e+05 1e+05
Fre
quen
cy N
oise
[Hz/
rHz]
Frequency noise20pt Avg.Reference Cavity Req.Material Stability Req.
Length Changes [fm
/rHz]
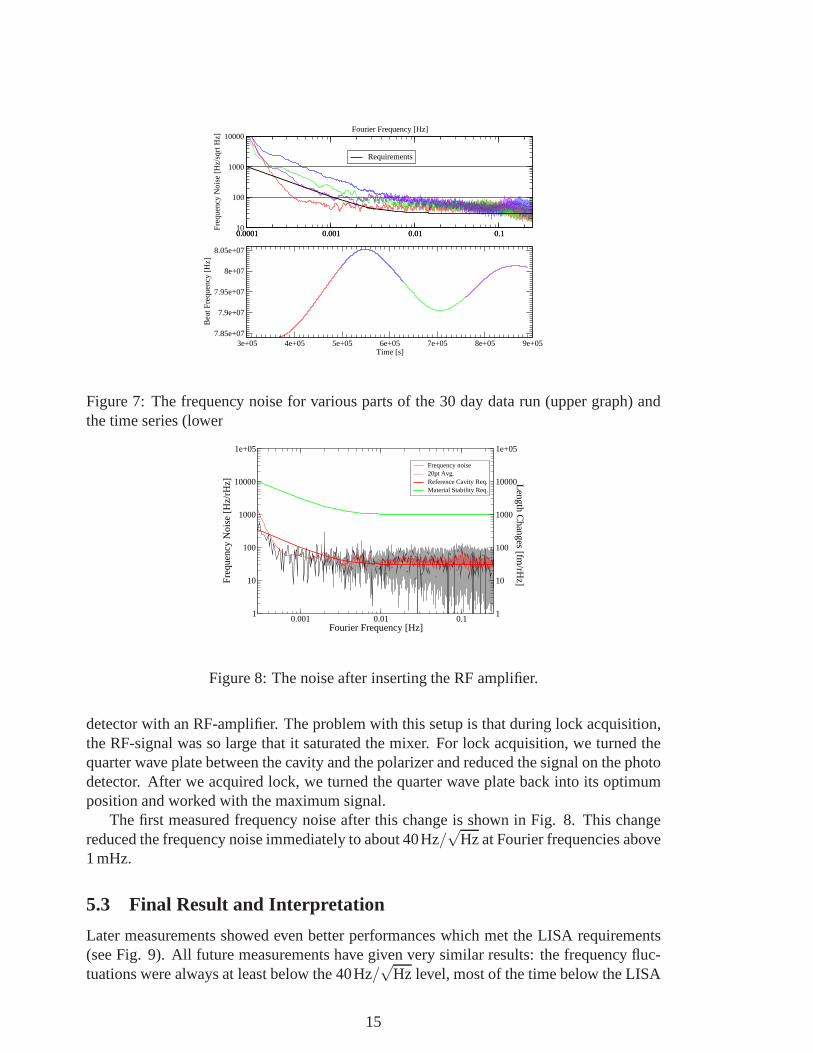
Figure 8: The noise after inserting the RF amplifier.
detector with an RF-amplifier. The problem with this setup isthat during lock acquisition,the RF-signal was so large that it saturated the mixer. For lock acquisition, we turned thequarter wave plate between the cavity and the polarizer and reduced the signal on the photodetector. After we acquired lock, we turned the quarter waveplate back into its optimumposition and worked with the maximum signal.
The first measured frequency noise after this change is shownin Fig. 8. This changereduced the frequency noise immediately to about 40Hz/
√Hz at Fourier frequencies above
1 mHz.
5.3 Final Result and Interpretation
Later measurements showed even better performances which met the LISA requirements(see Fig. 9). All future measurements have given very similar results: the frequency fluc-tuations were always at least below the 40Hz/
√Hz level, most of the time below the LISA
15
0.0001 0.001 0.01 0.1Frequency [Hz]
1
10
100
1000
10000
1e+05
PS
D o
f fre
quen
cy fl
uctu
atio
ns [H
z/rH
z]
PSD of detrended data20pt running averageTelescope Stability Req.Reference Cavity Req.
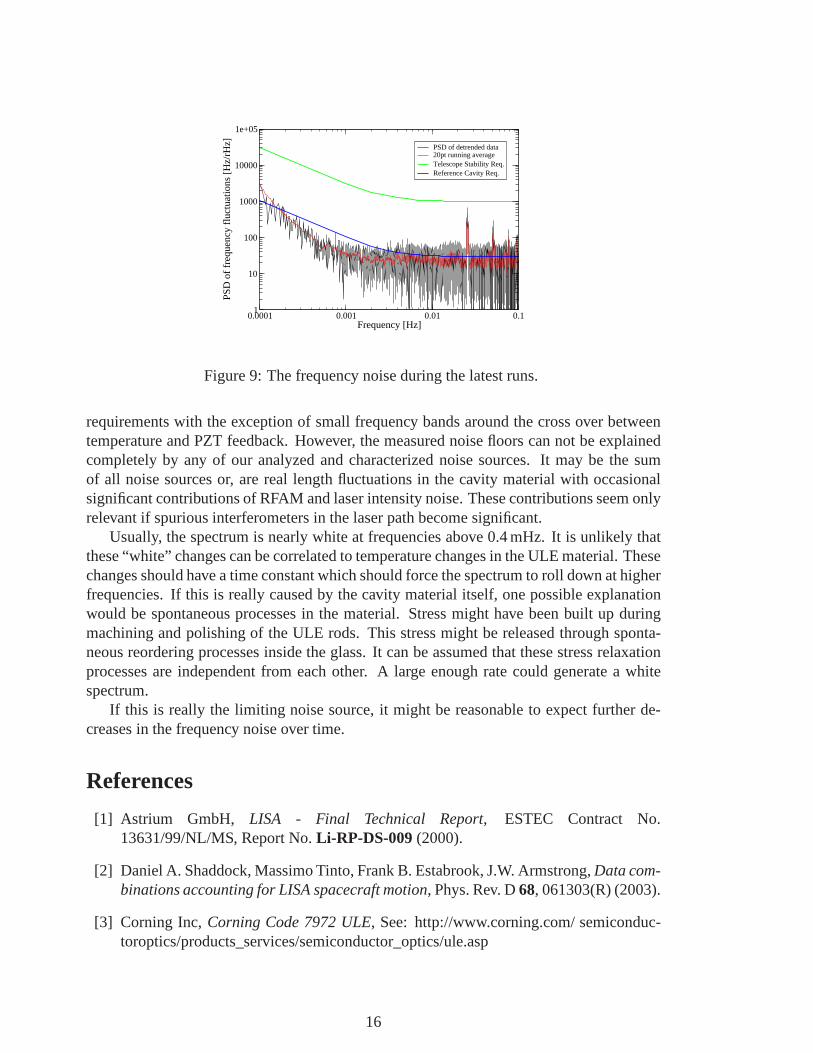
Figure 9: The frequency noise during the latest runs.
requirements with the exception of small frequency bands around the cross over betweentemperature and PZT feedback. However, the measured noise floors can not be explainedcompletely by any of our analyzed and characterized noise sources. It may be the sumof all noise sources or, are real length fluctuations in the cavity material with occasionalsignificant contributions of RFAM and laser intensity noise. These contributions seem onlyrelevant if spurious interferometers in the laser path become significant.
Usually, the spectrum is nearly white at frequencies above 0.4 mHz. It is unlikely thatthese “white” changes can be correlated to temperature changes in the ULE material. Thesechanges should have a time constant which should force the spectrum to roll down at higherfrequencies. If this is really caused by the cavity materialitself, one possible explanationwould be spontaneous processes in the material. Stress might have been built up duringmachining and polishing of the ULE rods. This stress might bereleased through sponta-neous reordering processes inside the glass. It can be assumed that these stress relaxationprocesses are independent from each other. A large enough rate could generate a whitespectrum.
If this is really the limiting noise source, it might be reasonable to expect further de-creases in the frequency noise over time.
References
[1] Astrium GmbH, LISA - Final Technical Report, ESTEC Contract No.13631/99/NL/MS, Report No.Li-RP-DS-009(2000).
[2] Daniel A. Shaddock, Massimo Tinto, Frank B. Estabrook, J.W. Armstrong, Data com-binations accounting for LISA spacecraft motion, Phys. Rev. D68, 061303(R) (2003).
[3] Corning Inc,Corning Code 7972 ULE, See: http://www.corning.com/ semiconduc-toroptics/products_services/semiconductor_optics/ule.asp
16
[4] Schott AG,Zerodur,See: http://www.us.schott.com/optics_devices/english/products/zerodur/
[5] Ohara Inc, Clearceram-Z, See: http://www.ohara-inc.co.jp/b/b02/b0210_cz/b0210.htm
[6] R.W.P. Drever, J.L. Hall, F.V. Kowalski, J. Hough, G.M. Ford, A.J. Munley, Laserphase and frequency stabilisation using optical resonatorAppl. Phys. B, 31, (1983).
[7] Many publications deal with this subject. Optical cavities are discussed for examplein Miao Zhu, John L. Hall, Short and Long Term Stability of Optical Oscillators,IEEE Frequency Control Symposium, pp. 44-55 (1992). Iodine-stabilized lasers arediscussed in A.Yu Nevsky et al., Frequency comparison and absolute frequency mea-surement ofI2-stabilized lasers at 532nm,Opt. Comm.192(2001) 263-272.
[8] A.E. SiegmanLasersUniversity Science Books, Mill Valley (1986).
[9] A. Schenzle, R.G. DeVoe, R.G. Brever, Phase-modulationlaser spectroscopy,Phys.Rev. A, 25, 2606 (1981).
[10] B. Slagmolen, D. Shaddock, M. Gray, D. McClelland, Frequency Stability od SpatialMode Interference (Tilt) Locking,IEEE J. of Quantum Electronics, 38, 11, (2002).
[11] Gwo, D.-H.,Ultra precision and reliable bonding method.United States Patent No.US 6284085 B1 (2001).
[12] W. Winkler, K. Danzmann, A. Rüdiger, R. Schilling, Heating by optical asbsorptionand performance of interferometris gravitational wave detectors,Physical Review A,44, 11 (1991)
[13] Y. Hefetz, N. Mavalvala, D. Sigg,Principles of calculating alignment signals incomplex resonant optical interferometers, LIGO-T960024-A-D (1996). See alsoDaniel Siggs papers: The Modal Model available in the LIGO document center:www.ligo.caltech.edu.
17
REPORT DOCUMENTATION PAGE Form Approved OMB No. 0704-0188
The public reporting burden for this collection of information is estimated to average 1 hour per response, including the time for reviewing instructions, searching existingdata sources, gathering and maintaining the data needed, and completing and reviewing the collection of information. Send comments regarding this burden estimate or any other aspect of this collection of information, including suggestions for reducing this burden, to Department of Defense, Washington Headquarters Services, Directorate for Information Operations and Reports (0704-0188), 1215 Jefferson Davis Highway, Suite 1204, Arlington, VA 22202-4302. Respondents should be aware that notwithstanding any other provision of law, no person shall be subject to any penalty for failing to comply with a collection of information if it does not display a currently valid OMB control number. PLEASE DO NOT RETURN YOUR FORM TO THE ABOVE ADDRESS. 1. REPORT DATE (DD-MM-YYYY) 2. REPORT TYPE 3. DATES COVERED (From - To)
4. TITLE AND SUBTITLE 5a. CONTRACT NUMBER
5b. GRANT NUMBER
5c. PROGRAM ELEMENT NUMBER
6. AUTHOR(S) 5d. PROJECT NUMBER
5e. TASK NUMBER
5f. WORK UNIT NUMBER
7. PERFORMING ORGANIZATION NAME(S) AND ADDRESS(ES) 8. PERFORMING ORGANIZATION REPORT NUMBER
9. SPONSORING/MONITORING AGENCY NAME(S) AND ADDRESS(ES) 10. SPONSORING/MONITOR'S ACRONYM(S)
11. SPONSORING/MONITORINGREPORT NUMBER
12. DISTRIBUTION/AVAILABILITY STATEMENT
13. SUPPLEMENTARY NOTES
14. ABSTRACT
15. SUBJECT TERMS
16. SECURITY CLASSIFICATION OF: 17. LIMITATION OF ABSTRACT
18. NUMBER OF PAGES
19b. NAME OF RESPONSIBLE PERSON
a. REPORT b. ABSTRACT c. THIS PAGE 19b. TELEPHONE NUMBER (Include area code)
Standard Form 298 (Rev. 8-98)Prescribed by ANSI Std. Z39-18