Embed Size (px)
Citation preview

Discussion
Paper
|D
iscussionP
aper|
Discussion
Paper
|D
iscussionP
aper|
Ocean Sci. Discuss., 10, 1031–1065, 2013www.ocean-sci-discuss.net/10/1031/2013/doi:10.5194/osd-10-1031-2013© Author(s) 2013. CC Attribution 3.0 License.
EGU Journal Logos (RGB)
Advances in Geosciences
Open A
ccess
Natural Hazards and Earth System
Sciences
Open A
ccess
Annales Geophysicae
Open A
ccess
Nonlinear Processes in Geophysics
Open A
ccess
Atmospheric Chemistry
and Physics
Open A
ccess
Atmospheric Chemistry
and Physics
Open A
ccess
Discussions
Atmospheric Measurement
Techniques
Open A
ccess
Atmospheric Measurement
Techniques
Open A
ccess
Discussions
Biogeosciences
Open A
ccess
Open A
ccess
BiogeosciencesDiscussions
Climate of the Past
Open A
ccess
Open A
ccess
Climate of the Past
Discussions
Earth System Dynamics
Open A
ccess
Open A
ccess
Earth System Dynamics
Discussions
GeoscientificInstrumentation
Methods andData Systems
Open A
ccess
GeoscientificInstrumentation
Methods andData Systems
Open A
ccess
Discussions
GeoscientificModel Development
Open A
ccess
Open A
ccess
GeoscientificModel Development
Discussions
Hydrology and Earth System
Sciences
Open A
ccess
Hydrology and Earth System
Sciences
Open A
ccess
Discussions
Ocean Science
Open A
ccess
Open A
ccess
Ocean ScienceDiscussions
Solid Earth
Open A
ccess
Open A
ccess
Solid EarthDiscussions
The Cryosphere
Open A
ccess
Open A
ccessThe Cryosphere
Discussions
Natural Hazards and Earth System
Sciences
Open A
ccess
Discussions
This discussion paper is/has been under review for the journal Ocean Science (OS).Please refer to the corresponding final paper in OS if available.
Equilibrator-based measurements ofdissolved nitrous oxide in the surfaceocean using an integrated cavity outputlaser absorption spectrometerI. Grefe and J. Kaiser
School of Environmental Sciences, University of East Anglia, Norwich Research Park,Norwich, UK
Received: 28 May 2013 – Accepted: 10 June 2013 – Published: 3 July 2013
Correspondence to: J. Kaiser ([email protected])
Published by Copernicus Publications on behalf of the European Geosciences Union.
1031
Discussion
Paper
|D
iscussionP
aper|
Discussion
Paper
|D
iscussionP
aper|
Abstract
A laser-based analyser for nitrous oxide, carbon monoxide and water vapour was cou-pled to an equilibrator for continuous high-resolution dissolved gas measurements inthe surface ocean. Results for nitrous oxide measurements from laboratory tests andfield deployments are presented here. Short-term precision for 10 s-average N2O mole5
fractions at an acquisition rate of 1 Hz was better than 0.2 nmolmol−1 for standardgases and equilibrator measurements. The same precision was achieved for replicatestandard gas analyses within 1 h of each other. The accuracy of the equilibrator mea-surements was verified by comparison with purge-and-trap GC-MS measurements ofN2O concentrations in discrete samples from the Southern Ocean and showed agree-10
ment to within the 2 % measurement uncertainty of the GC-MS method. Measuredatmospheric N2O mole fractions agreed with AGAGE values to within 0.4 %. The equi-librator response time to concentration changes in water was 142 to 203 s, dependingon the headspace flow rate. The system was tested at sea during a north-to-south tran-sect of the Atlantic Ocean. While the subtropical gyres were slightly undersaturated,15
the equatorial region was a source of nitrous oxide to the atmosphere. The ability tomeasure at high temporal and spatial resolution revealed sub-mesoscale variability indissolved N2O concentrations. The magnitude of the observed saturation is in agree-ment with published data. Mean sea-to-air fluxes in the tropical and subtropical Atlanticranged between −1.6 and 0.11 µmolm−2 d−1 and confirm that the subtropical Atlantic is20
not an important source region for N2O to the atmosphere, compared to average globalfluxes of 0.6 to 2.4 µmolm−2 d−1. The system can be easily modified for autonomousoperation on voluntary observing ships (VOS). Further work should include an inter-laboratory comparison exercise with other methods of dissolved N2O analyses.
1032

Discussion
Paper
|D
iscussionP
aper|
Discussion
Paper
|D
iscussionP
aper|
1 Introduction
Nitrous oxide (N2O) is an important trace gas in the atmosphere, influencing earth’sclimate as well as stratospheric chemistry. It is currently the third most important green-house gas in terms of 100 a global warming potential after CO2 and CH4 (Ravishankaraet al., 2009). Furthermore, it is the main precursor of stratospheric NOx, which catalyt-5
ically destroys ozone (Crutzen, 1970). As CFCs are phased out under the MontrealProtocol, N2O is the most important, currently emitted substance involved in strato-spheric ozone depletion (Ravishankara et al., 2009). Atmospheric concentrations arerising at a rate of 0.26 %a−1 with the ocean contributing about 30 % to total emis-sions (Forster et al., 2007). Bacterial nitrification and denitrification are assumed to10
be the main production pathways for N2O in the ocean, while denitrification can alsoact as a sink under suboxic conditions (Elkins et al., 1978; Cohen and Gordon, 1978;Knowles, 1982). Even though nitrification is an aerobic process, N2O production is en-hanced as oxygen concentrations decrease (Goreau et al., 1980; Yoshida et al., 1989;Yoshinari, 1976). Nitrifier-denitrification is an alternative pathway for N2O production by15
ammonia oxidising bacteria, which appears to be important for the near-surface N2Osource (Poth and Focht, 1985; Popp et al., 2002; Sutka et al., 2004, 2006). Recently,the importance of N2O production by archaeal ammonia oxidation was discovered, po-tentially accounting for a significant part of the oceanic N2O source (Loscher et al.,2012; Wuchter et al., 2006). The estimated source of rivers and coastal regions range20
currently from 0.5 to 2.7 Tga−1 (in N equivalents) and from 1.8 to 5.8 Tga−1 for theopen ocean (Denman et al., 2007). In the light of the uncertainties in the marine N2Osource and potential future emission increases due to ocean deoxygenation (Codispoti,2010), accurate observations in space and time are important to give a better estimateof regional sources and global budgets.25
The most common technique for N2O concentration measurements is injection ofa gas sample onto a gas chromatographic column coupled to an electron capture de-tector (GC-ECD) (Weiss et al., 1992; Butler et al., 1989). Here we present an alternative
1033
Discussion
Paper
|D
iscussionP
aper|
Discussion
Paper
|D
iscussionP
aper|
method using a laser-based optical absorption analyser (Baer et al., 2002) that in com-bination with an equilibrator enables continuous N2O analyses at ambient levels in sea-water. The system is low-maintenance, can be easily calibrated and allows for highermeasurement frequency than GC-ECD methods. It has the potential to facilitate obser-vations over long time series, revealing variability and trends, as is already happening5
for CO2 measurement systems, e.g. on ships of opportunity. Laboratory tests and re-sults from field deployments of the analyser in combination with an equilibrator arepresented.
2 Materials and methods
2.1 Laboratory tests10
The N2O/CO analyser (Los Gatos Research, LGR, model N2O/CO-23d), used in thisstudy, measures mole fractions of N2O, carbon monoxide (CO) and water vapour (H2O)using off-axis integrated cavity output spectroscopy (ICOS). Test results and environ-mental data for N2O are reported in this study. The analyser was connected to a 1.7 Lpercolating packed glass bed equilibrator as described by Cooper et al. (1998). The15
analyser’s internal membrane pump was used to circulate the gas phase through theequilibrator. Water was pumped through the equilibrator at a flow rate of 1.8 Lmin−1.Two 4-port 2-position valves (Vici) allowed for fast switching between the equilibratorheadspace and a 6-port multi-position valve (Vici), connecting to other gas lines e.g.atmospheric air and references (Fig. 1). A similar setup has been described by Gulzow20
et al. (2011) for dissolved CO2 and CH4 measurements using an ICOS analyser andby Becker et al. (2012) for measurements of ffi13C(CO2) and fCO2 using continuouswave cavity ringdown spectroscopy.
A water trap was installed downstream of the equilibrator to reduce the amount ofwater vapour in the headspace gas. The trap consisted of a thermoelectric cool box25
(T08 DC, Mobicool), held at 5 ◦C, and a miniature filter with manual drain (Norgren)
1034

Discussion
Paper
|D
iscussionP
aper|
Discussion
Paper
|D
iscussionP
aper|
to collect the condensing water. A custom-built safety valve (“water guard”) was in-stalled upstream of the analyser as an additional protection against water entering themeasurement cell. The water guard consists of a stainless steel tee (Swagelok) withelectrodes and a solenoid valve downstream of the sensor. Water in the gas line closesthe electric circuit in the water guard, triggering the closure of the valve and cutting off5
the gas supply to the analyser. This is really just a safety precaution as the “water-guard” was neither triggered during the laboratory tests, nor at sea. The instrument’swater vapour measurements are used by the software to calculate N2O dry mole frac-tions (Eq. 1). x(N2O) is the N2O dry mole fraction, xmeas(N2O) and xmeas(H2O) are themeasured N2O and H2O mole fractions:10
x(N2O) =xmeas(N2O)
1−xmeas(H2O)(1)
Furthermore, line broadening due to changing water vapour concentrations is ac-counted for by the instrument’s software. In order to validate this water vapour cor-rection, measurements of dry air were compared to calculated values for the dry molefraction of humidified air. A cylinder with dry air was connected to the analyser via the15
multi-position valve. The gas line from the cylinder was split with one line going directlyto the valve and the other one passing first through the water-filled cold trap to humidifythe air. H2O mole fractions were between 1 and 1.4 % for the humidified gas and belowthe analyser’s detection limit (around 0.2 % for H2O) for dry gas. The calculated drymole fraction of the humidified gas was compared to that of the dry gas.20
In addition, to test for analyser variability and drift, dry cylinder gas was measured for24 h. To test for leaks within the analyser, laboratory air (325 nmolmol−1 dry mole frac-tion, uncalibrated) and zero grade air (O2 and N2, 84 nmolmol−1 N2O dry mole fractionuncalibrated, BOC) were mixed in a sample loop to obtain lower mole fractions thanin ambient air. The mixtures with 215.1 nmolmol−1 N2O were re-circulated through the25
analyser for 12 and 21 min. Any leaks are expected to be noticed as an increase inN2O mole fractions caused by ambient air. The valve board was leak-checked sepa-rately by pressurising the gas lines of the equilibrator loop with compressed air to just
1035
Discussion
Paper
|D
iscussionP
aper|
Discussion
Paper
|D
iscussionP
aper|
below 120 kPa. The equilibrator itself was bypassed as it would vent to the atmospherethrough the pressure vent and the flow-through water line. As the LGR analyser keepsthe pressure in the measurement cell constant at 100 kPa, a Licor CO2 instrument withbuilt-in pressure gauge was used instead for monitoring pressure changes over time.
The response time of the coupled system of ICOS analyser and equilibrator was5
characterised in further laboratory tests. The equilibrator time constant τ, i.e. the timeduring which a concentration difference between the gas- and the water phase declinesto 1/e (36.8 %) with regard to the start value, was determined as described in Gulzowet al. (2011). τ was only evaluated for N2O as CO background concentrations were toovariable in the laboratory where tests took place. Two 100 L reservoirs, open to the at-10
mosphere, were filled with fresh water from the mains, which is supersaturated in N2O.Mole fractions between 694 and 1065 nmolmol−1 were measured in the equilibratorheadspace during five experiments with supersaturated water. One of the reservoirswas then equilibrated with ambient air by re-circulation; the other was kept at elevatedN2O concentrations. For the experiments, the water was pumped through the equili-15
brator from the bottom of the reservoirs at a flow rate of 1.8 Lmin−1, starting with theequilibrated reservoir, and then changing to water with high N2O concentrations. Af-ter the measured dry mole fraction reached a plateau (xmax), water in equilibrium withambient air was pumped through the equilibrator. τ was then calculated as describedin Gulzow et al. (2011), recording the decay of N2O dry mole fractions (xt) back to20
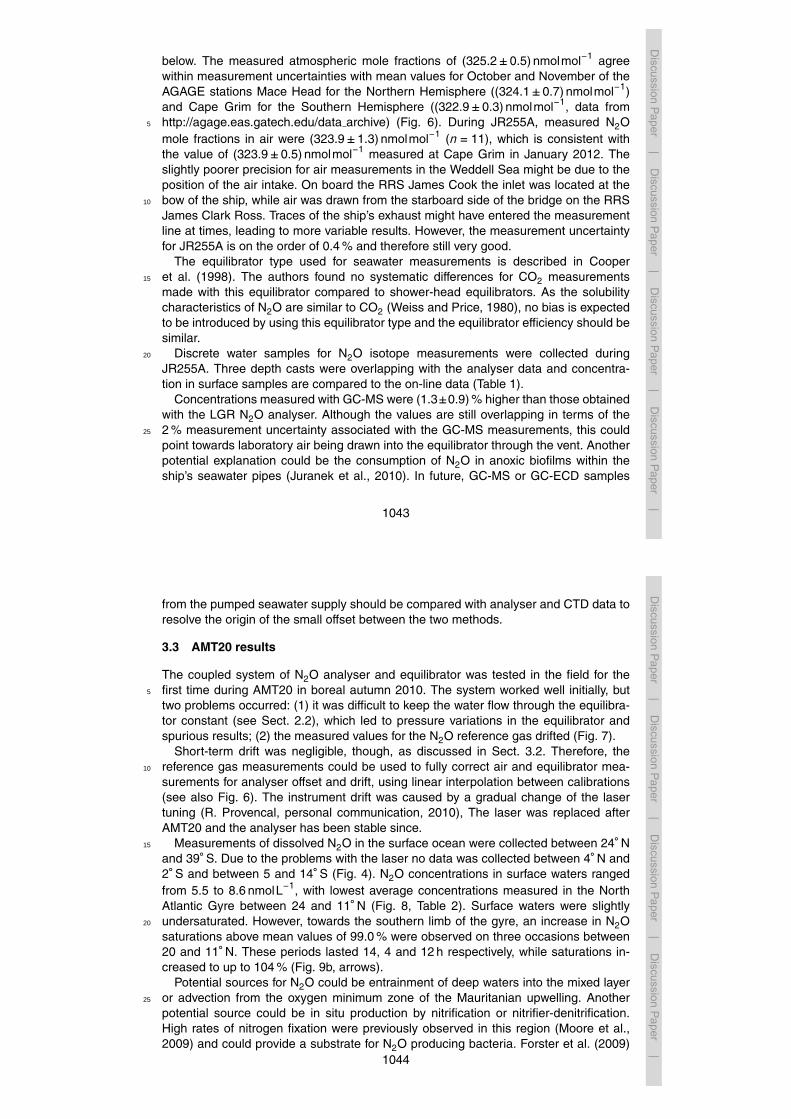
ambient values (xmin). The observed xt values (Fig. 2) were fitted to an exponentialequation:
xt = xmin + (xmax −xmin)e−tτ (2)
By rearranging Eq. (2), τ can be inferred from the slope of − ln[(xt−xmin)/(xmax−xmin)]over time.25
Initially, it was attempted to use the analyser in combination with a semi-permeablemembrane (Membrana, MiniModule). For this purpose, the gas flow through the cavitywas reduced to 100 mLmin−1 (293 K, 100 kPa) by inserting a needle valve between
1036

Discussion
Paper
|D
iscussionP
aper|
Discussion
Paper
|D
iscussionP
aper|
the internal diaphragm pump and a check valve downstream the measurement cell.The yield of dissolved gases extracted over the membrane was too low to sustainthe analyser’s operating pressure in the measurement cell. Therefore, an equilibratorwas used instead of the semi-permeable membrane. As the reduced gas flow did notlead to problems with the equilibrator setup, the valve was retained during the first5
field test (see Sect. 2.2). Without the throttle valve, the flow rate increased to approx-imately 400 mLmin−1 (293 K, 100 kPa). The time constant τ was determined for bothheadspace flow rates.
2.2 Field deployment
The N2O analyser was tested at sea during cruise AMT20 of the Atlantic Merid-10
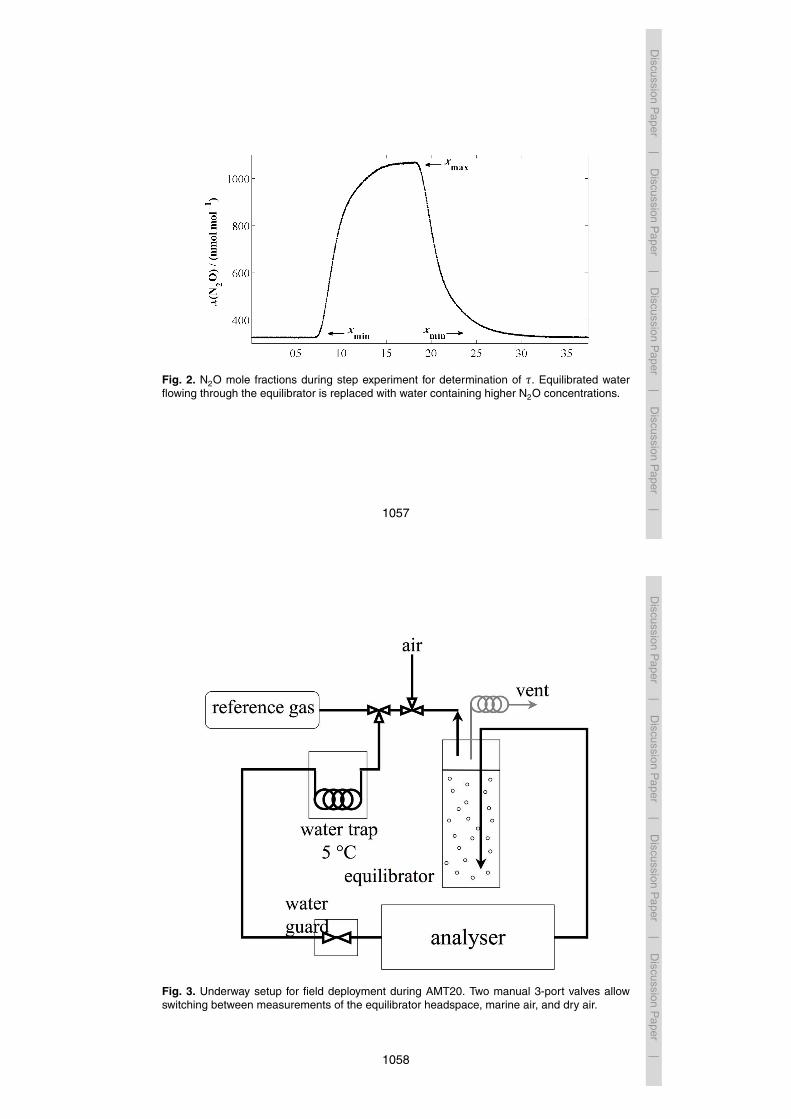
ional Transect project from Southampton, UK to Punta Arenas, Chile (12 October to25 November 2010) on board RRS James Cook. Figure 3 shows the setup for under-way measurements during the cruise, Fig. 4 the cruise track.
The equilibrator was connected to the ship’s pumped underway seawater supply,drawing water from a depth of approximately 5 m. Filters (Vacu-guard, part number15
6722-5000, Wheaton) were inserted at the gas in- and outlets of the equilibrator toprotect pump and measurement cell of the analyser from seawater. Temperatures inthe equilibrator were measured with two calibrated Pt-100 temperature probes (OmegaEngineering Limited) at a precision of better than 0.1 ◦C. The water flow through theequilibrator was set to approximately 1.8 Lmin−1 at the tap regulator but was not stable20
over time and had to be re-adjusted regularly. Changes in the flow could be due tovibration of the ship changing the setting of the regulator on the tap, as well as thevarying demand of seawater in other labs on board. For subsequent field deployments,a flow restrictor will be used to stabilise the pumped seawater supply to the equilibrator.Two three-way valves (part number SS-41GXS2, Swagelok) allowed changing between25
sample gas stream from the equilibrator and marine air, drawn from the ship’s bow(Fig. 3). Dried air with 323.7 nmolmol−1 was used as a working reference, calibratedagainst IMECC/NOAA primary standards. Every 8 h, the analyser was calibrated by
1037
Discussion
Paper
|D
iscussionP
aper|
Discussion
Paper
|D
iscussionP
aper|
switching from equilibrator headspace to the reference gas and then marine air for20 min each. This was followed by another reference measurement after 40 min toassess short-time drift. Only the last 5 min of each measurement were analysed toallow for complete flushing of the measurement cell. Correspondingly, the first 15 minafter switching back to the equilibrator headspace or to air measurements were not5
used for evaluation.N2O concentrations (c) were calculated from dry mole fractions (x) using the solu-
bility function F at equilibrator temperature Teq (Weiss and Price, 1980):
c = xF (Teq,S)peq (3)
where Teq and peq are equilibrator temperature and pressure (assumed to be equal to10
ambient atmospheric pressure, pair at sea level and assuming 100 % relative humid-ity) and S is salinity. Seawater saturations (s) were based on equilibrium values formeasured atmospheric mole fractions xair and mole fractions in seawater, corrected fortemperature differences between equilibrator and seawater intake (Tin):
s =xF (Teq,S)
xairF (Tin,S)(4)15
The air-sea flux (Φ) was calculated from the gas transfer coefficient (kw ) and the dif-ference between N2O concentrations in seawater c and air equilibrium concentrations(cair):
Φ = kw (c−cair) = kw [c−xairF (Tin,S)pair] (5)
kw was calculated using the parameterisation of Nightingale (2000) and converted20
to units of md−1, where u is wind speed at 10 (Eq. 6). This relationship showsan intermediate dependence on wind speed compared to the other frequently usedparameterisations of Liss and Merlivat (1986) and Wanninkhof (1992). kw wasadjusted for N2O with the Schmidt number Sc calculated following Wanninkhof
1038

Discussion
Paper
|D
iscussionP
aper|
Discussion
Paper
|D
iscussionP
aper|
(1992). The wind speed was taken from the 6 hourly operational analysis datasetof the European Centre for Medium-Range Weather Forecasts and interpolatedto the time and position of the respective measurement (ECMWF, available fromhttp://badc.nerc.ac.uk/view/badc.nerc.ac.uk ATOM dataent ECMWF-OP).
kwmd−1
= 0.24
[0.222
(u
ms−1
)2
+0.333(
ums−1
)2](
Sc600
)−0.5
(6)5
Instantaneous values for kw and Φ were compared to those using 30 day-wind speed-weighted averages (Reuer et al., 2007). Differences between both estimates of sea-air exchange were small. In the following, we discuss only instantaneous fluxes forconsistency with previous studies of N2O air-sea exchange (Fig. 5).
In addition to the data from AMT20, we also present reference gas and atmospheric10
measurements, as well as a comparison with discrete samples from a subsequentcruise to the Weddell Sea on board RRS James Clark Ross from 20 January to 2February 2012 (JR255A) in Sect. 3.2. The majority of the sea surface measurementson this cruise will be discussed elsewhere, but we have included results from a com-parison of equilibrator-ICOS measurements with GC-MS data.15
2.3 GC-MS measurements
During AMT20, no discrete field measurements are available for comparison with theanalyser measurements. During a subsequent deployment of the equilibrator-ICOSsystem in the Weddell Sea, three CTD samples were collected and analysed for N2Oconcentrations using purge-and-trap Gas Chromatography-Isotope Ratio Mass Spec-20
trometry (GC-IRMS) measurements of surface CTD samples is compared to the anal-yser data.
CTD seawater samples for isotope analysis were collected in 500 mL (nominal value)serum bottles (Wheaton). Triplicate samples were taken immediately after recovery ofthe CTD and were allowed to overflow at least three times the bottle volume. Sam-25
ple bottles were closed with butyl stoppers and aluminium crimp seals and poisoned1039
Discussion
Paper
|D
iscussionP
aper|
Discussion
Paper
|D
iscussionP
aper|
with 1 mL saturated mercuric chloride solution. 1 mL of the sample was replaced withCP grade helium (BOC) to reduce the risk of leaks due to temperature driven volumechanges of the water during transport and storage. The setup of the GC-MS setup fol-lows McIlvin and Casciotti (2010). Samples are loaded manually; dissolved gases arequantitatively extracted with a helium purge stream and trapped with liquid nitrogen.5
Water vapour in the gas stream is removed with a Nafion dryer (Perma Pure), CO2 istrapped on Carbosorb (Merck). The sample is then injected into a continuous-flow GC-MS system. Late eluting substances are removed with a pre-column as described inRockmann et al. (2003) before N2O is separated from residual CO2 on the PoraPlot Qanalytical column. The sample enters the mass spectrometer (Thermo Scientific, MAT10
253) via an open split and is analysed for mass-to-charge ratios 44, 45 and 46, as wellas peak area. The N2O concentration in the sample can be calculated from the peakarea with a precision of 2 % and the sample volume, which is determined by sampleweight, water temperature and salinity, with a precision of 0.02 %. The overall preci-sion of 2 % is comparable to the 1.8 % concentration uncertainty achieved for GC-ECD15
measurements by Walter et al. (2006) and 2.6 % for GC-MS measurements by McIlvinand Casciotti (2010).
3 Results and discussion
3.1 Laboratory tests
To improve the precision of individual data points retained for further analysis, 10 s20
averages were calculated from measurements at 1 Hz. Since the headspace gas was incontact with the water phase in the equilibrator, water vapour concentrations were high.The cold trap only removed water to a dew point of 5 ◦C. Correction from measuredvalues to dry mole fractions is therefore required for the evaluation of dissolved N2Oconcentrations in seawater.25
1040

Discussion
Paper
|D
iscussionP
aper|
Discussion
Paper
|D
iscussionP
aper|
Compressed air directly from the cylinder had a measured N2O mole fraction of(332.7±0.2) nmolmol−1, while H2O mole fractions were below the detection limit of0.2 %. The measured N2O mole fraction in humidified air with 10.6 mmolmol−1 H2Owas (329.7±0.2) nmolmol−1. Since the H2O mole fraction in compressed air was belowthe detection limit of 0.2 %, we assume it to be in the range from 0 to 0.2 %. The5
corresponding dry mole fraction of compressed air is therefore (332.7+0.8−0.2) nmolmol−1,
where the error estimate in the positive direction corresponds to a H2O mole fraction of0.2 %, that in the negative direction corresponds to the statistical uncertainty and a H2Omole fraction of 0 %. The calculated dry mole fraction of humidified air was (333.1±0.2) nmolmol−1. This value is within measurement uncertainties of the corrected mole10
fraction of compressed air directly from the cylinder. The H2O vapour dilution correctionis considered to be sufficient; no further corrections for line broadening were applied.
The stability of the analyser at low N2O mole fractions was assessed by measuringa gas cylinder over 24 h. The standard deviation was 0.2 nmolmol−1 for a mean N2Omole fraction on 48.7 nmolmol−1. Minimum- and maximum values measured during15
this period were 48.2 and 49.4 nmolmol−1 respectively.The highest observed increase of N2O mole fractions during the two leak tests for
the LGR analyser was 0.024 nmolmol−1 min−1. The gas volume of the 400 mL mea-surements cell at a pressure of 100 kPa corresponds to 40 mL while the tubing of thecircular gas path for this test is assumed to be at atmospheric pressure, resulting in20
a volume of approximately 40 mL. The total gas volume during the test is therefore80 mL The leak rate was calculated as the increase in N2O concentrations, divided bythe difference between background N2O and circulating gas mixture and multiplied bythe total gas volume. The resulting leak rate for the N2O analyser used for re-circulatingair, e.g. through an equilibrator, is 0.017 mLmin−1 or 0.29×10⁻³ mLs−1. This leak rate25
is likely to be due to the pump head (on the order of 10−3 mLs−1, KNF Neuberger(UK) Ltd, personal communication, 2013). Pressure in the valve board was stable over10 min at 119 731±0.006 Pa as recorded by the Licor’s pressure gauge, indicating theabsence of leaks.
1041
Discussion
Paper
|D
iscussionP
aper|
Discussion
Paper
|D
iscussionP
aper|
The response time of the coupled analyser-equilibrator system to concentrationchanges in the water phase is described by the equilibration time constant τ. For a gasflow of 400 mLmin−1 through the measurement cell, τ equalled (142±1) s for N2O(n = 5). The 95 % relaxation time (= 3t) is therefore about 7 min. Reducing the gas flowto 100 mLmin−1 increased t to (203±1) s (n = 3). In the limit where the water flow rate5
is much higher than the gas exchange rate, the value for t depends on the transfercoefficient k (Rafelski et al., 2012). Presumably, at the higher gas flow rate enhancedturbulence increased the efficiency of gas transfer between water and gas. Therefore,the needle valve will be removed during future deployments to reduce delays in thesystem’s response to changing N2O concentrations in the environment.10
3.2 Precision and accuracy
Under field conditions during AMT20, the difference between two subsequent calibra-tion measurements, spaced 40 min apart, was on average 0.2 nmolmol−1 or better.Over the course of the field campaign, substantial long-term drift was encountered asdiscussed in Sect. 3.3. As this drift was due to a faulty laser and not the measurement15
system itself, it is not further discussed in this section. After the replacement of thelaser, the analyser was used during a research cruise in the Weddell Sea (JR255A).Three reference gases were used and precision for corrected dry mole fraction valuesover the length of the field campaign was 0.9 nmolmol−1 (0.3 %) or better for all threegases (n = 19).20
Measurements of atmospheric N2O mole fractions during AMT20 and JR255A wereused for comparison with data of selected Advanced Global Atmospheric Gases Ex-periment (AGAGE) stations (Prinn et al., 2000). Dry mole fractions were corrected forinstrument drift and offset with the calibration measurements. During AMT20, molefractions of N2O measured in marine background air were (323.2±0.5) nmolmol−1
25
throughout the cruise. An interhemispheric difference of slightly less than 1 nmolmol−1
was expected (Butler et al., 1989; Rhee et al., 2009), but did not show in the data.This small difference might have not been captured due to the analyser drift described
1042
Discussion
Paper
|D
iscussionP
aper|
Discussion
Paper
|D
iscussionP
aper|
below. The measured atmospheric mole fractions of (325.2±0.5) nmolmol−1 agreewithin measurement uncertainties with mean values for October and November of theAGAGE stations Mace Head for the Northern Hemisphere ((324.1±0.7) nmolmol−1)and Cape Grim for the Southern Hemisphere ((322.9±0.3) nmolmol−1, data fromhttp://agage.eas.gatech.edu/data archive) (Fig. 6). During JR255A, measured N2O5
mole fractions in air were (323.9±1.3) nmolmol−1 (n = 11), which is consistent withthe value of (323.9±0.5) nmolmol−1 measured at Cape Grim in January 2012. Theslightly poorer precision for air measurements in the Weddell Sea might be due to theposition of the air intake. On board the RRS James Cook the inlet was located at thebow of the ship, while air was drawn from the starboard side of the bridge on the RRS10
James Clark Ross. Traces of the ship’s exhaust might have entered the measurementline at times, leading to more variable results. However, the measurement uncertaintyfor JR255A is on the order of 0.4 % and therefore still very good.
The equilibrator type used for seawater measurements is described in Cooperet al. (1998). The authors found no systematic differences for CO2 measurements15
made with this equilibrator compared to shower-head equilibrators. As the solubilitycharacteristics of N2O are similar to CO2 (Weiss and Price, 1980), no bias is expectedto be introduced by using this equilibrator type and the equilibrator efficiency should besimilar.
Discrete water samples for N2O isotope measurements were collected during20
JR255A. Three depth casts were overlapping with the analyser data and concentra-tion in surface samples are compared to the on-line data (Table 1).
Concentrations measured with GC-MS were (1.3±0.9) % higher than those obtainedwith the LGR N2O analyser. Although the values are still overlapping in terms of the2 % measurement uncertainty associated with the GC-MS measurements, this could25
point towards laboratory air being drawn into the equilibrator through the vent. Anotherpotential explanation could be the consumption of N2O in anoxic biofilms within theship’s seawater pipes (Juranek et al., 2010). In future, GC-MS or GC-ECD samples
1043
Discussion
Paper
|D
iscussionP
aper|
Discussion
Paper
|D
iscussionP
aper|
from the pumped seawater supply should be compared with analyser and CTD data toresolve the origin of the small offset between the two methods.
3.3 AMT20 results
The coupled system of N2O analyser and equilibrator was tested in the field for thefirst time during AMT20 in boreal autumn 2010. The system worked well initially, but5
two problems occurred: (1) it was difficult to keep the water flow through the equilibra-tor constant (see Sect. 2.2), which led to pressure variations in the equilibrator andspurious results; (2) the measured values for the N2O reference gas drifted (Fig. 7).
Short-term drift was negligible, though, as discussed in Sect. 3.2. Therefore, thereference gas measurements could be used to fully correct air and equilibrator mea-10
surements for analyser offset and drift, using linear interpolation between calibrations(see also Fig. 6). The instrument drift was caused by a gradual change of the lasertuning (R. Provencal, personal communication, 2010), The laser was replaced afterAMT20 and the analyser has been stable since.
Measurements of dissolved N2O in the surface ocean were collected between 24◦ N15
and 39◦ S. Due to the problems with the laser no data was collected between 4◦ N and2◦ S and between 5 and 14◦ S (Fig. 4). N2O concentrations in surface waters rangedfrom 5.5 to 8.6 nmolL−1, with lowest average concentrations measured in the NorthAtlantic Gyre between 24 and 11◦ N (Fig. 8, Table 2). Surface waters were slightlyundersaturated. However, towards the southern limb of the gyre, an increase in N2O20
saturations above mean values of 99.0 % were observed on three occasions between20 and 11◦ N. These periods lasted 14, 4 and 12 h respectively, while saturations in-creased to up to 104 % (Fig. 9b, arrows).
Potential sources for N2O could be entrainment of deep waters into the mixed layeror advection from the oxygen minimum zone of the Mauritanian upwelling. Another25
potential source could be in situ production by nitrification or nitrifier-denitrification.High rates of nitrogen fixation were previously observed in this region (Moore et al.,2009) and could provide a substrate for N2O producing bacteria. Forster et al. (2009)
1044

Discussion
Paper
|D
iscussionP
aper|
Discussion
Paper
|D
iscussionP
aper|
found average saturations of 104 % during spring but 97 % saturation during autumnin the latitude band between 26 and 11◦ N, comparable to the 99 % mean saturationmeasured in autumn for this study. More data are needed to confirm whether there isa real seasonal trend towards lower N2O saturations in the North Atlantic Gyre duringboreal autumn.5
Highest saturations of up to 107 % were found close to the equator. However, aver-age saturations for the equatorial region between 11◦ N and 5◦ S were only 100.4 %.Surface saturations of 104–109 % on average were previously reported for this region(Walter et al., 2004; Forster et al., 2009; Oudot et al., 2002). Rhee et al. (2009) foundmaximum saturations of 110 % at the equator. Unfortunately, no data could be col-10
lected directly at the equator, due to analyser maintenance between 5◦ N and 2◦ S. Highsurface saturations can be expected due to equatorial upwelling of N2O-rich waters.N2O saturations of 99.3 % and the lowest N2O concentrations were measured between10.6–5.8◦ N and 27.5–31.5◦ W, associated with low salinities. Walter et al. (2004) ob-served similarly low saturations of about 100 % in this region and related it to a retroflec-15
tion of the North Brazil Current, advecting low-salinity Amazon plume waters into theNorth Equatorial Counter Current (NECC).
N2O concentrations increased south of 14◦ S and reached mean values of7.7 nmolL−1 between 25 and 39◦ S. While surface waters in the latitudinal band of14–25◦ S were on average in equilibrium with the atmosphere, saturations decreased20
south of 25◦ S (Fig. 9b) as water temperature decreased. Mean saturations between 14and 39◦ S were 99.7 %, similar to 101 % saturation observed in austral spring (Forsteret al., 2009; Rhee et al., 2009), while average saturations in austral autumn were higher(104 %, Forster et al., 2009) This was attributed to accumulated N2O production duringspring and summer.25
Eddies can bring thermocline waters with higher nutrient and N2O concentra-tions into the mixed layer (McGillicuddy et al., 2007). This might stimulate in situN2O production from remineralisation of additional biomass as well as increasethe mixed layer inventory simply due to mixing with deeper waters with higher
1045
Discussion
Paper
|D
iscussionP
aper|
Discussion
Paper
|D
iscussionP
aper|
N2O concentrations. Satellite altimeter products from Ssalto/Duacs (gridded sealevel anomalies, 1/3◦ ×1/3◦ grid, http://www.aviso.oceanobs.com/en/data/products/sea-surface-height-products/global.html) were used to trace eddies. No clear relation-ship between sea level anomalies (SLA) and saturations was observed in the north-ern gyre (Fig. 10). Between 28 and 36◦ S, however, higher N2O saturations seem to5
be associated with negative SLAs, while lower saturations occur with positive SLAs.This could point towards upwelling eddies, introducing waters with higher N2O concen-trations, possibly originating from the Benguela upwelling, to the South Atlantic gyreregion.
Generally, oligotrophic gyres are expected to be weak N2O sinks, especially in10
winter, due to thermal effects, with a potential for weak sources in summer whilecoastal and equatorial upwelling zones are sources of N2O (Nevison et al., 1995;Suntharalingam and Sarmiento, 2000). The gyres in both hemispheres were actingas sinks for atmospheric N2O at the time of the survey, due to slightly undersatu-rated surface waters (Fig. 9a). Average fluxes for the region between 24–11◦ N were15
(−0.14±0.31) µmolm−2 d−1 and (−0.16±0.33) µmolm−2 d−1 for 14–39◦ S (Table 2). Forcomparison, Forster et al. (2009) observed negative sea-to-air N2O fluxes between−0.02 and −0.04 µmolm−2 d−1 between 26 and 11◦ N during autumn, corresponding toweak N2O uptake. Fluxes in spring were positive. The southern gyre was found to bea source of N2O at all times. They pointed out, that emissions in spring were four times20
higher between 6–40◦ S than in autumn, rather due to varying N2O inventories in themixed layer than to changing wind speeds. This points towards remarkable inter-annualdifferences in the oceanic N2O source and, as shown in this study, also intra-annualvariation.
The equatorial region was a source of N2O to the atmosphere where high sur-25
face saturations coincided with relatively high wind speeds. The average flux was(0.53 µmolm−2 d−1 between 10◦ and 3◦ N, which is most likely an underestimation, dueto analyser downtime. Comparable values of 0.52 µmolm−2 d−1 for the latitudinal bandbetween 12–1.5◦ N (Walter et al., 2004). For latitudes between 11◦ N and 5◦ S, the
1046

Discussion
Paper
|D
iscussionP
aper|
Discussion
Paper
|D
iscussionP
aper|
Western Tropical Atlantic Longhurst province, emissions of (0.11±0.26) µmolm−2 d−1
were measured. For comparison, 0.16–0.33 µmolm−2 d−1, were previously reportedfrom the Atlantic Ocean during austral spring (Forster et al., 2009). There might beseasonal variability, as higher emissions were observed during austral autumn (1.17–2.13 µmolm−2 d−1, Forster et al., 2009).5
Generally, saturations reported here are within the lower range of previously pub-lished values for the tropical and subtropical Atlantic which might be due to N2O con-sumption in anoxic biofilms within the pumped seawater system as discussed above.
4 Summary and conclusions
Laboratory and field test showed that the Los Gatos N2O/CO analyser can be coupled10
with an equilibrator to reliably measure both, atmospheric and marine N2O concentra-tions. Small-scale changes of concentrations could be observed, giving a very detailedpicture of the marine N2O budget. This is important for monitoring environments thatare highly variable in space and time.
The system is virtually ready for deployment on platforms of opportunity as shown15
for a similar setup for methane and carbon dioxide measurements (Gulzow et al.,2011). It records high-resolution data while operation is low maintenance and can beeasily automated. This is an advantage to labour intensive discrete sampling tech-niques. Calibration can be automated and atmospheric and marine dissolved gasmeasurements can be analysed in alternation using the same instrument. The res-20
olution of the described system is good (relaxation time of 140 s for a headspace flowrate of 400 mLmin−1), but response times could be reduced further by increasing theheadspace flow, decreasing the headspace volume or, potentially, by decreasing theinstrument operating pressure and measurement cell volume. The instrument is pro-tected from water by a cold trap and a solenoid valve connected to a humidity detector.25
The cold trap currently requires manually draining every 2–3 days, but this could be au-tomated as for CO2 analysers. Another remaining operator-dependent task is cleaning
1047
Discussion
Paper
|D
iscussionP
aper|
Discussion
Paper
|D
iscussionP
aper|
of the seawater flow regulator, which could be avoided by using screens and pre-filters.However, this is a problem common to all equilibrator techniques. Measurements ofdepth profiles would require large sample sizes or a pumped CTD due to the relativelylong relaxation time of the equilibrator. For depth profiles, headspace sampling wouldtherefore be the preferred option.5
The laser drift experienced during AMT20 does not relate to the experimental setupand the instrument has been deployed successfully after laser replacement withoutfurther issues. Although no direct GC-ECD measurements were carried out duringAMT20, and only few overlapping GC-MS measurements during JR255A, saturationvalues from measurements with the analyser-equilibrator setup are comparable to pre-10
vious studies using gas chromatography and the agreement with atmospheric AGAGEmeasurements is excellent. Although more data points over a wider range of concen-trations comparing measurements of the N2O analyser to other methods would bedesirable, this small dataset gives a first indication that the analyser data and the ap-plied corrections result in realistic values for environmental measurements. Further15
data comparison with GC-ECD measurements in the laboratory and during field cam-paigns should be implemented in the future. Another interesting test would be compar-ing the performance of this coupled equilibrator-analyser setup with other equilibratortypes and laser-based N2O analysers of different manufacturers.
Acknowledgements. We would like to thank captain and crew of RRS James Cook and prin-20
cipal scientist Andy Rees for their support during AMT20, as well as BODC for underway seasurface data. Helpful discussions with Grant Forster and Sunke Schmidtko (UEA) are grate-fully acknowledged. We would also like to thank Doug Baer and Robert Provencal (Los GatosResearch) for support with the N2O/CO analyser and Dorothee Bakker for providing the equi-librator used in this study. Special thanks go to Gareth A. Lee for invaluable help with the25
laboratory experiments and fieldwork preparation. This study was supported by the EuropeanCommunity’s Seventh Framework Programme (FP7/2007-2013) under grant agreement num-ber 237890 (Marie Curie Initial Training Network “INTRAMIF”) and UK Natural EnvironmentResearch Council National Capability funding to Plymouth Marine Laboratory and the NationalOceanography Centre, Southampton. This is contribution number 222 of the AMT programme.30
1048

Discussion
Paper
|D
iscussionP
aper|
Discussion
Paper
|D
iscussionP
aper|
References
Baer, D. S., Paul, J. B., Gupta, M., and O’Keefe, A.: Sensitive absorption measurements inthe near-infrared region using off-axis integrated-cavity-output spectroscopy, Appl. Phys. BLasers O., 75, 261–265, 2002.
Butler, J. H., Elkins, J. W., Thompson, T. M., and Egan, K. B.: Tropospheric and dissolved N2O5
of the west Pacific and east Indian Oceans during the El Nino Southern Oscillation event of1987, J. Geophys. Res., 94, 14865–14877, 1989.
Codispoti, L. A.: Interesting times for marine N2O, Science, 327, 1339–1340,doi:10.1126/science.1184945, 2010.
Cohen, Y. and Gordon, L. I.: Nitrous oxide in the oxygen minimum of the eastern tropical North10
Pacific: evidence for its consumption during denitrification and possible mechanisms for itsproduction, Deep-Sea Res., 25, 509–524, 1978.
Cooper, D. J., Watson, A. J., and Ling, R. D.: Variation of pCO2 along a North Atlantic shippingroute (UK to the Caribbean): a year of automated observations, Marine Chemistry, 60, 147–164, 1998.15
Crutzen, P. J.: The influence of nitrogen oxides on the atmospheric ozone content, Q. J. Roy.Meteorol. Soc., 96, 320–325, 1970.
Denman, K. L., Brasseur, G., Chidthaisong, A., Ciais, P., Cox, P. M., Dickinson, R. E., Hauglus-taine, D., Heinze, C., Holland, E., Jacob, D., Lohmann, U., Ramachandran, S., da SilvaDias, P. L., Wofsy, S. C., and Zhang, X.: Couplings between changes in the climate system20
and biogeochemistry, in: Climate Change 2007: The Physical Science Basis. Contribution ofWorking Group I to the Fourth Assessment Report of the Intergovernmental Panel on ClimateChange, edited by: Solomon, S., Qin, D., Manning, M., Chen, Z., Marquis, M., Averyt, K. B.,Tignor, M., and Miller, H. L., Cambridge University Press, Cambridge, UK and New York, NY,USA, 499–587, 2007.25
Elkins, J. W., Wofsy, S. C., McElroy, M. B., Kolb, C. E., and Kaplan, W. A.: Aquatic sources andsinks for nitrous oxide, Nature, 275, 602–606, 1978.
Forster, G., Upstill-Goddard, R. C., Gist, N., Robinson, C., Uher, G., and Wood-ward, E. M. S.: Nitrous oxide and methane in the Atlantic Ocean between 50 ◦ N and52 ◦ S: latitudinal distribution and sea-to-air flux, Deep-Sea Res. Pt. II, 56, 964–976,30
doi:10.1016/j.dsr2.2008.12.002, 2009.
1049
Discussion
Paper
|D
iscussionP
aper|
Discussion
Paper
|D
iscussionP
aper|
Forster, P., Ramaswamy, V., Artaxo, P., Berntsen, T., Betts, R., Fahey, D. W., Haywood, J.,Lean, J., Lowe, D. C., Myhre, G., Nganga, J., Prinn, R., Raga, G., Schulz, M., and VanDorland, R.: Changes in atmospheric constituents and radiative forcing, in: Climate Change2007: The Physical Science Basis. Contribution of Working Group I to the Fourth AssessmentReport of the Intergovernmental Panel on Climate Change, edited by: Solomon, S., Qin, D.,5
Manning, M., Chen, Z., Marquis, M., Averyt, K. B., Tignor, M., and Miller, H. L., CambridgeUniversity Press, Cambridge, UK and New York, NY, USA, 2007.
Goreau, T. J., Kaplan, W. A., Wofsy, S. C., McElroy, M. B., Valois, F. W., and Watson, S. W.:Production of NO−
2 and N2O by nitrifying bacteria at reduced concentrations of oxygen, Appl.Environ. Microb., 40, 526–532, doi:PMCID:PMC291617, 1980.10
Gulzow, W., Rehder, G., Schneider, B., Deimling, J. S., and Sadkowiak, B.: A new methodfor continuous measurement of methane and carbon dioxide in surface waters using off-axis integrated cavity output spectroscopy (ICOS): an example from the Baltic Sea, Limnol.Oceanogr.-Meth., 9, 176–184, 2011.
Juranek, L. W., Hamme, R. C., Kaiser, J., Wanninkhof, R., and Quay, P. D.: Evidence of O2 con-15
sumption in underway seawater lines: implications for air-sea O2 and CO2 fluxes, Geophys.Res. Lett., 37, L01601, doi:10.1029/2009GL040423, 2010.
Knowles, R.: Denitrification, Microbiol. Rev., 46, 43–70, 1982.Liss, P. S. and Merlivat, L.: Air-sea gas exchange rates: introduction and synthesis, in: The role
of air-sea exchange in geochemical cycling, editor: Buat-Menard, Patrick, publisher: Springer20
Netherlands, doi:10.1007/978-94-009-4738-2 5, ISBN: 978-94-010-8606-6; publishing insti-tution: D. Reidel Publishing Company and place of publication: Dordrecht 185, 113–127,1986.
Loscher, C. R., Kock, A., Konneke, M., LaRoche, J., Bange, H. W., and Schmitz, R. A.: Produc-tion of oceanic nitrous oxide by ammonia-oxidizing archaea, Biogeosciences, 9, 2419–2429,25
doi:10.5194/bg-9-2419-2012, 2012.McGillicuddy, D. J., Anderson, L. A., Bates, N. R., Bibby, T., Buesseler, K. O., Carlson, C. A.,
Davis, C. S., Ewart, C., Falkowski, P. G., and Goldthwait, S. A.: Eddy/wind interactions stim-ulate extraordinary mid-ocean plankton blooms, Science, 316, 1021–1026, 2007.
McIlvin, M. R. and Casciotti, K. L.: Fully automated system for stable isotopic analyses of dis-30
solved nitrous oxide at natural abundance levels, Limnol. Oceanogr.-Meth., 8, 54–66, 2010.
1050

Discussion
Paper
|D
iscussionP
aper|
Discussion
Paper
|D
iscussionP
aper|
Moore, C. M., Mills, M. M., Achterberg, E. P., Geider, R. J., LaRoche, J., Lucas, M. I., McDon-agh, E. L., Pan, X., Poulton, A. J., and Rijkenberg, M. J. A.: Large-scale distribution of Atlanticnitrogen fixation controlled by iron availability, Nat. Geosci., 2, 867–871, 2009.
Nevison, C. D., Weiss, R. F., and Erickson, D. J.: Global oceanic emissions of nitrous oxide,J. Geophys. Res., 100, 15809–15820, 1995.5
Nightingale, P. D., Malin, G., Law, C. S., Watson, A. J., Liss, P. S., Liddicoat, M. I., Boutin, J., andUpstill-Goddard, R. C.: In situ evaluation of air-sea gas exchange parameterizations usingnovel conservative and volatile tracers, Global Biogeochem. Cy., 14, 373–387, 2000.
Oudot, C., Jean-Baptiste, P., Fourre, E., Mormiche, C., Guevel, M., Ternon, J. F., and LeCorre, P.: Transatlantic equatorial distribution of nitrous oxide and methane, Deep-Sea Res.10
Pt. I, 49, 1175–1193, 2002.Popp, B. N., Westley, M. B., Toyoda, S., Miwa, T., Dore, J. E., Yoshida, N., Rust, T. M., San-
sone, F. J., Russ, M. E., Ostrom, N. E., and Ostrom, P. H.: Nitrogen and oxygen isotopomericconstraints on the origins and sea-to-air flux of N2O in the oligotrophic subtropical NorthPacific gyre, Global Biogeochem. Cy., 16, 12-1-12-10, doi:10.1029/2001GB001806, 2002.15
Poth, M. and Focht, D. D.: 15N kinetic analysis of N2O production by Nitrosomonas eu-ropaea: an examination of nitrifier denitrification, Appl. Environ. Microb., 49, 1134–1141,doi:PMCID:PMC238519, 1985.
Prinn, R., Weiss, R., Fraser, P., Simmonds, P., Cunnold, D., Alyea, F., O’Doherty, S.,Salameh, P., Miller, B., and Huang, J.: A history of chemically and radiatively important20
gases in air deduced from ALE/GAGE/AGAGE, J. Geophys. Res.-Atmos., 105, 17751–17792, 2000.
Rafelski, L. E., Paplawsky, B., and Keeling, R. F.: An equilibrator system to measure dissolvedoxygen and its isotopes, J. Atmos. Ocean. Tech., 30, 361–377, doi:10.1175/JTECH-D-12-00074.1, 2012.25
Ravishankara, A. R., Daniel, J. S., and Portmann, R. W.: Nitrous oxide (N2O): thedominant ozone-depleting substance emitted in the 21st century, Science, 123–125,doi:10.1126/science.1176985, 2009.
Reuer, M. K., Barnett, B. A., Bender, M. L., Falkowski, P. G., and Hendricks, M. B.: New esti-mates of Southern Ocean biological production rates from O2/Ar ratios and the triple isotope30
composition of O2, Deep-Sea Res. Pt. I, 54, 951–974, 2007.
1051
Discussion
Paper
|D
iscussionP
aper|
Discussion
Paper
|D
iscussionP
aper|
Rhee, T. S., Kettle, A. J., and Andreae, M. O.: Methane and nitrous oxide emissions from theocean: a reassessment using basin-wide observations in the Atlantic, J. Geophys. Res., 114,D12304, doi:10.1029/2008JD011662, 2009.
Rockmann, T., Kaiser, J., Brenninkmeijer, C. A. M., and Brand, W. A.: Gaschromatography/isotope-ratio mass spectrometry method for high-precision position-5
dependent 15N and 18O measurements of atmospheric nitrous oxide, Rapid Commun. MassSp., 17, 1897–1908, 10.1002/rcm.1132, 2003.
Suntharalingam, P. and Sarmiento, J. L.: Factors governing the oceanic nitrous oxide distri-bution: simulations with an ocean general circulation model, Global Biogeochem. Cy., 14,429–454, 2000.10
Sutka, R. L., Ostrom, N. E., Ostrom, P. H., and Phanikumar, M. S.: Stable nitrogen isotopedynamics of dissolved nitrate in a transect from the North Pacific Subtropical Gyre to theEastern Tropical North Pacific, Geochim. Cosmochim. Ac., 68, 517–527, doi:10.1016/s0016-7037(03)00483-6, 2004.
Sutka, R. L., Ostrom, N. E., Ostrom, P. H., Breznak, J. A., Gandhi, H., Pitt, A. J., and Li, F.:15
Distinguishing nitrous oxide production from nitrification and denitrification on the basis ofisotopomer abundances, Appl. Environ. Microb., 72, 638–644, doi:10.1128/aem.72.1.638-644.2006, 2006.
Walter, S., Bange, H. W., and Wallace, D. W. R.: Nitrous oxide in the surface layer of the trop-ical North Atlantic Ocean along a west to east transect, Geophys. Res. Lett., 31, L23S07,20
doi:10.1029/2004GL019937, 2004.Walter, S., Bange, H. W., Breitenbach, U., and Wallace, D. W. R.: Nitrous oxide in the North
Atlantic Ocean, Biogeosciences, 3, 607–619, doi:10.5194/bg-3-607-2006, 2006.Wanninkhof, R.: Relationship between wind speed and gas exchange, J. Geophys. Res., 97,
7373–7382, 1992.25
Weiss, R. F. and Price, B. A.: Nitrous oxide solubility in water and seawater, Mar. Chem., 8,347–359, 1980.
Weiss, R. F., Van Woy, F. A., and Salameh, P. K.: Surface water and atmospheric carbon dioxideand nitrous oxide observations by shipboard automated gas chromatography: results fromexpeditions between 1977 and 1990, Oak Ridge National Lab., TN, US, Carbon Dioxide30
Information Analysis Center, 1992.
1052

Discussion
Paper
|D
iscussionP
aper|
Discussion
Paper
|D
iscussionP
aper|
Wuchter, C., Abbas, B., Coolen, M. J. L., Herfort, L., Van Bleijswijk, J., Timmers, P., Strous, M.,Teira, E., Herndl, G. J., and Middelburg, J. J.: Archaeal nitrification in the ocean, P. Natl.Acad. Sci. USA, 103, 12317–12322, doi:10.1073/pnas.0600756103, 2006.
Yoshida, N., Morimoto, H., Hirano, M., Koike, I., Matsuo, S., Wada, E., Saino, T., and Hattori, A.:Nitrification rates and 15N abundances of N2O and NO−
3 in the western North Pacific, Nature,5
341, 895–897, 1989.Yoshinari, T.: Nitrous oxide in the sea, Mar. Chem., 4, 189–202, 1976.
1053
Discussion
Paper
|D
iscussionP
aper|
Discussion
Paper
|D
iscussionP
aper|
Table 1. Comparison between ICOS and GC-MS measurements during JR255A. Samplingtime (GMT) and position for the three depth casts overlapping with analyser measurements.ceq is the equilibrium concentration for atmospheric N2O based on sea surface temperature(θ0), salinity (S0) and atmospheric pressure (patm).
Date and time Latitude/◦ S
Longitude/◦ W
θ0/◦C
S0 patm/kPa
c(N2O, LGR)/(nmolL−1)
c(N2O, GC-MS)/(nmolL−1)
ceq(θ0, S0, patm)/
(nmolL−1)
23 Jan 2012 19:53 63.4 53.0 0.56 34.31 101 15.44±0.02 15.8±0.3 14.9±0.224 Jan 2012 03:48 63.5 52.1 0.24 34.02 101 15.36±0.02 15.6±0.3 15.1±0.225 Jan 2012 06:35 63.3 53.3 0.46 34.28 100 15.52±0.02 15.6±0.3 15.0±0.2
1054

Discussion
Paper
|D
iscussionP
aper|
Discussion
Paper
|D
iscussionP
aper|
Table 2. Mean N2O concentration, saturation and air-sea flux for the northern gyre (24–11◦ N),equatorial region (11◦ N–5◦ S, with gaps between 4◦ N and 2◦ S) and southern gyre (14–39◦ S).
c(N2O)/( nmolL−1)
s(N2O)/(%)
φ/(µmolm−2 d−1)
24–11◦ N 5.8±0.1 99.0±1.6 −0.14±0.3111◦ N–5◦ S 5.8±0.2 100.4±1.8 0.11±0.2614–39◦ S 7.1±0.7 99.7±1.0 −0.16±0.33
1055
Discussion
Paper
|D
iscussionP
aper|
Discussion
Paper
|D
iscussionP
aper|
Fig. 1. Setup for laboratory tests. V1 and V2: 4-port 2-position valves. Arrows indicate gas flowthrough the equilibrator. The vent is a 3 m long coiled 1/8 inch (outer diameter) plastic tube toallow for volume and pressure changes of the equilibrator headspace due to variations in gastension.
1056
Discussion
Paper
|D
iscussionP
aper|
Discussion
Paper
|D
iscussionP
aper|
Fig. 2. N2O mole fractions during step experiment for determination of τ. Equilibrated waterflowing through the equilibrator is replaced with water containing higher N2O concentrations.
1057
Discussion
Paper
|D
iscussionP
aper|
Discussion
Paper
|D
iscussionP
aper|
Fig. 3. Underway setup for field deployment during AMT20. Two manual 3-port valves allowswitching between measurements of the equilibrator headspace, marine air, and dry air.
1058

Discussion
Paper
|D
iscussionP
aper|
Discussion
Paper
|D
iscussionP
aper|
Fig. 4. Cruise track of AMT20. Thick grey lines indicate positions of measurements with theN2O analyser.
1059
Discussion
Paper
|D
iscussionP
aper|
Discussion
Paper
|D
iscussionP
aper|
Fig. 5. Comparison of N2O flux calculated from instantaneous (top panel) and 30 day averagedwind speeds (bottom panel).
1060

Discussion
Paper
|D
iscussionP
aper|
Discussion
Paper
|D
iscussionP
aper|
Fig. 6. N2O mole fractions measured during AMT20 in tropospheric air. Open circles are rawmeasurement values before drift and offset corrections, filled circles are fully corrected values.
1061
Discussion
Paper
|D
iscussionP
aper|
Discussion
Paper
|D
iscussionP
aper|
Fig. 7. Measured mole fractions for the reference gas during the transect. Nominal value of323.7 nmolmol−1 indicated by grey line.
1062

Discussion
Paper
|D
iscussionP
aper|
Discussion
Paper
|D
iscussionP
aper|
Fig. 8. N2O concentrations in surface waters during the cruise.
1063
Discussion
Paper
|D
iscussionP
aper|
Discussion
Paper
|D
iscussionP
aper|
Fig. 9. (A) Sea-to-air N2O flux, grey line denotes zero flux. Positive values indicate fluxes fromsea to air. (B) Surface water saturations, equilibrium saturation 100 % indicated by grey line,arrows mark saturation-peaks between 20–10◦ N (see text for details). (C) Wind speed at 10 mheight from ECMWF climatology for AMT20. (D) Sea surface temperature at inlet.
1064

Discussion
Paper
|D
iscussionP
aper|
Discussion
Paper
|D
iscussionP
aper|
Fig. 10. Meridional variations in sea level height anomaly (grey line, left axis) and N2O satura-tion (black dots, right axis).
1065