Embed Size (px)
Citation preview
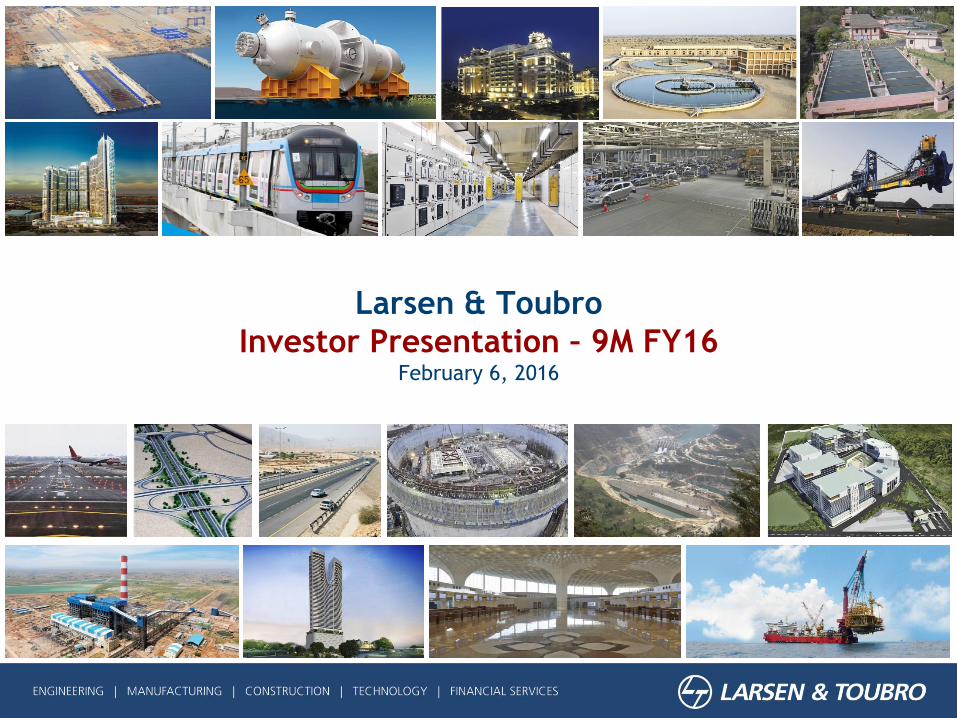
Larsen & Toubro
Investor Presentation – 9M FY16February 6, 2016
Disclaimer
This presentation contains certain forward looking statements concerning L&T’s future
business prospects and business profitability, which are subject to a number of risks
and uncertainties and the actual results could materially differ from those in such
forward looking statements.
The risks and uncertainties relating to these statements include, but are not limited to,
risks and uncertainties regarding fluctuations in earnings, our ability to manage growth,
competition (both domestic and international), economic growth in India and the
target countries for exports, ability to attract and retain highly skilled professionals,
time and cost over runs on contracts, our ability to manage our international
operations, government policies and actions with respect to investments, fiscal
deficits, regulations, etc., interest and other fiscal costs generally prevailing in the
economy. Past performance may not be indicative of future performance.
The company does not undertake to make any announcement in case any of these
forward looking statements become materially incorrect in future or update any
forward looking statements made from time to time by or on behalf of the company.2
3
Presentation Outline
L&T Overview
Business Overview
Group Performance
Sectoral opportunities &
Outlook
4
Presentation Outline
L&T Overview
Business Overview
Group Performance
Sectoral Opportunities &
Outlook
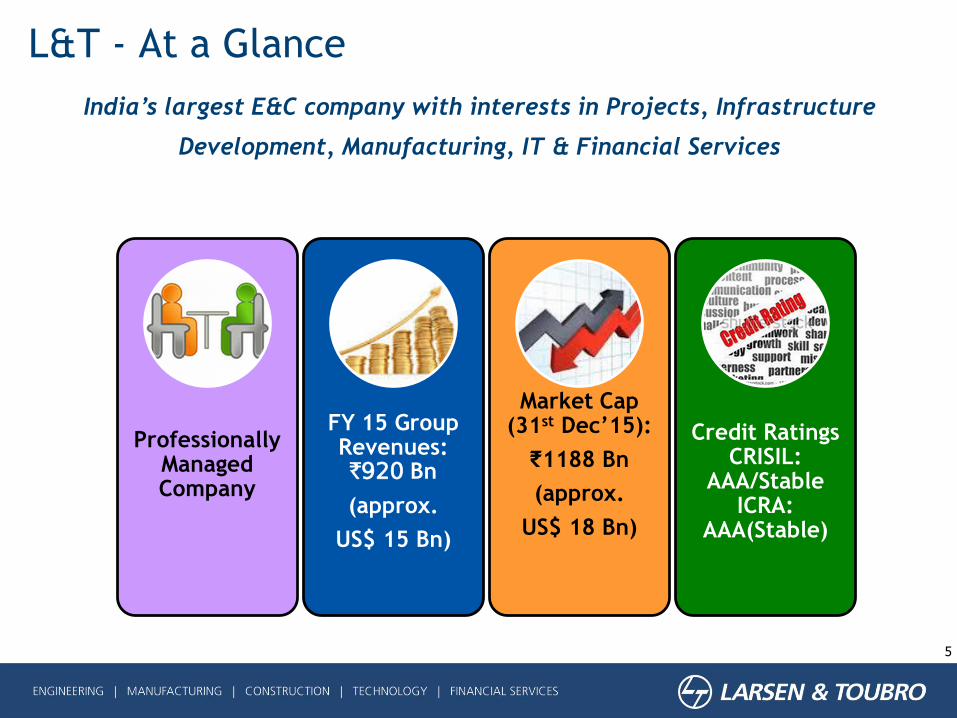
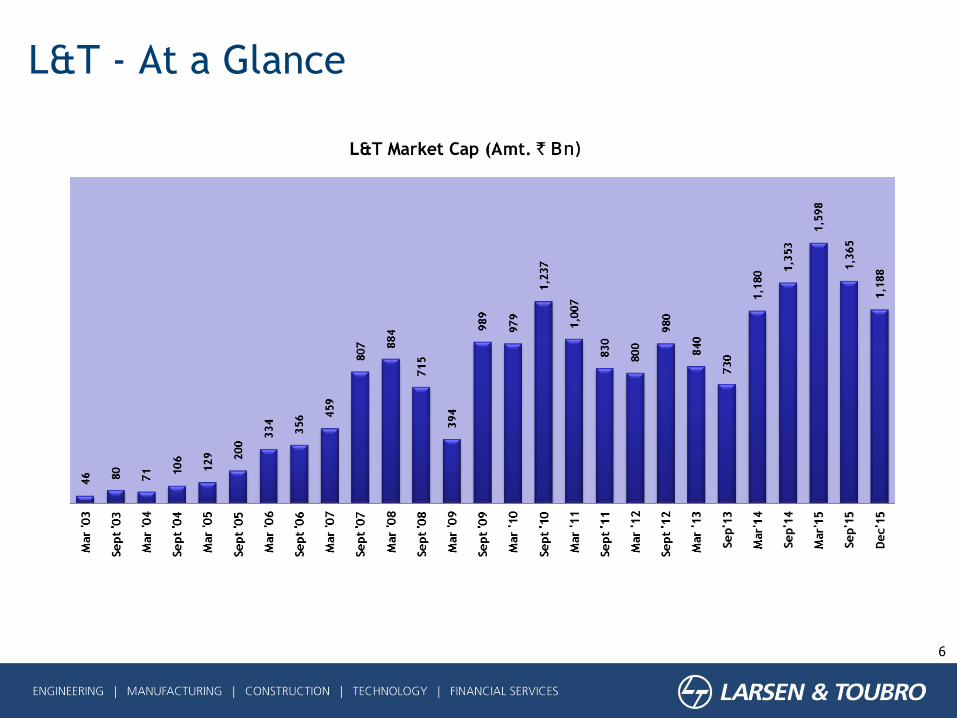
L&T - At a Glance
Professionally Managed Company
FY 15 Group Revenues: `920 Bn
(approx.
US$ 15 Bn)
Market Cap (31st Dec’15):
₹1188 Bn
(approx.
US$ 18 Bn)
Credit Ratings CRISIL:
AAA/Stable ICRA:
AAA(Stable)
5
India’s largest E&C company with interests in Projects, Infrastructure
Development, Manufacturing, IT & Financial Services
6
L&T - At a Glance
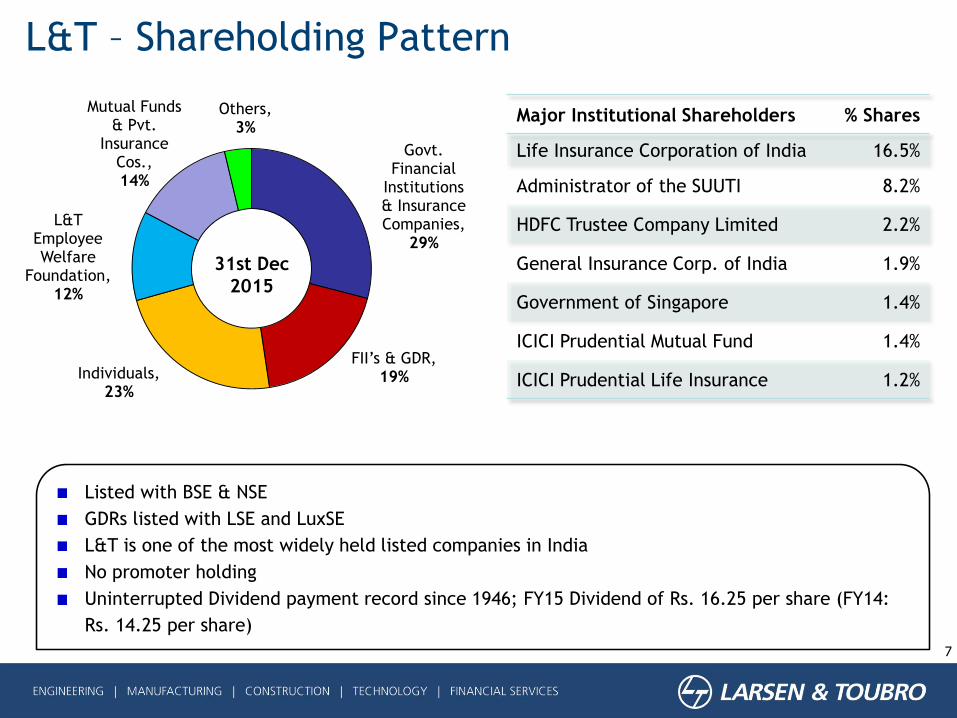
L&T – Shareholding Pattern
Listed with BSE & NSE
GDRs listed with LSE and LuxSE
L&T is one of the most widely held listed companies in India
No promoter holding
Uninterrupted Dividend payment record since 1946; FY15 Dividend of Rs. 16.25 per share (FY14:
Rs. 14.25 per share)
Major Institutional Shareholders % Shares
Life Insurance Corporation of India 16.5%
Administrator of the SUUTI 8.2%
HDFC Trustee Company Limited 2.2%
General Insurance Corp. of India 1.9%
Government of Singapore 1.4%
ICICI Prudential Mutual Fund 1.4%
ICICI Prudential Life Insurance 1.2%
7
Govt. Financial
Institutions & Insurance Companies,
29%
FII’s & GDR, 19%Individuals,
23%
L&T Employee Welfare
Foundation,12%
Mutual Funds & Pvt.
Insurance Cos., 14%
Others,3%
31st Dec
2015
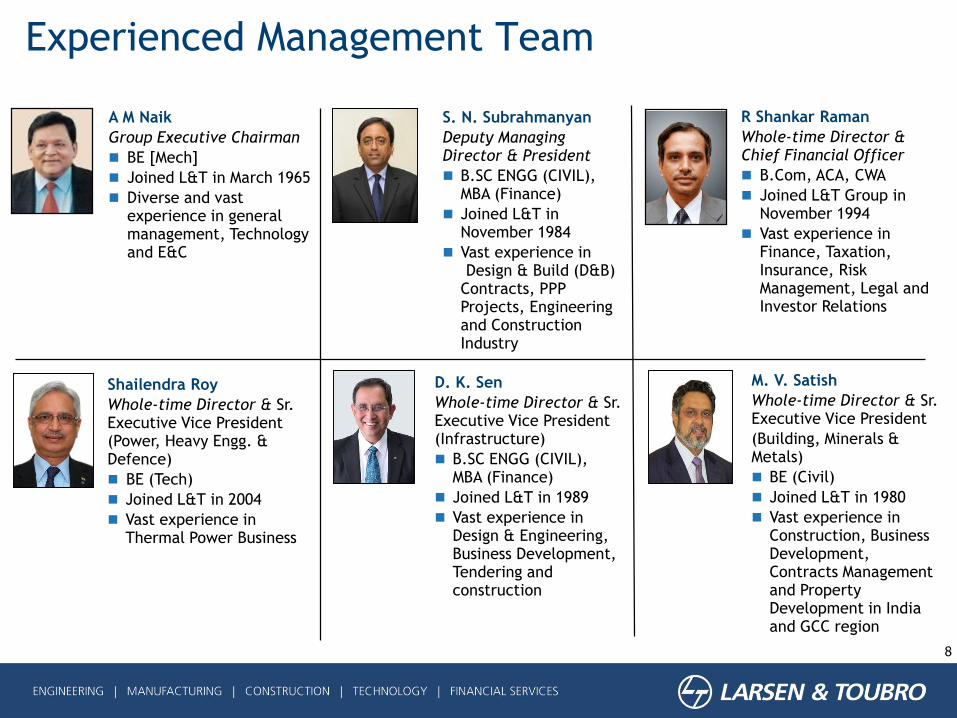
Experienced Management Team
8
A M Naik
Group Executive Chairman
BE [Mech]
Joined L&T in March 1965
Diverse and vast experience in general management, Technology and E&C
S. N. Subrahmanyan
Deputy Managing Director & President
B.SC ENGG (CIVIL), MBA (Finance)
Joined L&T in November 1984
Vast experience in Design & Build (D&B)
Contracts, PPP Projects, Engineering and Construction Industry
R Shankar Raman
Whole-time Director &Chief Financial Officer
B.Com, ACA, CWA
Joined L&T Group in November 1994
Vast experience in Finance, Taxation, Insurance, Risk Management, Legal and Investor Relations
Shailendra Roy
Whole-time Director & Sr. Executive Vice President (Power, Heavy Engg. & Defence)
BE (Tech)
Joined L&T in 2004
Vast experience in Thermal Power Business
D. K. Sen
Whole-time Director & Sr. Executive Vice President (Infrastructure)
B.SC ENGG (CIVIL), MBA (Finance)
Joined L&T in 1989
Vast experience in Design & Engineering, Business Development, Tendering and construction
M. V. Satish
Whole-time Director & Sr. Executive Vice President
(Building, Minerals & Metals)
BE (Civil)
Joined L&T in 1980
Vast experience in Construction, Business Development, Contracts Management and Property Development in India and GCC region
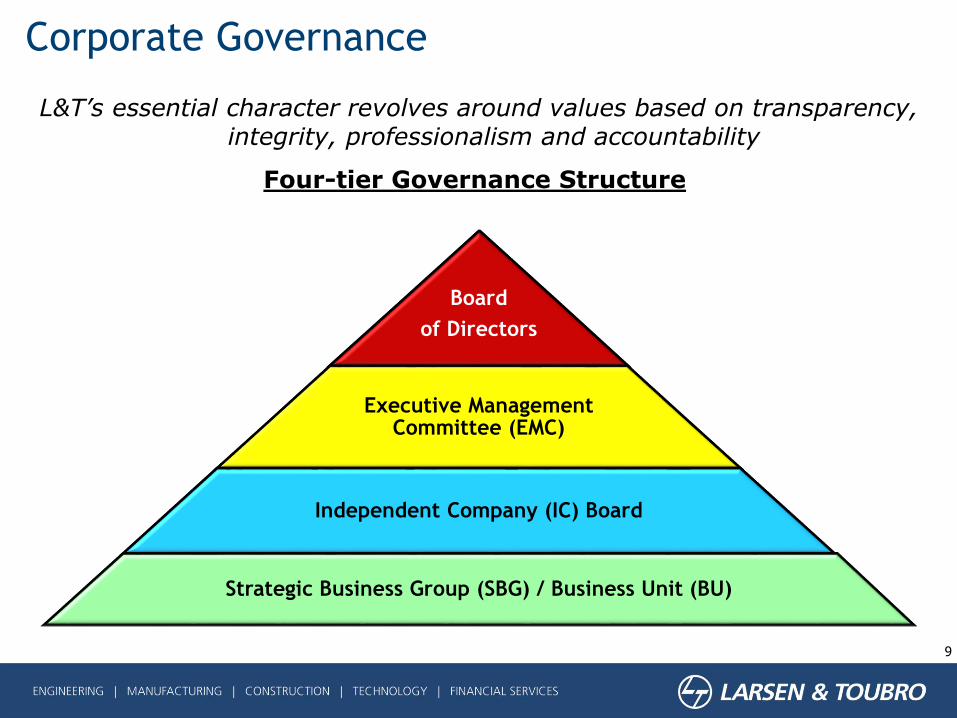
Corporate Governance
9
Four-tier Governance Structure
L&T’s essential character revolves around values based on transparency, integrity, professionalism and accountability
Board
of Directors
Executive Management Committee (EMC)
Independent Company (IC) Board
Strategic Business Group (SBG) / Business Unit (BU)
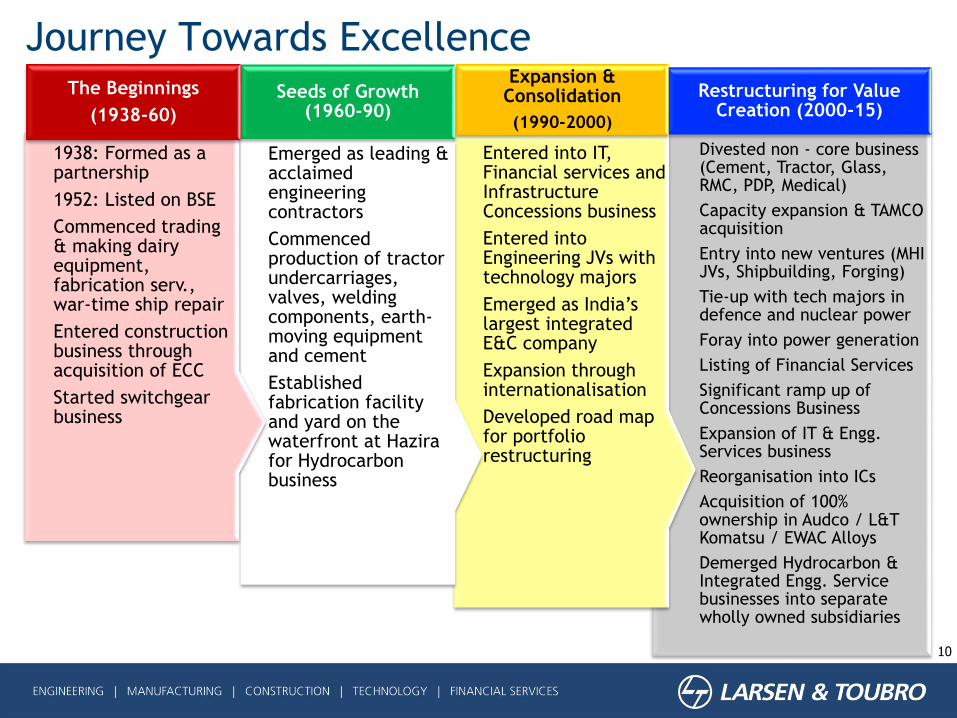
Journey Towards Excellence
10
Divested non - core business (Cement, Tractor, Glass, RMC, PDP, Medical)
Capacity expansion & TAMCO acquisition
Entry into new ventures (MHI JVs, Shipbuilding, Forging)
Tie-up with tech majors in defence and nuclear power
Foray into power generation
Listing of Financial Services
Significant ramp up of Concessions Business
Expansion of IT & Engg. Services business
Reorganisation into ICs
Acquisition of 100% ownership in Audco / L&T Komatsu / EWAC Alloys
Demerged Hydrocarbon & Integrated Engg. Service businesses into separate wholly owned subsidiaries
Restructuring for Value Creation (2000-15)
Entered into IT, Financial services and Infrastructure Concessions business
Entered into Engineering JVs with technology majors
Emerged as India’s largest integrated E&C company
Expansion through internationalisation
Developed road map for portfolio restructuring
Expansion & Consolidation
(1990-2000)
Emerged as leading & acclaimed engineering contractors
Commenced production of tractor undercarriages, valves, welding components, earth-moving equipment and cement
Established fabrication facility and yard on the waterfront at Hazira for Hydrocarbon business
Seeds of Growth (1960-90)
1938: Formed as a partnership
1952: Listed on BSE
Commenced trading & making dairy equipment, fabrication serv., war-time ship repair
Entered construction business through acquisition of ECC
Started switchgear business
The Beginnings
(1938-60)
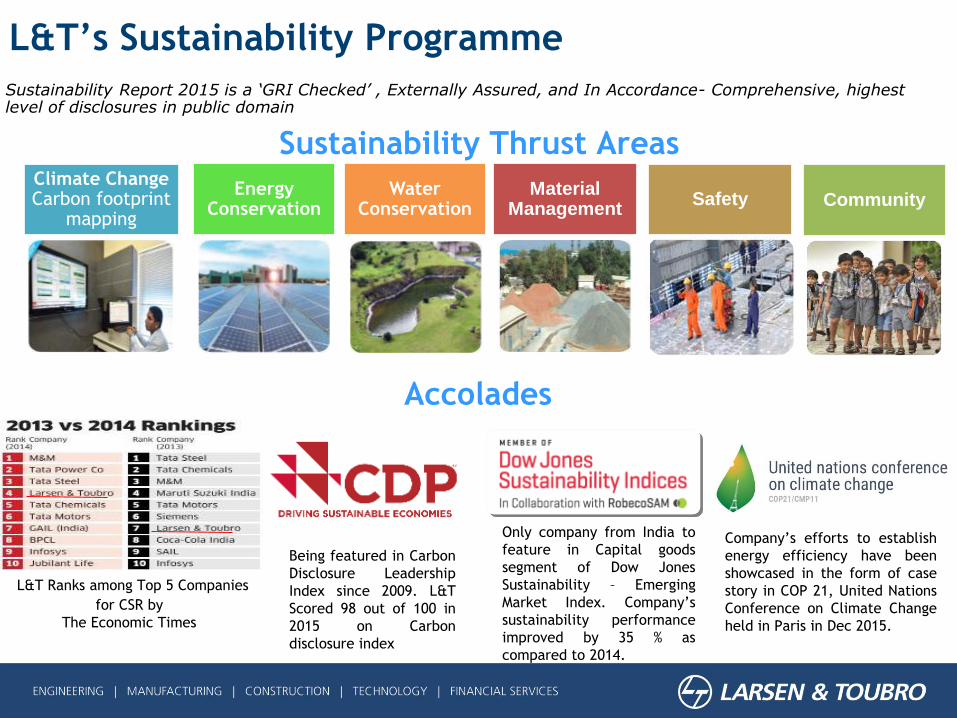
L&T’s Sustainability Programme
Sustainability Report 2015 is a ‘GRI Checked’ , Externally Assured, and In Accordance- Comprehensive, highest level of disclosures in public domain
Climate Change Carbon footprint
mapping
Energy Conservation
Water Conservation
Material Management
Community
Sustainability Thrust Areas
Safety
Accolades
Only company from India to
feature in Capital goods
segment of Dow Jones
Sustainability – Emerging
Market Index. Company’s
sustainability performance
improved by 35 % as
compared to 2014.
L&T Ranks among Top 5 Companies
for CSR by
The Economic Times
Being featured in Carbon
Disclosure Leadership
Index since 2009. L&T
Scored 98 out of 100 in
2015 on Carbon
disclosure index
Company’s efforts to establish
energy efficiency have been
showcased in the form of case
story in COP 21, United Nations
Conference on Climate Change
held in Paris in Dec 2015.
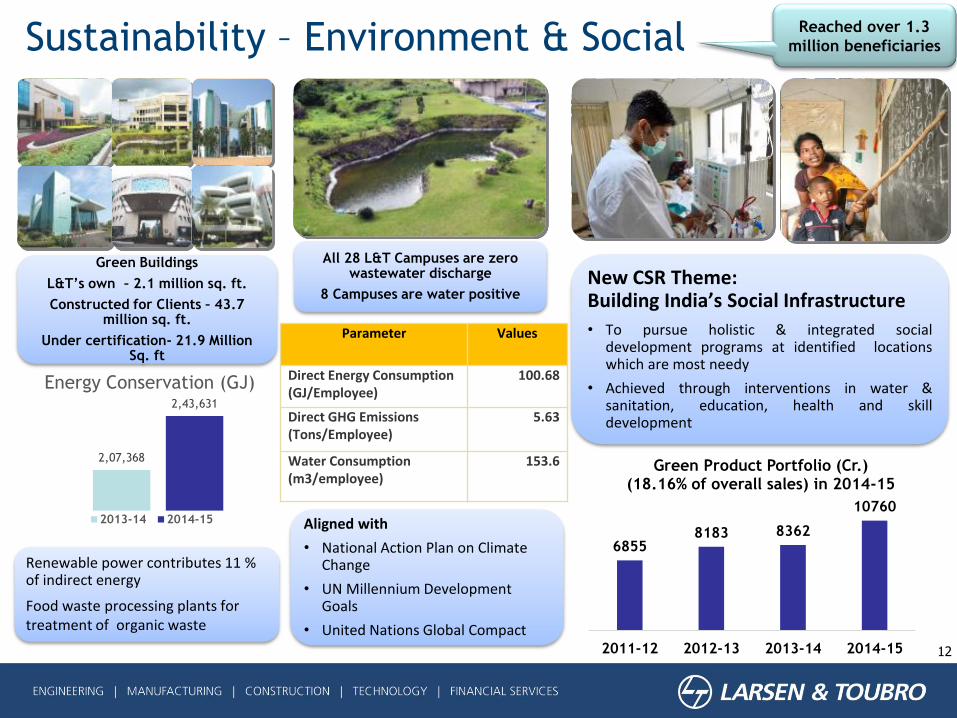
Sustainability – Environment & Social
12
Green Buildings
L&T’s own – 2.1 million sq. ft.
Constructed for Clients – 43.7 million sq. ft.
Under certification- 21.9 Million Sq. ft
All 28 L&T Campuses are zero wastewater discharge
8 Campuses are water positive
Renewable power contributes 11 % of indirect energy
Food waste processing plants for treatment of organic waste
Aligned with
• National Action Plan on Climate Change
• UN Millennium Development Goals
• United Nations Global Compact
New CSR Theme: Building India’s Social Infrastructure
• To pursue holistic & integrated socialdevelopment programs at identified locationswhich are most needy
• Achieved through interventions in water &sanitation, education, health and skilldevelopment
Parameter Values
Direct Energy Consumption(GJ/Employee)
100.68
Direct GHG Emissions (Tons/Employee)
5.63
Water Consumption(m3/employee)
153.62,07,368
2,43,631
Energy Conservation (GJ)
2013-14 2014-15
68558183 8362
10760
2011-12 2012-13 2013-14 2014-15
Green Product Portfolio (Cr.) (18.16% of overall sales) in 2014-15
Reached over 1.3
million beneficiaries
13
Presentation Outline
L&T Overview
Business Overview
Group Performance
Sectoral Opportunities &
Outlook
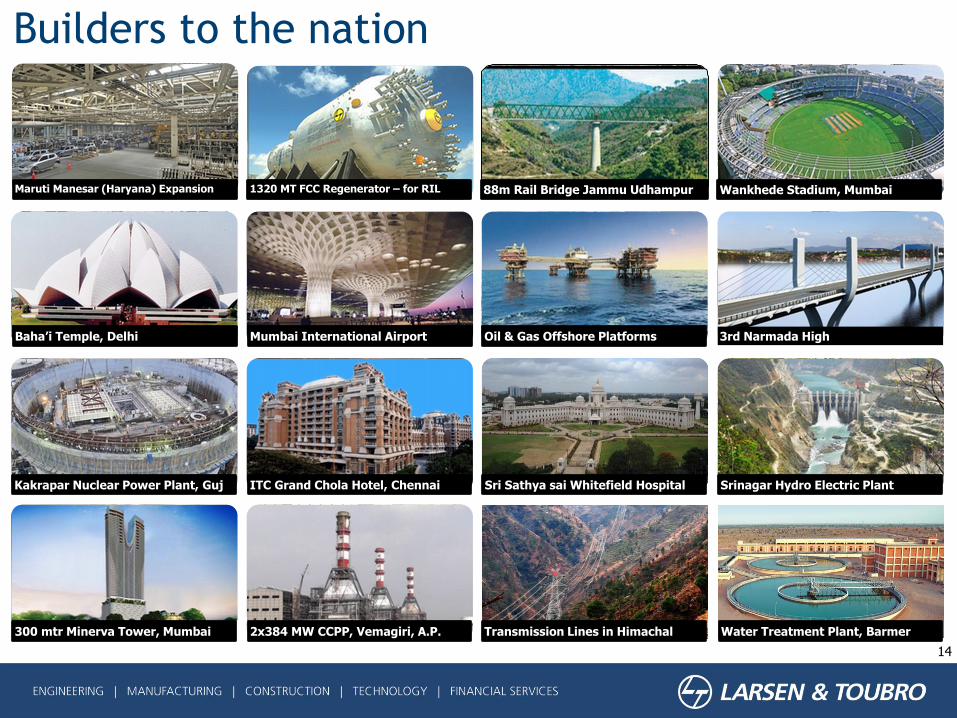
Builders to the nation
14
Wankhede Stadium, Mumbai
Baha’i Temple, Delhi
Maruti Manesar (Haryana) Expansion 88m Rail Bridge Jammu Udhampur1320 MT FCC Regenerator – for RIL
Oil & Gas Offshore PlatformsMumbai International Airport 3rd Narmada High
ITC Grand Chola Hotel, Chennai Sri Sathya sai Whitefield Hospital Srinagar Hydro Electric Plant
2x384 MW CCPP, Vemagiri, A.P. Transmission Lines in Himachal Water Treatment Plant, Barmer300 mtr Minerva Tower, Mumbai
Kakrapar Nuclear Power Plant, Guj
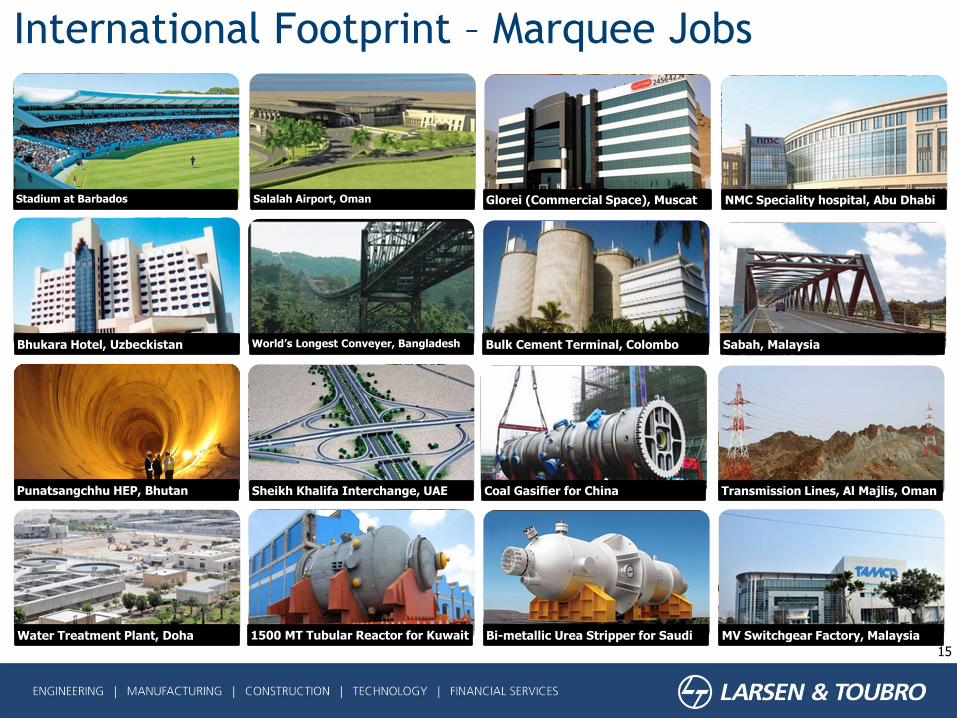
International Footprint – Marquee Jobs
15
NMC Speciality hospital, Abu Dhabi
Bhukara Hotel, Uzbeckistan
Stadium at Barbados Glorei (Commercial Space), MuscatSalalah Airport, Oman
Sabah, Malaysia
Sheikh Khalifa Interchange, UAE Coal Gasifier for China Transmission Lines, Al Majlis, Oman
1500 MT Tubular Reactor for Kuwait Bi-metallic Urea Stripper for Saudi MV Switchgear Factory, MalaysiaWater Treatment Plant, Doha
Punatsangchhu HEP, Bhutan
World’s Longest Conveyer, Bangladesh Bulk Cement Terminal, Colombo
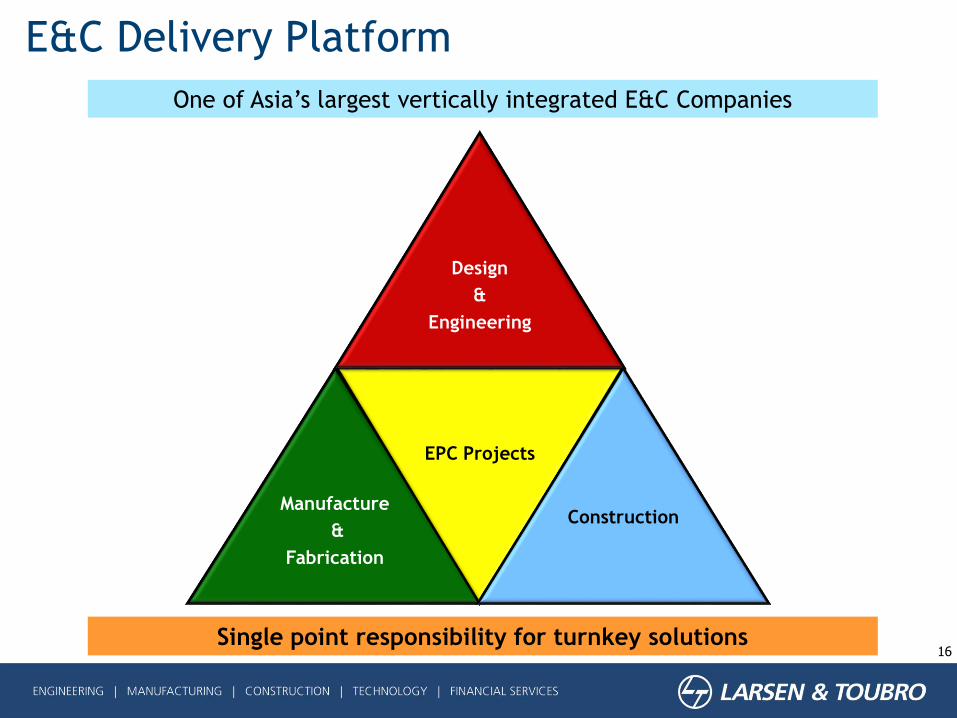
E&C Delivery Platform
16Single point responsibility for turnkey solutions
Design
&
Engineering
Manufacture
&
Fabrication
EPC Projects
Construction
One of Asia’s largest vertically integrated E&C Companies
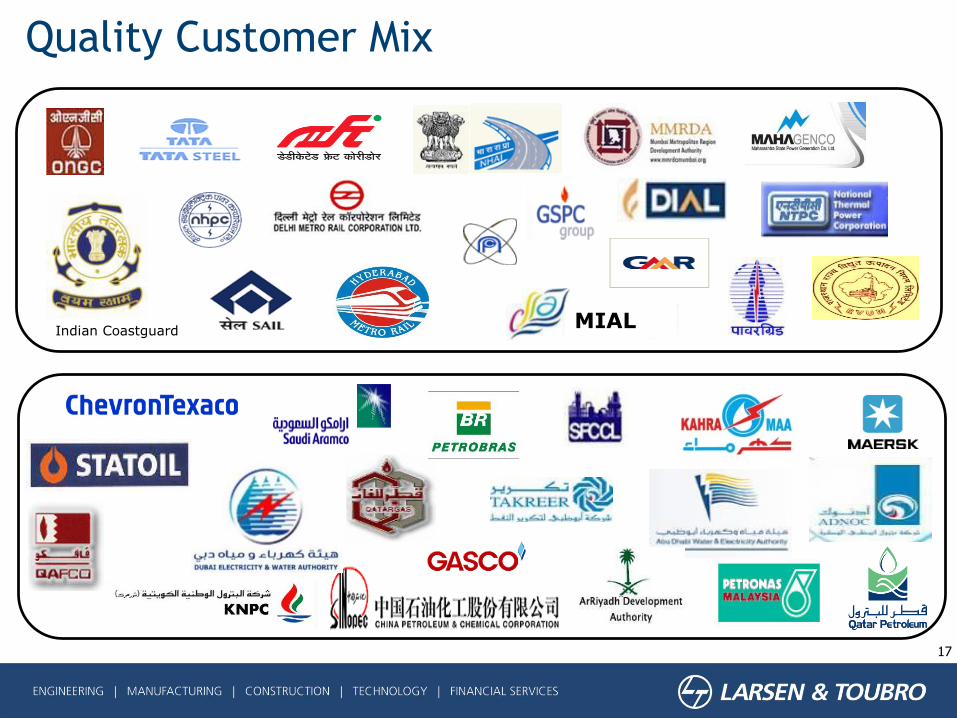
Quality Customer Mix
17
MIALIndian Coastguard
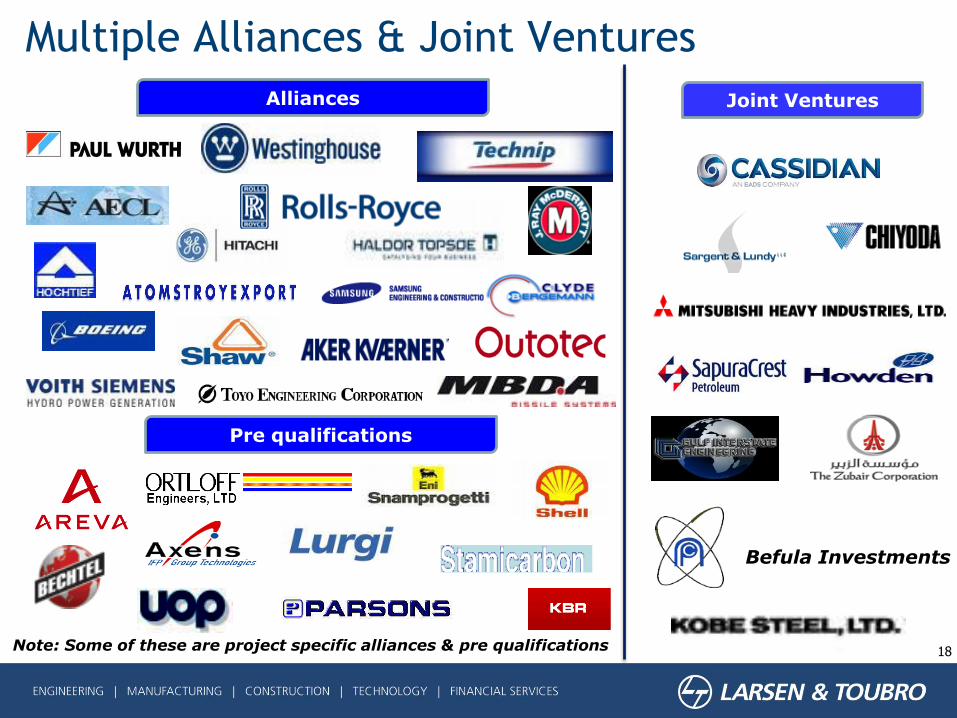
Multiple Alliances & Joint Ventures
18
Alliances
Pre qualifications
Note: Some of these are project specific alliances & pre qualifications
Joint Ventures
Befula Investments
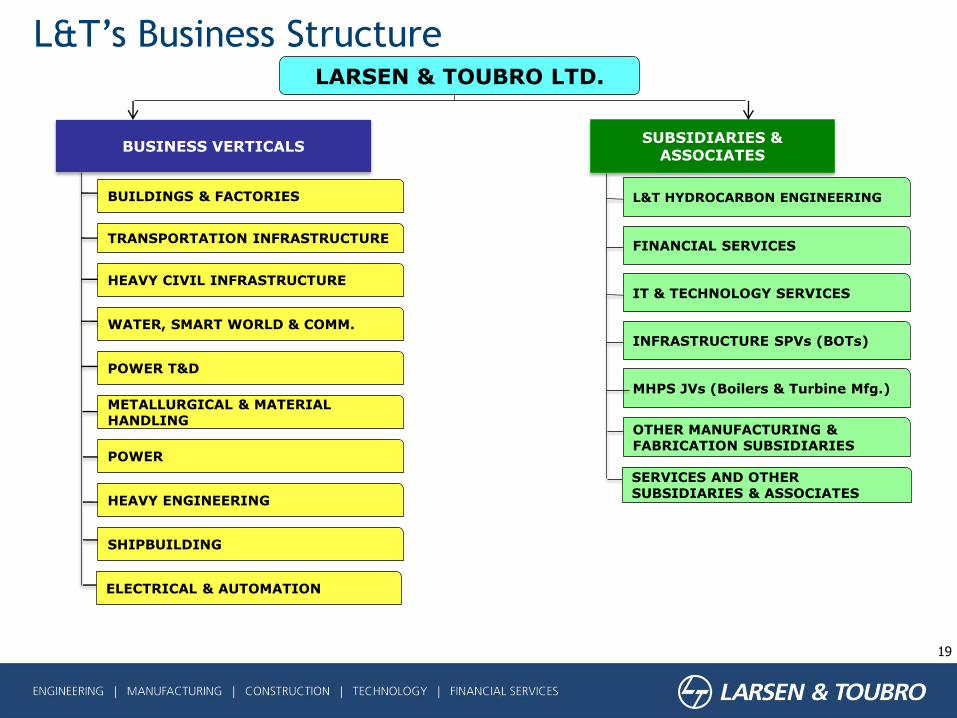
L&T’s Business StructureLARSEN & TOUBRO LTD.
BUSINESS VERTICALSSUBSIDIARIES &
ASSOCIATES
BUILDINGS & FACTORIES
TRANSPORTATION INFRASTRUCTURE
METALLURGICAL & MATERIAL HANDLING
POWER T&D
HEAVY ENGINEERING
SHIPBUILDING
ELECTRICAL & AUTOMATION
POWER
FINANCIAL SERVICES
IT & TECHNOLOGY SERVICES
INFRASTRUCTURE SPVs (BOTs)
MHPS JVs (Boilers & Turbine Mfg.)
HEAVY CIVIL INFRASTRUCTURE
WATER, SMART WORLD & COMM.
OTHER MANUFACTURING & FABRICATION SUBSIDIARIES
SERVICES AND OTHER SUBSIDIARIES & ASSOCIATES
19
L&T HYDROCARBON ENGINEERING
20
Presentation Outline
L&T Overview
Business Overview
Group Performance
Sectoral Opportunities &
Outlook
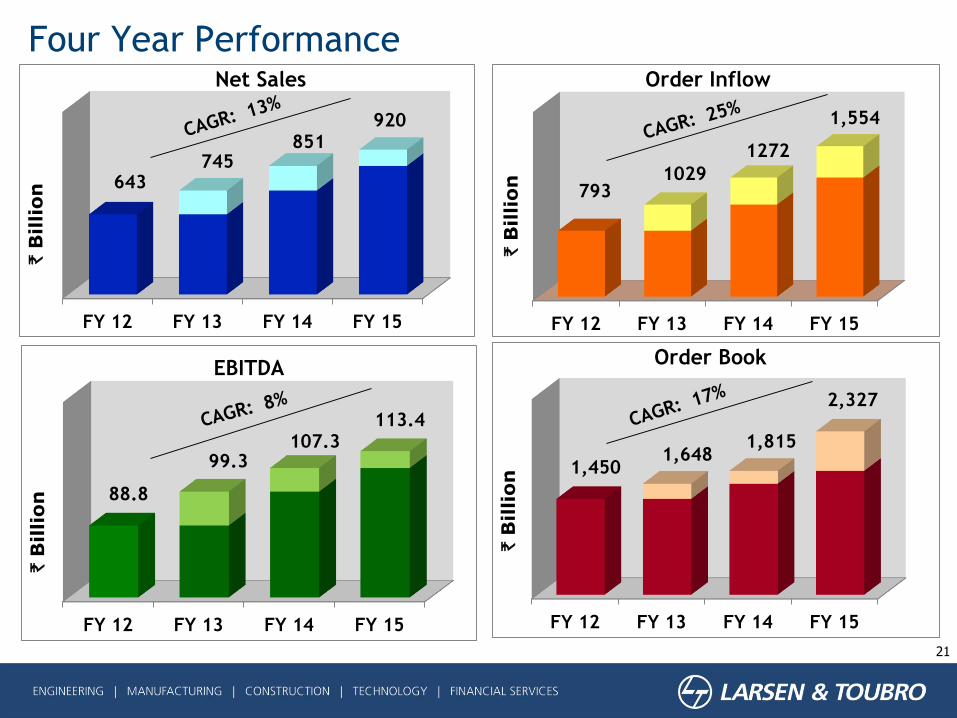
FY 12 FY 13 FY 14 FY 15
88.8
99.3 107.3
EBITDA
Four Year Performance
21
`B
illi
on
FY 12 FY 13 FY 14 FY 15
643 745
851
Net Sales
`B
illi
on
`B
illi
on
FY 12 FY 13 FY 14 FY 15
1,450 1,648
1,815
Order Book
`B
illi
on
920
2,327113.4
FY 12 FY 13 FY 14 FY 15
1,554
793
Order Inflow
`B
illi
on
1272
1029
`B
illi
on
22
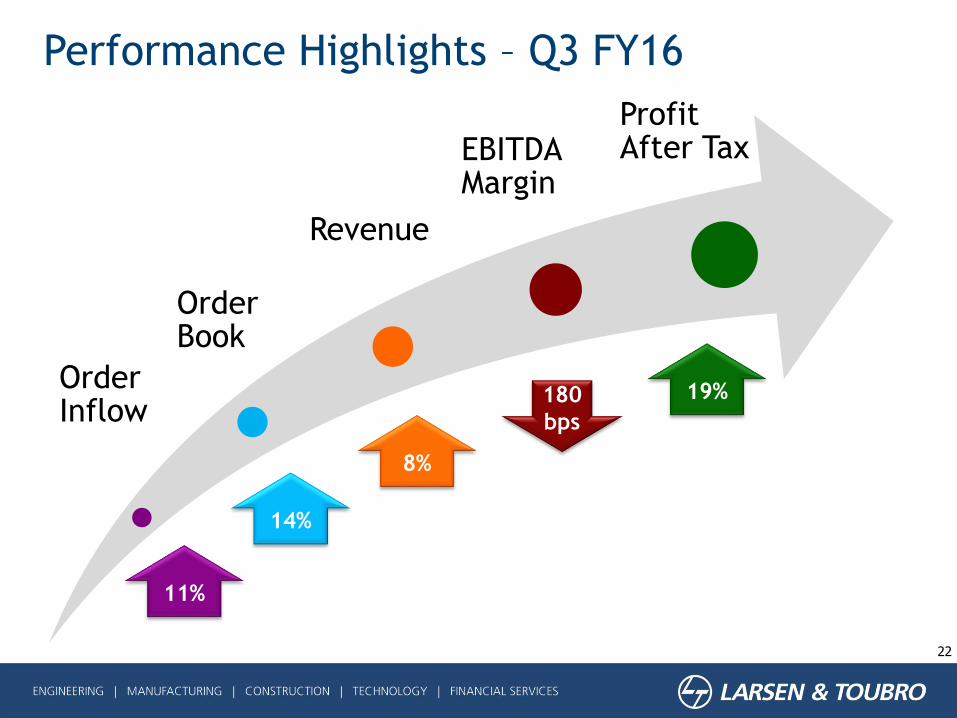
Performance Highlights – Q3 FY16
Order Inflow
Order Book
Revenue
EBITDA Margin
Profit After Tax
11%
14%
8%
19%180
bps
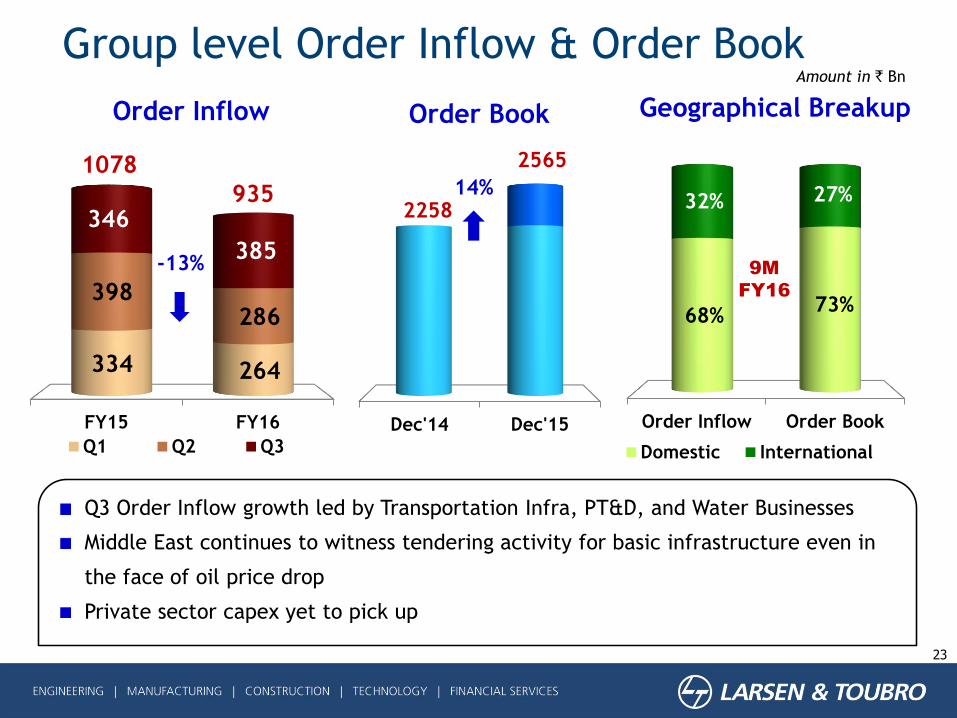
Dec'14 Dec'15
Order Book
2258
2565
Group level Order Inflow & Order Book
23
Amount in ` Bn
14%
Order Inflow Order Book
68%73%
32% 27%
Geographical Breakup
Domestic International
Q3 Order Inflow growth led by Transportation Infra, PT&D, and Water Businesses
Middle East continues to witness tendering activity for basic infrastructure even in
the face of oil price drop
Private sector capex yet to pick up
9M
FY16
FY15 FY16
334 264
398 286
346
385
Order Inflow
Q1 Q2 Q3
-13%
1078
935
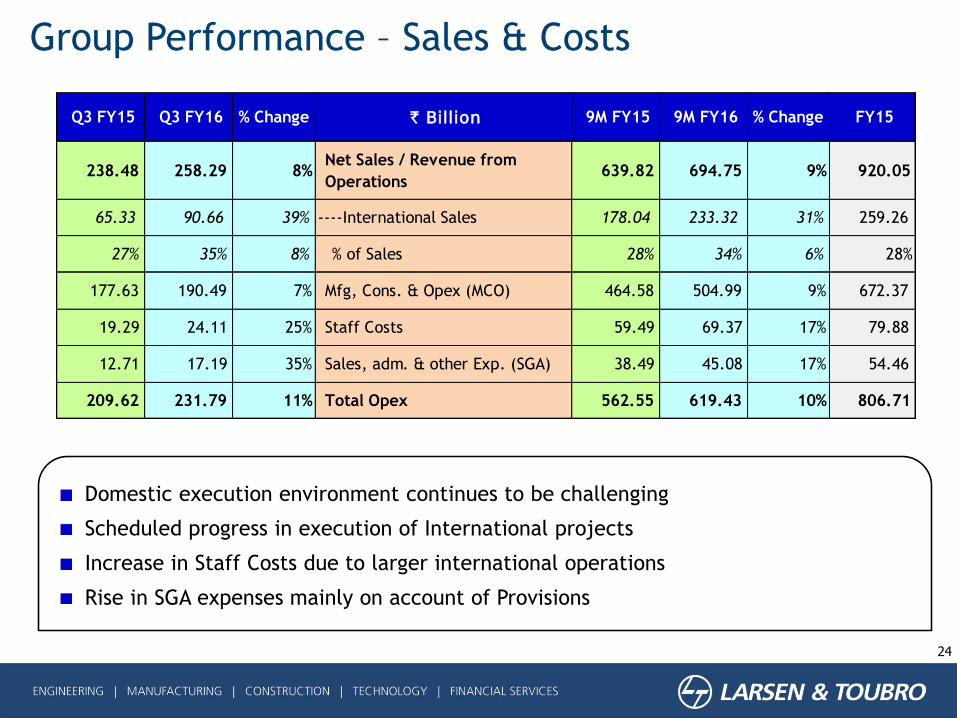
Group Performance – Sales & Costs
24
Domestic execution environment continues to be challenging
Scheduled progress in execution of International projects
Increase in Staff Costs due to larger international operations
Rise in SGA expenses mainly on account of Provisions
Q3 FY15 Q3 FY16 % Change ` Billion 9M FY15 9M FY16 % Change FY15
238.48 258.29 8%Net Sales / Revenue from
Operations 639.82 694.75 9% 920.05
65.33 90.66 39% ----International Sales 178.04 233.32 31% 259.26
27% 35% 8% % of Sales 28% 34% 6% 28%
177.63 190.49 7% Mfg, Cons. & Opex (MCO) 464.58 504.99 9% 672.37
19.29 24.11 25% Staff Costs 59.49 69.37 17% 79.88
12.71 17.19 35% Sales, adm. & other Exp. (SGA) 38.49 45.08 17% 54.46
209.62 231.79 11% Total Opex 562.55 619.43 10% 806.71
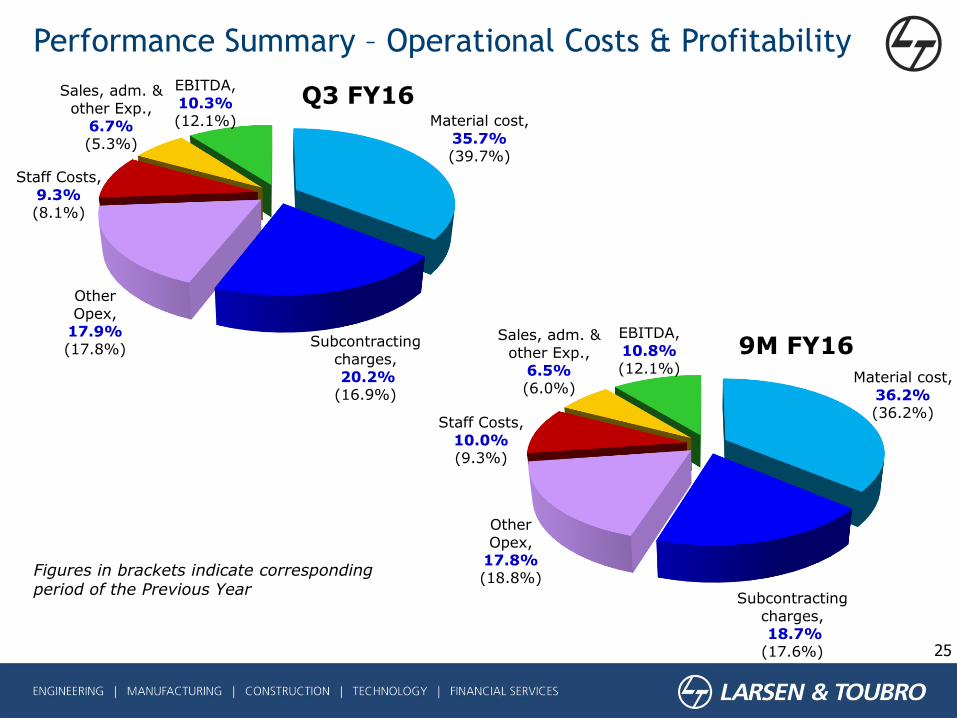
Performance Summary – Operational Costs & Profitability
Material cost,
35.7%(39.7%)
Subcontracting
charges,20.2%
(16.9%)
Other
Opex, 17.9%(17.8%)
Staff Costs,
9.3%(8.1%)
Sales, adm. &
other Exp., 6.7%(5.3%)
EBITDA,
10.3%(12.1%)
Q3 FY16
25
Material cost,
36.2%(36.2%)
Subcontracting
charges,18.7%
(17.6%)
Other
Opex, 17.8%(18.8%)
Staff Costs,
10.0%(9.3%)
Sales, adm. &
other Exp., 6.5%(6.0%)
EBITDA,
10.8%(12.1%)
9M FY16
Figures in brackets indicate corresponding period of the Previous Year
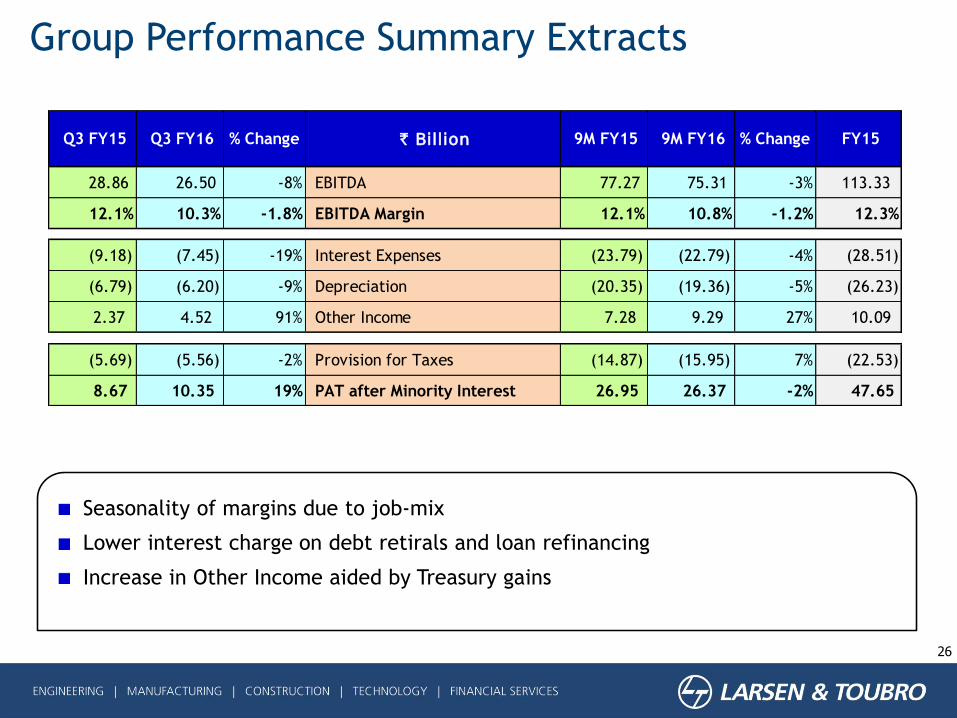
Group Performance Summary Extracts
26
Seasonality of margins due to job-mix
Lower interest charge on debt retirals and loan refinancing
Increase in Other Income aided by Treasury gains
Q3 FY15 Q3 FY16 % Change ` Billion 9M FY15 9M FY16 % Change FY15
28.86 26.50 -8% EBITDA 77.27 75.31 -3% 113.33
12.1% 10.3% -1.8% EBITDA Margin 12.1% 10.8% -1.2% 12.3%
(9.18) (7.45) -19% Interest Expenses (23.79) (22.79) -4% (28.51)
(6.79) (6.20) -9% Depreciation (20.35) (19.36) -5% (26.23)
2.37 4.52 91% Other Income 7.28 9.29 27% 10.09
(5.69) (5.56) -2% Provision for Taxes (14.87) (15.95) 7% (22.53)
8.67 10.35 19% PAT after Minority Interest 26.95 26.37 -2% 47.65
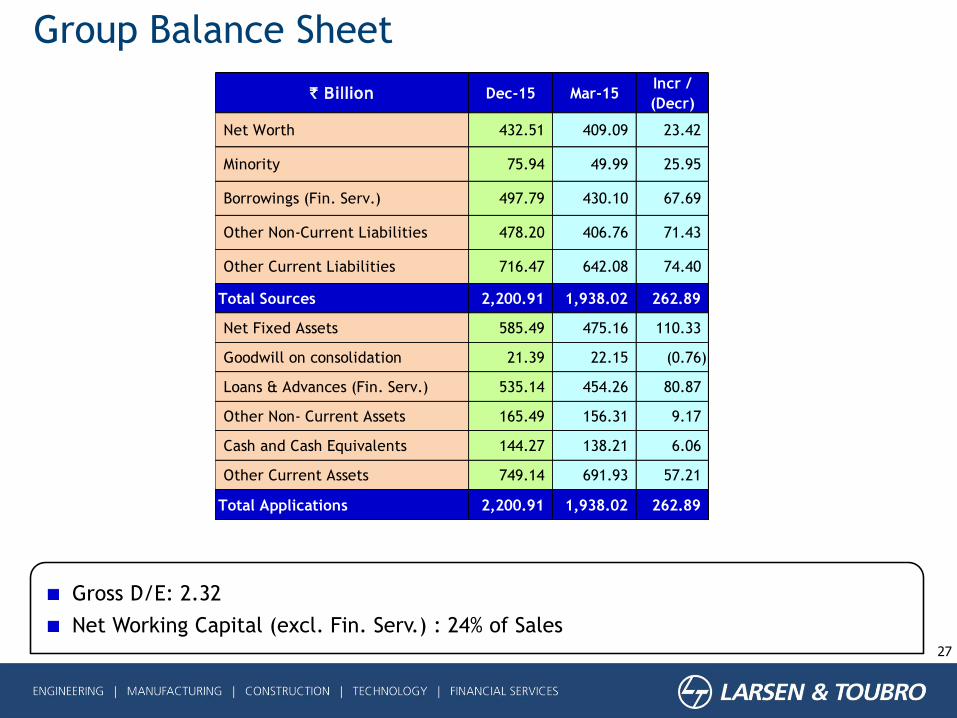
Group Balance Sheet
27
Gross D/E: 2.32
Net Working Capital (excl. Fin. Serv.) : 24% of Sales
` Billion Dec-15 Mar-15Incr /
(Decr)
Net Worth 432.51 409.09 23.42
Minority 75.94 49.99 25.95
Borrowings (Fin. Serv.) 497.79 430.10 67.69
Other Non-Current Liabilities 478.20 406.76 71.43
Other Current Liabilities 716.47 642.08 74.40
Total Sources 2,200.91 1,938.02 262.89
Net Fixed Assets 585.49 475.16 110.33
Goodwill on consolidation 21.39 22.15 (0.76)
Loans & Advances (Fin. Serv.) 535.14 454.26 80.87
Other Non- Current Assets 165.49 156.31 9.17
Cash and Cash Equivalents 144.27 138.21 6.06
Other Current Assets 749.14 691.93 57.21
Total Applications 2,200.91 1,938.02 262.89
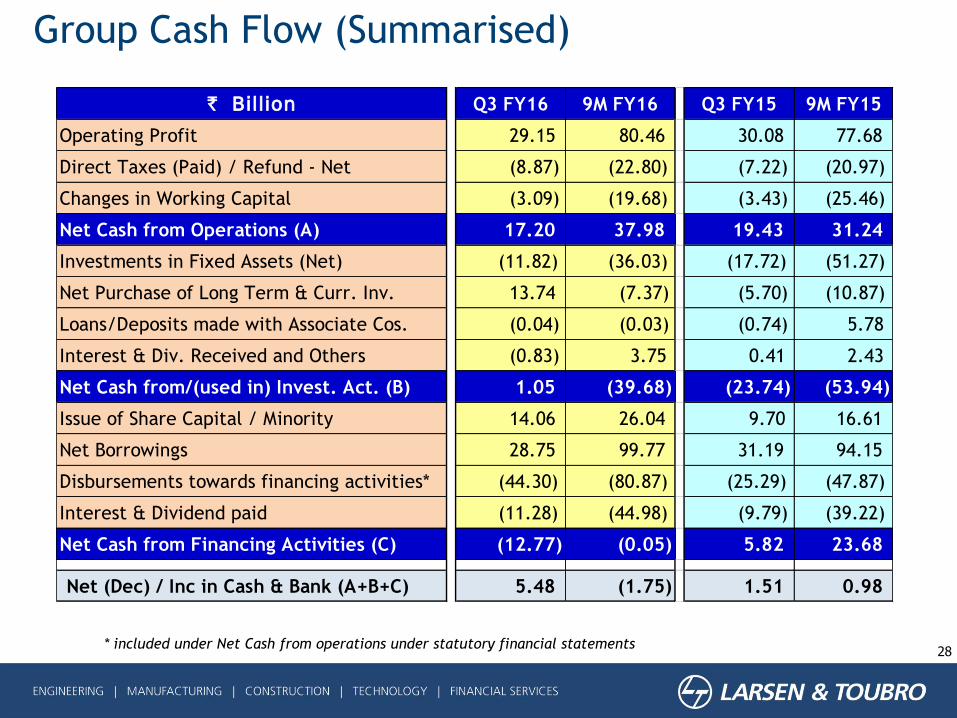
Group Cash Flow (Summarised)
28* included under Net Cash from operations under statutory financial statements
` Billion Q3 FY16 9M FY16 Q3 FY15 9M FY15
Operating Profit 29.15 80.46 30.08 77.68
Direct Taxes (Paid) / Refund - Net (8.87) (22.80) (7.22) (20.97)
Changes in Working Capital (3.09) (19.68) (3.43) (25.46)
Net Cash from Operations (A) 17.20 37.98 19.43 31.24
Investments in Fixed Assets (Net) (11.82) (36.03) (17.72) (51.27)
Net Purchase of Long Term & Curr. Inv. 13.74 (7.37) (5.70) (10.87)
Loans/Deposits made with Associate Cos. (0.04) (0.03) (0.74) 5.78
Interest & Div. Received and Others (0.83) 3.75 0.41 2.43
Net Cash from/(used in) Invest. Act. (B) 1.05 (39.68) (23.74) (53.94)
Issue of Share Capital / Minority 14.06 26.04 9.70 16.61
Net Borrowings 28.75 99.77 31.19 94.15
Disbursements towards financing activities* (44.30) (80.87) (25.29) (47.87)
Interest & Dividend paid (11.28) (44.98) (9.79) (39.22)
Net Cash from Financing Activities (C) (12.77) (0.05) 5.82 23.68
Net (Dec) / Inc in Cash & Bank (A+B+C) 5.48 (1.75) 1.51 0.98
29
Segment Performance Analysis
30
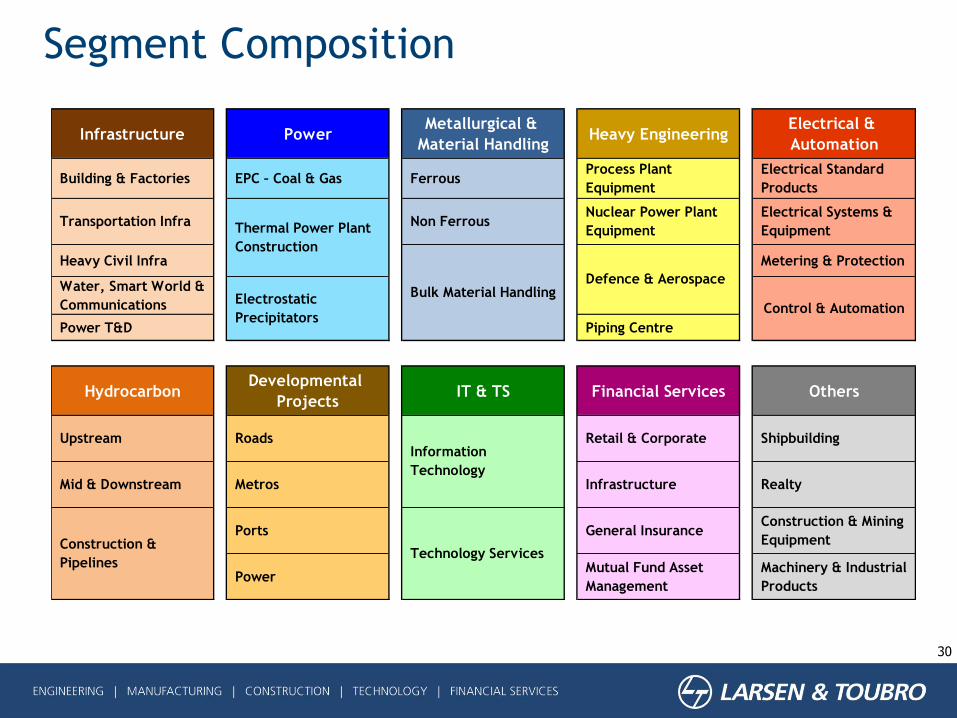
Segment Composition
Infrastructure PowerMetallurgical &
Material HandlingHeavy Engineering
Electrical &
Automation
Building & Factories EPC – Coal & Gas FerrousProcess Plant
Equipment
Electrical Standard
Products
Transportation Infra Non FerrousNuclear Power Plant
Equipment
Electrical Systems &
Equipment
Heavy Civil Infra Metering & Protection
Water, Smart World &
Communications
Power T&D Piping Centre
HydrocarbonDevelopmental
ProjectsIT & TS Financial Services Others
Upstream Roads Retail & Corporate Shipbuilding
Mid & Downstream Metros Infrastructure Realty
Ports General InsuranceConstruction & Mining
Equipment
Power Mutual Fund Asset
Management
Machinery & Industrial
Products
Construction &
Pipelines
Control & AutomationElectrostatic
Precipitators
Technology Services
Information
Technology
Bulk Material Handling
Thermal Power Plant
Construction
Defence & Aerospace
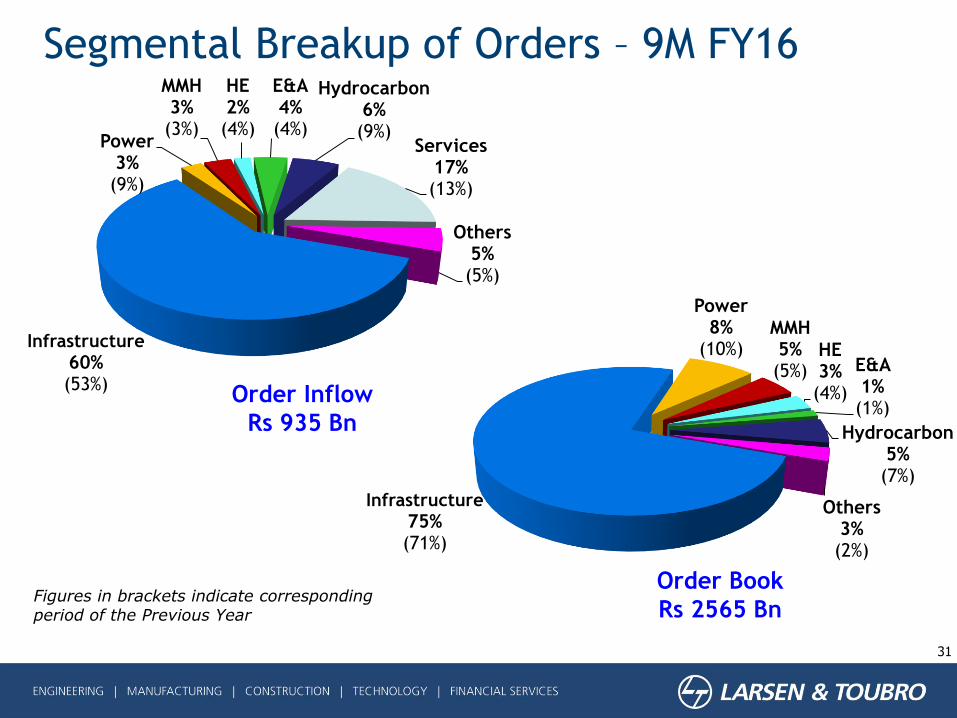
Infrastructure
75%(71%)
Power8%
(10%)MMH5%(5%)
HE3%(4%)
E&A 1%(1%)
Hydrocarbon5%(7%)
Others3%(2%)
Order Book
Rs 2565 Bn
31
Segmental Breakup of Orders – 9M FY16
Infrastructure
60%(53%)
Power3%(9%)
MMH3%(3%)
HE2%(4%)
E&A4%(4%)
Hydrocarbon6%(9%)
Services17%(13%)
Others5%(5%)
Figures in brackets indicate corresponding period of the Previous Year
Order Inflow
Rs 935 Bn
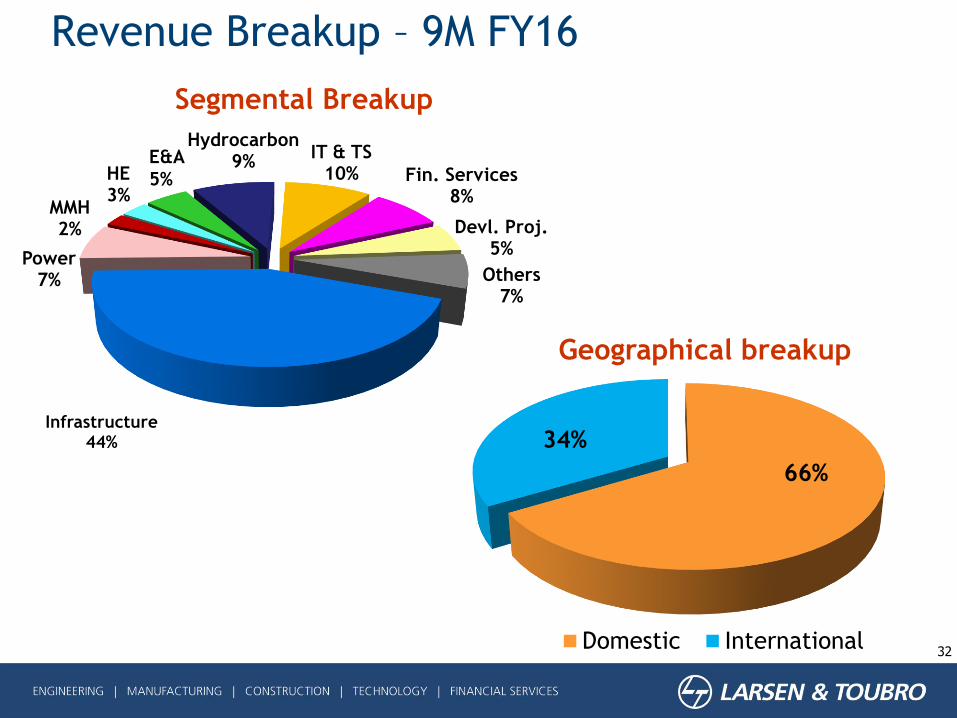
66%
34%
Geographical breakup
Domestic International
Infrastructure44%
MMH2%
Power7%
HE3%
Hydrocarbon9%
IT & TS10% Fin. Services
8%
Devl. Proj.5%
Others7%
Segmental Breakup
32
Revenue Breakup – 9M FY16
E&A
5%
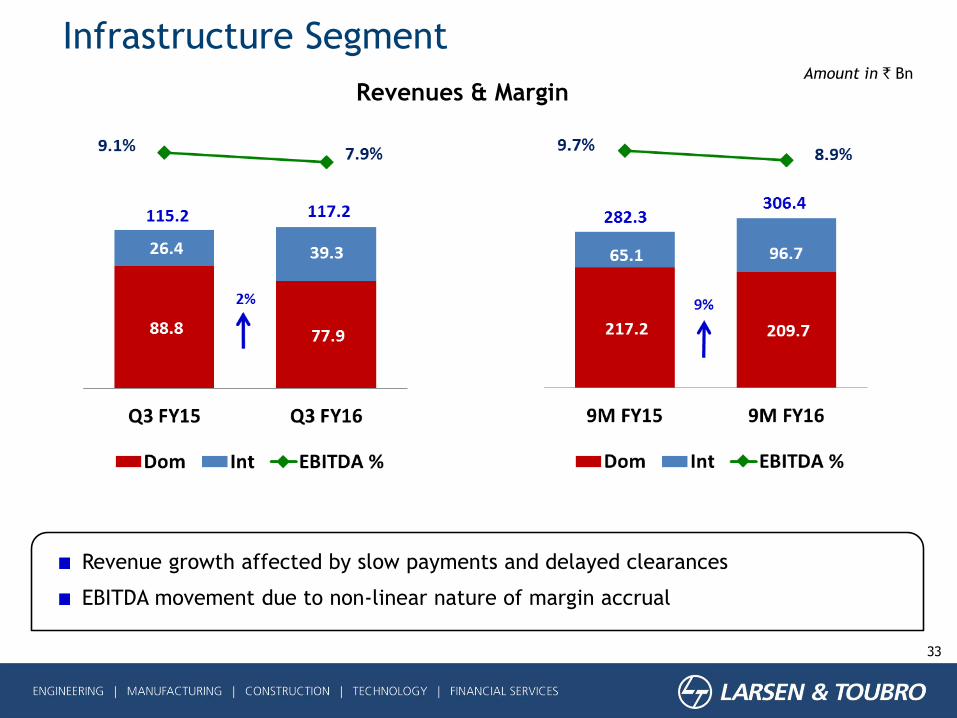
Infrastructure Segment
33
Amount in ` Bn
Revenue growth affected by slow payments and delayed clearances
EBITDA movement due to non-linear nature of margin accrual
Revenues & Margin
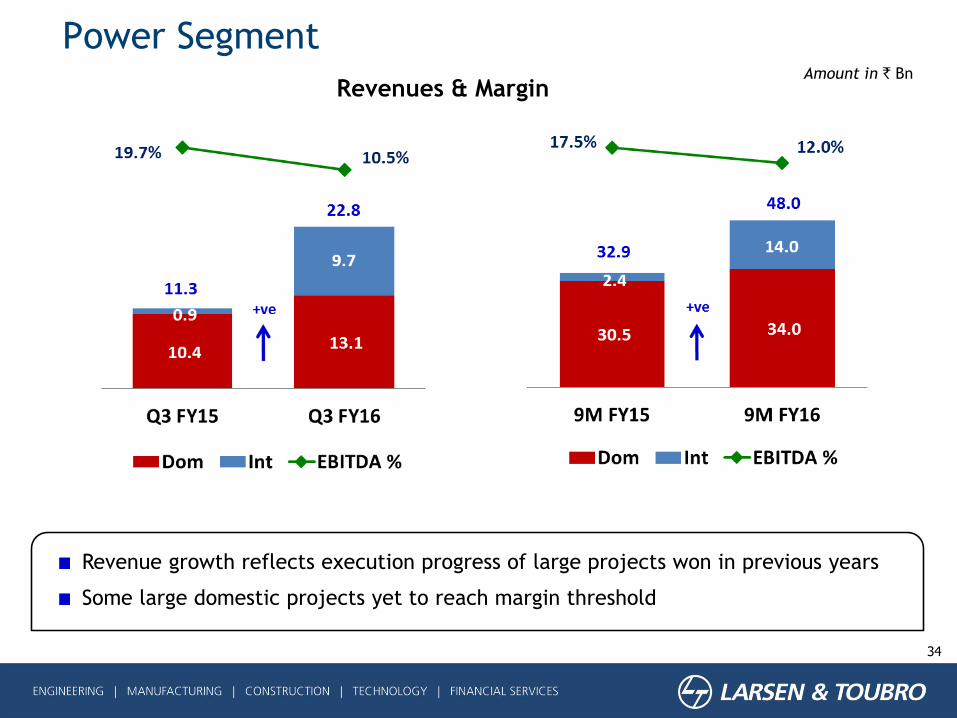
Power Segment
34
Amount in ` Bn
Revenue growth reflects execution progress of large projects won in previous years
Some large domestic projects yet to reach margin threshold
Revenues & Margin
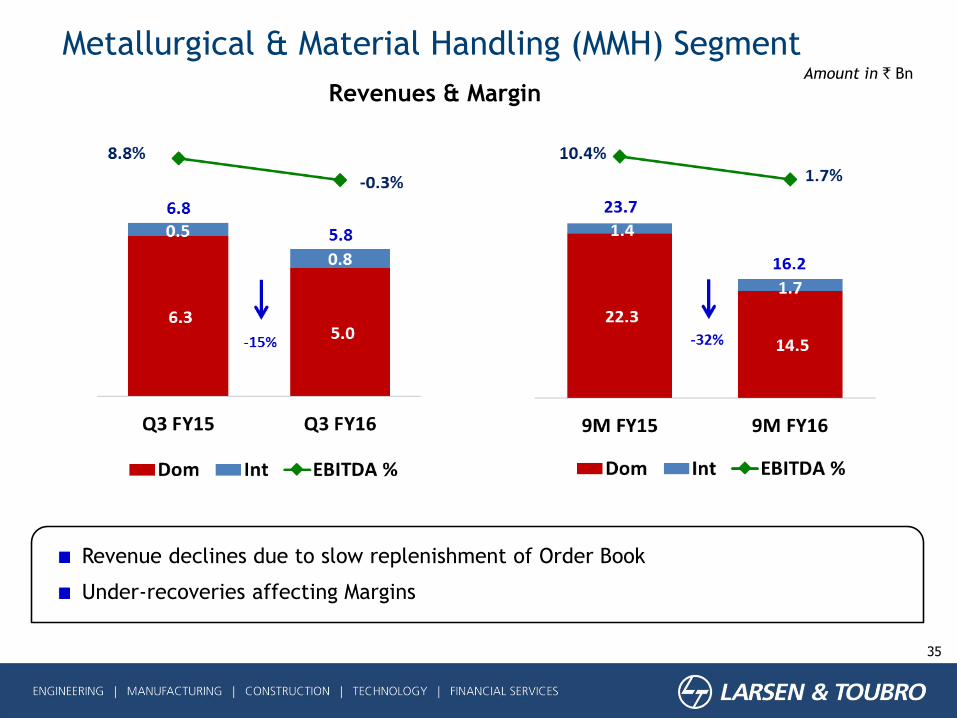
Revenue declines due to slow replenishment of Order Book
Under-recoveries affecting Margins
35
Amount in ` Bn
Metallurgical & Material Handling (MMH) Segment
Revenues & Margin
Muted revenue growth reflecting depleted Order Book in PPN Business
Margins impacted by under-recoveries and cost provisions
36
Amount in ` Bn
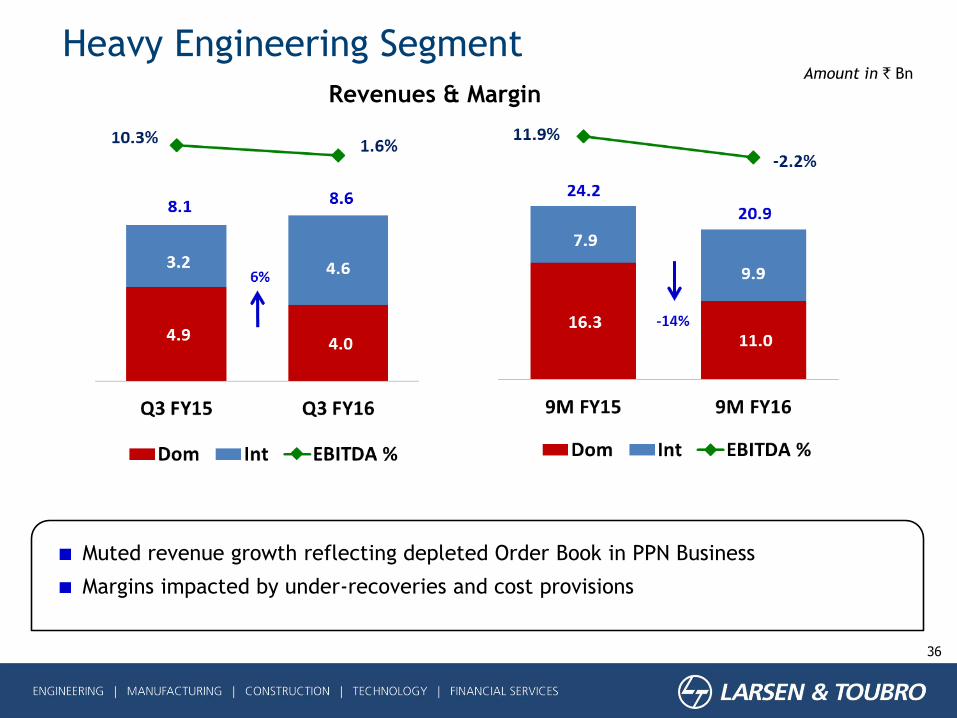
Heavy Engineering Segment
Revenues & Margin
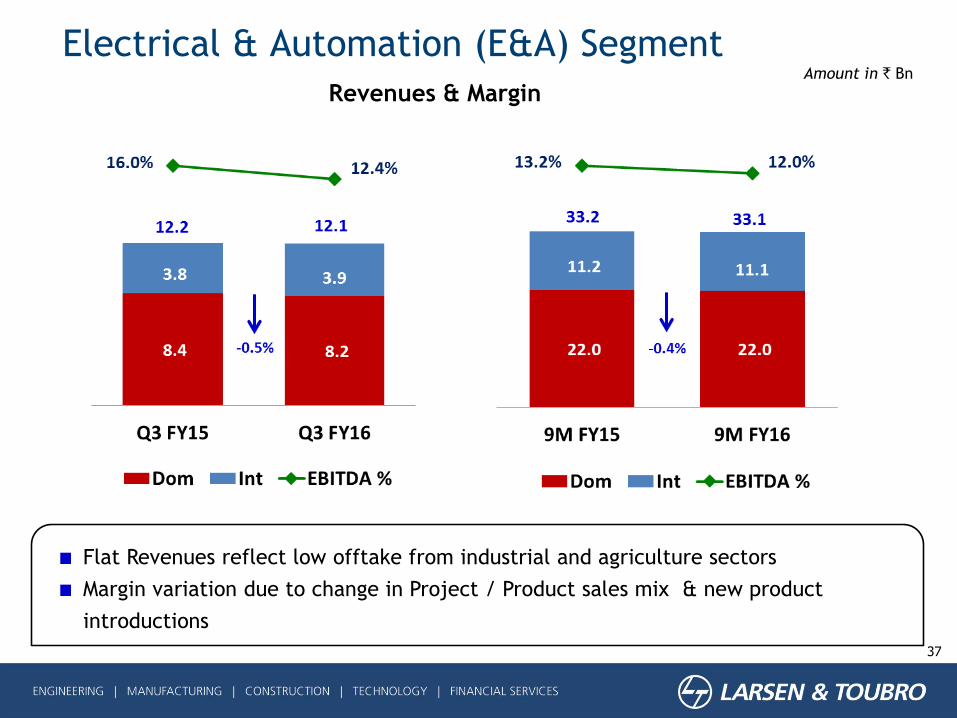
Flat Revenues reflect low offtake from industrial and agriculture sectors
Margin variation due to change in Project / Product sales mix & new product
introductions
37
Amount in ` Bn
Electrical & Automation (E&A) Segment
Revenues & Margin
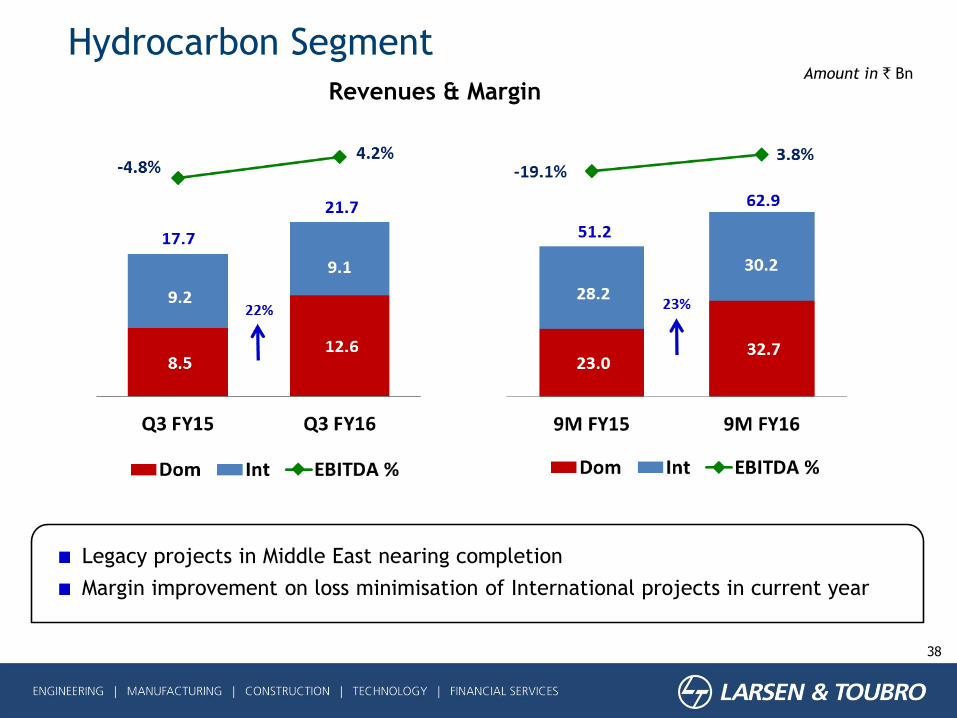
Legacy projects in Middle East nearing completion
Margin improvement on loss minimisation of International projects in current year
38
Hydrocarbon SegmentAmount in ` Bn
Revenues & Margin
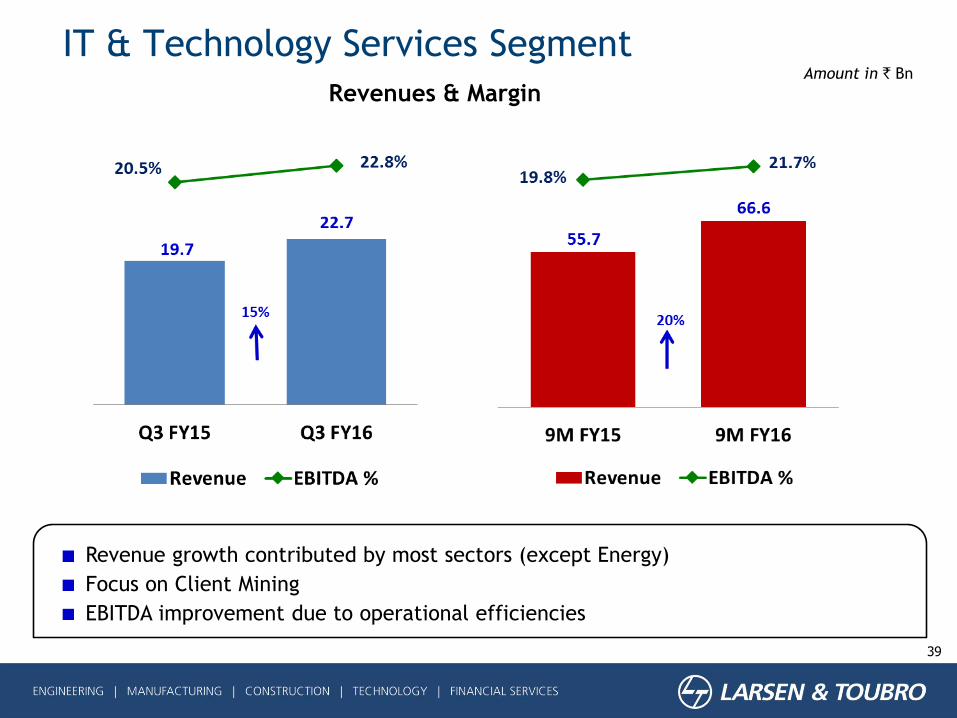
Revenue growth contributed by most sectors (except Energy)
Focus on Client Mining
EBITDA improvement due to operational efficiencies
39
Amount in ` Bn
IT & Technology Services Segment
Revenues & Margin
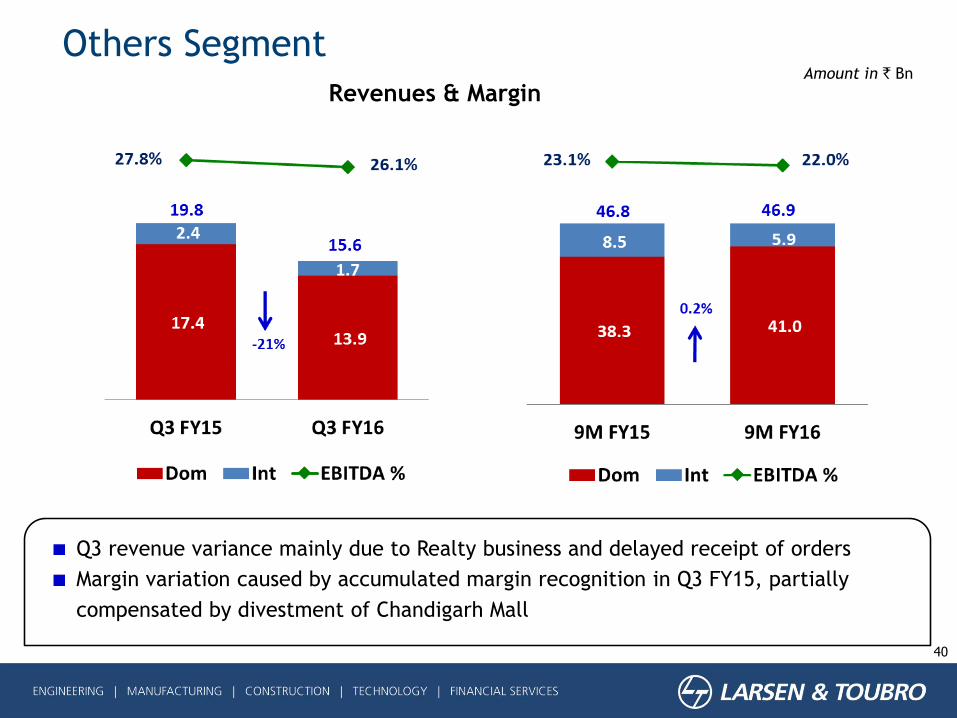
Q3 revenue variance mainly due to Realty business and delayed receipt of orders
Margin variation caused by accumulated margin recognition in Q3 FY15, partially
compensated by divestment of Chandigarh Mall
40
Amount in ` Bn
Others Segment
Revenues & Margin
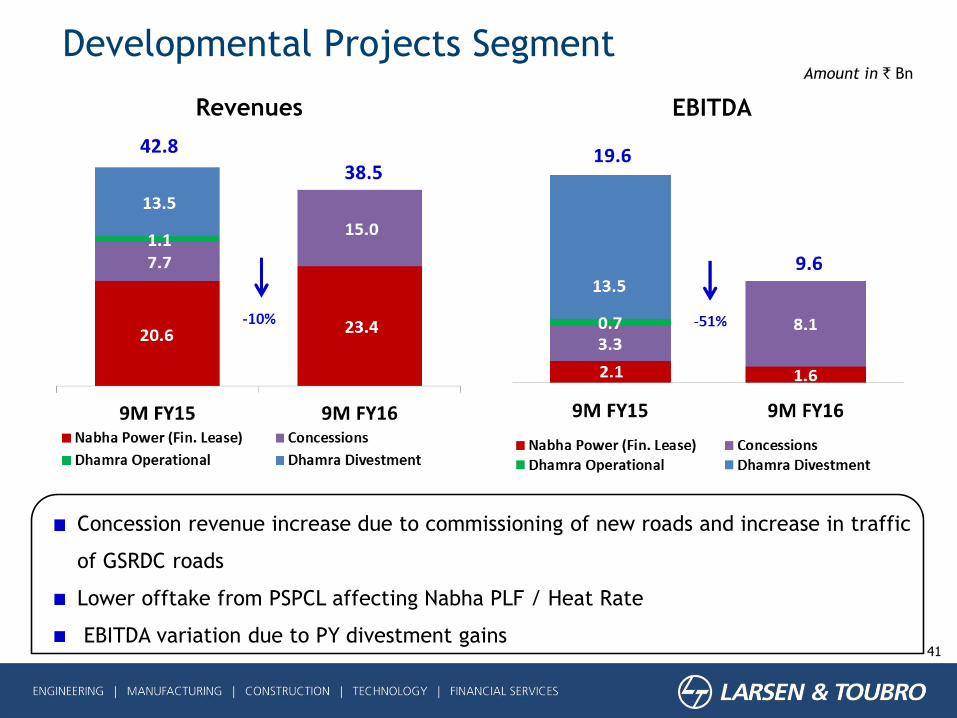
Concession revenue increase due to commissioning of new roads and increase in traffic
of GSRDC roads
Lower offtake from PSPCL affecting Nabha PLF / Heat Rate
EBITDA variation due to PY divestment gains41
Amount in ` Bn
Developmental Projects Segment
Revenues EBITDA
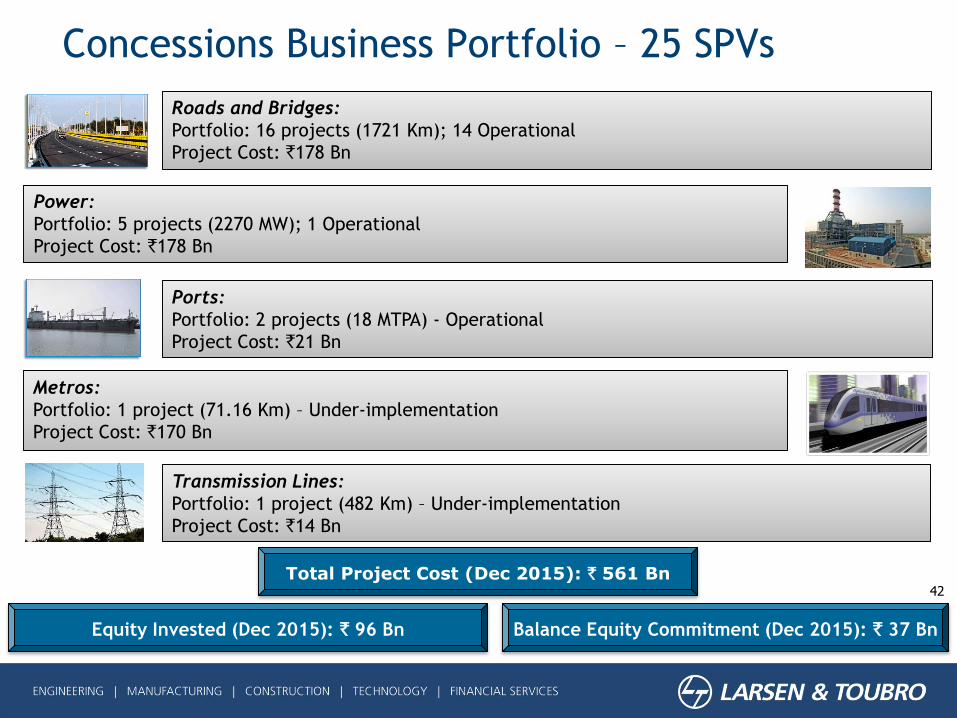
Balance Equity Commitment (Dec 2015): ` 37 Bn
Total Project Cost (Dec 2015): ` 561 Bn
Equity Invested (Dec 2015): ` 96 Bn
42
Roads and Bridges:
Portfolio: 16 projects (1721 Km); 14 Operational
Project Cost: `178 Bn
Power:
Portfolio: 5 projects (2270 MW); 1 Operational
Project Cost: `178 Bn
Ports:
Portfolio: 2 projects (18 MTPA) - Operational
Project Cost: `21 Bn
Metros:
Portfolio: 1 project (71.16 Km) – Under-implementation
Project Cost: `170 Bn
Transmission Lines:
Portfolio: 1 project (482 Km) – Under-implementation
Project Cost: `14 Bn
Concessions Business Portfolio – 25 SPVs
43
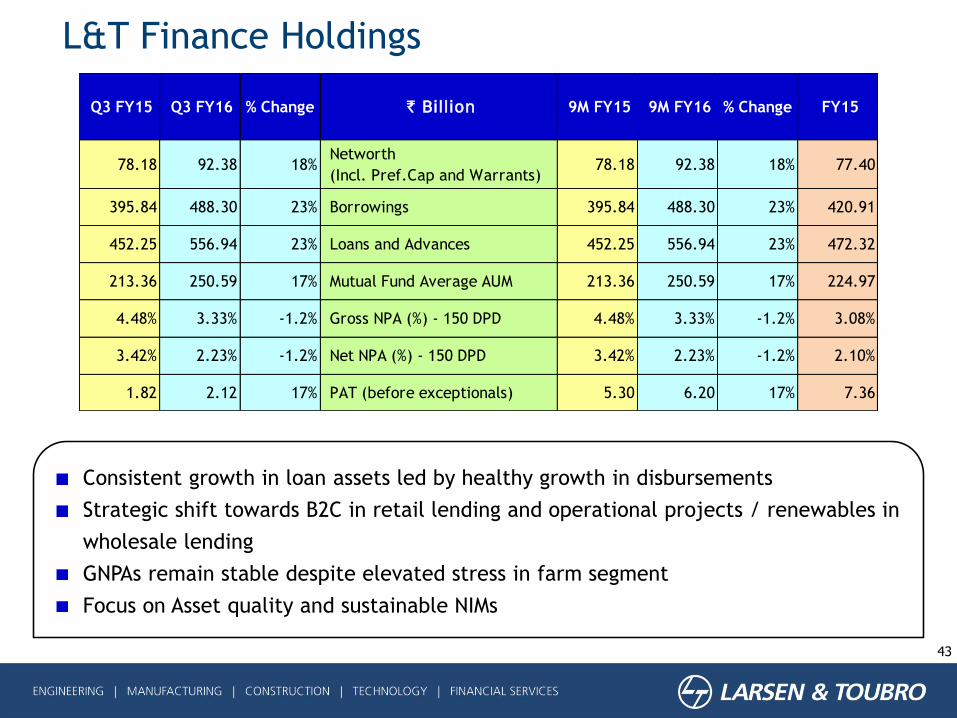
L&T Finance Holdings
Q3 FY15 Q3 FY16 % Change ` Billion 9M FY15 9M FY16 % Change FY15
78.18 92.38 18%Networth
(Incl. Pref.Cap and Warrants) 78.18 92.38 18% 77.40
395.84 488.30 23% Borrowings 395.84 488.30 23% 420.91
452.25 556.94 23% Loans and Advances 452.25 556.94 23% 472.32
213.36 250.59 17% Mutual Fund Average AUM 213.36 250.59 17% 224.97
4.48% 3.33% -1.2% Gross NPA (%) - 150 DPD 4.48% 3.33% -1.2% 3.08%
3.42% 2.23% -1.2% Net NPA (%) - 150 DPD 3.42% 2.23% -1.2% 2.10%
1.82 2.12 17% PAT (before exceptionals) 5.30 6.20 17% 7.36
Consistent growth in loan assets led by healthy growth in disbursements
Strategic shift towards B2C in retail lending and operational projects / renewables in
wholesale lending
GNPAs remain stable despite elevated stress in farm segment
Focus on Asset quality and sustainable NIMs
44
Presentation Outline
L&T Overview
Business Overview
Group Performance
Sectoral opportunities &
Outlook
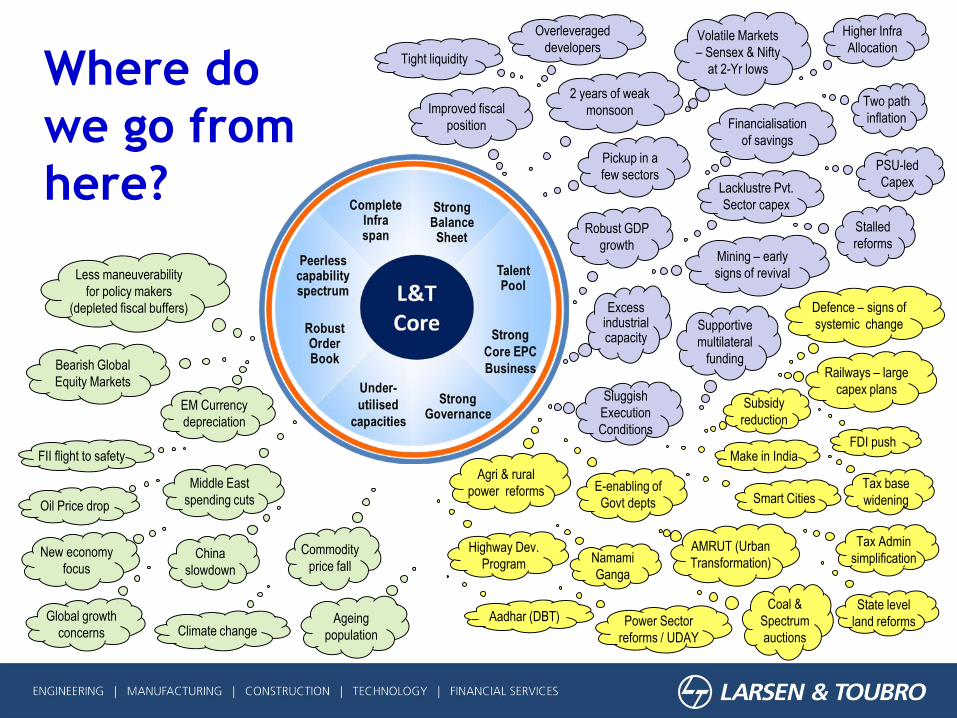
Volatile Markets
– Sensex & Nifty
at 2-Yr lows
Lacklustre Pvt.
Sector capex
Higher Infra
Allocation
PSU-led
Capex
Supportive
multilateral
funding
Improved fiscal
position
2 years of weak
monsoon
Pickup in a
few sectors
Robust GDP
growth
Two path
inflation
Stalled
reforms
Defence – signs of
systemic change
Mining – early
signs of revival
Bearish Global
Equity Markets
China
slowdown
EM Currency
depreciation
Commodity
price fall
Oil Price drop
Middle East
spending cuts
Global growth
concerns Climate change
New economy
focus
Make in India
Smart Cities
FDI push
Power Sector
reforms / UDAY
Highway Dev.
Program
Aadhar (DBT)
Subsidy
reduction
Tax Admin
simplification
Tax base
widening
Coal &
Spectrum
auctions
State level
land reforms
E-enabling of
Govt depts
AMRUT (Urban
Transformation)Namami
Ganga
Agri & rural
power reforms
Financialisation
of savings
Where do
we go from
here?
Railways – large
capex plans
Excess industrial capacity
Tight liquidity
Overleveraged
developers
Ageing
population
Less maneuverability
for policy makers
(depleted fiscal buffers)
FII flight to safety
Sluggish
Execution
Conditions
Infrastructure Segment – Urban Infra
46
Opportunities:
High end residential projects by cash rich developers
Affordable housing projects by Private developers
and Mass housing projects by Urban Authorities with
focus on Housing For All targets
Office space build-out by IT majors
Healthcare capacity expansion in India & Middle East
Greenfield Airports and Brownfield expansions
Thrust on Education facility expansion by Govt
New Manufacturing facilities under Make In India as
well as capacity expansions in light engg. and
Cement
Presence :
Residential & Commercial Buildings, IT & Office Space,
Hospitals, Shopping Malls, Educational Institutions,
Luxury Hotels, Airport Terminals, and Factory
Buildings
Infrastructure Segment – Transportation Infra
47
Opportunities:
Increased road build-out by NHAI with current focus on
EPC projects
Expressway projects by State Governments
Elevated corridors and Ring Roads in major cities
Dedicated Freight Corridor program
Track modernisation and expansion by Indian Railways
Railway Station modernisation
Airport runways
Highway projects in Middle East
Presence :
Roads, Elevated Corridors, Railway Construction &
Airport Runways
Infrastructure Segment – Heavy Civil Infra
48
Opportunities:
Metro & Mono Rail projects planned in multiple cities
across India (to decongest urban traffic)
Thrust on connectivity to hilly states (J&K,
Arunachal, Himachal) with Tunnels and Border Roads
Major road and railway bridges and sea links
Increased spends on infrastructure facilities for
armed forces
Thrust being given by Govt on increasing nuclear
power installed base
Presence :
Metro Railways, Monorails, Hydel Power Plant
construction, Nuclear (civil) plant construction,
Defence Infrastructure, Special Bridges and Tunnels
Infrastructure Segment – Water, Smart World & Communication
49
Opportunities:
Thrust on water infra due to growing scarcity in India
Waste water treatment plants from municipalities
Lift irrigation programs
Thrust on river water pollution prevention including
Namami Gange program
Effluent treatment plants in Industrial units/clusters
Thrust on Water recycling, conservation, Desalination
and availability improvement in Middle East
Defence sector fibre optic connectivity projects
Smart cities: Security solutions and intra-city
telecom connectivity
Presence :
Bulk transmission of water, water treatment, waste
water treatment, sewage rehabilitation, effluent
treatment, telecom infrastructure and security
systems
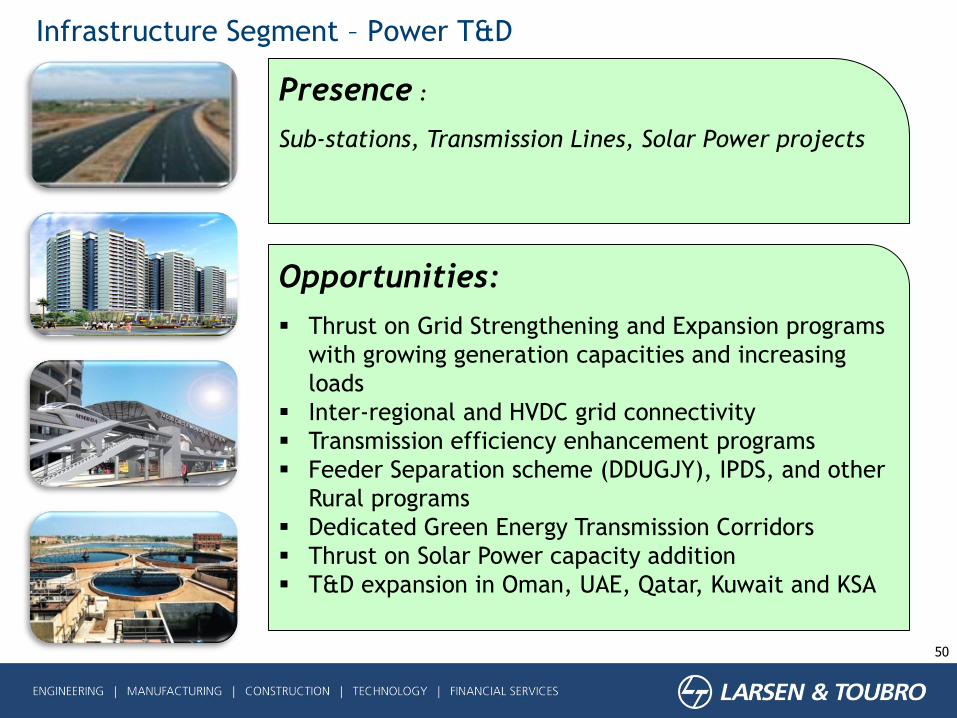
Infrastructure Segment – Power T&D
50
Opportunities:
Thrust on Grid Strengthening and Expansion programs
with growing generation capacities and increasing
loads
Inter-regional and HVDC grid connectivity
Transmission efficiency enhancement programs
Feeder Separation scheme (DDUGJY), IPDS, and other
Rural programs
Dedicated Green Energy Transmission Corridors
Thrust on Solar Power capacity addition
T&D expansion in Oman, UAE, Qatar, Kuwait and KSA
Presence :
Sub-stations, Transmission Lines, Solar Power projects
Infrastructure Segment – Challenges
51
Major Challenges in Infrastructure:
Investment constraints
Lending capacity of Banking system
Lack of private sector interest in PPP projects
Land acquisition
Government Funding
Environmental Clearances
Slow evolution of policy frameworks
Pace of awards and execution
Oil price-led fiscal deficits in Middle East
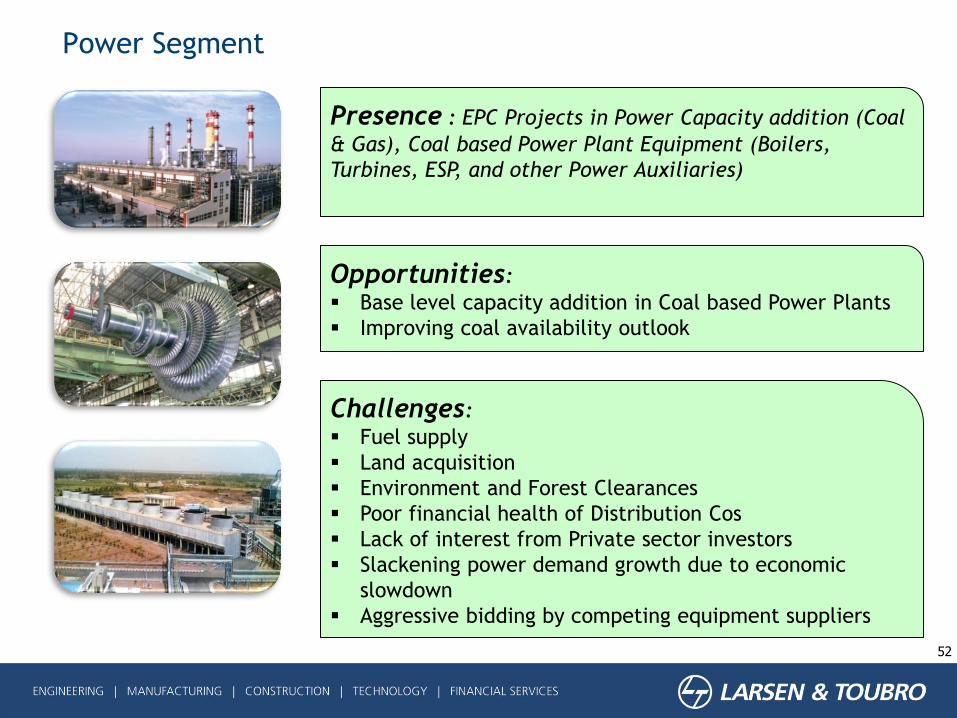
Power Segment
52
Presence : EPC Projects in Power Capacity addition (Coal
& Gas), Coal based Power Plant Equipment (Boilers,
Turbines, ESP, and other Power Auxiliaries)
Challenges:
Fuel supply
Land acquisition
Environment and Forest Clearances
Poor financial health of Distribution Cos
Lack of interest from Private sector investors
Slackening power demand growth due to economic
slowdown
Aggressive bidding by competing equipment suppliers
Opportunities:
Base level capacity addition in Coal based Power Plants
Improving coal availability outlook
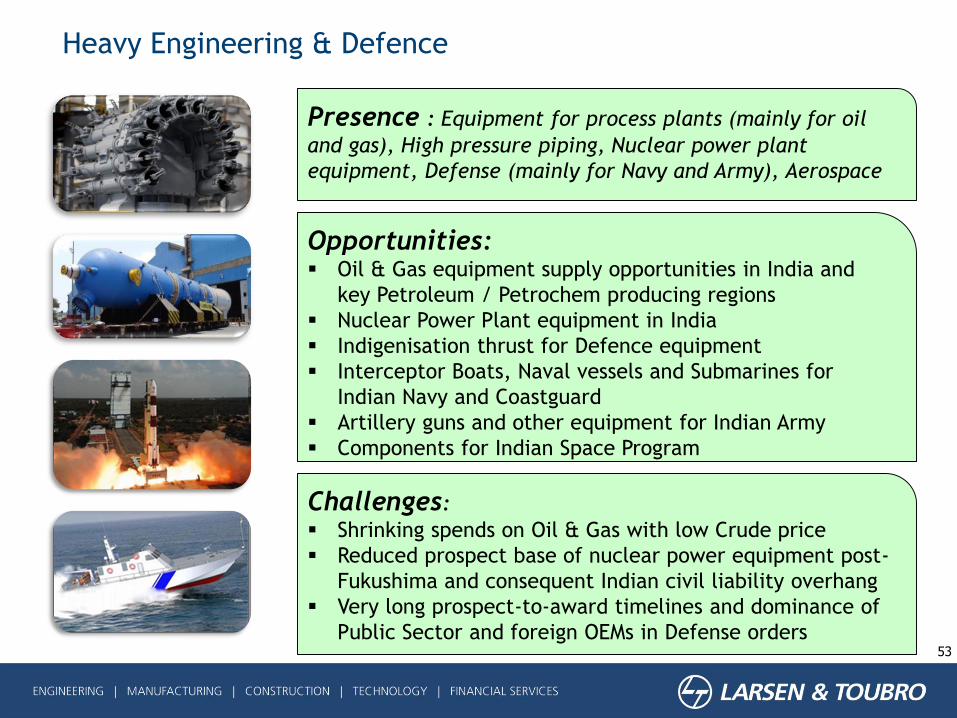
Heavy Engineering & Defence
53
Opportunities: Oil & Gas equipment supply opportunities in India and
key Petroleum / Petrochem producing regions
Nuclear Power Plant equipment in India
Indigenisation thrust for Defence equipment
Interceptor Boats, Naval vessels and Submarines for
Indian Navy and Coastguard
Artillery guns and other equipment for Indian Army
Components for Indian Space Program
Presence : Equipment for process plants (mainly for oil
and gas), High pressure piping, Nuclear power plant
equipment, Defense (mainly for Navy and Army), Aerospace
Challenges:
Shrinking spends on Oil & Gas with low Crude price
Reduced prospect base of nuclear power equipment post-
Fukushima and consequent Indian civil liability overhang
Very long prospect-to-award timelines and dominance of
Public Sector and foreign OEMs in Defense orders
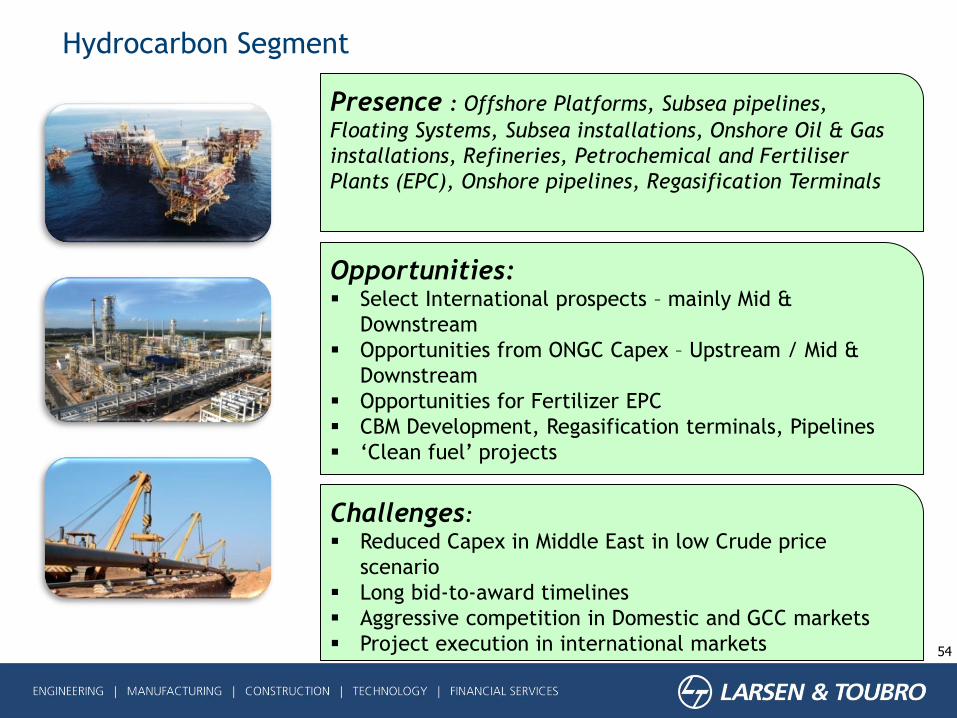
Hydrocarbon Segment
54
Opportunities: Select International prospects – mainly Mid &
Downstream
Opportunities from ONGC Capex – Upstream / Mid &
Downstream
Opportunities for Fertilizer EPC
CBM Development, Regasification terminals, Pipelines
‘Clean fuel’ projects
Presence : Offshore Platforms, Subsea pipelines,
Floating Systems, Subsea installations, Onshore Oil & Gas
installations, Refineries, Petrochemical and Fertiliser
Plants (EPC), Onshore pipelines, Regasification Terminals
Challenges:
Reduced Capex in Middle East in low Crude price
scenario
Long bid-to-award timelines
Aggressive competition in Domestic and GCC markets
Project execution in international markets
Thank You
55
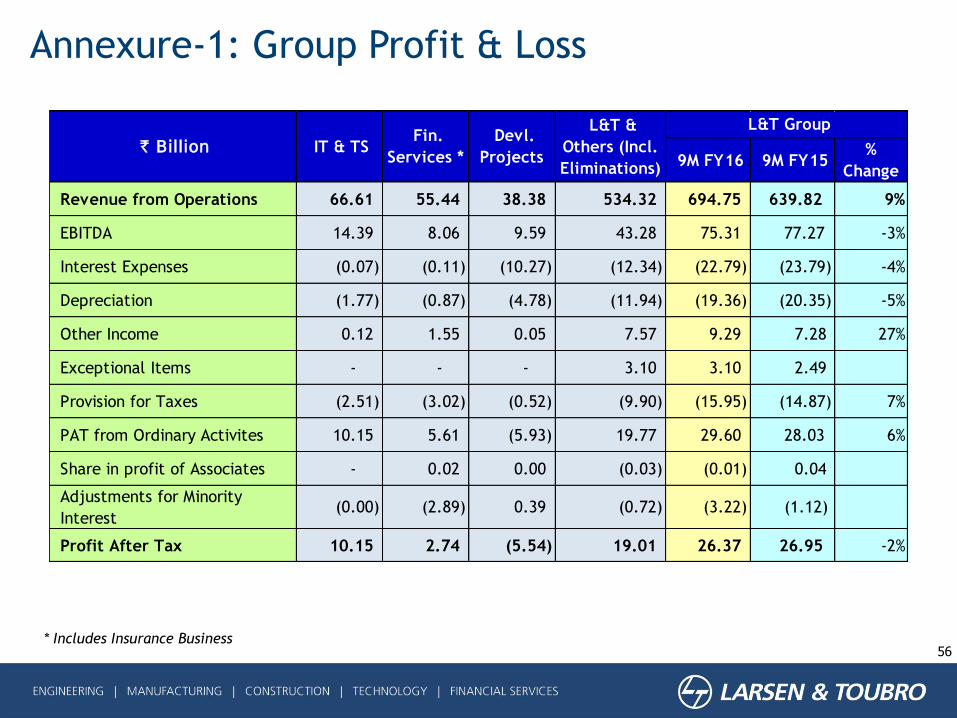
Annexure-1: Group Profit & Loss
56* Includes Insurance Business
9M FY16 9M FY15 %
Change
Revenue from Operations 66.61 55.44 38.38 534.32 694.75 639.82 9%
EBITDA 14.39 8.06 9.59 43.28 75.31 77.27 -3%
Interest Expenses (0.07) (0.11) (10.27) (12.34) (22.79) (23.79) -4%
Depreciation (1.77) (0.87) (4.78) (11.94) (19.36) (20.35) -5%
Other Income 0.12 1.55 0.05 7.57 9.29 7.28 27%
Exceptional Items - - - 3.10 3.10 2.49
Provision for Taxes (2.51) (3.02) (0.52) (9.90) (15.95) (14.87) 7%
PAT from Ordinary Activites 10.15 5.61 (5.93) 19.77 29.60 28.03 6%
Share in profit of Associates - 0.02 0.00 (0.03) (0.01) 0.04
Adjustments for Minority
Interest(0.00) (2.89) 0.39 (0.72) (3.22) (1.12)
Profit After Tax 10.15 2.74 (5.54) 19.01 26.37 26.95 -2%
L&T Group
` Billion IT & TS Fin.
Services *
Devl.
Projects
L&T &
Others (Incl.
Eliminations)
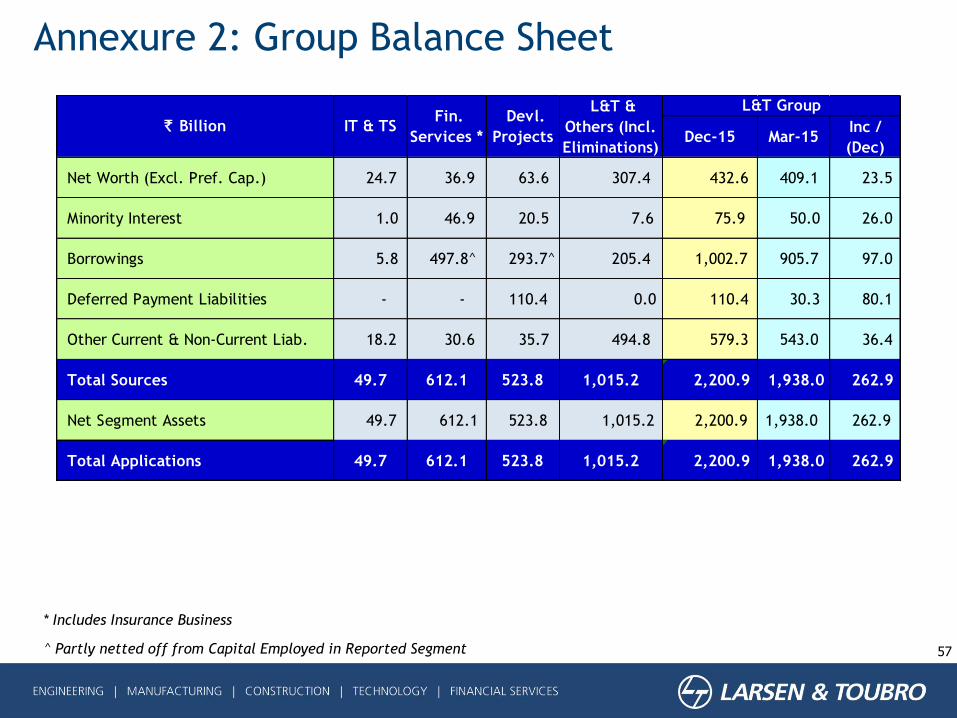
Annexure 2: Group Balance Sheet
57
* Includes Insurance Business
^ Partly netted off from Capital Employed in Reported Segment
Dec-15 Mar-15Inc /
(Dec)
Net Worth (Excl. Pref. Cap.) 24.7 36.9 63.6 307.4 432.6 409.1 23.5
Minority Interest 1.0 46.9 20.5 7.6 75.9 50.0 26.0
Borrowings 5.8 497.8^ 293.7^ 205.4 1,002.7 905.7 97.0
Deferred Payment Liabilities - - 110.4 0.0 110.4 30.3 80.1
Other Current & Non-Current Liab. 18.2 30.6 35.7 494.8 579.3 543.0 36.4
Total Sources 49.7 612.1 523.8 1,015.2 2,200.9 1,938.0 262.9
Net Segment Assets 49.7 612.1 523.8 1,015.2 2,200.9 1,938.0 262.9
Total Applications 49.7 612.1 523.8 1,015.2 2,200.9 1,938.0 262.9
L&T Group
` Billion IT & TS Fin.
Services *
Devl.
Projects
L&T &
Others (Incl.
Eliminations)