Embed Size (px)
Citation preview
Lars Holstein, FAV Berlin
Helsinki, April 2003
METROPOLISExchanging experiences on Innovation in Metropolitan Regions
The European Commission
Innovation Innovation & SME & SME
Thematic Group: Innovation Regional Indicators
'SMARTGROWTH Indicator Project –
Centres of Competence in Transport & Mobility'
Contact: [email protected]
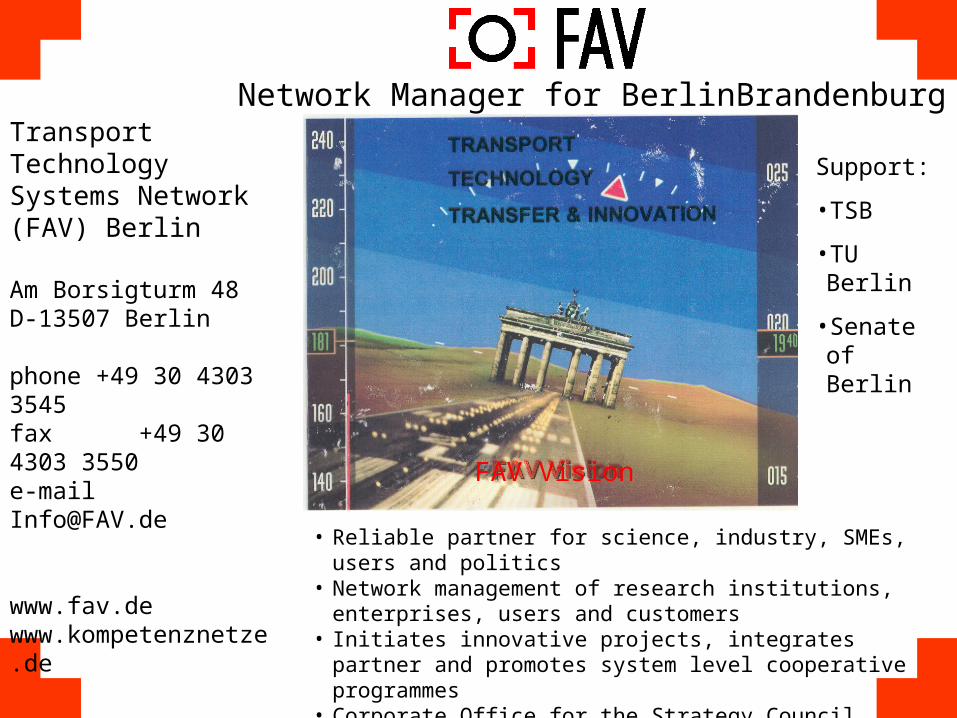
Network Manager for BerlinBrandenburg
• Reliable partner for science, industry, SMEs, users and politics• Network management of research institutions, enterprises,
users and customers• Initiates innovative projects, integrates partner and promotes
system level cooperative programmes• Corporate Office for the Strategy Council Transport and
Mobility BerlinBrandenburg
FAV Vision
Transport Technology Systems Network (FAV) Berlin
Am Borsigturm 48D-13507 Berlin
phone +49 30 4303 3545fax +49 30 4303 3550e-mail [email protected]
www.fav.dewww.kompetenznetze.de
Support:
•TSB
•TU Berlin
•Senate of Berlin
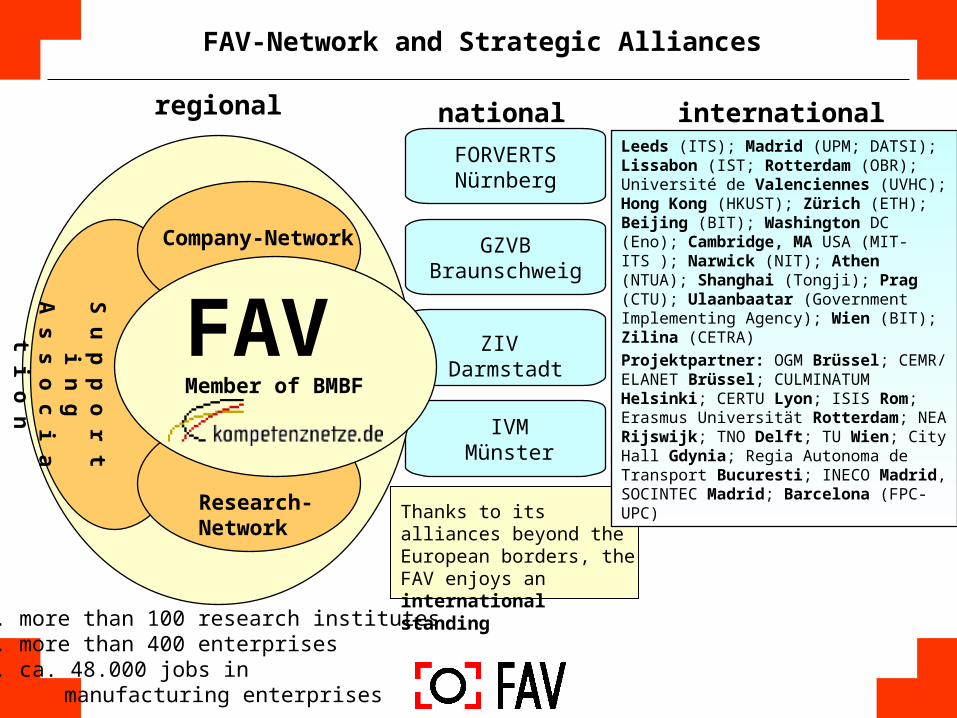
FAV-Network and Strategic Alliances
international
FAVMember of BMBF
Company-Network
Research-Network
nationalregional
GZVB Braunschweig
ZIV Darmstadt
IVMMünster
FORVERTS Nürnberg
S u
p p
o r t i n
gA
s s o c i a t i o
n
... more than 100 research institutes
... more than 400 enterprises
... ca. 48.000 jobs in manufacturing enterprises
Thanks to its alliances beyond the European borders, the FAV enjoys an international standing
Leeds (ITS); Madrid (UPM; DATSI); Lissabon (IST; Rotterdam (OBR); Université de Valenciennes (UVHC); Hong Kong (HKUST); Zürich (ETH); Beijing (BIT); Washington DC (Eno); Cambridge, MA USA (MIT-ITS ); Narwick (NIT); Athen (NTUA); Shanghai (Tongji); Prag (CTU); Ulaanbaatar (Government Implementing Agency); Wien (BIT); Zilina (CETRA)
Projektpartner: OGM Brüssel; CEMR/ ELANET Brüssel; CULMINATUM Helsinki; CERTU Lyon; ISIS Rom; Erasmus Universität Rotterdam; NEA Rijswijk; TNO Delft; TU Wien; City Hall Gdynia; Regia Autonoma de Transport Bucuresti; INECO Madrid, SOCINTEC Madrid; Barcelona (FPC-UPC)
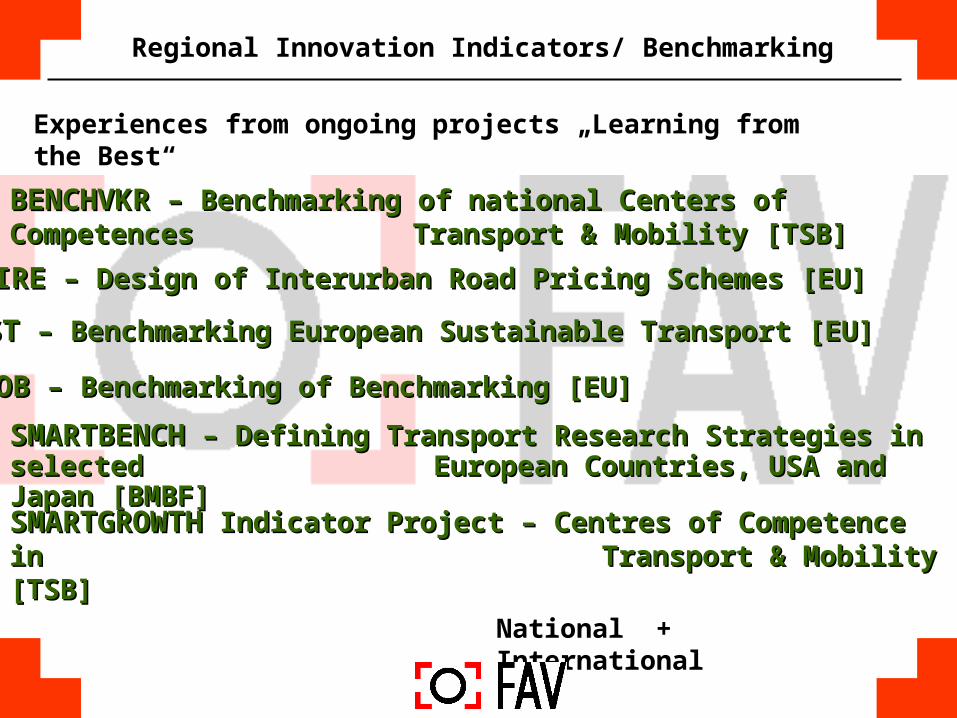
Regional Innovation Indicators/ Benchmarking
National + International
BESTBEST – Benchmarking European Sustainable Transport [EU] – Benchmarking European Sustainable Transport [EU]
BOBBOB – Benchmarking of Benchmarking [EU] – Benchmarking of Benchmarking [EU]
BENCHVKRBENCHVKR – Benchmarking of national Centers of Competences – Benchmarking of national Centers of Competences Transport & Mobility [TSB] Transport & Mobility [TSB]
DESIREDESIRE – Design of Interurban Road Pricing Schemes [EU] – Design of Interurban Road Pricing Schemes [EU]
SMARTBENCHSMARTBENCH – Defining Transport Research Strategies in selected – Defining Transport Research Strategies in selected European Countries, USA and Japan [BMBF] European Countries, USA and Japan [BMBF]
SMARTGROWTHSMARTGROWTH IndicatorIndicator Project – Centres of Competence in Project – Centres of Competence in Transport & Mobility Transport & Mobility [TSB][TSB]
Experiences from ongoing projects „Learning from the Best“
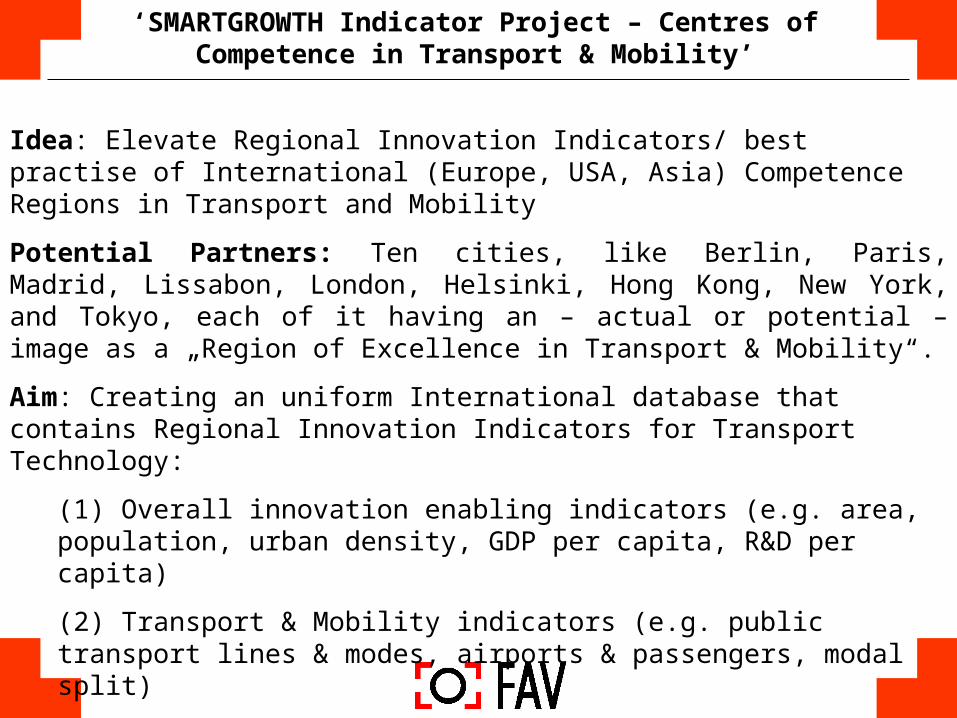
‘SMARTGROWTH Indicator Project – Centres of Competence in Transport & Mobility’
Idea: Elevate Regional Innovation Indicators/ best practise of International (Europe, USA, Asia) Competence Regions in Transport and Mobility
Potential Partners: Ten cities, like Berlin, Paris, Madrid, Lissabon, London, Helsinki, Hong Kong, New York, and Tokyo, each of it having an – actual or potential – image as a „Region of Excellence in Transport & Mobility“.
Aim: Creating an uniform International database that contains Regional Innovation Indicators for Transport Technology:
(1) Overall innovation enabling indicators (e.g. area, population, urban density, GDP per capita, R&D per capita)
(2) Transport & Mobility indicators (e.g. public transport lines & modes, airports & passengers, modal split)
(3) Transport Technology & Innovation (e.g. innovations in transport technology, regional SME & research capabilities, transport policy)
SMARTGROWTH should concentrate on innovative & complex solutions for transport & mobility in metropolitan areas:
• How is the regional innovation system organised?
• How is mobility organised to meet citizens´ needs and how is it supported by technologies?
• How do organisations (research, enterprises, operators, officials & poli-ticians) co-operate in order to push innovative solutions into application?
• Which – legal and political – frameworks are created in order to accelerate innovation?
SMARTGROWTH will not produce a large amount of incomparable figures, but it is to learn from other Metropolitan Areas.
SMARTGROWTHKey Issues

SMARTGROWTH
Call for partners in Metropolitan Areas
Potential partners shall achieve• Identifying key organizations -> listing key organizations & summarizing
the expertise of each. • Assessing activities of regional authorities with respect to their usefulness
in Metropolitan Areas/ Examining urban policy support to such kind of
approach -> Assemble descriptive documentation using the analysis
template.• Identifying important ongoing approaches of transport technologies
related developments.• Identifying specific individual expertise on transport telematics, railway
technology, city logistics, automotive engineering, and aeronautics.• Assisting FAV in organizing & conducting interviews with experts; joining
FAV in conducting interviews to help bridge linguistic & contextual gaps;
and/or conducting interviews on behalf of FAV.Deadline for proposals: June 6th, 2003
SMARTGROWTHProceedings
• Presentation of SMARTGROWTH-project in Helsinki: April 2003 announcement of call for partners
• Project start: June 2003
• Identification of European partners: July 2003
• Clarifying possible partners opinion towards SMARTGROWTH: August 2003
• Clarifying indicator aspects with specific European added value: July – September 2003
• Identification of potential interested partners in USA and Asia: July/ August 2003
• Conference with potential partners from Europe, Asia and USA: Spring 2004
0,00
10.000,00
20.000,00
30.000,00
40.000,00
50.000,00
60.000,00
Vien
na
Paris
Berlin
Mun
ich
Athe
ns
Lisbo
n
Mad
rid
Zuric
h
Lond
on
Prag
ue
Buda
pest
War
saw
Mos
cow
Atlan
ta
Chica
go
New
York
San
Fran
cisco
Sao
Paulo
Mex
ico C
ity
Cairo
Toky
o
Hong
Kon
g
Sing
apor
e
Beijin
g
Sydn
ey
Cities
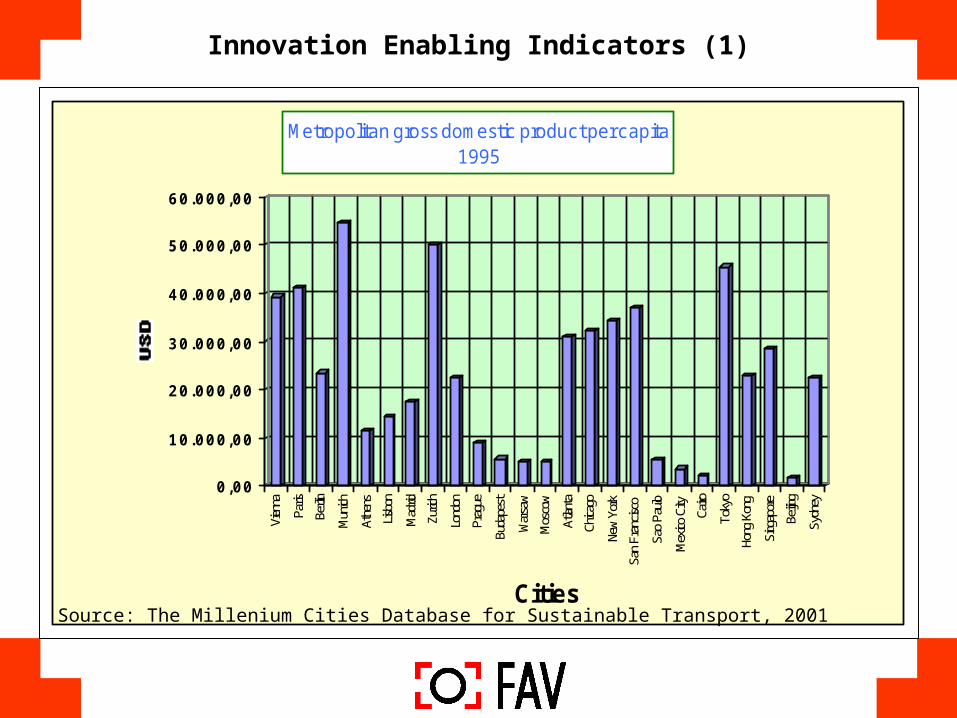
Metropolitan gross domestic product per capita1995
Source: The Millenium Cities Database for Sustainable Transport, 2001
Innovation Enabling Indicators (1)
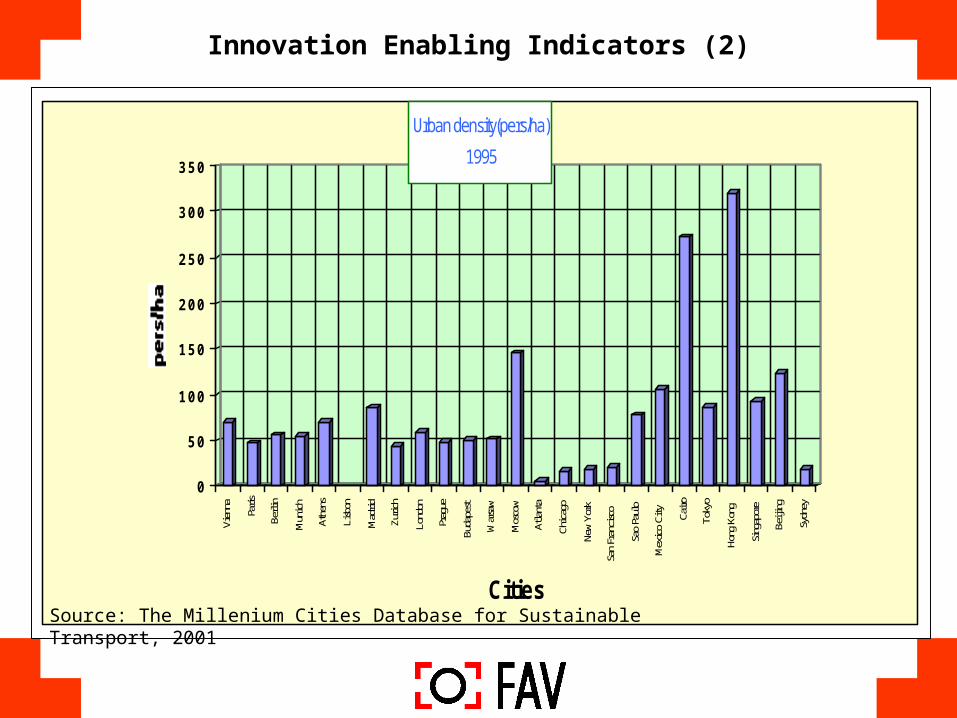
Innovation Enabling Indicators (2)
0
50
100
150
200
250
300
350
Vien
na
Paris
Berli
n
Mun
ich
Athe
ns
Lisb
on
Mad
rid
Zuric
h
Lond
on
Prag
ue
Buda
pest
War
saw
Mos
cow
Atla
nta
Chic
ago
New
York
San
Fran
cisc
o
Sao
Paul
o
Mex
ico
City Cairo
Toky
o
Hong
Kon
g
Sing
apor
e
Beiji
ng
Sydn
ey
Cities
Urban density(pers/ha)
1995
Source: The Millenium Cities Database for Sustainable Transport, 2001
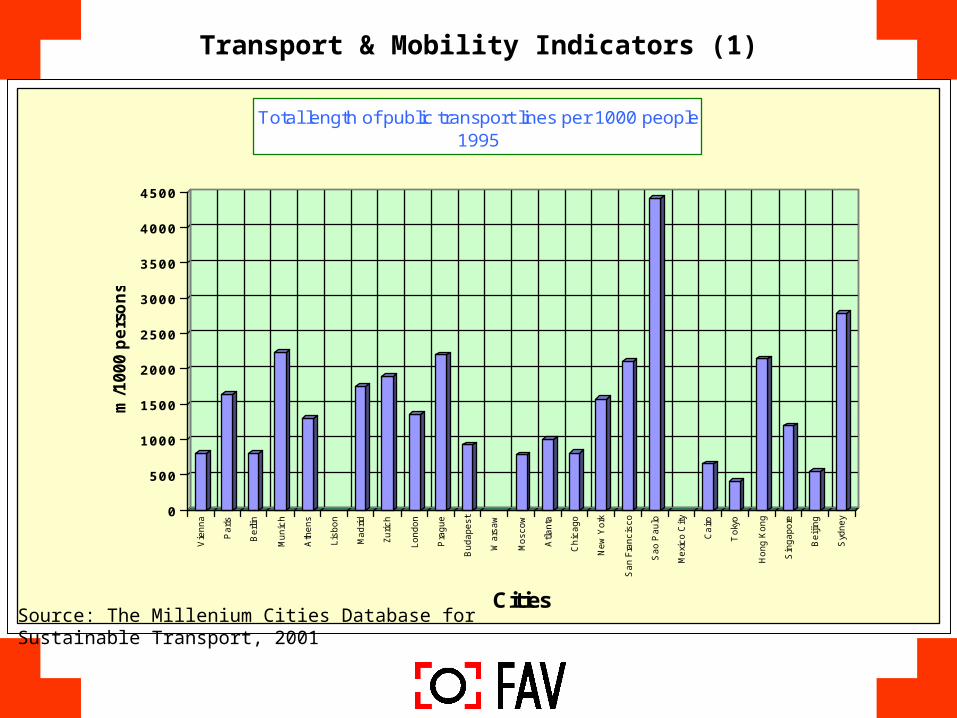
Transport & Mobility Indicators (1)
0
500
1000
1500
2000
2500
3000
3500
4000
4500
m/1
000 p
ers
on
s
Vie
nn
a
Pa
ris
Be
rlin
Mu
nic
h
Ath
en
s
Lis
bo
n
Ma
dri
d
Zu
ric
h
Lo
nd
on
Pra
gu
e
Bu
da
pe
st
Wa
rsa
w
Mo
sc
ow
Atl
an
ta
Ch
ica
go
Ne
w Y
ork
Sa
n F
ran
cis
co
Sa
o P
au
lo
Me
xic
o C
ity
Ca
iro
To
kyo
Ho
ng
Ko
ng
Sin
ga
po
re
Be
ijin
g
Syd
ne
y
Cities
Total length of public transport lines per 1000 people1995
Source: The Millenium Cities Database for Sustainable Transport, 2001
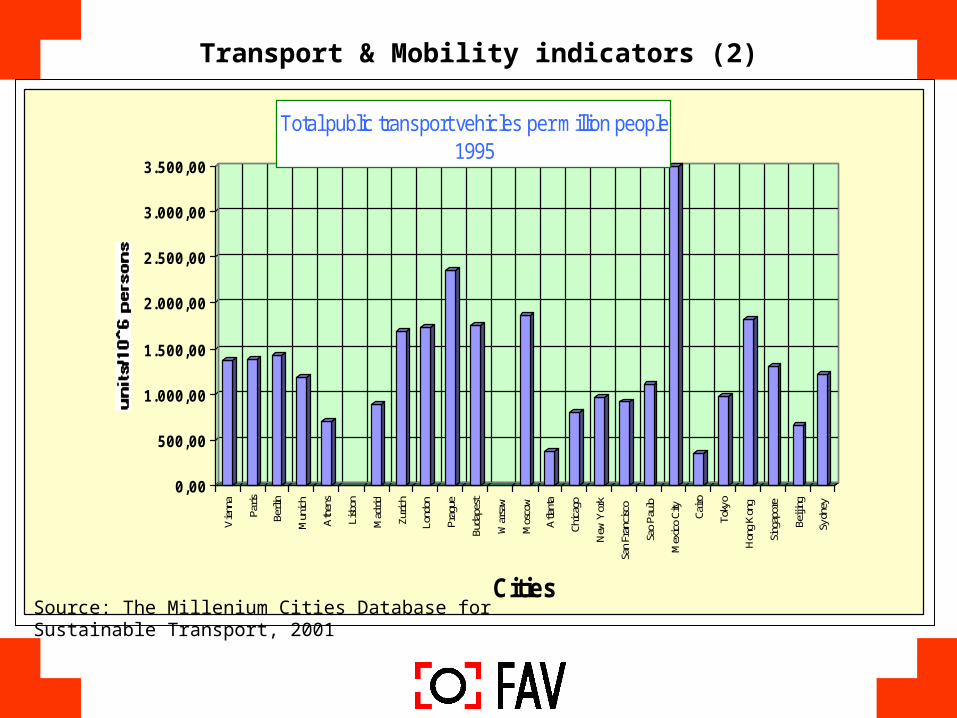
Transport & Mobility indicators (2)
0,00
500,00
1.000,00
1.500,00
2.000,00
2.500,00
3.000,00
3.500,00
Vie
nna
Paris
Berli
n
Mun
ich
Ath
ens
Lisb
on
Mad
rid
Zuric
h
Lond
on
Prag
ue
Buda
pest
War
saw
Mos
cow
Atla
nta
Chic
ago
New
Yor
k
San
Fran
cisc
o
Sao
Paul
o
Mex
ico
City
Cairo
Toky
o
Hon
g K
ong
Sing
apor
e
Beiji
ng
Sydn
ey
Cities
Total public transport vehicles per million people1995
Source: The Millenium Cities Database for Sustainable Transport, 2001
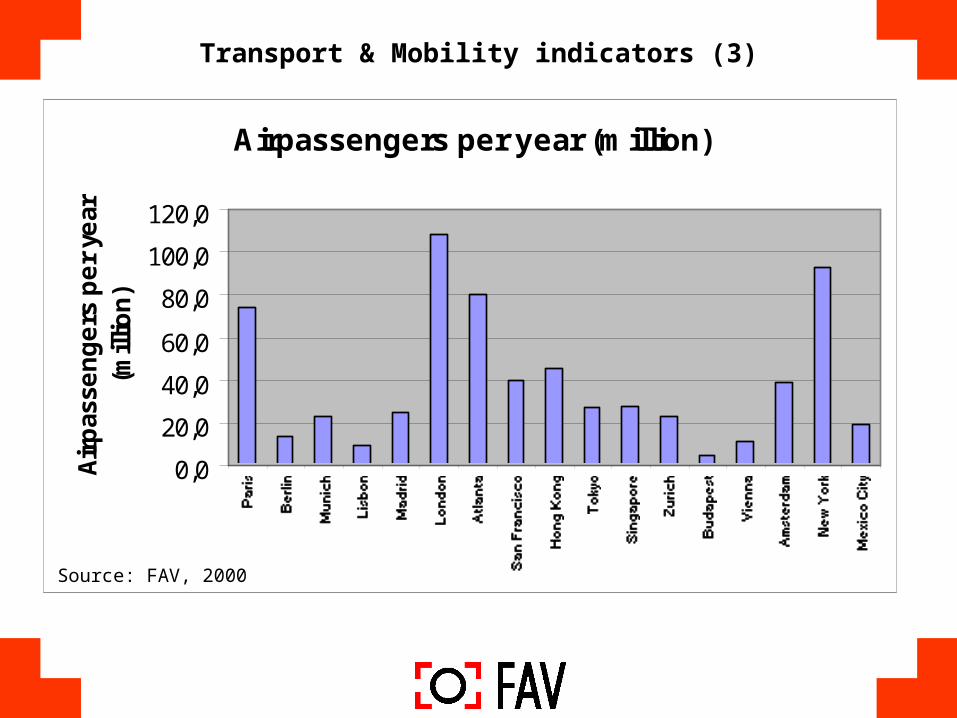
Transport & Mobility indicators (3)
Airpassengers per year (million)
0,0
20,0
40,0
60,0
80,0
100,0
120,0
Air
pas
sen
ge
rs p
er
year
(m
illio
n)
Source: FAV, 2000