Embed Size (px)
Citation preview

Large Shareholders and Accounting Choices
Presented by
Dr Ole-Kristian Hope
Deloitte Professor Rotman School of Management
University of Toronto
#2012/13-20
The views and opinions expressed in this working paper are those of the author(s) and not necessarily those of the School of Accountancy, Singapore Management University.
Large Shareholders and Accounting Choices
Yiwei Dou Stern School of Business
New York University
Ole-Kristian Hope
Rotman School of Management
University of Toronto
Youli Zou Rotman School of Management
University of Toronto
January 22, 2013
Preliminary Version – Comments Welcome
Acknowledgments
We have received valuable comments from Hila Fogel Yaari and Kevin Veenstra. We thank
Heae-Me Chung, Seung Min Shawn Lee, Ye-Ji Lee, and Jun Zhang Tan for their excellent research
assistance. Hope gratefully acknowledges the financial support of the CMA/CAAA Research
Grant Program and the Deloitte Professorship.

Large Shareholders and Accounting Choices
This is the first large-scale study to examine the effects of individual large shareholders, defined
as blockholders who hold five percent or more of the company’s stock, on firms’ accounting
choices. Using a large hand-collected sample of all blockholders of S&P 1500 firms for the years
2002 – 2009 (23,555 blockholder-firm-year observations; 8,409 firm-years; 574 uniquely
identified blockholders), we document significant variation among blockholders and significant
heterogeneous blockholder fixed effects on financial reporting quality (accrual-based earnings
management, real earnings management, and restatements). We find evidence suggesting that
this association is primarily driven by large shareholders influencing rather than “selecting”
firms’ accounting practices. Using very detailed data on each blockholder, we find only limited
evidence that observable factors explain the fixed effects results we observe, suggesting the
presence of important unobservable heterogeneity among large shareholders. Finally, we identify
“reputable” blockholders as blockholders associated with high financial reporting quality, and
find that the presence of reputable blockholders is positively related to future earnings
persistence.

1
Large Shareholders and Accounting Choices
1. Introduction
Blockholders are large shareholders who own five percent or more of a company’s
outstanding shares. Blockholders hold very significant equity stakes in the U.S. market. For
example, Holderness (2009), using a random sample of U.S. listed firms from 1995, reports that
96% of these firms have blockholders and that these blockholders in aggregate own an average
39% of the common stock.1 Furthermore, a large body of work in financial economics models
the governance role of large shareholders and accounting research argues that large shareholders
can play an important role in shaping firms’ financial reporting practices. Although blockholders
differ significantly from each other, existing empirical studies do not incorporate such
blockholder heterogeneity into their analyses. In this study, using a large hand-collected sample
of all the blockholders of S&P 1500 firms, we investigate whether and how individual
blockholders affect firms’ financial reporting quality (FRQ). Although there is prior research on
how specific shareholders (e.g., founding families) influence accounting choices, our study
encompasses all large shareholders within a firm and makes use of the significant heterogeneity
among these shareholders, thus providing a more complete picture of blockholders’ effect on
FRQ.
Blockholders have heterogeneous beliefs, skills, or preferences. On one hand, owing to
the sizable holdings, some blockholders are better able and more willing to acquire private
information and thereby monitor managers (Shleifer and Vishny 1986). Such monitoring aligns
the interests of shareholders and managers, and consequently, mitigates managers’ incentives to
manage accounting earnings. On the other hand, concentrated ownership can allow some
1 In our larger and more recent sample, the mean ownership by all blockholders is 30.2%.

2
blockholders to influence managers and secure private benefits detrimental to other shareholders
and creditors (Shleifer and Vishny 1993; Armstrong, Guay, and Weber 2010).
In addition, different blockholders influence corporate policies through different channels
and to various extents (Klein and Zur 2009; Cronqvist and Fahlenbrach 2009). These channels
include direct communication with the management, insider positions (management or director),
and changes to corporate governance practices such as board characteristics (see Section 2.3 for
details). As a result, we expect significant heterogeneity among large shareholders in shaping
firms’ financial reporting practices. Although there are observable shareholder-level factors that
can explain the heterogeneity (and we consider several of these in our analyses), we emphasize
the importance of unobservable shareholder-level variables. The existence of significant
unobservable variables motivates our identification strategy of using blockholder fixed effects.
Note that finding support for large shareholder effects on accounting outcomes is not
tautological. First, blockholders may not have sufficient incentives to monitor firms or to extract
private benefit due to risk aversion or illiquidity (Admati, Pfleiderer, and Zechner 1994; Maug
1998). Second, Cronqvist and Fahlenbrach (2009) study blockholder heterogeneity and do not
find evidence that large shareholders are associated with all the corporate policies they examine.2
Third, accounting decisions are likely secondary to operational and financing decisions. Finally,
similar to prior literature, we control for firm fixed effects which are likely to capture a large
portion of variation in accounting practices. The identification in this paper comes from
blockholders that move not only from one firm to another but also from the holdings of multiple
2 For example, the authors find no relation between blockholders and either the number of acquisitions or the
number of diversifying acquisitions.

3
firms at a given point in time.3 Thus, it is an empirical question whether individual large
shareholders are associated with financial reporting practices.4
We manually collect data on all S&P 1500 firms’ blockholder ownership for the years
2002 – 2009 from annual proxy statements. As explained below, this is an involved process that
requires significant data cleaning and checking for double counting. We are thus able to identify
and track all unique blockholders during the sample period. Following prior research, we classify
these blockholders into the following categories: (1) activists and pension funds, (2) banks and
trust companies, (3) corporations, (4) hedge funds, (5) insurance companies and money
managers, (6) mutual funds, (7) venture capitalists and LBOs, and (8) individuals. We further
collect data on other blockholder-specific information. Our final sample consists of 23,555
blockholder-firm-year observations for 8,409 firm-years, with 574 uniquely identified
blockholders.
As this is the first paper to study individual blockholder effects on FRQ, we consider
FRQ broadly and consider several aspects of FRQ (or inversely, earnings management): (1)
accrual-based earnings management, (2) real earnings management, and (3) restatements.
In our first empirical analyses, we follow Bertrand and Schoar (2003) and Cronqvist and
Fahlenbrach (2009) and employ a blockholder fixed effects approach to disentangle the impact
of large shareholders from firm and time-period effects. Specifically, we test whether adding
blockholder fixed effects to a regression model that includes firm fixed effects, year fixed
effects, and numerous time-varying firm characteristics yields significant incremental
3 Several studies relate institutional investor characteristics to financial reporting practice (e.g., Bushee 1998; Ayers, Ramalingegowda, and Yeung 2011; Ramalingegowda and Yu 2012). These studies do not examine blockholders
like we do in this study. In addition, they do not control for firm fixed effects and therefore cannot separate specific
owner effects from firm effects. 4 Armstrong et al. (2010) provide a survey of the mixed empirical evidence on the relation between active
shareholders and FRQ.

4
explanatory power. Our results highlight the importance of heterogeneity across large
shareholders, not only across types, but also within types. We find evidence of both statistical
and economic significance of blockholder effects, with the adjusted R2 increasing by between 1.6
and 9 percentage points, translating to increases of 20 percent to over 500 percent relative to the
base models’ adjusted R2s. We further find evidence of significant variation in the magnitudes of
the estimated blockholder fixed effects, providing further evidence on the economic importance
of the blockholder fixed effects.
Although the fixed effects approach is econometrically strong in controlling for
alternative factors, it is an association-based test and any observed significance could be
explained either by owners influencing firms’ accounting practices or by shareholders selecting
firms with certain accounting qualities. In either case the results are interesting; however the
interpretation varies. We use lead-lag tests to shed some light on this question and find evidence
that the primary effect is that blockholders influence firms’ FRQ.
Next, we explore the sources of the blockholder fixed effects. Motivated by prior
research, we consider having a single decision maker, being the largest shareholder, holding
insider positions (i.e., having a representative on the board of directors or as a corporate officer),
and being located geographically close to the firm in which they invest. Although some of these
characteristics are statistically significant, overall our results suggest that the explanatory power
of these observable characteristics is moderate. These findings support the notion that a
significant proportion of blockholder heterogeneity is unobservable and further highlights the
importance of accounting for heterogeneity among large shareholders in empirical research.
We further explore whether individual blockholders associated with higher financial
reporting quality (hereafter, “reputable blockholders”) “certify” the quality of firms’ accounting
5
numbers in the subsequent periods. In a set of out-of-sample tests, we use the first half of our
sample period (2002–2005) to estimate the blockholder fixed effects on FRQ and code
blockholders as reputable if their fixed effect coefficients are ranked in the bottom three deciles
(i.e., the least earnings management or highest FRQ). In the second sample period (2006–2009),
we find that the presence of reputable blockholders is significantly associated with enhanced
earnings sustainability.
Our study contributes to the literature in the following ways. First, based on a large
sample of U.S. firms in recent years, we provide new descriptive statistics on large
shareholdings. Consistent with recent finance and economics literature, we find a rapid growth of
hedge funds and active involvement of other blockholders (e.g., activists, VCs, LBOs, and
individuals). Second, and directly related to the accounting literature, we provide additional
evidence on factors associated with firms’ FRQ. Specifically, we provide the first evidence on
individual blockholder effects on FRQ. Prior finance research has found that blockholders can
impact the financial and investment policies of firms (Cronqvist and Fahlenbrach 2009);
however we provide initial evidence on accounting outcomes. Third, while a large literature
examines relations between the reputation of auditors, underwriters, or banks and accounting
quality (DeFond and Jiambalvo 1991; Lee and Masulis 2011; Bushman and Wittenberg-
Moerman 2012), we extend this line of research by documenting that blockholder reputation is
associated with higher earnings persistence. Finally, we add to the recent literature on “fixed
effects” in accounting, which includes interesting recent studies on the role of managers by
(among others) Bamber, Jiang, and Wang (2010), Ge, Matsumoto, and Zhang (2011), and Yang
(2012).

6
The next section provides background and reviews related literature, including a
discussion of how large shareholders may be able to affect FRQ. Section 3 explains the research
design and Section 4 presents our empirical results. Section 5 concludes.
2. Background and Related Literature
In this section, we discuss the corporate governance role of large shareholders, briefly
review some empirical evidence on specific owners, outline ways in which blockholders may be
able to affect accounting outcomes, and discuss related fixed effects research.
2.1 The Role of Large Shareholders in Corporate Governance
Blockholders are shareholders who own five percent or more of a company’s stock, and
are therefore reported as “Principal Shareholders” in firms’ annual proxy statements. Prior
research documents the prevalence and importance of large shareholders in the U.S. market. For
example, Holderness (2009), using a random sample of 428 U.S. listed firms from 1995, finds
that 96% of these firms have blockholders, and these blockholders in aggregate own on average
39% of the common stock. He further shows that 89% of S&P 500 firms have blockholders.
Holderness concludes that equity ownership in the U.S. is more concentrated than usually
perceived.
Large-block ownership can be motivated by two factors: the shared benefits of control
and the private benefits of control. A large body of research in accounting, finance, and
economics provides evidence that managers, when left unmonitored, are more likely to manage
earnings, commit fraud, or make suboptimal corporate decisions (e.g., Beasley 1996; Leuz,
Nanda, and Wysocki 2003; Bertrand and Mullainathan 2003; Hope and Thomas 2008). Financial

7
economics models the monitoring role of large shareholders as a potential solution to the agency
problem that arises from the separation of ownership and control. However, while all
shareholders have the responsibility to monitor managerial activities, the benefits of doing so by
any individual shareholder are proportional to the percentage of shares owned (Jensen and
Meckling 1976; Shleifer and Vishny 1997). Put another way, when ownership is widely
dispersed, it is economically less desirable for any individual shareholder to incur significant
monitoring costs, because she will receive only a small portion of the benefits. Moreover, when
ownership is dispersed, it is harder for shareholders to monitor managerial actions due to the free
rider problem (Grossman and Hart 1980). Shareholders are only willing to incur necessary
monitoring costs if they have a large enough ownership stake. By monitoring managers, large
shareholders help to align the interests between shareholders and managers, and consequently
reduce managers’ incentives to manage accounting earnings.5 In contrast, Shleifer and Vishny
(1997) propose a competing view of blockholders, suggesting that by influencing management,
blockholders can extract private benefits at the expense of other shareholders and creditors.
Focusing either on the existence of a large shareholder, ownership concentration, or on a
particular type of shareholder, the existing empirical findings are mixed (see Armstrong. Guay,
and Weber 2010 for an overview). For example, using firms subject to accounting enforcement
actions by the SEC, Dechow, Sloan, and Sweeney (1996) and Farber (2005) find that compared
5 Prior research relies on these arguments to motivate the prediction between institutional ownership and FRQ
(Rajgopal and Venkatachalam 1997; Chung, Firth, and Kim 2002; Mitra and Cready 2005; Roychowdhury 2006;
Koh 2007; Burns, Kedia, and Lipson 2010; Zang 2012; Chhaochharia, Kumar, and Niessen-Ruenzi 2012), between
blockholders and FRQ (De Fond and Jiambalvo 1991; Dechow et al. 1996; Farber 2005), between corporate
governance and FRQ (Beasley 1996; Klein 2002; Francis, Schipper, and Vincent 2005), between founding family
controls and FRQ (Wang 2006; Ali, Chen, and Radhakrishnan 2007), between public ownership and FRQ (Burgstahler, Hail, and Leuz 2006; Katz 2009; Givoly, Hayn and Katz 2010; Hope, Thomas, and Vyas 2013; ) and
between legal environment and FRQ (Leuz et al. 2003). This argument suggests a complementary relation between
FRQ and the presence of blockholders. However, Bushman et al. (2004) find a negative relation between earnings
timeliness and concentrated ownership, which they interpret as evidence that earnings timeliness and concentrated
ownership are substitute monitoring mechanisms.

8
with control firms, firms manipulating earnings are less likely to have a large shareholder.
However, Beasley (1996) and Agrawal and Chadha (2005) do not find a significant relation
between large shareholdings and SEC enforcement actions and earnings restatements,
respectively.6 Moreover, Klein (2002) documents a negative relation between the presence of
blockholders in the audit committee and the absolute value of abnormal accruals. Larcker,
Richardson, and Tuna (2007) do not find a significant relation between their blockholding factors
and the absolute value of abnormal accruals. Importantly, large shareholders differ significantly
from each other and, unlike this study, existing empirical research has not fully incorporated
blockholder heterogeneity into the analysis.
2.2 Empirical Evidence on Specific Owners
While prior research examines large shareholders’ association with firms’ accounting
choices, most of this research is on institutional investors. Based on trading characteristics,
Bushee (1998) classifies institutions into three groups – transient, dedicated, and quasi-
indexers.7,8
He finds that only ownership by transient institutions significantly increases the
probability of managing earnings by reducing R&D. In a related study, Bushee and Noe (2002)
6 Similarly, focusing on institutional investors, while Mitra and Cready (2005) and Guthrie and Sokolowsky (2010)
find that abnormal accruals are positively related to institutional ownership, Zang (2012) finds that institutional
ownership is negatively related to abnormal accruals. 7 “Transient” institutions have high portfolio turnover and highly diversified portfolio holdings. They focus on the
short term and make investments based on the likelihood of short-term trading profits. According to Bushee (2001),
the short investment horizons of transient investors create little incentive for them to gather information relevant to
long-run value. In contrast, “dedicated” investors and “quasi-indexers” focus on the long term and provide stable
ownership to firms. Dedicated investors hold large stakes in a limited number of firms. Such ownership creates
greater incentives to invest in monitoring management and to rely on information beyond current earnings to assess
managers’ performance. Quasi-indexers generally follow indexing and buy-and-hold strategies, and are
characterized by high diversification. Although quasi-indexers follow a passive investment strategy, these investors may also have strong incentives to monitor management to ensure that it is acting in the best interest of the firm. 8 Ayers et al. (2011) further decompose dedicated investors into local and distant monitoring investors and observe
that firms are less likely to use financial reporting discretion in the presence of local monitoring institutions than
distant monitoring institutions. We make use of these findings when examining observable blockholder
characteristics (see Section 4.4).

9
find that firms’ disclosure levels (AIMR scores) only increase in ownership by transient
institutions. Ramalingegowda and Yu (2012) focus on conditional conservatism and find a
positive correlation with institutional ownership by firms that have concentrated holdings by
dedicated institutions. Other studies have also shown associations between disclosure levels and
specific types of institutional ownership (see Beyer, Cohen, Lys, and Walther 2010 and
Armstrong et al. 2010 for overviews of such literature).9
We emphasize the differences between blockholder heterogeneity as implemented in this
study and Bushee’s (1998) categorizations. First, Bushee’s categorization only applies to
institutional investors filing form 13F, so that important blockholders (e.g., arbitrageurs and
corporations) are not included. We hand collect the full population of blockholders for the S&P
1500 firms in our sample. Second, Bushee (1998) classifies institutional investors by three
trading dimensions: diversification, turnover, and trading sensitivity to earnings, which may not
capture variation in monitoring actions. We consider a much greater variety of blockholders’
characteristics.
2.3. Large Shareholders’ Possible Effects on Financial Reporting Quality
There is limited prior research on the mechanisms through which shareholders can
influence firms’ FRQ. With this caveat in mind, we outline possible ways in which blockholders
may be able to affect accounting outcomes. As blockholders have heterogeneous beliefs, skills,
or preferences, when monitoring managers, they influence firms through different channels
(Cronqvist and Fahlenbrach 2009; Becker, Cronqvist, and Fahlenbrach 2011). Therefore, we
9 Similarly, there is also research investigating the role of family ownership in shaping accounting outcomes (e.g.,
Chen, Chen, and Cheng 2008).

10
would expect blockholders’ heterogeneity to manifest in heterogeneous effects on firms’ FRQ.
We next discuss two forms by which influence by large shareholders can take place.
2.3.1 Influence through interventions (“voice”)
In the first type of monitoring, blockholders take various actions to intervene in firms’
operating, financing, investment, and governance decisions.
Seats on the board or in the top management team. Blockholders typically obtain these
key positions through proxy solicitations. Prior research observes a large variation in the success
rate of proxy solicitations by different institutions (Pound 1988; Nuys 1993; Brav et al. 2008).
Klein and Zur (2009) discuss why hedge funds tend to be more effective than mutual funds and
pension funds in making changes to their target firms. They also compare the effectiveness
between hedge funds and other private investors and find significant differences. Recent
literature discovers that even within hedge funds, there is significant heterogeneity in proxy
contests (Zur 2009; Sade and Zur 2010). The outcome of these proxy contests is important since
a large literature shows how board compositions can affect accounting outcomes.
Private communication. While many studies implicitly assume private communication as a
significant channel of monitoring, only a few clinical studies have directly examined the private
negotiations between management and large shareholders. Carleton, Nelson, and Weisbach
(1998) show that TIAA-CREF is able to reach agreements with targeted companies more than
95% of the time regarding governance issues. Becht, Franks, Mayer, and Rossi (2009)
investigate private engagements with management by the Hermes UK Focus Fund and find that
private interventions significantly improve targets’ performances.

11
Leading plaintiff in class action lawsuits. Cheng, Huang, Li, and Lobo (2010) consider
another channel through which institutional investors monitor the firm. They predict and find
that institutional investors are more likely to serve as the lead plaintiff for class action lawsuits
with certain characteristics, such as involving an accounting-related allegation, having an
accounting firm as the codefendant and having a longer class period. They further show that
securities class actions with institutional owners as lead plaintiffs are less likely to be dismissed
and have larger monetary settlements than securities class actions with individual lead plaintiffs.
Moreover, they document the importance of distinguishing between different types of
institutional owners by showing that the results are mainly driven by public pension funds rather
than by mutual funds.
Activism. Activism by large shareholders includes all the above mentioned actions as well
as other actions: seeking board representation and other types of proxy contests, communication,
public criticism, shareholder proposals, lawsuits, and even takeover bids. The goals cover
general undervaluation/maximizing shareholder value, capital structure, business strategy, sale of
target company, and governance (Brav et al. 2008; Klein and Zur 2009).10
Other mechanisms examined in prior literature, which could indirectly affect accounting
outcomes, include initiating shareholder proposals, voting on shareholder/management
proposals, and managerial compensation/turnover.11
10 Del Guercio and Hawkins (1999) study the shareholder proposals of the largest and most active pension funds and
find that the funds are successful at monitoring and promoting changes in target firms. They further document
significant heterogeneity across funds in activism objectives, tactics, and impact on target firms. Gillan and Starks
(2000) show that shareholder proposals sponsored by institutions or coordinated groups receive significantly more
favorable votes than those sponsored by independent individuals or religious organizations. Brickley et al. (1988) find that blockholders vote more actively on antitakeover amendments and more often vote against proposals
appearing to harm shareholders. 11 Hartzell and Starks (2003) document a positive (negative) relation between pay-for-performance sensitivity of
executive compensation (level of compensation) and institutional ownership concentration. Chhaochharia et al.
(2012) find that local institutions are more likely to increase CEO turnover and to reduce excess CEO pay.

12
2.3.2 Influence through trading (“exit”)
In the second type of monitoring, blockholders acquire private information and trade on
it. The trading moves stock prices and therefore affects managers’ decisions. Empirical evidence
supports this channel of blockholders’ influence on managers’ decisions. The survey evidence in
McCahery, Sautner, and Starks (2012) suggest that institutions use “exit” trades frequently, and
Parrino, Sias, and Starks (2003) provide evidence that aggregate institutional ownership and the
number of institutional investors decline in the year prior to forced CEO turnover. Also
accounting research shows that institutional ownership plays a significant role in helping the
market incorporate accounting information (Bartov, Radhakrishnan, and Krinsky 2000; Balsam,
Bartov, and Marquardt 2002).12
The channels discussed above also motivate our choices of blockholder characteristics to
explain the estimated blockholder fixed effects: dominating large shareholders, insider positions
as board members or officers, individual decision makers, and local shareholders (i.e.,
geographical proximity between blockholders and firms).
2.4 Fixed Effects Approach
Recently studies have shown that managers have an effect on both earnings quality and
disclosure choices. These studies are motivated by the heavily cited article by Bertrand and
Schoar (2003) and include Bamber, Jiang, and Wang (2010), Ge, Matsumoto, and Zhang (2011),
and Yang (2012). Bamber et al. (2010) find that managers exert significant influence over
management earnings forecasts beyond that of firm fixed effects and other controls. Ge et al.
12 In addition, anecdotal evidence and prior research suggest that the trading of investors with short horizons
promotes managers’ myopic behavior. However, Edmans (2009) and Edmans and Manso (2011) demonstrate that
transient shareholders can encourage long-term investment by impounding its effects into prices. Although
researchers can sort blockholders by their turnover, it is difficult to observe the true investment strategy of each
blockholder and there is a large variation even within the same type of investor.

13
(2011) provide evidence on CFOs’ effect on accounting choices. Yang (2012) concludes that
individual managers benefit from establishing a personal disclosure reputation. These studies
find limited evidence that personal characteristics explain the fixed effects results, suggesting
there are important unobservable effects captured by the fixed effects approach.
The paper most closely related to our study is likely Cronqvist and Fahlenbrach (2009).
They build a large dataset of blockholders from 1996-2001 and show that there are significant
blockholder fixed effects on investment, financial, and executive compensation policies. They
further find that blockholders with a larger block size, board membership, direct management
involvement, or with a single decision maker are associated with larger effects.13
It is important to note that finding support for large shareholder effects on accounting
outcomes is far from tautological. First, several theoretical studies show that liquidity or risk
aversion may reduce blockholders’ incentives to monitor firms (e.g., DeMarzo and Urosevic
2006). Second, as Bamber et al. (2010) point out, accounting and disclosure decisions are likely
secondary to operational and financing decisions. Third, Cronqvist and Fahlenbrach (2009) do
not find evidence that large shareholders are associated with all corporate policies they examine.
Finally, similar to prior literature, we control for firm fixed effects which are likely to capture a
large portion of variation in accounting practices. Thus, it is an empirical question whether large
shareholders (blockholders) are associated with financial reporting practices.
13 Although we build on Cronqvist and Fahlenbrach (2009), they do not consider variations in firms’ FRQ. In
addition, we use a newer sample period of 2001 – 2009, and investigate the persistence of blockholder effects on
FRQ.
14
3. Sample and Research Design
In this section, we first describe in detail our sample construction and its merits over
other sources of blockholder information. We continue by introducing the research design and
the identification strategy we use to capture blockholders’ influence on FRQ.
3.1 Sample
To analyze the effects of blockholder heterogeneity, we require a dataset that allows us to
identify and track each unique blockholder. Because such data are not readily available from
existing sources, we construct a new blockholder-firm panel dataset. We follow the approach of
Dlugosz et al. (2006), who created a blockholder-firm panel for the years 1996 to 2001. We form
our sample for the time period 2002-2009, a period characterized by a rapid growth of hedge
funds and active involvement of other blockholders (e.g., activists, VCs, LBOs, and individuals).
As described below, in order to estimate blockholder fixed effects, we manually identify and
track each blockholder over time and across firms.
We start with all S&P 1500 firms for 2002-2009. Consistent with prior literature, we
exclude financial industry firms, utility firms, and firms with dual share classes. For the
remaining firms we manually collect blockholder information from firms’ proxy statements.
Such information includes blockholder names and addresses, percentage of holdings, and
blockholder affiliation (e.g., having representatives as officers or directors). Following Dlugosz
et al. (2006), we carefully adjust for biases and double-counts by using the information in the
proxy footnotes on the ownership structure of jointly held blocks.
Blockholder information is also available from other sources, such as Compact
Disclosure, ExecuComp, IRRC Directors, Thomson Reuters (13F), 13D/G filings, and insider

15
trading filings (forms 3, 4, and 5). However, these sources suffer from various problems:
Compact Disclosure often double counts blockholdings (Dlugosz et al. 2006); ExecuComp and
IRRC Directors only provide the ownership of top managers and directors; Thomson Reuters
(13F) only covers institutional investors and suffers from classification errors (Chen et al. 2007);
the 13D/G filing requirements do not apply to existing blockholders; and the reliance on
aggregated insider trading may lead to incorrect inferences regarding the holdings of large
shareholders (Anderson and Lee 1997a, b; Jeng et al. 2003).14
In contrast, we collect all the
blockholder information directly from the proxy statements so that our sample is free from the
biases and errors discussed above. The downside to our approach is the time and cost of
extensive manual data collection.
After collecting the blockholder information, we identify and track each unique
blockholder. This stage requires overcoming the complications of inconsistencies in
blockholders’ names (e.g., misspellings) and variations in blockholders’ investment vehicles and
subsidiaries. Thus, we rely on several information sources to identify the ultimate owners, such
as the notes from proxy statements, blockholders’ websites, Capital IQ, Bloomberg
BusinessWeek, and newspaper databases.
Although we have been very careful in identifying unique blockholders, our dataset is
still subject to certain limitations. First (and consistent with Cronqvist and Fahlenbrach 2009),
we aggregate blockholders to the parent company level. That is, if several entities/subsidiaries
are present in our sample, we identify all of them as their parent company. Although this
procedure is appropriate when all the subsidiaries share the same investment philosophy, it
would not be able to capture the cross-subsidiary heterogeneity if the subsidiaries follow
14 13D/G filings provide an update of new blockholders. Item 403 of Regulation S-K explains that a company may
rely on the information disclosed in the SC 13D/G forms by beneficial owners when preparing proxy statements.

16
different policies. This limitation works against our finding any significant blockholder fixed
effects on FRQ. Second, the role of blockholders on FRQ could be different for large established
firms and for smaller firms. We estimate blockholder fixed effects, which reflect the average
impact. Third, consistent with extant research, when there are multiple owners we determine the
ultimate ownership based on the identity of the entity’s largest owner.
In order to estimate blockholder fixed effects, we require them to be present in at least
two different firms. Unlike CEO fixed effects studies where CEOs can only be present in
different firms in different years, blockholders can be present in different firms at the same time.
Thus, we can make use of both the time-series and cross-sectional variation to identify
blockholder fixed effects. Our final sample consists of 23,555 blockholder-firm-year
observations for 8,409 firm-years, with 574 uniquely identified blockholders.
3.3 Research Design
To investigate whether blockholders play unique, entity-specific roles in explaining
firms’ FRQ, we estimate the following firm-year models:
��� = � + ���� + � + � + ���; (1)
��� = � + ���� + ��_���� + � + � + ���; (2)
��� = � + ���� + �� + � + � + ���; (3)

17
In the above regression equations, ��� is the FRQ for firm i in year t and vector X controls
for eight firm-specific time-variant characteristics that have been shown to potentially affect
FRQ: firm size (SIZE), return on assets (ROA), book-to-market (BTM), leverage (LEV), volatility
of cash flow from operations (CFOVOL), volatility of revenues (REVVOL), estimated value of
option-based compensation (OPTION), and the average bonus as a proportion of total
compensation (BONUS). The detailed definitions of these variables are provided in Exhibit 1.
We include firm fixed effects � to control for unobservable time-invariant firm characteristics,
and we include year fixed effects �. Model (1) is the base-line model. Then we add blockholder-type fixed effects by
including a group of indicator variables for each type of blockholder, ��_����. We classify
these blockholders into the following categories: (1) activists and pension funds, (2) banks and
trust companies, (3) corporations, (4) hedge funds, (5) insurance companies and money
managers, (6) mutual funds, (7) venture capitals and LBOs, and (8) individuals. This model
allows blockholders’ effects on FRQ to vary by their type, but imposes uniformity on the effects
related to any blockholder within the category. In Model (3), which is our main regression, we
relax that assumption by allowing the magnitude of blockholder effects to be different for each
individual blockholder. Specifically, �� is a group of 574 indicator variables that take the value
of one if the specific blockholder is present for firm i in year t, and zero otherwise.
3.3 Financial Reporting Quality Measures
We use several common proxies of FRQ to capture its multiple dimensions: accrual
management activities, real earnings management activities, and earnings restatements (i.e.,
inverse measures of FRQ). Each of these proxies has been used extensively in prior research (see

18
Dechow, Ge, and Schrand 2010 for an overview of each proxy’s advantages and disadvantages).
We use multiple proxies for the following reasons. First, because the relation between
blockholders and FRQ has not been explored before, it is useful to present empirical evidence on
a number of FRQ dimensions. Second, we lack a universally accepted measure of FRQ (Dechow
et al. 2010) so any single proxy is unlikely to cover all facets of FRQ and the use of multiple
proxies helps to generalize our results. Finally, the use of alternative measures mitigates the
possibility that the results from a particular proxy capture factors other than FRQ, and that these
other factors are driving our results (Hope et al. 2013).
Our first FRQ proxy, accrual management, is based on the modified Jones model.
Following Kothari et al. (2005), we also control for current period performance by including
����,� as a control variable in estimating abnormal accruals. We estimate the following model
for each industry-year with at least 20 observations, where industry is defined as the first two
digits of the SIC code:
�����,� = �� + �� � ���� ��!,"#$% + �&∆�()�,� + �*++,�,� + �-����,� + ��,�; (4)
Where �����,� is total accruals measured as income before extraordinary items minus
operating activities net cash flow, scaled by lagged total assets for firm i in year t. ∆�()�,� is the
annual change in revenues scaled by lagged total assets for firm i in year t, and ++,�,� is
property, plant, and equipment for firm i in year t scaled by lagged total assets. The residuals
from this industry-year specific regression model, PMJE, are used to proxy for discretionary
accruals. 15
Next, we employ two real activity management proxies following Roychowdhury (2006),
Cohen, Dey, and Lys (2008), Cohen and Zarowin (2010), and Zang (2012). Firms’ actual
15 Using the absolute value of residuals from the Dechow and Dichev (2002) model yields similar results.

19
engagement in real activities manipulation is supported by the survey evidence in Graham,
Harvey, and Rajgopal (2005). We consider the following three real activity management
channels and their impact: (1) boosting revenue through price discounts or lenient credit terms.
Such price discounts and lenient credit terms will temporarily generate high revenue that will
disappear once the prices revert; (2) reducing reported cost of goods sold through over-
production. In that way, fixed costs are spread over more units of products produced, thereby
reducing unit product costs and increasing earnings; and (3) increasing earnings by cutting
discretionary expenses including advertising, R&D, and SG&A expenses. While all these
activities may generate higher reported earnings in the short term, research suggests that these
are sub-optimal activities that can potentially hurt firm value in the long run, even more severely
than accrual management.
We first generate the normal levels of cash flow from operations, production costs, and
discretionary expenses using the model developed by Dechow, Kothari, and Watts (1998) and
implemented by Roychowdhury (2006). Based on these normal levels, we calculate the abnormal
levels that form our real earnings management proxies.
To estimate the normal levels of cash flow from operations, we run the following cross-
sectional regressions for each industry and year:
./0!"��� ��!,"#$ = 1� �
��� ��!,"#$ + 1& 234 �!"��� ��!,"#$ + 1* ∆234 �!"
��� ��!,"#$ + ���; (5)
Where 56��� is cash flow from operations for firm i in year t, and abnormal CFO is
calculated as the actual CFO minus the normal level CFO predicted by model (5).
Production costs are defined as the sum of cost of goods sold (COGS) and change in
inventory during the year. We use the following model to estimate normal level production costs:
�708!"��� ��!,"#$ = 1� �
��� ��!,"#$ + 1& 234 �!"��� ��!,"#$ + 1* ∆234 �!"
��� ��!,"#$ + 1- ∆234 �!,"#$��� ��!,"#$ + ���; (6)

20
The normal level of discretionary expenses can be estimated using the following model:
892:!"��� ��!,"#$ = 1� �
��� ��!,"#$ + 1& 234 �!,"#$��� ��!,"#$ + ���; (7)
Our first measure, RM1, is calculated by multiplying abnormal discretionary expenses by
negative one, and adding it to abnormal product costs. Our second measure, RM2, is calculated
as the sum of abnormal discretionary expenses and abnormal CFO, multiplied by negative one.
In both cases, a higher number indicates a greater likelihood of real earnings management
activities. All the variables are from Compustat.
Our last measure of FRQ is an indicator variable, RESTATEit, for restatements from the
Audit Analytics database (e.g. Hennes, Leone, and Miller 2008; Karpoff, Lee, and Martin 2008;
Leone and Liu 2010; and Feng et al. 2011). RESTATEit takes the value of one if the financial
report for firm i in year t was later restated and zero otherwise. The literature typically views
restatements as a more objective and error-free measure of earnings management than alternative
proxies. However, few firms report restatements, so that the use of this proxy puts significant
weight on a relatively small number of observations.
Panel A of Table 1 presents summary statistics for the FRQ variables and some firm
characteristics for our full sample.
3.4 Summary Statistics of Large Shareholders
Panel B of Table 1 reports summary statistics for the 574 unique large shareholders
included in our sample. The composition is comparable to Cronqvist and Fahlenbrach (2009),
except for the significant increase in the number of hedge funds in the past decade.
The left part of the panel describes the number of years blockholders hold each firm.
Individuals and corporations have the longest holdings within our sample period (2.89 and 2.67

21
years on average, respectively), which may be explained by individual blockholders often being
family members with a long ownership horizon and many corporate owners having
customer/supplier relationships with the firm in question. On the other hand, hedge funds invest
in firms for the shortest horizons, 1.64 years on average, followed by activists/pension funds and
money managers/insurance companies. The center of the panel displays the percentage of
common shares an average blockholder holds for each firm. The overall average is 8.65 percent,
with corporations holding the highest stake, and banks/trusts and mutual funds holding the
smallest stake. The right side of the panel shows the frequency of insider blockholders. A
blockholder is considered an insider if the controlling party of the blockholder is included in the
firm’s management team or sits on the firm’s board. Almost half of the corporation blockholders
are insiders, while money managers/insurance companies and mutual funds are the least likely to
be insiders. Overall, this table suggests considerable heterogeneity across blockholder types.
4. Empirical Evidence on Blockholder Heterogeneity and Financial Reporting Quality
Having shown the heterogeneity of individual blockholders in our sample, in this section
we demonstrate the importance of that heterogeneity in explaining blockholders’ effects on FRQ.
4.1 Blockholder Type Effects
We begin with estimating model (2) and reporting the results of average blockholder
effects in Table 2. To generate the F-statistics, model (1) is used as the baseline model. Prior
studies usually use large shareholder type to distinguish their impact on various decision
variables, and the evidence is mixed. In this table, we show that blockholder type indicators only
explain a small portion of the variation of accounting choice variables. We further test the joint

22
significance of blockholder type fixed effects, and are unable to reject any of the null hypotheses
that these fixed effects are all equal to zero for accrual-based and real earnings management. For
restatements, in contrast, three blockholder types load significantly: activists and pension funds;
corporations; and especially hedge funds (significant at the one percent level). These results
highlight the potential importance of heterogeneity across large shareholders, not only across
types, but also within types.
4.2 Blockholder Fixed Effects
Next, we test blockholder level fixed effects, with results reported in Table 3. We
construct an indicator variable for each of the 574 blockholders. The indicator variable takes the
value of one if the blockholder is present for a certain firm-year, and zero otherwise. We then
test the joint significance of all the 574 indicator variables and test the joint significance for each
type of blockholder.
We first focus on the row labeled “ALL.” This row reports the F-statistics and p-values
for the joint test. We reject the null of all fixed effects being equal to zero for all four FRQ
proxies at the one percent level (using two-sided tests). Consistent with the results in Table 2, the
significance level for RESTATE is especially high (with an F-value of 32,400).
We further show that in most cases there is meaningful heterogeneity within each type.
Activists/pension funds, hedge funds, insurance companies/money managers, and venture
capitals/LBOs show the greatest heterogeneity, and mutual funds show the least heterogeneity.
For RM1 and RM2, we cannot reject the null hypothesis that all mutual funds jointly have no
association with real earnings management activities. These findings are consistent with the

23
notion that real earnings management is harder to detect and to prevent than accrual
management, especially for investors with a limited monitoring role (Davis and Kim 2007).
In addition, the adjusted R2s increase considerably after we include blockholder fixed
effects, with increases between 1.6 and 9 percentage points, translating to increases of 20 percent
to over 500 percent relative to the base models’ adjusted R2s. PMJE and RESTATE show the
largest increase in explanatory power in both percentage (more than 500 and 200 percent) and
percentage points (8.35 and 8.96 percent). Recall that the base model without blockholder fixed
effects already includes firm fixed effects as well as firm characteristics and year fixed effects.
We also present the number of significant (at the ten percent level) blockholder fixed effects for
each FRQ variable and the numbers range from 80 to 121, out of 574 blockholders. These
numbers suggest that rejecting the null of no heterogeneity is not driven by a few extreme
blockholders.
Taken together, Table 3 highlights the importance of considering each blockholder as a
different force in shaping accounting choices. We conclude that there is a strong statistical
relation between large shareholders and FRQ and that this relation is also economically
meaningful.
Table 4 shows the distribution of the estimated blockholder fixed effects, which can be
used as an additional gauge of the economic meaningfulness of these fixed effects. For example,
for blockholder fixed effects for PMJE, we find that the difference between large shareholders in
the bottom and top quartiles is 0.035 (from -0.018 to 0.017). Comparing this to the distribution of
PMJE with the 25th
and 75th
percentiles of -0.028 and 0.029, we conclude that the magnitude of
blockholder effects is economically meaningful. The significant variation in the magnitudes
lends further credence to the primary results reported in Table 3.

24
The results reported in tables 3 and 4 complement and extend prior findings on large
shareholders. Although prior accounting research has examined the roles of specific large
shareholders on FRQ, this is the first study to include all blockholders and to explore the
heterogeneity among these stockholders and their effects on FRQ. We further add to the
literature on corporate governance effects of large shareholders, as financial reporting plays a
significant role in governance. Finally, we contribute to the growing body of literature on fixed
effects by extending such research from individuals (CEOs, CFOs, etc.) to blockholders.
4.3 “Influence” versus “Selection” Explanations
The previous section documents the statistically significant and economically meaningful
blockholder effects on FRQ. These results inform about the heterogeneity of blockholders and
their importance in explaining variations in firms’ accounting quality. Before conducting
additional analyses, the observed pairing between firms and large shareholders could be
explained by either the “influence” mechanism or the “selection” hypothesis: large shareholders
may influence accounting practices, or blockholders may systematically select firms in which
they invest major stakes based on their preference for certain accounting policies.16
In an attempt to differentiate between these alternative explanations, we construct a
pseudo blockholder sample. In this sample, we estimate blockholder fixed effects as if each
blockholder had a stake in the firm two years prior to its actual investment, and exited before the
beginning of its actual holding. Then we correlate these pseudo fixed effects with the actual fixed
effects using the real sample. Under the selection interpretation, we expect a positive correlation
16 In their study of the effect of CFOs on accounting policies, Ge et al. (2011) note that they do not attempt to
distinguish between the explanation that the personal style of CFOs results in certain accounting choices versus the
alternative explanation that CFOs with a certain style are selected by firms. They argue that CFO style impacts
firms’ accounting choices under both explanations. The same could possibly be argued in our blockholder setting;
however, we attempt to disentangle these two possible explanations.

25
between these effects because firms’ accounting choices just prior to and following a
blockholder’s investment are similar (Cronqvist and Fahlenbrach 2009). Under the influence
interpretation, we would expect a negative correlation or no relation, depending on how
blockholders choose firms to influence. The results in Table 5 show that the preponderance of
estimated coefficients are negative and statistically significant, which suggests that the primary
effect is that blockholders influence firms’ FRQ.17
4.4 Sources of Blockholder Heterogeneity
Table 6 explores whether observable blockholder characteristics can explain the
estimated fixed effects.18
The observable characteristics we consider are motivated by our
discussion in Section 2.3 and by Cronqvist and Fahlenbrach (2009). We have hand-collected data
on these characteristics. SINGLE is an indicator variable for blockholders that are likely to have a
single decision maker. DOMINATE measures the frequency of the blockholder being the largest
shareholder. INSIDE is an indicator variable for insider blockholder (i.e., member of the
management team or a seat on the board of directors). Finally, BHLOCAL is an indicator variable
for blockholders that are within a 100 km distance from the firm they are holding.
The explanatory power of these observable characteristics is moderate (i.e., the largest
adjusted R2 is 0.025). In terms of the observable characteristics, SINGLE and INSIDE are
statistically significant in two models, and DOMINATE and BHLOCAL are significant in one
model. These findings are in line with prior fixed effects research in accounting and finance. One
reason for the relatively limited explanatory power is that the dependent variables are estimated
parameters with measurement error. Another, more fundamental explanation, is that
17 Exceptions relate to RESTATE and in particular to corporation blockholders. 18 To ensure that our results are not an artifact of some extreme values, we follow Bamber et al. (2010) and report
OLS results after removing a few outliers with absolute studentized residuals exceeding 2.
26
blockholders’ influence on accounting choices results from unobservable factors, such as their
experiences and unique styles. In other words, these findings further highlight the heterogeneity
among large shareholders and the importance of accounting for such heterogeneity in empirical
research.
4.5 Certifying Role of Reputable Blockholders
In untabulated tests, we partition the sample into two sub-periods: 2002-2005, and 2006-
2009, and estimate blockholder fixed effects separately for each sub-sample. We observe
significant correlation coefficients, suggesting that blockholders’ styles are persistent over time.
Building on these findings, motivated by Bushman and Wittenberg-Moerman (2012)
(with further support from DeFond and Jiambalvo 1991 and Lee and Masulis 2011), in our final
analysis, we examine whether the presence of certain blockholders inform about the persistence
of earnings. If a blockholder is associated with high FRQ, it suggests that the blockholder is
reputable in closely monitoring firms’ financial reporting process. Moreover, prior literature
documents that low FRQ reduces the sustainability of earnings (Xie 2001). For firms with
reputable blockholders, we expect that these firms’ current profitability is more positively
correlated with their future profitability. 19
We first use the 2002–2005 sample to estimate blockholder fixed effects for each of the
FRQ variables. Next, we rank the fixed effects into deciles, and identify large shareholders
ranked in the bottom three deciles (i.e., blockholders that are associated with the least earnings
management and thus the highest FRQ) as reputable blockholders. Then we examine in our out-
of-sample test (2006-2009) whether the presence of such reputable large shareholders indicates
19 Similarly, Yang (2012) finds that management forecasts issued by managers who exhibit high forecast accuracy
fixed effects experience greater market reaction around the forecast dates.

27
more persistent profitability. Test results are reported in Table 7, where the variable PRES equals
one if at least one reputable blockholder has a stake in the firm, and zero otherwise. We are
interested in the interaction term between current ROA and PRES, and expect a positive sign. In
our firm-year level tests, we look at up to three years ahead profitability.20
Across all horizons
and all FRQ proxies, we consistently find positive and significant coefficients for the interaction
term ROA×PRES, and the magnitude is economically meaningful.21
5. Concluding Remarks
This is the first large-scale study to explore the relation between blockholders and firms’
accounting practices. Theory suggests that large shareholders are important in reducing agency
costs between managers and owners. There is, however, significant variations among large
shareholders.
Using a large hand-collected sample of all blockholders for the S&P 1500 firms, we
empirically examine the association between blockholders and financial reporting quality (FRQ).
We classify blockholders into (1) activists and pension funds, (2) banks and trust companies, (3)
corporations, (4) hedge funds, (5) insurance companies and money managers, (6) mutual funds,
(7) venture capitals and LBOs, and (8) individuals. We further collect data on the type of
blockholders and on various other blockholder-specific information. Our final sample consists of
23,555 blockholder-firm-year observations for 8,409 firm-years, with 574 uniquely identified
blockholders.
20 Since our sample ends in 2009, three-year-ahead ROA is only available for part of the sample, which could
contribute to the relatively weaker results for ROAt+3. 21 We also conduct a principal component analysis for the estimated fixed effects from the four FRQ variables and
run the test in Table 7. One factor is generated and the results are similar.

28
We operationalize FRQ as accrual-based earnings management, real earnings
management, and restatements (i.e., inverse measures of FRQ). We follow Bertrand and Schoar
(2003) and Cronqvist and Fahlenbrach (2009) and use a fixed effects approach to ascertain the
incremental contribution of blockholders to explaining firms’ FRQ. Specifically, we regress FRQ
proxies on firm fixed effects, year fixed effects, numerous time-varying firm characteristics and
then assess the incremental explanatory power of adding blockholder fixed effects. We find that
including blockholders yields statistically significant and economically meaningful increases in
model explanatory power. We further find evidence of significant variation in the magnitudes of
the estimated blockholder fixed effects, providing further evidence on the economic importance
of the blockholder fixed effects.
In additional analyses, we show that most of the documented association is likely driven
by blockholders “influencing” (rather than “selecting”) firms’ accounting practices. Finally, we
make use of highly detailed data on each blockholder and test whether having a single decision
maker, being the largest shareholder, holding insider roles, and being located geographically
close to the firm they invest in explain the fixed effects results. The explanatory power of these
observable characteristics is moderate, which supports the idea that a significant proportion of
blockholder heterogeneity is unobservable and further highlights the importance of accounting
for heterogeneity among large shareholders in empirical research. In our final analyses we show
that blockholders’ styles are persistent over time. More importantly, we show that when
blockholders who are associated with higher FRQ hold stakes in the firm, firms exhibit more
persistent earnings in the future.
29
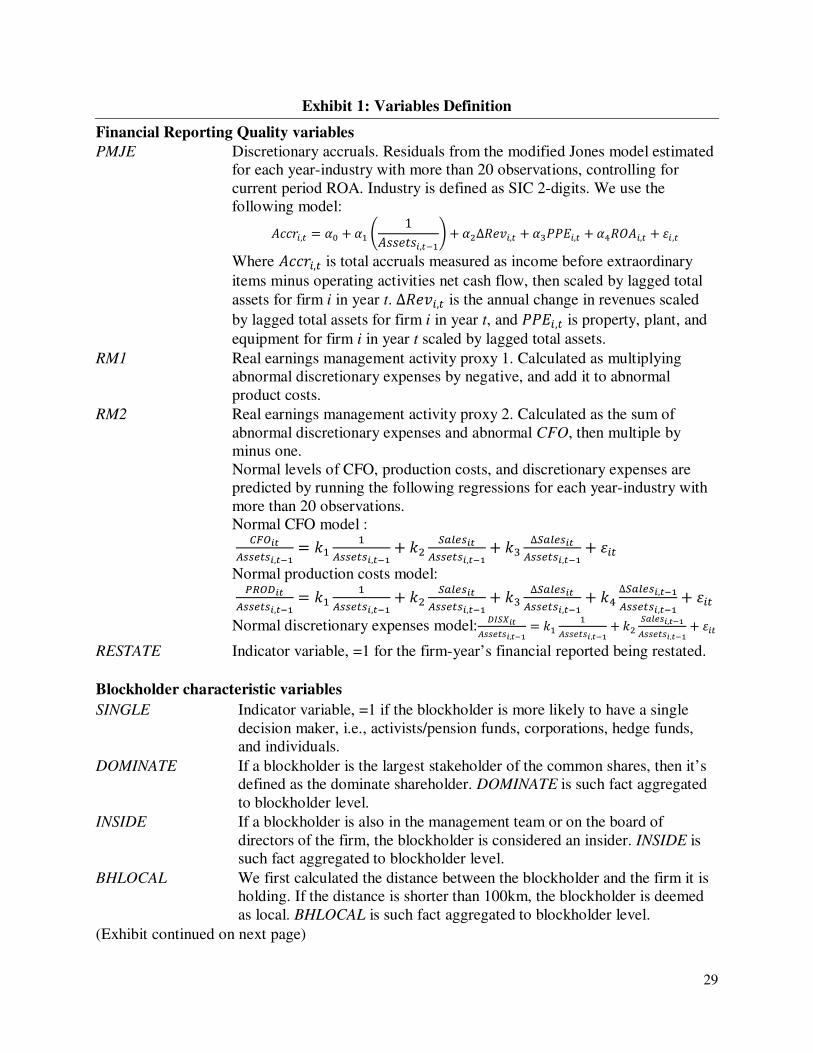
Exhibit 1: Variables Definition
Financial Reporting Quality variables
PMJE Discretionary accruals. Residuals from the modified Jones model estimated
for each year-industry with more than 20 observations, controlling for
current period ROA. Industry is defined as SIC 2-digits. We use the
following model:
�����,� = �� + �� ; 1�==(>=�,�?�@ + �&∆�()�,� + �*++,�,� + �-����,� + ��,�
Where �����,� is total accruals measured as income before extraordinary
items minus operating activities net cash flow, then scaled by lagged total
assets for firm i in year t. ∆�()�,� is the annual change in revenues scaled
by lagged total assets for firm i in year t, and ++,�,� is property, plant, and
equipment for firm i in year t scaled by lagged total assets.
RM1 Real earnings management activity proxy 1. Calculated as multiplying
abnormal discretionary expenses by negative, and add it to abnormal
product costs.
RM2 Real earnings management activity proxy 2. Calculated as the sum of
abnormal discretionary expenses and abnormal CFO, then multiple by
minus one.
Normal levels of CFO, production costs, and discretionary expenses are
predicted by running the following regressions for each year-industry with
more than 20 observations.
Normal CFO model :
./0!"
��� ��!,"#$ = 1� ���� ��!,"#$ + 1& 234 �!"
��� ��!,"#$ + 1* ∆234 �!"��� ��!,"#$ + ���
Normal production costs model:
�708!"
��� ��!,"#$ = 1� ���� ��!,"#$ + 1& 234 �!"
��� ��!,"#$ + 1* ∆234 �!"��� ��!,"#$ + 1- ∆234 �!,"#$
��� ��!,"#$ + ��� Normal discretionary expenses model:
892:!"��� ��!,"#$ = 1� �
��� ��!,"#$ + 1& 234 �!,"#$��� ��!,"#$ + ���
RESTATE Indicator variable, =1 for the firm-year’s financial reported being restated.
Blockholder characteristic variables
SINGLE Indicator variable, =1 if the blockholder is more likely to have a single
decision maker, i.e., activists/pension funds, corporations, hedge funds,
and individuals.
DOMINATE If a blockholder is the largest stakeholder of the common shares, then it’s
defined as the dominate shareholder. DOMINATE is such fact aggregated
to blockholder level.
INSIDE If a blockholder is also in the management team or on the board of
directors of the firm, the blockholder is considered an insider. INSIDE is
such fact aggregated to blockholder level.
BHLOCAL We first calculated the distance between the blockholder and the firm it is
holding. If the distance is shorter than 100km, the blockholder is deemed
as local. BHLOCAL is such fact aggregated to blockholder level.
(Exhibit continued on next page)

30
Exhibit 1: Variables Definition (continued)
Fir characteristics variables:
SIZE The natural logarithm of total assets
ROA Net income (ibt) divided by lagged total assets (att−1)
LOSS Indicator variable for negative net income
LEV Long-term debt (dlttt) to the sum of long-term debt and book value of
equity (ceqt).
BTM The book (att - ltt) to market (prcc_ft×cshot) ratio.
CFOVOL Cash flow from operation volatility, calculated as the standard deviation of
CFO in the past five years.
REVVOL Revenue volatility, calculated as the standard deviation of sales in the past
five years.
OPTION The Black-Scholes value of option compensation as a proportion of total
compensation received by the CEO and the CFO of a firm.
BONUS The average bonus compensation as a proportion of total compensation
received by the CEO and the CFO of a firm.
PRES Indicator variable, equals to 1 if at least one reputable blockholder has a
stake in the firm, and zero otherwise. Reputable blockholders are defined
as those with estimated fixed effects for corresponding FRQ variable in the
lowest three deciles.
Blockholder type indicator variables: =1 if the firm has this type as a blockholder, 0
otherwise
AP Activists and pension funds
B Banks and trusts
C Corporations
H Hedge funds
I Insurance companies and money managers
M Mutual funds
V Venture capitals and LBOs
X Individuals
31
References
Admati, A. R., P. Pfleiderer, and J. Zechner. 1994. Large shareholder activism, risk sharing, and financial
market equilibrium. Journal of Political Economy 102: 1097-1130. Agrawal, A., and S. Chadha. 2005. Corporate governance and accounting scandals. Journal of Law and
Economics XLVIII: 371-406.
Ali, A., T. Chen, and S. Radhakrishnan. 2007. Corporate disclosures by family firms. Journal of
Accounting and Economics 44: 238-286. Armstrong, C. S, W. R. Guay, and J. P. Weber. 2010. The role of information and financial reporting in
corporate governance and debt contracting. Journal of Accounting and Economics 50 (2-3): 179-
234. Ayers, B., S. Ramalingegowda, and P. Yeung. 2011. Hometown advantage: The effects of monitoring
institution location on financial reporting discretion. Journal of Accounting and Economics 52:
41-61. Balsam, S., E. Bartov, and C. Marquardt. 2002. Accruals management, investor sophistication, and equity
valuation: Evidence from 10-Q Filings. Journal of Accounting Research 40: 987-1012.
Bamber, L., J. Jiang, and I. Wang. 2010. What’s my style? The influence of top managers and their
personal backgrounds on voluntary corporate financial disclosure. The Accounting Review 85: 1131-1162.
Bartov, E., Radhakrishnan, I. Krinsky. 2000. Investor sophistication and Patterns in stock returns after
earnings announcements. The Accounting Review 75: 43-63. Beasley, M.S. 1996. An empirical analysis of the relation between the board of director composition and
financial statement fraud. The Accounting Review 71: 443-465.
Becht, M., J. Franks, C. Mayer, and S. Rossi. 2009. Returns to shareholder activism: Evidence from a clinical study of the Hermes U.K. Focus Fund. Review of Financial Studies 22: 3093-3129.
Becker, B., H. Cronqvist, and R. Fahlenbrach. 2011. Estimating the effects of large shareholders using a
geographic instrument. Journal of Financial and Quantitative Analysis 46: 907-942.
Bertrand, M., and S. Mullainathan. 2003. Enjoying the quiet life? Corporate governance and managerial preferences. Journal of Political Economy 111: 1043-1075.
Bertrand, M., and A. Schoar. 2003. Managing with style: The effect of managers on firm policies.
Quarterly Journal of Economics 118: 1169-1208. Beyer, A., D. A. Cohen, T. Z. Lys, and B. R. Walther. 2010. The financial reporting environment: Review
of recent literature. Journal of Accounting and Economics 50 (203): 295-343.
Brav, A., W. Jiang, F. Partnoy, and R. Thomas. 2008. Hedge fund activism, corporate governance, and
firm performance. Journal of Finance 63, 1729-1775. Brickley, J., R. Lease, and C. Smith. 1988. Ownership structure and voting on antitakeover amendments.
Journal of Financial Economics 20: 267-291.
Burgstahler, D., L. Hail, and C. Leuz. 2006. The importance of reporting incentives: Earnings management in European private and public firms. The Accounting Review 81: 983-1016.
Burns, N., S. Kedia, and M. Lipson. 2010. Institutional ownership and monitoring: Evidence from
financial misreporting. Journal of Corporate Finance 16: 443-455. Bushee, B. 1998. The influence of institutional investors on myopic R&D investment behavior. The
Accounting Review 73: 305-333.
Bushee, B. and Noe, C., 2000. Corporate disclosure practices, institutional investors, and stock return
volatility. Journal of Accounting Research 38: 171–202. Bushman, R., Q. Chen, E. Engel, and A. Smith. 2004. Financial accounting information, organizational
complexity and corporate governance systems. Journal of Accounting and Economics 37: 167-
201. Bushman, R., and R. Wittenberg-Moerman. 2012. The role of bank reputation in “certifying” future
performance implications of borrowers’ accounting numbers. Journal of Accounting Research 50:
883-930.

32
Carlton, W., J. Nelson, M. Weisbach. 1998. The influence of institutions on corporate governance through
private negotiations: Evidence from TIAA-CREF. Journal of Finance 53: 1335-1362. Chen, S., X. Chen, and Q. Cheng. 2008. Do family firms provide more or less voluntary disclosure?
Journal of Accounting Research 46 (3): 499-536.
Cheng, A., H. Huang, Y. Li, and G. Lobo. 2010. Institutional monitoring through shareholder litigation.
Journal of Financial Economics 95: 356-383. Chhaochharia, V., A. Kumar, and A. Niessen-Ruenzi. 2012. Local investors and corporate governance.
Journal of Accounting and Economics 54: 42-67.
Chung, R., M. Firth, and J. Kim. 2002. Institutional monitoring and opportunistic earnings management. Journal of Corporate Finance 8: 29-48.
Cronqvist, H., and R. Fahlenbrach. 2009. Large shareholders and corporate policies. Review of Financial
Studies 22: 3941-3976. Cohen, D., A. Dey, and T. Lys. 2008. Real and accrual-based earnings management in the pre- and post-
Sarbanes-Oxley period. The Accounting Review 83: 757-787.
Cohen, D., and P. Zarowin. 2010. Accrual-based and real earnings management activities around
seasoned equity offerings. Journal of Accounting and Economics 50: 2-19. Dechow, P., I. Dichev. 2002. The quality of accruals and earnings: The role of accrual estimation errors.
The Accounting Review 77: 35-59.
Dechow, P., W. Ge, and C. Schrand. 2010. Understanding earnings quality: A review of the proxies, their determinants and their consequences. Journal of Accounting and Economics 50: 344-401.
Dechow, P., S.P. Kothari, and R. Watts. 1998. The relation between earnings and cash flows. Journal of
Accounting and Economics 25: 133-168. Dechow, P., R. Sloan, and A. Sweeney. 1996. Causes and consequences of earnings manipulation: An
analysis of firms subject to enforcement actions by the SEC. Contemporary Accounting Research
13: 1-36.
DeFond, M., and J. Jiambalvo. 1991. Incidence and circumstances of accounting errors. The Accounting
Review 66: 643-655.
Del Guercio, D., and J. Hawkins. 1999. The motivation and impact of pension fund activism. Journal of
Financial Economics 52: 293-340. DeMarzo, P. and B. Urosevic. 2006. Ownership dynamics and asset pricing with a large shareholder.
Journal of Political Economy 114: 774-815.
Dlugosz, J., R. Fahlenbrach, P, Gompers, and A. Metrick. 2006. Large blocks of stock: Prevalence, size,
and measurement. Journal of Corporate Finance 12: 594–618. Edmans, A. 2009. Blockholder trading, market efficiency, and Managerial myopia. Journal of Finance
64: 2481-2513.
Edmans, A., and G. Manso. 2011. Governance through trading and intervention: A theory of multiple blockholders. Review of Financial Studies 24: 2396-2428.
Farber, D. 2005. Restoring trust after fraud: Does corporate governance matter? The Accounting Review
80: 539-561. Feng, M., W. Ge, S. Luo, and T. Shevlin. 2011. Why do CFOs become involved in material accounting
manipulations? Journal of Accounting and Economics 51: 21-36.
Francis, J., K. Schipper, and L. Vincent. 2005. Earnings and dividend informativeness when cash flow
rights are separated from voting rights. Journal of Accounting and Economics 39: 329-360. Ge, W., D. Matsumoto, and J. Zhang. 2011. Do CFOs have styles of their own? An empirical
investigation of the effect of individual CFOs on financial reporting practices. Contemporary
Accounting Research 28: 1141-1179. Gillan, S., and L. Starks. 2000. Corporate governance proposals and shareholder activism: The role of
institutional investors. Journal of Financial Economics 57: 275-305.
Givoly, D., C. Hayn, and S. Katz. 2010. Does public ownership of equity improve earnings quality? The
Accounting Review 85: 195-225.

33
Graham, J. R., C. R. Harvey, and S. Rajgopal. 2005. The economic implications of corporate financial
reporting. Journal of Accounting and Economics 40: 3-73.Grossman, S., and O. Hart. 1980. Takeover bids, the free-rider problem, and the theory of the corporation. Bell Journal of
Economics 11: 42-64.
Guthrie, K., and J. Sokolowsky. 2010. Large shareholders and the pressure to manage earnings. Journal
of Accounting and Economics 16: 302-319. Hartzell, J., and L. Starks. 2003. Institutional investors and executive compensation. The Journal of
Finance 58: 2351-2374.
Hennes, K., A. Leone, and B. Miller. 2008. The importance of distinguishing errors from irregularities in restatement research: the case of restatements and CEO/CFO turnover. The Accounting Review 83
(6): 1487–1519.
Holderness, C. 2009. The myth of diffuse ownership in the United States. Review of Financial Studies 22: 1377-1408.
Hope, O.-K., and W.B. Thomas. 2008. Managerial empire building and firm disclosure. Journal of
Accounting Research 46: 591-626.
Hope, O.-K., W.B. Thomas, and D. Vyas. 2013. Financial reporting quality of U.S. private and public firms. Forthcoming, The Accounting Review.
Jensen, M., and W. Meckling. 1976. Theory of the firm: Managerial behavior, agency costs, and
ownership structure. Journal of Financial Economics 3: 305-360. Karpoff, J.M., S.D. Lee, and G.S. Martin. 2008. The consequences to managers for cooking books.
Journal of Financial Economics 88: 193–215.
Katz, S. 2009. Earnings quality and ownership structure: The role of private equity sponsors. The
Accounting Review 84: 623-658.
Klein, A. 2002. Audit committee, board of director characteristics, and earnings management. Journal of
Accounting and Economics 33: 375-400.
Klein, A., and E. Zur. 2009. Entrepreneurial shareholder activism: Hedge funds and other private investors. Journal of Finance 64: 187-229.
Koh. 2007. Institutional investor type, earnings management and benchmark beaters. Journal of
Accounting and Public Policy 26: 267-299. Kothari, S.P., A. Leone, and C. Wasley. 2005. Performance matched discretionary accrual measures.
Journal of Accounting and Economics 39: 163-197
Lee, G., and R. Masulis. 2011. Do more reputable financial institutions reduce earnings management by
IPO issuers? Journal of Corporate Finance 7: 982-1000. Leone, A., and M. Liu. 2010. Accounting irregularities and executive turnover in founder-managed firms.
The Accounting Review 85 (1): 287–314.
Leuz, C., D. Nanda, and P. Wysocki. 2003. Earnings management and investor protection: An international comparison. Journal of Financial Economics 69: 505-527.
Larcker, D. F., S. A. Richardson, and I. Tuna. 2007. Corporate governance, accounting outcomes, and
organizational performance. The Accounting Review 82 (4): 963-1008. McCahery, J., Z. Sautner, and L. Starks. 2012. Behind the scenes: The corporate governance preferences
of institutional investors. Working Paper. University of Amsterdam.
Mitra, S., and W. Cready. 2005. Institutional stock ownership, accrual management, and information
environment. Journal of Accounting, Auditing, and Finance 20: 257-286. Nuys, K. 1993. Corporate governance through the proxy process: Evidence from the 1989 Honeywell
proxy solicitation. Journal of Financial Economics 34: 101-132.
Parrino, R., R. Sias, and L. Starks. 2003. Voting with their foot: Institutional ownership changes around forced CEO turnover. Journal of Financial Economics 68: 3-46.
Pound, J. 1988. Proxy contests and the efficiency of shareholder oversight. Journal of Financial
Economics 20: 237-265. Rajgopal S., and M. Venkatachalam. 1997. The role of institutional investors in corporate governance: An
empirical investigation. Working Paper. University of Washington.

34
Ramalingegowda, S., and Y. Yu. 2012. Institutional ownership and conservatism. Journal of Accounting
and Economics 53: 98-114. Roychowdhury, S. 2006. Earnings management through real activities manipulation. Journal of
Accounting and Economics 42: 335-370.
Sade, O., and E. Zur. 2010. A leopard does not change his spots –Evidence of activism persistence in the
hedge fund industry. Working Paper. Baruch College. Shleifer, A., and R. Vishny. 1986. Large shareholders and corporate control. Journal of Political
Economy 94: 461-488.
Wang, D. 2006. Founding family ownership and earnings quality. Journal of Accounting Research 44: 619-656.
Xie, H. 2001. The mispricing of abnormal accruals. The Accounting Review 76: 357-373.
Yang, H. 2012. Capital market consequences of managers’ voluntary disclosure styles. Journal of
Accounting and Economics 53: 167-184.
Zang, A. 2012. Evidence on the trade-off between real activities manipulation and accrual-based earnings
management. The Accounting Review 87: 675-703.
Zur, E. 2009. The power of reputation: Hedge fund activists. Working Paper. Baruch College.

35
Table 1 Panel A: Firm Characteristics Variable N Mean Median p25 p75 Std Dev
PMJE 8,404 -0.001 0.000 -0.028 0.029 0.061
RM1 7,923 -0.208 -0.101 -0.459 0.140 2.431
RM2 7,963 -0.076 -0.084 -0.359 0.084 2.157
RESTATE 8,409 0.137 0.000 0.000 0.000 0.343
SIZE 8,264 7.130 6.980 6.095 8.052 1.491
LEV 8,264 0.297 0.281 0.036 0.460 1.095
BTM 8,260 1.674 0.454 0.285 0.689 108.300
ROA 8,408 0.025 0.051 0.008 0.089 0.228
LOSS 8,265 0.222 0.000 0.000 0.000 0.415
CFOVOL 7,542 0.064 0.047 0.029 0.077 0.067
REVVOL 7,542 0.259 0.176 0.098 0.312 0.332
OPTION 8,089 0.162 0.000 0.000 0.366 0.238
BONUS 8,089 0.251 0.249 0.000 0.435 0.268
SHPCT 8,409 23.852 21.500 13.360 31.600 13.855
Table 1 Panel A provides descriptive statistics for firm characteristics. Our sample spans from
2001-2009, covering 8,409 firm-year observations and 23,555 firm-year-blockholder
observations. Please see Exhibit 1 for variables definition.

36
Table 1 Panel B: Blockholder Characteristics: 2001-2009
Holding time by BH type (in years)
Percentage holding by BH type (in %) % of insiders
Type N Mean p25 p75 sd
Mean p25 p75 sd
Mean
Activists/pension funds 15 2.06 1 2 1.55
10.43 6.48 13.58 6.29
16.32%
Banks/trusts 27 1.88 1 2 1.52
8.02 5.64 8.90 5.21
4.86%
Corporations 19 2.67 1 4 2.35
20.18 8.40 27.20 17.08
48.70%
Hedge funds 161 1.64 1 2 1.06
9.00 5.72 9.50 6.70
9.11%
Money managers/insurance companies 194 2.06 1 3 1.47
8.15 5.86 9.70 3.08
0.90%
Mutual funds 94 2.37 1 3 1.73
8.35 6.00 9.91 5.38
0.33%
Venture capital/LBO 37 2.51 1 3 1.98
13.88 7.20 16.20 10.37
31.43%
Individuals 27 2.89 1 4 2.20
9.96 6.30 10.75 5.16
35.02%
Overall 574 2.19 1 3 1.59
8.65 5.89 9.99 5.06
13.49%
Table 1 Panel B provides descriptive statistics for blockholders. Blockholders are defined as shareholders with equal or greater than
5% of common share. We further categorize them into eight groups: activisms/pension funds, banks/trusts, hedge funds, money
managers/insurance companies, mutual funds, venture capital/LBO, and individuals. In our later tables, we use AP, B, C, H, I, M, V,
and X to represent these categories, respectively.

37
Table 2: Large Shareholders and Accounting Choices: Average Blockholder Type Effects
PMJE
RM1
RM2
RESTATE
Variable
Coef. p-value
Coef. p-value
Coef. p-value
Coef. p-value
AP
-0.001 0.828
-0.005 0.786
0.000 0.984
0.058* 0.057
B
0.000 0.877
0.008 0.260
0.007 0.134
-0.009 0.569
C
-0.005 0.608
0.006 0.844
0.021 0.286
-0.106* 0.098
H
0.004 0.184
-0.004 0.549
0.003 0.571
-0.039*** 0.006
I
0.003* 0.083
-0.001 0.764
-0.001 0.684
0.001 0.898
M
0.000 0.902
-0.001 0.877
-0.003 0.603
-0.022 0.130
V
0.000 0.997
-0.008 0.648
-0.011 0.358
-0.009 0.776
X
0.011 0.228
0.044 0.102
0.032* 0.063
-0.043 0.309
SIZE
0.002 0.568
-0.010 0.391
-0.023*** 0.005
0.046*** 0.003
ROA
0.088*** 0.000
-0.039 0.184
-0.064*** 0.002
-0.061 0.149
BTM
0.005 0.112
0.024*** 0.001
0.023*** 0.000
0.029* 0.072
LEV
0.009 0.188
0.034** 0.012
0.047*** 0.000
0.009 0.744
CFOVOL
0.034** 0.044
-0.055 0.123
-0.009 0.762
0.207** 0.019
REVVOL
-0.001 0.828
-0.003 0.798
0.001 0.870
0.016 0.298
OPTION
0.002 0.657
0.013 0.253
0.007 0.389
-0.001 0.979
BONUS
-0.001 0.858
-0.003 0.757
-0.002 0.748
-0.045*** 0.007
Year FE
YES
YES
YES
YES
Firm FE
YES
YES
YES
YES
F-test of type FE 0.866
0.597
1.161
2.019**
p-value
0.545
0.781
0.319
0.041
Table 2 provides the results regressing accounting choice variables on blockholder type indicators and control variables. We classify blockholders
into the following categories: (1) activists and pension funds, (2) banks and trust companies, (3) corporations, (4) hedge funds, (5) insurance
companies and money managers, (6) mutual funds, (7) venture capitals and LBOs, and (8) individuals. We use AP, B, C, H, I, M, V, and X to label
these categories, respectively. In this table, we show that blockholder type indicators only explain a small portion of the variation of accounting
choice variables. We further test the joint significance of blockholder type fixed effects, and we are unable to reject any of the null hypotheses that
they are all equal to zero. ***, **, and * indicate significance at the 0.01, 0.05, and 0.1 level, respectively, based on two-tailed tests.

38
Table 3: Blockholder Fixed Effects and Accounting Choices
PMJE RM1 RM2 RESTATE
Activists/pension funds 2.745*** 23.190*** 6.407*** 10.196***
<0.001 <0.001 0.000 0.000
Banks/trusts 3.577*** 2.901*** 2.316*** 1.672*
<0.001 <0.001 <0.001 0.016
Corporations 1.960** 1.587* 2.227*** 7.451***
0.017 0.064 0.003 <0.001
Hedge funds 2.854*** 2.919*** 2.406*** 3.971***
<0.001 <0.001 <0.001 <0.001
Money managers/insurance companies 4.558*** 2.302*** 1.648*** 3.118***
<0.001 <0.001 <0.001 <0.001
Mutual funds 1.957*** 1.094 0.923 7.733***
<0.001 0.254 0.688 <0.001
Venture capitals/LBOs 39.622*** 12.942*** 4.699*** 233.769***
<0.001 <0.001 <0.001 <0.001
Individuals 2.449*** 3.977*** 1.893*** 31.473**
0.001 <0.001 0.006 <0.001
ALL 387.63*** 670.41*** 253.90*** 32,400.00***
<0.001 <0.001 <0.001 <0.001
Number of significant FE 121 100 80 118
Adj. R2 without FE 1.32% 9.94% 7.94% 4.27%
Adj. R2 with FE 9.67% 14.20% 9.52% 13.23%
Coefficients are in the top row and p-values in the bottom row. ***, **, and * indicate
significance at the 0.01, 0.05, and 0.1 level, respectively, based on two-tailed tests.

39
Table 4: Blockholder Fixed Effects Distribution
Variable N mean sd p50 p5 p95 p25 p75
All PMJE 574 -0.001 0.044 0.000 -0.086 0.063 -0.018 0.017
RM1 574 0.035 1.153 0.000 -1.593 1.783 -0.421 0.462
RM2 574 0.017 0.955 0.000 -1.424 1.488 -0.413 0.364
RESTATE 574 -0.020 0.260 -0.007 -0.493 0.394 -0.104 0.064
type = PMJE 15 -0.007 0.053 -0.009 -0.098 0.090 -0.029 0.026
Activists/ RM1 15 -0.951 1.481 -0.854 -3.990 1.003 -1.676 0.159
pension funds RM2 15 -0.830 1.155 -0.656 -3.073 0.563 -1.441 0.302
RESTATE 15 0.146 0.290 0.025 -0.148 0.951 -0.026 0.241
type = PMJE 27 0.013 0.045 0.000 -0.034 0.131 -0.013 0.032
Banks/trusts RM1 27 0.219 1.477 0.042 -1.363 4.225 -0.773 0.548
RM2 27 0.212 1.336 -0.020 -1.213 4.073 -0.537 0.260
RESTATE 27 -0.042 0.207 -0.033 -0.332 0.222 -0.151 0.056
type = PMJE 19 -0.008 0.054 0.000 -0.141 0.073 -0.021 0.029
Corporations RM1 19 0.348 1.628 0.043 -3.492 3.411 -0.542 1.728
RM2 19 -0.150 1.313 0.000 -3.073 2.915 -0.896 0.441
RESTATE 19 0.034 0.418 -0.005 -0.613 0.951 -0.235 0.011
type = PMJE 161 -0.005 0.049 0.000 -0.095 0.062 -0.025 0.018
Hedge funds RM1 161 0.013 1.196 0.000 -1.870 1.582 -0.475 0.494
RM2 161 0.050 1.003 0.009 -1.228 1.584 -0.445 0.465
RESTATE 161 -0.034 0.277 -0.030 -0.514 0.448 -0.166 0.064
type = PMJE 194 0.000 0.041 0.000 -0.065 0.061 -0.019 0.018
Insurance companies/ RM1 194 0.092 1.077 0.037 -1.482 1.783 -0.421 0.524
Money managers RM2 194 0.018 0.899 -0.041 -1.261 1.343 -0.445 0.398
RESTATE 194 -0.003 0.214 -0.001 -0.328 0.394 -0.080 0.084
type = PMJE 94 -0.001 0.030 -0.002 -0.031 0.043 -0.010 0.008
Mutual funds RM1 94 0.083 0.536 0.041 -0.841 1.249 -0.169 0.254
RM2 94 0.074 0.478 0.007 -0.610 1.071 -0.190 0.224
RESTATE 94 -0.012 0.127 -0.004 -0.162 0.160 -0.059 0.027
type = PMJE 37 0.005 0.056 0.003 -0.130 0.080 -0.013 0.038
Venture capitals/ RM1 37 -0.048 1.449 0.000 -2.446 2.898 -0.695 0.625
LBOs RM2 37 0.024 1.002 0.000 -1.589 2.239 -0.566 0.581
RESTATE 37 -0.140 0.438 0.000 -0.956 0.444 -0.349 0.084
type = PMJE 27 0.008 0.043 0.000 -0.042 0.121 -0.014 0.020
Individuals RM1 27 -0.159 1.405 -0.081 -1.870 1.717 -0.446 0.280
RM2 27 0.006 1.234 0.000 -2.388 2.103 -0.397 0.311
RESTATE 27 -0.036 0.322 0.000 -0.585 0.521 -0.128 0.039
Table 4 provides the distribution of the estimated blockholder fixed effects.

40
Table 5: Evidence on “Influence” versus “Selection”
Variable ALL
Activists/
Pension funds
Banks/
trusts Corporations Hedge funds
Insurance companies/
Money managers Mutual funds
Venture capitals/
LBOs Individuals
PMJE 0.028 0.718 0.282 0.165 -0.174 0.298 -0.089 -0.333** -0.189
RM1 -0.063*** 0.000 0.013 0.038 -0.154* -0.005 -0.146*** -0.134*** -0.035
RM2 -0.072*** 0.000 0.042 0.033 -0.246*** -0.007 -0.176*** -0.154*** 0.018
RESTATE -0.028 0.452 0.217 0.508** -0.034 -0.05 -0.117 0.182 -0.049
The observed pairing between firms and large shareholders can be explained by both the selection hypothesis and the influence
mechanism. To differentiate such possibilities, we construct a pseudo blockholder sample: in this sample, we estimate blockholder fixed
effects as if each blockholder had a stake in the firm two years prior to its actual investment, and exited before its actual holding starts.
Then we correlate this pseudo fixed effects with our actual fixed effects using the real sample. Under the selection interpretation, we
expect the effects to correlate positively because firms’ accounting choices just prior to and after a blockholder’s investment are similar.
Under the influence interpretation, we would expect a negative correlation or no relation, depending how blockholders choose firms to
influence. ***, **, and * indicate significance at the 0.01, 0.05, and 0.1 level, respectively, based on two-tailed tests.

41
Table 6: Explaining the Sources of FE Estimators
PMJE RM1 RM2 RESTATE
DOMINATE 0.004 0.106 0.184 -0.117***
0.606 0.54 0.199 0
INSIDE -0.002 -0.361** -0.437*** -0.007
0.848 0.047 0.004 0.845
SINGLE -0.007* -0.114 -0.077 -0.025*
0.052 0.139 0.23 0.085
BHLOCAL -0.001 0.017 0.035 -0.016*
0.823 0.912 0.778 0.084
CONSTANT -0.003 -0.023 -0.063 0.024*
0.385 0.733 0.257 0.06
Adj. R2 0.011 0.025 0.004 0.024
Table 6 explores whether some observable blockholder characteristics can explain the estimated
fixed effects. SINGLE is an indicator variable for blockholders that are likely to have a single
decision maker. DOMINATE measures how often the blockholder is the largest shareholder.
INSIDE is an indicator variable for insider blockholder (controlling party in the management
team or in the board of directors). BHLOCAL is an indicator variable for blockholders that are
within 100km distance from the firm they are holding. ***, **, and * indicate significance at the
0.01, 0.05, and 0.1 level, respectively, based on two-tailed tests.

42
Table 7: Out-of-Sample Test: Presence of “Reputable” Blockholders and ROA persistence (2006-2009)
ROAt+1 ROA t+2 ROA t+3
PRES calculated based on PRES calculated based on PRES calculated based on
PMJE RM1 RM2 RESTATE PMJE RM1 RM2 RESTATE PMJE RM1 RM2 RESTATE
ROA 0.437*** 0.385*** 0.400*** 0.418*** 0.378*** 0.282*** 0.306*** 0.308*** 0.476*** 0.351*** 0.397*** 0.330***
0.000 0.000 0.000 0.000 0.000 0.000 0.000 0.000 0.000 0.000 0.000 0.000
ROA×PRES 0.112*** 0.056* 0.079** 0.106*** 0.152*** 0.036 0.069** 0.074** 0.174*** 0.023 0.093* 0.011
0.003 0.072 0.011 0.001 0.000 0.278 0.039 0.030 0.003 0.628 0.053 0.822
PRES 0.005 0.002 0.004 0.006 0.013** 0.004 0.006 0.005 0.017** 0.008 0.014*** 0.003
0.267 0.655 0.347 0.117 0.012 0.368 0.110 0.242 0.014 0.128 0.008 0.564
SIZE 0.005*** 0.005*** 0.005*** 0.005*** 0.006*** 0.006*** 0.006*** 0.006*** 0.006*** 0.006*** 0.006*** 0.006***
0.000 0.000 0.000 0.000 0.000 0.000 0.000 0.000 0.000 0.000 0.000 0.000
LEV -0.029*** -0.029*** -0.029*** -0.029*** -0.046*** -0.047*** -0.046*** -0.046*** -0.037*** -0.037*** -0.037*** -0.037***
0.000 0.000 0.000 0.000 0.000 0.000 0.000 0.000 0.000 0.000 0.000 0.000
BTM -0.079*** -0.078*** -0.078*** -0.079*** -0.088*** -0.093*** -0.087*** -0.088*** -0.093*** -0.093*** -0.093*** -0.092***
0.000 0.000 0.000 0.000 0.000 0.000 0.000 0.000 0.000 0.000 0.000 0.000
CFOVOL -0.194*** -0.199*** -0.199*** -0.195*** -0.244*** -0.248*** -0.251*** -0.250*** -0.208*** -0.209*** -0.207*** -0.211***
0.000 0.000 0.000 0.000 0.000 0.000 0.000 0.000 0.001 0.001 0.001 0.001
REVVOL -0.012 -0.011 -0.011 -0.010 -0.025** -0.020* -0.023** -0.023** -0.034** -0.031** -0.031** -0.032**
0.262 0.301 0.306 0.351 0.031 0.088 0.048 0.048 0.014 0.022 0.024 0.018
OPTION -0.018** -0.018** -0.018** -0.018** -0.033*** -0.007 -0.033*** -0.033*** -0.010 -0.010 -0.010 -0.010
0.027 0.024 0.026 0.026 0.000 0.466 0.000 0.000 0.311 0.313 0.308 0.305
BONUS 0.013** 0.013** 0.014** 0.013** 0.005 0.008 0.005 0.005 -0.005 -0.005 -0.005 -0.005
0.022 0.019 0.016 0.018 0.416 0.188 0.371 0.401 0.526 0.528 0.538 0.498
LOSS -0.001 0.000 -0.001 -0.001 -0.001 -0.001 0.000 0.000 0.001 0.002 0.001 0.003
0.886 0.966 0.927 0.870 0.907 0.931 0.960 0.992 0.905 0.783 0.891 0.743
YEAR FE YES YES YES YES YES YES YES YES YES YES YES YES
Adj. R2 22.60% 22.50% 22.50% 22.60% 18.60% 18.80% 18.40% 18.40% 17.00% 16.80% 16.90% 16.70%
This table presents whether the presence of certain “reputable” blockholders (PRES; defined as those associated with the highest three deciles of FRQ) enhances
ROA persistence. Coefficients are in the top row and p-values in the bottom row. ***, **, and * indicate significance at the 0.01, 0.05, and 0.1 level,
respectively, based on two-tailed tests.