Embed Size (px)
Citation preview

Large-Scale Solar Eruptions
Natchimuthukonar Gopalswamy
Abstract This chapter provides an over view of coronal mass ejections (CMEs)and the associated flares including statistical properties, associated phenomena(solar energetic particles, interplanetary shocks, geomagnetic storms), and theirheliospheric consequences.
1 Introduction
A solar eruption can be defined as a transient ejection of material from the solaratmosphere. Transient eruptions occur from closed field regions of all sizes, startingfrom bright points to large active regions. In this chapter, we consider only thoseeruptions, which have observable manifestations in white light images obtained bycoronagraphs. Coronagraphs are instruments that have an occulting disk that blockthe bright solar disk so the faint corona can be observed by means of Thomsonscattered photospheric light. In coronagraph images, the large-scale eruptions areobserved as moving bright features. Usually moving features with an angular widthof a few degrees or more are known as coronal mass ejections (CMEs). Solar flaresassociated with CMEs are known as eruptive flares in contrast to compact flares,which are not associated with any mass motion. Flares represent electromagneticemission observed prominently in soft X-rays, EUV, and H-alpha. Nonthermal emis-sion is also observed over the entire radio spectrum (from kilometric to millimetricwavelengths), hard X-rays, and gamma rays. Flares cause enhanced ionization inthe terrestrial ionosphere causing sudden ionospheric disturbances (SIDs) that seri-ously affect radio communication and navigation (Davies 1990). Energetic particlesaccelerated in flares and CME-driven shocks can be potentially harmful to spacetechnology and humans in space. Energetic CMEs propagate far into the helio-sphere causing observable effects along their path, sometimes all the way to the
N. GopalswamyNASA Goddard Space Flight Center, Greenbelt, MD 20771, USAe-mail: [email protected]
N. Gopalswamy et al. (eds.), Heliophysical Processes, Astrophysics and Space ScienceProceedings, DOI 10.1007/978-3-642-11341-3 4,c� Springer-Verlag Berlin Heidelberg 2010
53

54 N. Gopalswamy
heliospheric termination shock. When CMEs arrive at Earth, they can couple to themagnetosphere causing intense geomagnetic storms, which have implications to alllayers of Earth’s atmosphere and the ground. This chapter provides an overview ofCMEs and flares, the two main aspects of large-scale solar eruptions. Several reviewarticles exist on these topics (see the articles in the recent Geophysical MonographsGopalswamy et al. 2006a; Song et al. 2001). A more detailed description of theeruption events can be found in (Gopalswamy 2007).
2 A Large-Scale Eruption Illustrated
CMEs have different manifestations depending on the wavelength of observationand the heliocentric distance. CMEs originate from regions on the Sun where themagnetic field lines connect opposite polarities. These regions are the active regionsand filament regions, where the magnetic field strength is elevated with respect tothe quiet Sun. Most active regions contain sunspots and also filaments. Quiescent fil-ament regions have no sunspots. Figure 1 has a magnetogram and an H-alpha imageshowing active regions as compact magnetic regions and filament regions as diffusemagnetic regions. Both types of magnetic regions are potential sources of CMEs.Filaments consist of cool material (�8;000 K) compared to the hot (�2 MK) corona.Filaments are suspended in the corona and are roughly aligned with the polar-ity inversion line of the magnetic regions, while their ends are rooted in opposite
Fig. 1 A line of sight magnetogram from the Big Bear Solar Observatory taken at 15:21:03 UT(left) and an H-alpha image from the Kanzelhoehe observatory taken at 08:14:58 (right) both on2005 May 13. In the magnetogram, white and black represent positive (north) and negative (south)magnetic polarities, respectively. The elongated dark features in the H-alpha image are the fila-ments. One of the active regions (AR 10759) is marked “A”. One of the filaments is marked “B”.Note that the active region magnetic fields are intense and the filaments are generally thin. In thefilament regions, the magnetic field is also enhanced compared to the quiet Sun, bipolar, and morediffuse
Large-Scale Solar Eruptions 55
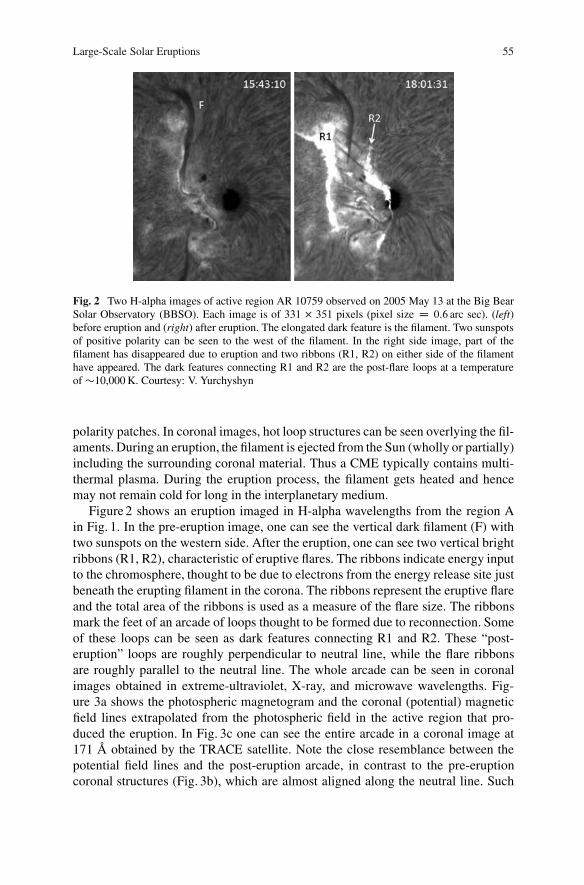
Fig. 2 Two H-alpha images of active region AR 10759 observed on 2005 May 13 at the Big BearSolar Observatory (BBSO). Each image is of 331 � 351 pixels (pixel size D 0:6 arc sec). (left)before eruption and (right) after eruption. The elongated dark feature is the filament. Two sunspotsof positive polarity can be seen to the west of the filament. In the right side image, part of thefilament has disappeared due to eruption and two ribbons (R1, R2) on either side of the filamenthave appeared. The dark features connecting R1 and R2 are the post-flare loops at a temperatureof �10,000 K. Courtesy: V. Yurchyshyn
polarity patches. In coronal images, hot loop structures can be seen overlying the fil-aments. During an eruption, the filament is ejected from the Sun (wholly or partially)including the surrounding coronal material. Thus a CME typically contains multi-thermal plasma. During the eruption process, the filament gets heated and hencemay not remain cold for long in the interplanetary medium.
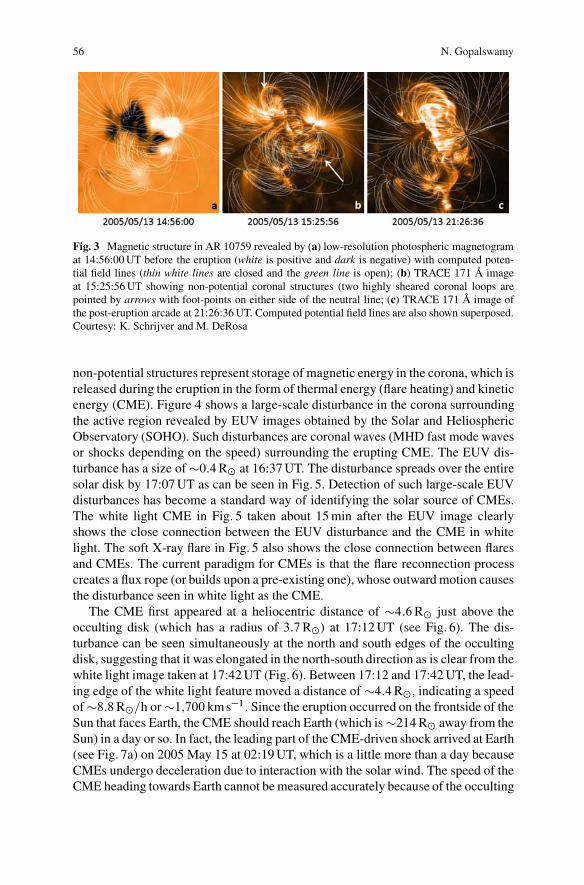
Figure 2 shows an eruption imaged in H-alpha wavelengths from the region Ain Fig. 1. In the pre-eruption image, one can see the vertical dark filament (F) withtwo sunspots on the western side. After the eruption, one can see two vertical brightribbons (R1, R2), characteristic of eruptive flares. The ribbons indicate energy inputto the chromosphere, thought to be due to electrons from the energy release site justbeneath the erupting filament in the corona. The ribbons represent the eruptive flareand the total area of the ribbons is used as a measure of the flare size. The ribbonsmark the feet of an arcade of loops thought to be formed due to reconnection. Someof these loops can be seen as dark features connecting R1 and R2. These “post-eruption” loops are roughly perpendicular to neutral line, while the flare ribbonsare roughly parallel to the neutral line. The whole arcade can be seen in coronalimages obtained in extreme-ultraviolet, X-ray, and microwave wavelengths. Fig-ure 3a shows the photospheric magnetogram and the coronal (potential) magneticfield lines extrapolated from the photospheric field in the active region that pro-duced the eruption. In Fig. 3c one can see the entire arcade in a coronal image at171 A obtained by the TRACE satellite. Note the close resemblance between thepotential field lines and the post-eruption arcade, in contrast to the pre-eruptioncoronal structures (Fig. 3b), which are almost aligned along the neutral line. Such
56 N. Gopalswamy
Fig. 3 Magnetic structure in AR 10759 revealed by (a) low-resolution photospheric magnetogramat 14:56:00 UT before the eruption (white is positive and dark is negative) with computed poten-tial field lines (thin white lines are closed and the green line is open); (b) TRACE 171 A imageat 15:25:56 UT showing non-potential coronal structures (two highly sheared coronal loops arepointed by arrows with foot-points on either side of the neutral line; (c) TRACE 171 A image ofthe post-eruption arcade at 21:26:36 UT. Computed potential field lines are also shown superposed.Courtesy: K. Schrijver and M. DeRosa
non-potential structures represent storage of magnetic energy in the corona, which isreleased during the eruption in the form of thermal energy (flare heating) and kineticenergy (CME). Figure 4 shows a large-scale disturbance in the corona surroundingthe active region revealed by EUV images obtained by the Solar and HeliosphericObservatory (SOHO). Such disturbances are coronal waves (MHD fast mode wavesor shocks depending on the speed) surrounding the erupting CME. The EUV dis-turbance has a size of �0:4 Rˇ at 16:37 UT. The disturbance spreads over the entiresolar disk by 17:07 UT as can be seen in Fig. 5. Detection of such large-scale EUVdisturbances has become a standard way of identifying the solar source of CMEs.The white light CME in Fig. 5 taken about 15 min after the EUV image clearlyshows the close connection between the EUV disturbance and the CME in whitelight. The soft X-ray flare in Fig. 5 also shows the close connection between flaresand CMEs. The current paradigm for CMEs is that the flare reconnection processcreates a flux rope (or builds upon a pre-existing one), whose outward motion causesthe disturbance seen in white light as the CME.
The CME first appeared at a heliocentric distance of �4:6 Rˇ just above theocculting disk (which has a radius of 3:7 Rˇ) at 17:12 UT (see Fig. 6). The dis-turbance can be seen simultaneously at the north and south edges of the occultingdisk, suggesting that it was elongated in the north-south direction as is clear from thewhite light image taken at 17:42 UT (Fig. 6). Between 17:12 and 17:42 UT, the lead-ing edge of the white light feature moved a distance of �4:4 Rˇ, indicating a speedof �8:8 Rˇ=h or �1;700 km s�1. Since the eruption occurred on the frontside of theSun that faces Earth, the CME should reach Earth (which is �214 Rˇ away from theSun) in a day or so. In fact, the leading part of the CME-driven shock arrived at Earth(see Fig. 7a) on 2005 May 15 at 02:19 UT, which is a little more than a day becauseCMEs undergo deceleration due to interaction with the solar wind. The speed of theCME heading towards Earth cannot be measured accurately because of the occulting

Large-Scale Solar Eruptions 57
Fig. 4 EUV images at 195 A obtained by the Solar and Heliospheric Observatory (SOHO) show-ing changes in the sheared loops (left at 16:27 UT) and large-scale diffuse disturbance surroundingthe active region (right at 16:37 UT). These are running difference images (previous image sub-tracted from the current image to reveal changes taking place during the interval between the twoimages). In the left image, the three arrows point to significant changes: the central brighteningnear the neutral line (corresponding to the beginning of the H-alpha ribbons) and the expansion ofthe sheared loops noted in Fig. 3b. In the right image, the post-eruption arcade near the neutral linehas expanded; the large-scale disturbance is shown encircled
Fig. 5 (left) White light CME detected by SOHO in its C2 telescope of the Large Angle andSpectrometric Coronagraph (LASCO) on 2005 May 13 at 17:22 UT. Superposed on this image isa EUV difference image from SOHO/EIT at 17:07 UT. Note that the EUV disturbance has spreadover the entire solar disk compared to the image at 16:37 shown in Fig. 4. (right) Soft X-ray lightcurve in two energy channels (1–8 A upper curve; 0.4–5 A lower curve). The soft X-ray detectorhas no spatial resolution, but most of the flare emission comes only from AR 10759. The time ofthe LASCO image is marked by the solid vertical line. The two dashed lines correspond to the preand post-eruption H-alpha pictures shown in Fig. 2
58 N. Gopalswamy
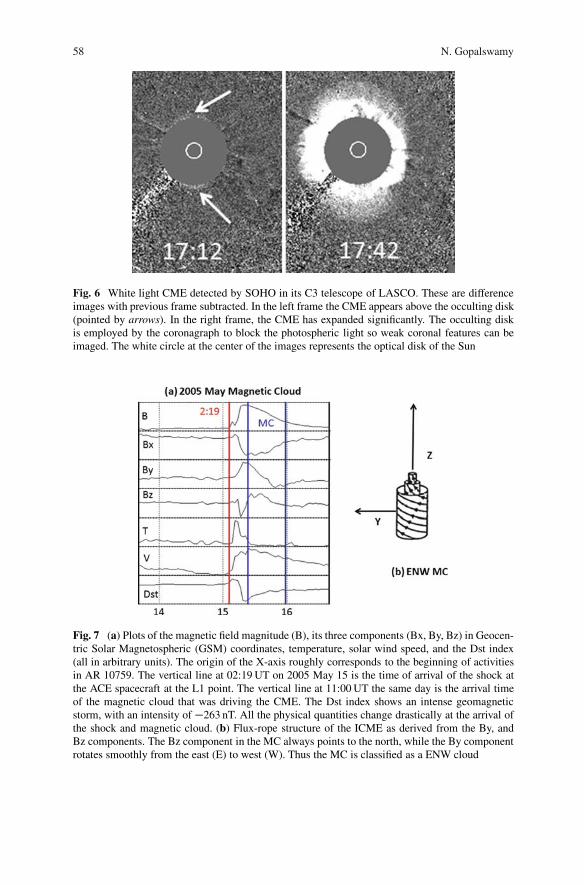
Fig. 6 White light CME detected by SOHO in its C3 telescope of LASCO. These are differenceimages with previous frame subtracted. In the left frame the CME appears above the occulting disk(pointed by arrows). In the right frame, the CME has expanded significantly. The occulting diskis employed by the coronagraph to block the photospheric light so weak coronal features can beimaged. The white circle at the center of the images represents the optical disk of the Sun
Fig. 7 (a) Plots of the magnetic field magnitude (B), its three components (Bx, By, Bz) in Geocen-tric Solar Magnetospheric (GSM) coordinates, temperature, solar wind speed, and the Dst index(all in arbitrary units). The origin of the X-axis roughly corresponds to the beginning of activitiesin AR 10759. The vertical line at 02:19 UT on 2005 May 15 is the time of arrival of the shock atthe ACE spacecraft at the L1 point. The vertical line at 11:00 UT the same day is the arrival timeof the magnetic cloud that was driving the CME. The Dst index shows an intense geomagneticstorm, with an intensity of �263 nT. All the physical quantities change drastically at the arrival ofthe shock and magnetic cloud. (b) Flux-rope structure of the ICME as derived from the By, andBz components. The Bz component in the MC always points to the north, while the By componentrotates smoothly from the east (E) to west (W). Thus the MC is classified as a ENW cloud
Large-Scale Solar Eruptions 59
disk, which introduces additional uncertainty in the CME speed. Unlike the 2-dimensional images of CMEs near the Sun, the in-situ measurements are only alonga single trajectory through the CME as it moves past the observing spacecraft. Themeasurements shown in Fig. 7a indicate that the disturbance lasted for a period of�1 day. The interplanetary CME (ICME) had a flux rope structure with its axis in theZ-direction, but it was pointing to the north (see Fig. 7b). The shock sheath aheadof the flux rope had an intense south-pointing field, which merged with Earth’smagnetic field and caused a very intense geomagnetic storm (measured by the Dst(Disturbance Storm time) index, which reached �263 nT). A CME such as the oneon 2005 May 13, which results in a Dst index � � 50 nT is said to be geoeffective.
The shock at 1 AU is directly detected by spacecraft in the solar wind. A shocknear the Sun has to be inferred from remote observations such as at radio wave-lengths and from energetic particles. When the CME speed near the Sun exceedsthe coronal Alfven speed, it can drive a shock. The shock accelerates electrons andions (solar energetic particles or SEPs for short). The accelerated electrons produceradio emission by interacting with the ambient corona. Accelerated ions and elec-trons also propagate to the detectors in near-Earth space within tens of minutes.Shocks continue to accelerate SEPs as they propagate into the IP medium, so theyare continuously detected until the shock reaches the observing spacecraft, when asudden increase in SEP intensity is observed. The intensity increase is referred toas an energetic storm particle (ESP) event because a geomagnetic storm usually fol-lows due to the sheath and/or ICME behind the shock. In the 2005 May 13 event, ametric type II burst was observed at 16:38 UT, coincident with the large-scale EUVdisturbance. A more intense type II was observed by the Wind/WAVES experimentin the IP medium starting around 17:00 UT.
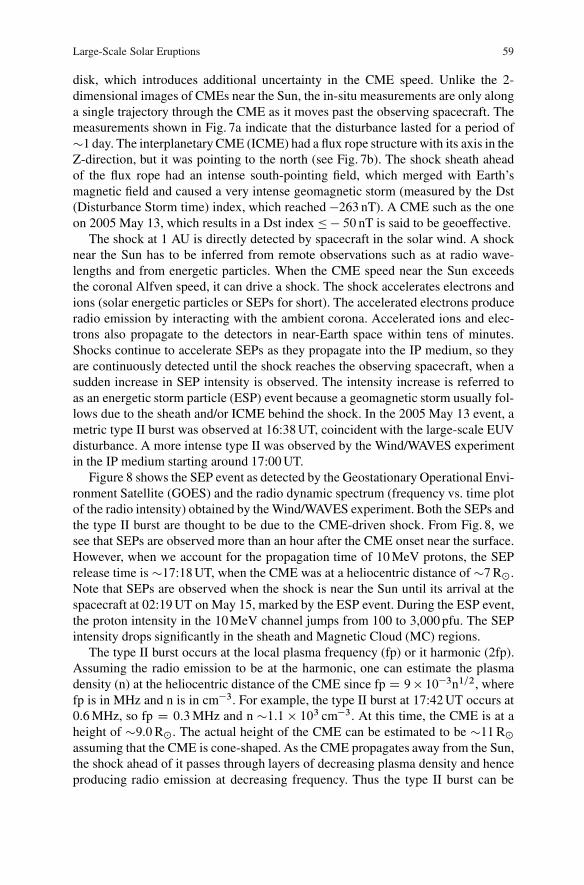
Figure 8 shows the SEP event as detected by the Geostationary Operational Envi-ronment Satellite (GOES) and the radio dynamic spectrum (frequency vs. time plotof the radio intensity) obtained by the Wind/WAVES experiment. Both the SEPs andthe type II burst are thought to be due to the CME-driven shock. From Fig. 8, wesee that SEPs are observed more than an hour after the CME onset near the surface.However, when we account for the propagation time of 10 MeV protons, the SEPrelease time is �17:18 UT, when the CME was at a heliocentric distance of �7 Rˇ.Note that SEPs are observed when the shock is near the Sun until its arrival at thespacecraft at 02:19 UT on May 15, marked by the ESP event. During the ESP event,the proton intensity in the 10 MeV channel jumps from 100 to 3,000 pfu. The SEPintensity drops significantly in the sheath and Magnetic Cloud (MC) regions.
The type II burst occurs at the local plasma frequency (fp) or it harmonic (2fp).Assuming the radio emission to be at the harmonic, one can estimate the plasmadensity (n) at the heliocentric distance of the CME since fp D 9 � 10�3n1=2, wherefp is in MHz and n is in cm�3. For example, the type II burst at 17:42 UT occurs at0.6 MHz, so fp D 0:3 MHz and n �1:1 � 103 cm�3. At this time, the CME is at aheight of �9:0 Rˇ. The actual height of the CME can be estimated to be �11 Rˇassuming that the CME is cone-shaped. As the CME propagates away from the Sun,the shock ahead of it passes through layers of decreasing plasma density and henceproducing radio emission at decreasing frequency. Thus the type II burst can be
60 N. Gopalswamy
Fig. 8 (left) Intensity plots of SEPs (protons) during the 2005 May 13 CME in three energy chan-nels >10 MeV (red), >50 MeV (blue), and >100 MeV (green) as detected by the GOES satellite.The SEP intensity is in particle flux units (pfu); 1 pfu D 1 proton .cm2 s sr/�1. The sharp spikein the SEP intensity (>10 MeV channel) is the ESP event. Approximate onset time of the CMEat the Sun (16:37 UT on May 13) and near Earth (MC arrival at 11 UT on May 15) are markedby the vertical black lines. (right) Dynamic spectrum obtained by the Radio and Plasma Wave(WAVES) experiment on board the Wind spacecraft. The type III burst is indicative of electronbeams from the eruption site. The type II burst is due to nonthermal electrons accelerated at theCME-driven shock. The type II radio emission occurs at �600 KHz when the CME was last seenin the coronagraph image at 17:42 UT (indicated by the vertical line)
used to track the CME-driven shock beyond the coronagraphic field of view. For the2005 May 13 CME, the type II radio emission was observed all the way to the Windspacecraft (where the local plasma frequency was �30 kHz).
The 2005 May 13 event discussed above is a well-observed CME with all theassociated phenomena such as a flare (H-alpha and soft X-ray), filament eruption,EUV wave, white-light CME, type II radio burst (metric and IP), SEP, ICME withshock, and geomagnetic storm. The white-light CME is also a halo CME in thatthe CME appears to surround the occulting disk in sky-plane projection (Howardet al. 1982). CMEs like this make significant impact on the heliosphere and henceare important in deciding space weather. Space weather refers to the conditions inthe space environment that is hazardous to space or ground based technological sys-tems or to human health or life. SEPs, geomagnetic storms, and ionospheric stormsare some of the space weather effects directly linked to CMEs.
3 CME Properties
CMEs have been studied extensively using data from several spaceborne corona-graphs since the early 1970s and the ground-based Mauna Loa K-coronameter (seeGopalswamy 2004; Kahler 2006 for recent reviews.) The statistical properties of
Large-Scale Solar Eruptions 61
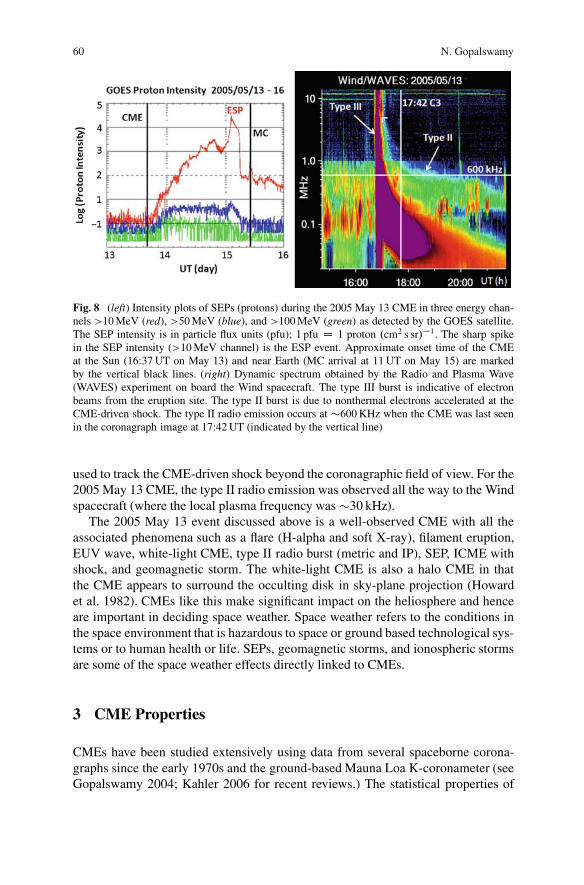
Fig. 9 Speed, width, mass and kinetic energy distributions of CMEs observed over most of solarcycle 23 (1996–2006)
CMEs based on SOHO observations can be summarized as follows: (1) the CMEspeed varies over two orders of magnitude from �20 to more than 3;000 km s�1,with an average value of 475 km s�1. (2) The CME angular width ranges from <5ıto 360ı (halo CMEs). The average width of CMEs with width <120ı is �44ı.Almost 90% of the CMEs have width <120ı, and only �3:5% have an appar-ent width of 360ı. About 11% of CMEs have width �120ı. The speed and widthdistributions of CMEs are shown in Fig. 9. (3) CMEs with above-average speedsdecelerate due to coronal drag, while the lower speed ones accelerate. CMEs withspeeds close to the average speed do not have observable acceleration. (4) CMEmass ranges from a few times 1012 g to more than 1016 g with an average valueof 3:4 � 1014 g (Gopalswamy 2004). The corresponding kinetic energies rangefrom �1027 erg to more than 1033 erg, with an average value of 2:9 � 1029 erg(see Fig. 9). (5) Within the field of view of the Large Angle and SpectrometricCoronagraph (LASCO), CMEs occur with an average rate of <0:5 per day (solarminimum) to >6 per day (solar maximum). High-latitude (>60ı) CMEs contributeto the CME rate significantly during solar maximum. (6) The average speed ofCMEs (averaged over Carrington Rotation periods) increases by a factor of 2 from�250 km s�1 during solar minimum to �550 km s�1 during solar maximum. (7)CMEs contain coronal material at a temperature of � a few MK in the outer struc-ture with cool prominence material (�8;000 K) in the core. (8) About a third of theICMEs observed at 1 AU have flux rope structure (magnetic clouds). Non-cloudICMEs generally originate at larger distances from the Sun center. (9) All CMEsare associated with flares, but there are many flares not associated with CMEs. (10)Type II radio bursts are signatures of electron acceleration by CME-driven shocks(Gopalswamy 2006). (11) Large SEP events are always associated with energeticCMEs.
4 CMEs and Flares
Mass motion in the form of H-alpha ejecta during flares has been identified as oneof the key aspects of flare – CME association because �90% of such flares areassociated with CMEs (see, e.g., Kahler 1992; Munro et al. 1979). On the other
62 N. Gopalswamy
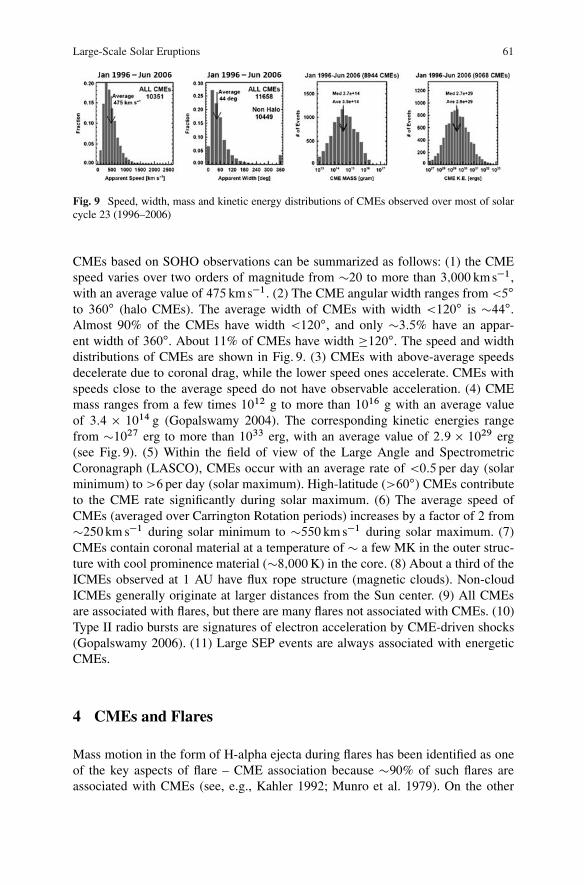
Fig. 10 Scatter plot between (left) peak soft X-ray flux and proxy kinetic energy and (right) CMEswidth and speed. The data are for limb eruptions central meridian distance ( � 60ı)
hand not all flares are associated with CMEs. In fact, even some X-class flares arenot associated with CMEs. Like CMEs, flares also occur from closed field regions,so, the released energy must go entirely into heating in flares without CMEs. Thereis some evidence that flares without CMEs are generally much hotter: the averagetemperature of flares without CMEs was found to be 18.4 MK compared to 11.7 MKfor flares with CMEs (Kay et al. 2003).
For flares with CMEs, there is a reasonable correlation between flare size in softX-rays and the CME kinetic energy (Hundhausen 1999; Moon et al. 2002). The cor-relation coefficient is only 0.53, suggesting that the partition between heating andmass motion may not be uniform in all eruptions. Figure 10a shows a similar plotbetween peak soft X-ray flux and the quantity 0:5 WV2, where W is the CME widthand V is the CME speed for a set of 342 CMEs associated with flare originatingclose to the limb. The limb events were chosen to avoid projection effects in the mea-sured speeds. We take 1=2WV2 to be the kinetic energy of CMEs because the CMEmass has been shown to be proportional to the CME angular width (Gopalswamyet al. 2005a). The correlation coefficient is also very similar to previous values.Figure 10b shows a reasonable correlation between CME width and speed. How-ever, all flares are not associated with CMEs. In flares without CMEs, all the releasedenergy must go into heating. On the other hand, in flares with CMEs, the free energyis partitioned between heating (soft X-ray flares) and mass motion (CMEs). A recentstudy of flares with and without CMEs involving parameters such as peak flux, flu-ence, and duration of soft X-ray flares found that they all followed a power law(Yashiro et al. 2006). However, the power law index for the CME-associated flareswas >2, while that for CMEless flares was <2. This suggests that in flares withoutCMEs, the free energy goes entirely into heating the corona (Hudson 1991).
Studies on temporal correspondence between CMEs and flares have concludedthat CME onset typically precedes the associated X-ray flare onset by several
Large-Scale Solar Eruptions 63
minutes. On the other hand, tiny flare-like brightenings and filament activation isknown before the lift off of a filament (Gopalswamy et al. 2006b). In the 2005May 13 example discussed above, the soft X-ray flare was reported to start at16:13 UT. H-alpha movie shows filament activation more than 10 min before. Thefilament activation may indicate some kind of instability in the system. On the otherhand the small-scale brightenings may push the system towards eruption. Thus, theflare-CME relationship is generally complex.
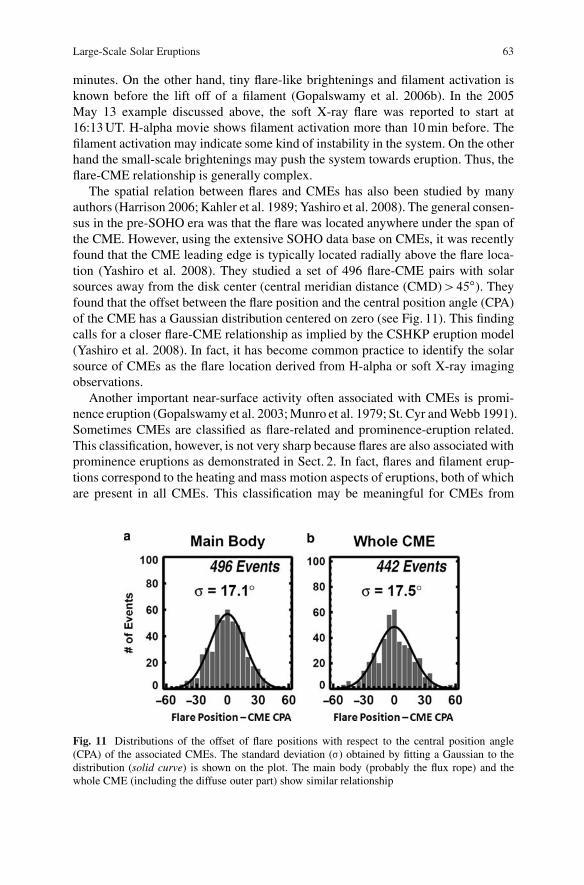
The spatial relation between flares and CMEs has also been studied by manyauthors (Harrison 2006; Kahler et al. 1989; Yashiro et al. 2008). The general consen-sus in the pre-SOHO era was that the flare was located anywhere under the span ofthe CME. However, using the extensive SOHO data base on CMEs, it was recentlyfound that the CME leading edge is typically located radially above the flare loca-tion (Yashiro et al. 2008). They studied a set of 496 flare-CME pairs with solarsources away from the disk center (central meridian distance (CMD) > 45ı). Theyfound that the offset between the flare position and the central position angle (CPA)of the CME has a Gaussian distribution centered on zero (see Fig. 11). This findingcalls for a closer flare-CME relationship as implied by the CSHKP eruption model(Yashiro et al. 2008). In fact, it has become common practice to identify the solarsource of CMEs as the flare location derived from H-alpha or soft X-ray imagingobservations.
Another important near-surface activity often associated with CMEs is promi-nence eruption (Gopalswamy et al. 2003; Munro et al. 1979; St. Cyr and Webb 1991).Sometimes CMEs are classified as flare-related and prominence-eruption related.This classification, however, is not very sharp because flares are also associated withprominence eruptions as demonstrated in Sect. 2. In fact, flares and filament erup-tions correspond to the heating and mass motion aspects of eruptions, both of whichare present in all CMEs. This classification may be meaningful for CMEs from
Fig. 11 Distributions of the offset of flare positions with respect to the central position angle(CPA) of the associated CMEs. The standard deviation (¢) obtained by fitting a Gaussian to thedistribution (solid curve) is shown on the plot. The main body (probably the flux rope) and thewhole CME (including the diffuse outer part) show similar relationship

64 N. Gopalswamy
Fig. 12 (left) The CME on 1997 October 6 in the LASCO/C2 field of view with the EUV dis-turbance pointed by arrow. (middle) GOES soft X-ray plot showing no significant enhancementabove the B-level background at the time of the CME marked by the vertical line. (right) YohkohSoft X-ray Telescope (SXT) image showing the post-eruption arcade (PEA) in the quiet Sun region
quiescent filament regions, but even there, one can see large-scale post-eruptionarcades in soft X-ray and EUV images, but they are not intense enough to be abovethe background in GOES soft X-ray plots. Figure 12 shows an example. The largeCME on 1997 October 6 originated from a quiescent filament region (the eruptioncan be seen as a EUV disturbance in the EIT image superposed on the LASCOimage). The GOES X-ray background was very low, but the eruption does not showup in GOES soft X-rays. However, a large-scale post-eruption arcade (PEA) can beseen in the soft X-ray image taken at 18:19 UT. The arcade lasted for several hours.
5 CMEs, Shocks, Type II Bursts, and SEPs
Shocks have been inferred from metric type II radio bursts, which have been studiedfor more than six decades (see Gopalswamy 2006 for a review). There was a lotof controversy regarding the origin of shock waves (Cliver et al. 1999) responsiblefor the metric type II bursts (flare blast waves or CME-driven shocks). The rootcause of the controversy was the observation that a third of metric type II bursts wasnot associated with CMEs. However, it was found that most of the solar eruptionsassociated with CMEless type II bursts originated close to the disk center. Coro-nagraphic observations favor CMEs originating from close to the limb. Only veryenergetic eruptions from close to the disk center will appear as halo or partial haloCMEs above the occulting disk (Cane et al. 2007). For example, when solar sourcesclose to the limb are considered, all the metric type II bursts are associated withCMEs (Gopalswamy et al. 2005a; Munro et al. 1979). Therefore, all the metric typeII bursts may be due to CME-driven shocks. Type II bursts at decameter-hectometric(DH) wavelengths originating from the near-Sun interplanetary medium (beyondabout 3 Rˇ/ are all associated with fast and wide CMEs even if the eruption occursnear the disk center. Some type II bursts occur at various bands from metric (nearSun) to kilometric (near Earth) wavelengths. CMEs associated with these mkm typeII bursts have the highest speed and width. There is a progressive increase in speedand fraction of halo CMEs as one goes from CMEs associated with metric, DH,
Large-Scale Solar Eruptions 65
and mkm type II bursts. The number of type II bursts also decreases in the sameorder suggesting that only the most energetic of CMEs can produce type II burststhroughout the inner heliosphere. Another interesting result is that the speed andfraction of halos of CMEs associated with large SEP events is nearly identical tothose of CMEs associated with mkm type II bursts. The reason is that the sameintense shock accelerates electrons (observed as type II bursts) and ions (observedas SEP events in the interplanetary medium) (Gopalswamy et al. 2008).
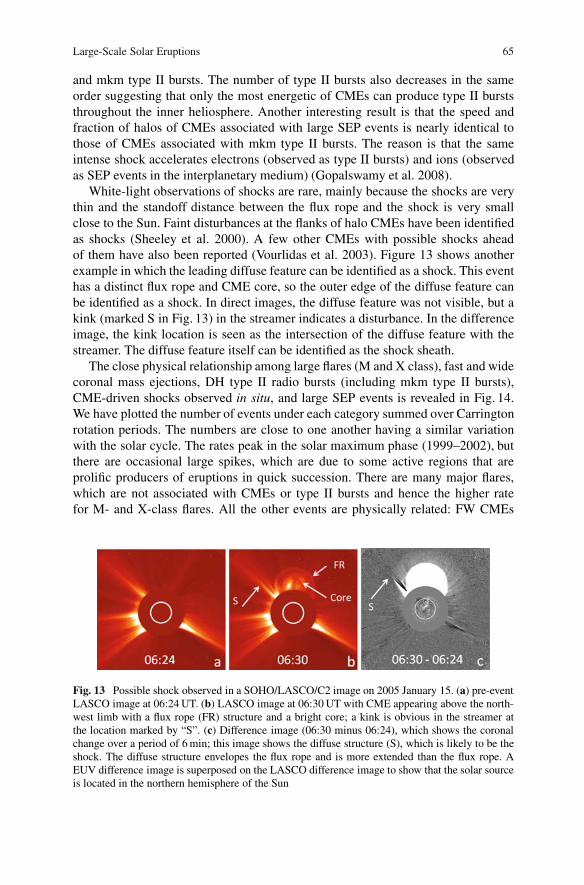
White-light observations of shocks are rare, mainly because the shocks are verythin and the standoff distance between the flux rope and the shock is very smallclose to the Sun. Faint disturbances at the flanks of halo CMEs have been identifiedas shocks (Sheeley et al. 2000). A few other CMEs with possible shocks aheadof them have also been reported (Vourlidas et al. 2003). Figure 13 shows anotherexample in which the leading diffuse feature can be identified as a shock. This eventhas a distinct flux rope and CME core, so the outer edge of the diffuse feature canbe identified as a shock. In direct images, the diffuse feature was not visible, but akink (marked S in Fig. 13) in the streamer indicates a disturbance. In the differenceimage, the kink location is seen as the intersection of the diffuse feature with thestreamer. The diffuse feature itself can be identified as the shock sheath.
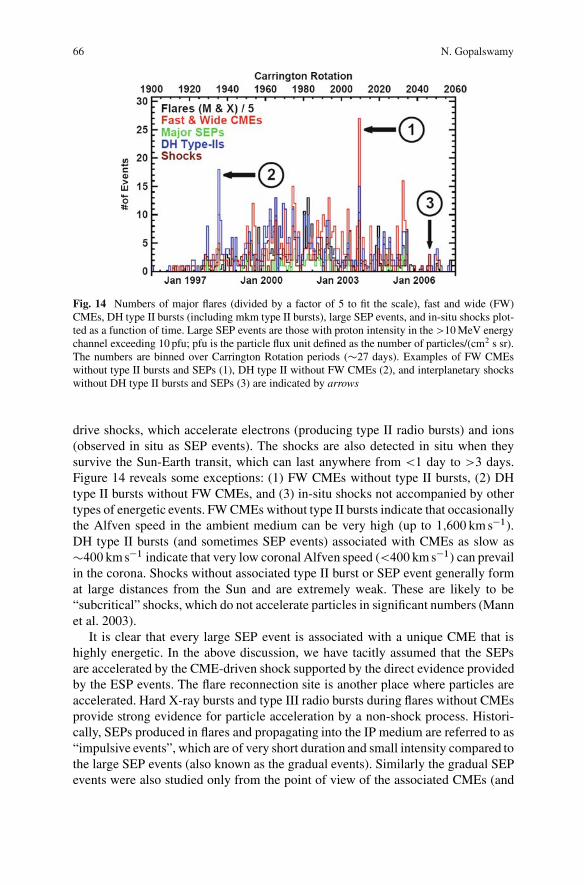
The close physical relationship among large flares (M and X class), fast and widecoronal mass ejections, DH type II radio bursts (including mkm type II bursts),CME-driven shocks observed in situ, and large SEP events is revealed in Fig. 14.We have plotted the number of events under each category summed over Carringtonrotation periods. The numbers are close to one another having a similar variationwith the solar cycle. The rates peak in the solar maximum phase (1999–2002), butthere are occasional large spikes, which are due to some active regions that areprolific producers of eruptions in quick succession. There are many major flares,which are not associated with CMEs or type II bursts and hence the higher ratefor M- and X-class flares. All the other events are physically related: FW CMEs
Fig. 13 Possible shock observed in a SOHO/LASCO/C2 image on 2005 January 15. (a) pre-eventLASCO image at 06:24 UT. (b) LASCO image at 06:30 UT with CME appearing above the north-west limb with a flux rope (FR) structure and a bright core; a kink is obvious in the streamer atthe location marked by “S”. (c) Difference image (06:30 minus 06:24), which shows the coronalchange over a period of 6 min; this image shows the diffuse structure (S), which is likely to be theshock. The diffuse structure envelopes the flux rope and is more extended than the flux rope. AEUV difference image is superposed on the LASCO difference image to show that the solar sourceis located in the northern hemisphere of the Sun
66 N. Gopalswamy
Fig. 14 Numbers of major flares (divided by a factor of 5 to fit the scale), fast and wide (FW)CMEs, DH type II bursts (including mkm type II bursts), large SEP events, and in-situ shocks plot-ted as a function of time. Large SEP events are those with proton intensity in the >10 MeV energychannel exceeding 10 pfu; pfu is the particle flux unit defined as the number of particles/(cm2 s sr).The numbers are binned over Carrington Rotation periods (�27 days). Examples of FW CMEswithout type II bursts and SEPs (1), DH type II without FW CMEs (2), and interplanetary shockswithout DH type II bursts and SEPs (3) are indicated by arrows
drive shocks, which accelerate electrons (producing type II radio bursts) and ions(observed in situ as SEP events). The shocks are also detected in situ when theysurvive the Sun-Earth transit, which can last anywhere from <1 day to >3 days.Figure 14 reveals some exceptions: (1) FW CMEs without type II bursts, (2) DHtype II bursts without FW CMEs, and (3) in-situ shocks not accompanied by othertypes of energetic events. FW CMEs without type II bursts indicate that occasionallythe Alfven speed in the ambient medium can be very high (up to 1;600 km s�1).DH type II bursts (and sometimes SEP events) associated with CMEs as slow as�400 km s�1 indicate that very low coronal Alfven speed (<400 km s�1) can prevailin the corona. Shocks without associated type II burst or SEP event generally format large distances from the Sun and are extremely weak. These are likely to be“subcritical” shocks, which do not accelerate particles in significant numbers (Mannet al. 2003).
It is clear that every large SEP event is associated with a unique CME that ishighly energetic. In the above discussion, we have tacitly assumed that the SEPsare accelerated by the CME-driven shock supported by the direct evidence providedby the ESP events. The flare reconnection site is another place where particles areaccelerated. Hard X-ray bursts and type III radio bursts during flares without CMEsprovide strong evidence for particle acceleration by a non-shock process. Histori-cally, SEPs produced in flares and propagating into the IP medium are referred to as“impulsive events”, which are of very short duration and small intensity compared tothe large SEP events (also known as the gradual events). Similarly the gradual SEPevents were also studied only from the point of view of the associated CMEs (and
Large-Scale Solar Eruptions 67
shocks). Since each of the CMEs associated large SEP events are also associatedwith a major flare, one naturally expects contributions from the flares. Flare parti-cles in CME events are also expected to be of higher intensity because of the largerflare size compared to those associated with impulsive events. While there is noquestion that the two mechanisms operate in nature, but what was missed is the factthat they operate simultaneously in every CME event. There may even be interactionbetween the two sources in that the flare particles may pass through the shock regionand get further accelerated. There is an ongoing debate on the relative contributionfrom the flare and shock sources (Cane et al. 2007; Tylka and Lee 2006).
6 CMEs and Geomagnetic Storms
Geomagnetic storms occur when an interplanetary structure such as an ICME con-taining southward magnetic field arrive at Earth’s magnetosphere and reconnectswith the geomagnetic field. The storm strength is measured by one of the indicessuch as the Dst index. A white-light CME observed near the Sun may result in ashock, sheath, and the driving ICME at 1 AU. The shock and the ICME front bound-ary delineate the sheath region. A CME can be geoeffective due to a south-pointingmagnetic field component in the sheath region or in the ICME (ejecta) region. Whenthe ICME is an MC, then one can infer which section of the MC is geoeffectivebased on the magnetic structure of the MC (flux rope orientation with respect to theecliptic plane and its sense of rotation). Although most of the large geomagneticstorms are caused by magnetic clouds, non-cloud ejecta can also be geoeffective.Depending on the magnetic structure in the sheath and cloud portions, the followingsituations are encountered: (1) sheath and MC are geoeffective, (2) sheath alone isgeoeffective, (3) MCs alone are geoeffective, and (4) none are geoeffective. The lastsituation arises when neither the sheath nor the MC contains south-pointing mag-netic field component. When both sheath and MC are geoeffective, the Dst profilecan be complex depending on the location of the south-pointing field in the sheathand cloud portions.
6.1 Halo CMEs
Halo CMEs constitute a special population selected by the nature of coronagraphicobservations: slow and narrow CMEs originating from close to the Sun center arenot usually seen in coronagraph images. Typically, fast (CME speed �900 km s�1)and wide CMEs (width �60ı) appear as halos. Occasionally some halos are slow.Figure 15 shows that the average speed of disk halos (with the central merid-ian distance (CMD) of the solar source �45ı) is �933 km s�1, which is close tothat of the backside halos (977 km s�1). However, the average speed of limb halos(45ı<CMD�90ı) is �1;548 km s�1. There are two reasons for the higher speed

68 N. Gopalswamy
Fig. 15 Speed distributions for (left) disk halos (CMD � 45ı), (middle) limb halos(45ı < CMD � 90ı), and (right) backside halos (CMD > 90ı)
of limb halos: (1) the disk halos originate close to the disk center, so their speedsare severely affected by projection effects in contrast to the limb halos, which arenot significantly affected by projection effects; (2) halo CMEs by definition have tosurround the occulting disk, so a CME originating close to the limb should travelvery fast to be observed above the opposite limb. Thus only the fastest limb CMEscan become halos. The backside halos are far behind the limb and hence are sub-ject to projection effects similar to the disk halos. The average speed of all halos is�1;000 km s�1, which is more than two times the average speed of all CMEs. Forsuch speeds, the average width of the CMEs can be inferred as �180ı from Fig. 10b.Thus the halo CMEs are generally more energetic. This is further confirmed bythe fact that the average size of soft X-ray flares associated with halo CMEs is anorder of magnitude larger than the average size of all the flares observed in solarcycle 23 (Gopalswamy et al. 2007). As Fig. 10 shows, higher flare intensity implieshigher kinetic energy for the associated CMEs. Higher kinetic energy enables theCMEs to propagate far into the interplanetary medium. From coronagraphic obser-vations alone, it is difficult to say whether a halo CME is frontsided or not. In Fig. 5the halo CME is front sided (i.e., Earth-directed) as can be seen in the superposedEUV images. We need to combine coronagraphic observations with coronal imagesobtained in EUV, soft X-ray, microwave, or H-alpha wavelengths to identify diskactivity.
6.2 Geoeffective CMEs
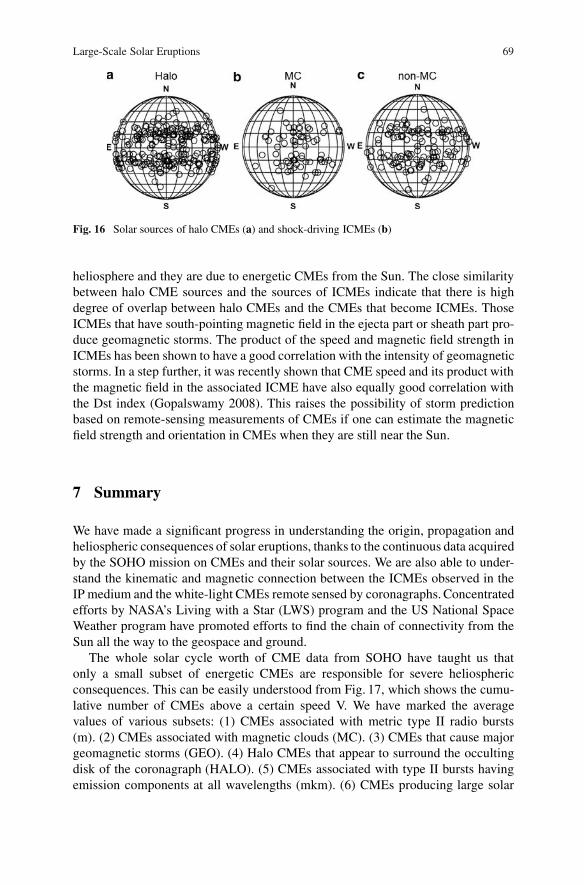
The source locations of halo CMEs are compared with those of ICMEs in Fig. 16.We have plotted the solar sources MCs and non-cloud ICMEs separately. MCs havehigher magnetic field, smooth rotation, and low proton temperature (indicating fluxrope structure Burlaga et al. 1982). Non-cloud ICMEs do not appear as flux ropesin in-situ observations. The events in Fig. 16 are the most energetic events in the
Large-Scale Solar Eruptions 69
Fig. 16 Solar sources of halo CMEs (a) and shock-driving ICMEs (b)
heliosphere and they are due to energetic CMEs from the Sun. The close similaritybetween halo CME sources and the sources of ICMEs indicate that there is highdegree of overlap between halo CMEs and the CMEs that become ICMEs. ThoseICMEs that have south-pointing magnetic field in the ejecta part or sheath part pro-duce geomagnetic storms. The product of the speed and magnetic field strength inICMEs has been shown to have a good correlation with the intensity of geomagneticstorms. In a step further, it was recently shown that CME speed and its product withthe magnetic field in the associated ICME have also equally good correlation withthe Dst index (Gopalswamy 2008). This raises the possibility of storm predictionbased on remote-sensing measurements of CMEs if one can estimate the magneticfield strength and orientation in CMEs when they are still near the Sun.
7 Summary
We have made a significant progress in understanding the origin, propagation andheliospheric consequences of solar eruptions, thanks to the continuous data acquiredby the SOHO mission on CMEs and their solar sources. We are also able to under-stand the kinematic and magnetic connection between the ICMEs observed in theIP medium and the white-light CMEs remote sensed by coronagraphs. Concentratedefforts by NASA’s Living with a Star (LWS) program and the US National SpaceWeather program have promoted efforts to find the chain of connectivity from theSun all the way to the geospace and ground.
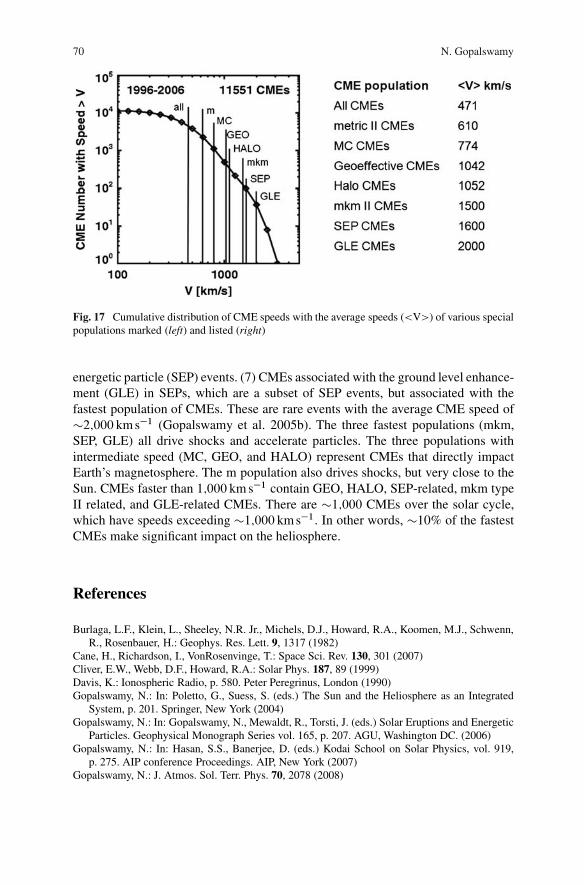
The whole solar cycle worth of CME data from SOHO have taught us thatonly a small subset of energetic CMEs are responsible for severe heliosphericconsequences. This can be easily understood from Fig. 17, which shows the cumu-lative number of CMEs above a certain speed V. We have marked the averagevalues of various subsets: (1) CMEs associated with metric type II radio bursts(m). (2) CMEs associated with magnetic clouds (MC). (3) CMEs that cause majorgeomagnetic storms (GEO). (4) Halo CMEs that appear to surround the occultingdisk of the coronagraph (HALO). (5) CMEs associated with type II bursts havingemission components at all wavelengths (mkm). (6) CMEs producing large solar
70 N. Gopalswamy
Fig. 17 Cumulative distribution of CME speeds with the average speeds (<V>) of various specialpopulations marked (left) and listed (right)
energetic particle (SEP) events. (7) CMEs associated with the ground level enhance-ment (GLE) in SEPs, which are a subset of SEP events, but associated with thefastest population of CMEs. These are rare events with the average CME speed of�2;000 km s�1 (Gopalswamy et al. 2005b). The three fastest populations (mkm,SEP, GLE) all drive shocks and accelerate particles. The three populations withintermediate speed (MC, GEO, and HALO) represent CMEs that directly impactEarth’s magnetosphere. The m population also drives shocks, but very close to theSun. CMEs faster than 1;000 km s�1 contain GEO, HALO, SEP-related, mkm typeII related, and GLE-related CMEs. There are �1;000 CMEs over the solar cycle,which have speeds exceeding �1;000 km s�1. In other words, �10% of the fastestCMEs make significant impact on the heliosphere.
References
Burlaga, L.F., Klein, L., Sheeley, N.R. Jr., Michels, D.J., Howard, R.A., Koomen, M.J., Schwenn,R., Rosenbauer, H.: Geophys. Res. Lett. 9, 1317 (1982)
Cane, H., Richardson, I., VonRosenvinge, T.: Space Sci. Rev. 130, 301 (2007)Cliver, E.W., Webb, D.F., Howard, R.A.: Solar Phys. 187, 89 (1999)Davis, K.: Ionospheric Radio, p. 580. Peter Peregrinus, London (1990)Gopalswamy, N.: In: Poletto, G., Suess, S. (eds.) The Sun and the Heliosphere as an Integrated
System, p. 201. Springer, New York (2004)Gopalswamy, N.: In: Gopalswamy, N., Mewaldt, R., Torsti, J. (eds.) Solar Eruptions and Energetic
Particles. Geophysical Monograph Series vol. 165, p. 207. AGU, Washington DC. (2006)Gopalswamy, N.: In: Hasan, S.S., Banerjee, D. (eds.) Kodai School on Solar Physics, vol. 919,
p. 275. AIP conference Proceedings. AIP, New York (2007)Gopalswamy, N.: J. Atmos. Sol. Terr. Phys. 70, 2078 (2008)
Large-Scale Solar Eruptions 71
Gopalswamy, N., Shimojo, M., Lu, W., Yashiro, S., Shibasaki, K., Howard, R.A.: Astrophys. J. 586,562 (2003)
Gopalswamy, N., Aguilar-Rodriguez, E., Yashiro, S., Nunes, S., Kaiser, M.L., Howard, R.A.: J.Geophys. Res. 110, 12S07 (2005a)
Gopalswamy, N., Xie, H., Usoskin, I.: In: Acharya B.S., Gupta S., Jagadeesan P., Jain A.,Karthikeyan S., Morris S., Tonwar S. (eds.) Proceedings of the 29th International Cosmic RayConference. vol. 1, p.169. Tata Institute of Fundamental Research, Mumbai (2005b)
Gopalswamy, N., Mewaldt R., Torsti J. (eds.): Geophysical Monograph Series, vol. 165, p. 385.AGU, Washington DC (2006a)
Gopalswamy, N., Mikic, Z., Maia, D., Alexander, D., Cremades, H., Kaufmann, P., Tripathi, D.,Wang, Y.-M.: Space Sci. Rev. 123, 303 (2006b)
Gopalswamy, N., Yashiro, S., Akiyama, S.: J. Geophys. Res. 112, A06112 (2007)Gopalswamy, N., Yashiro, S., Xie, H., Akiyama, S., Aguilar-Rodriguez, E., Kaiser, M.L., Howard,
R.A., Bougeret, J.-L.: Astrophys. J. 674, 560 (2008)Harrison, R.A.: In: Gopalswamy, N., Mewaldt, R., Torsti, J. (eds.) Solar Eruptions and Ener-
getic Particles. Geophysical Monograph Series, vol. 165, p. 73. American Geophysical Union,Washington DC (2006)
Howard, R.A., Michels, D.J., Sheeley, N.R. Jr., Koomen, M.J.: Astrophys. J. 263, L101 (1982)Hudson, H.S.: Solar Phys. 133, 357 (1991)Hundhausen, A.: In: Strong K.T., Saba J.L.R., Haisch B.M., Schmelz J.T. (eds.) The Many Faces
of the Sun: A Summary of the Results from NASA’s Solar Maximum Mission, p. 143. Springer,New York. (1999)
Kahler, S.W., Sheeley, N.R. Jr., Ligget, M.: Astrophys. J. 344, 1026 (1989)Kahler, S.W.: Ann. Rev. Astron. Astrophys. 30, 113 (1992)Kahler, S. W.: In: Gopalswamy, N., Mewaldt R., Torsti J.: (eds.) Solar Eruptions and Ener-
getic Particles. Geophysical Monograph Series, vol. 165, p. 21. American Geophysical Union,Washington DC (2006)
Kay, H.R.M., Harra, L.K., Matthews, S.A., Culhane, J.L., Green, L.M.: Astron. Astrophys. 400,779 (2003)
Mann, G., Klassen, A., Aurass, H., Classen, H.-T.: Astron. Astrophys. 400, 329 (2003)Moon, Y.-J., Choe, G.S., Wang, H., Park, Y.D., Gopalswamy, N., Yang, G., Yashiro, S.: Astrophys.
J. 581, 694 (2002)Munro, R.H., Gosling, J.T., Hildner, E., MacQueen, R.M., Poland, A.I., Ross, C.L., Solar Phys.
61, 201 (1979)Sheeley, N.R. Jr., Hakala, W.N, Wang, Y.-M.: J. Geophys. Res. 105, 5081 (2000)Song, P., Singer, H.J., Siscoe, G.L.: (eds.) Space Weather. Geophysical Monograph Series, vol.
125, p. 440. American Geophysical Union, Washington DC (2001)St. Cyr, O.C., Webb, D.F., Solar Phys. 136, 379 (1991).Tylka, A., Lee, M.A.: Astrophys. J. 646, 1319 (2006)Vourlidas, A., Wu, S.T., Wang, A.H., Subramanian, P., Howard, R.A.: Astrophys. J. 598, 1392
(2003)Yashiro, S., Akiyama, S., Gopalswamy, N., Howard, R.A.: Astrophys. J. 650, L143 (2006)Yashiro, S., Michalek, G., Akiyama, S., Gopalswamy, N., Howard, R. A.: Astrophys. J. 673, 1174
(2008)