Embed Size (px)
Citation preview
12th International LS-DYNA® Users Conference Simulation(2)
1
Large Scale Normal Modes and PSD Analysis with Nastran and LS-DYNA
George Laird Predictive Engineering
Abstract From its conception in 1976, LS-DYNA
has become a world-renowned analysis code used for the simulation of
complex, real-world problems. Its power stems from the simple fact that it was written early on with an eye toward
harnessing the resources of a variety of computational platforms. This strategy has allowed LS-DYNA to solve large
scale, multi-physics problems that were impossible just a few years ago. LS-DYNA developers have also been extending
its classically nonlinear, scalable solution sequences to that of large scale, linear dynamics problems using an MMP
(Massive Parallel Processing) approach. Benchmark solutions are provided showing how LS-DYNA handles the basic
linear normal modes analyses using standard finite elements (beams, plates, solids and rigid links) with a comparison to
an industry standard Nastran solver. Results are then presented showing how LS-DYNA multi-CPU scaling decreases
solution times for the power spectral density (PSD) analysis of large scale FEA models having millions of DOFs.
Introduction Finite element (FE) codes can generally be placed into two camps: implicit or explicit. Implicit codes are focused on linear static analyses with extensions toward linear dynamics and mild nonlinearities. One of the more common implicit solution techniques is that used for linear dynamics or normal modes analyses. This type of analysis is universal in the automotive, aviation, chemical and naval industries where models having millions of nodes are analyzed with the end goal of extracting hundreds of normal modes frequencies and shapes. Due to the numerical foundation of standard implicit codes, their solutions are restricted by algorithmic issues to limited speed-ups using multiple CPUs. As engineering problems have become larger and more complex, these restrictions have become a major stumbling block to achieving accurate solutions in a reasonable amount of time. In contrast, carefully coded, explicit codes are scalable and offer impressive solution performance using multi-CPUs and/or distributed computer networks. The developers of LS-DYNA have always recognized the importance of true scalability throughout every aspect of the software. This attention to detail has made LS-DYNA a highly efficient explicit code for the solution of large complex problems since all aspects of the solution sequence scale in equal parts. To bring this computational performance to bear on problems traditionally solved with implicit methods, LSTC spent more than ten years implementing implicit parallel coding on a par with its explicit solutions. This task required the development of completely new solver for matrix decomposition techniques that facilitate the scalable solution of large implicit matrices. With this core work completed, LSTC produced a very modern and fast solution technique for both the extraction of normal modes and the solution of frequency-domain type problems (e.g., power spectral density (PSD) analysis). To document these new capabilities within LS-DYNA, a series of very simple normal-modes type problems are presented using beam, shell, solid and rigid-link element formulations. A brief
Simulation(2) 12th International LS-DYNA® Users Conference
2
discussion is then given on how LS-DYNA can also perform forced response and classical PSD type analyses. Lastly, several scalability problems are presented showing how LS-DYNA scales the complete linear dynamics solution.
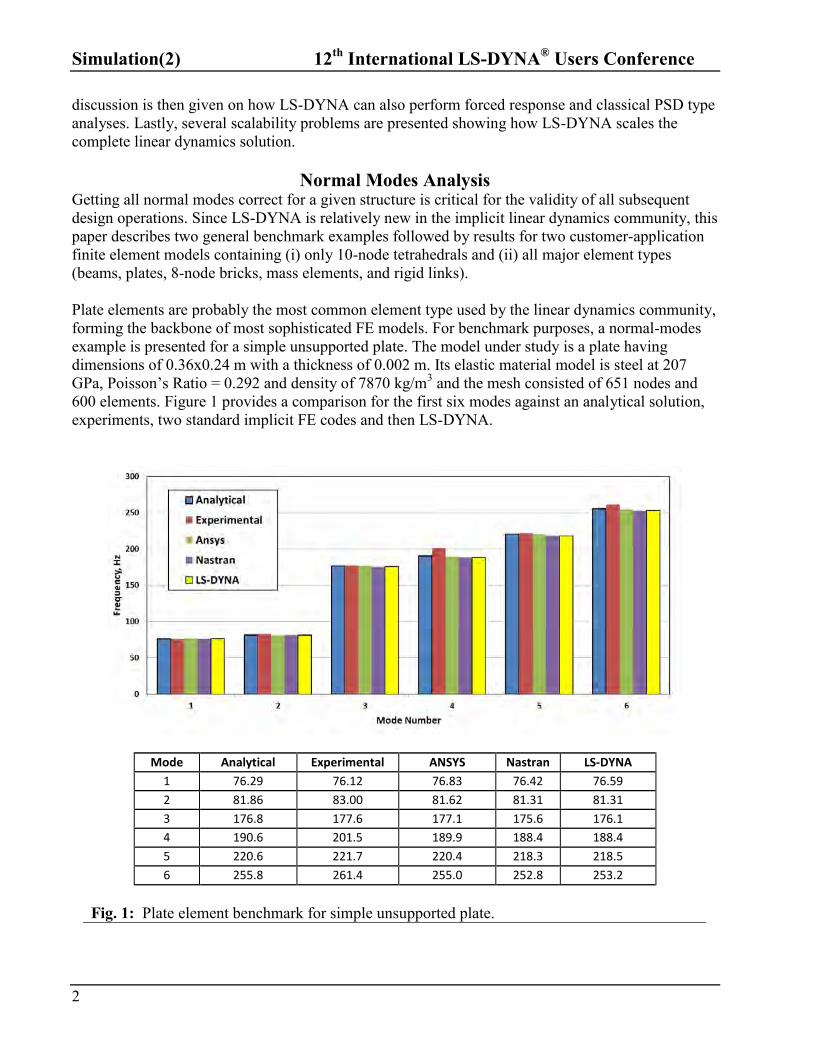
Normal Modes Analysis Getting all normal modes correct for a given structure is critical for the validity of all subsequent design operations. Since LS-DYNA is relatively new in the implicit linear dynamics community, this paper describes two general benchmark examples followed by results for two customer-application finite element models containing (i) only 10-node tetrahedrals and (ii) all major element types (beams, plates, 8-node bricks, mass elements, and rigid links). Plate elements are probably the most common element type used by the linear dynamics community, forming the backbone of most sophisticated FE models. For benchmark purposes, a normal-modes example is presented for a simple unsupported plate. The model under study is a plate having dimensions of 0.36x0.24 m with a thickness of 0.002 m. Its elastic material model is steel at 207 GPa, Poisson’s Ratio = 0.292 and density of 7870 kg/m3 and the mesh consisted of 651 nodes and 600 elements. Figure 1 provides a comparison for the first six modes against an analytical solution, experiments, two standard implicit FE codes and then LS-DYNA.
Mode Analytical Experimental ANSYS Nastran LS-DYNA
1 76.29 76.12 76.83 76.42 76.59
2 81.86 83.00 81.62 81.31 81.31
3 176.8 177.6 177.1 175.6 176.1
4 190.6 201.5 189.9 188.4 188.4
5 220.6 221.7 220.4 218.3 218.5
6 255.8 261.4 255.0 252.8 253.2
Fig. 1: Plate element benchmark for simple unsupported plate.
12th International LS-DYNA® Users Conference Simulation(2)
3
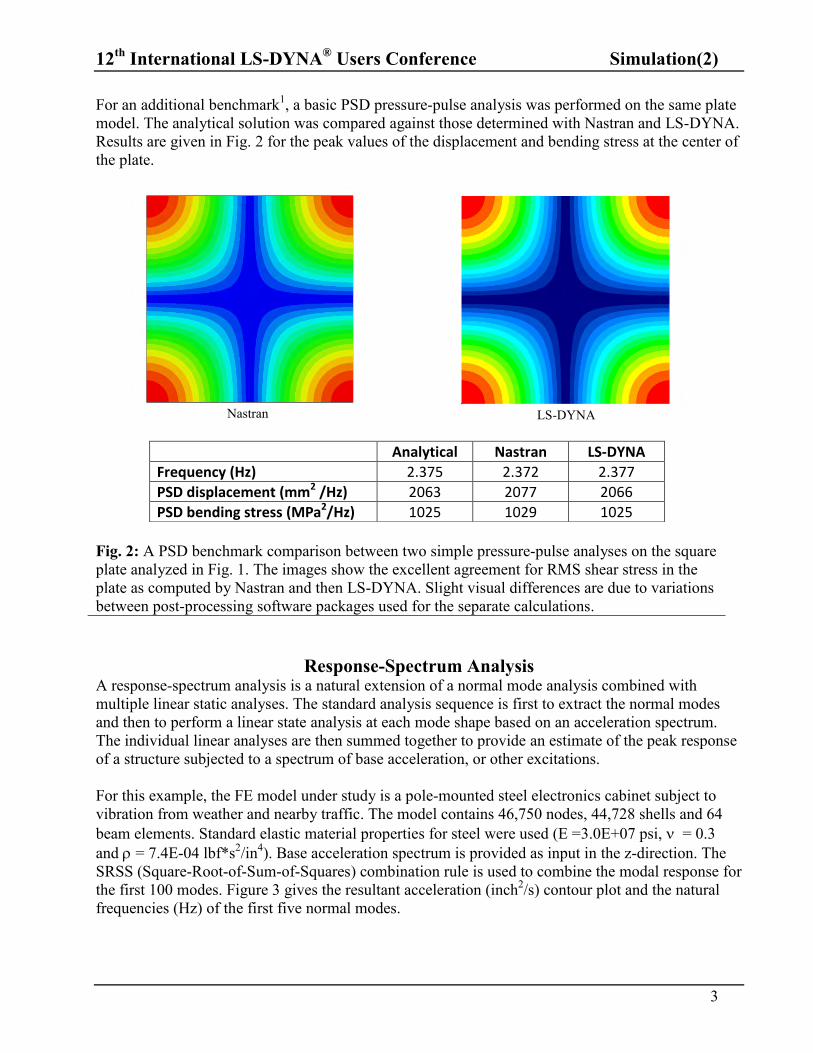
For an additional benchmark1, a basic PSD pressure-pulse analysis was performed on the same plate model. The analytical solution was compared against those determined with Nastran and LS-DYNA. Results are given in Fig. 2 for the peak values of the displacement and bending stress at the center of the plate.
Nastran
LS-DYNA
Analytical Nastran LS-DYNA
Frequency (Hz) 2.375 2.372 2.377
PSD displacement (mm2 /Hz) 2063 2077 2066
PSD bending stress (MPa2/Hz) 1025 1029 1025
Fig. 2: A PSD benchmark comparison between two simple pressure-pulse analyses on the square plate analyzed in Fig. 1. The images show the excellent agreement for RMS shear stress in the plate as computed by Nastran and then LS-DYNA. Slight visual differences are due to variations between post-processing software packages used for the separate calculations.
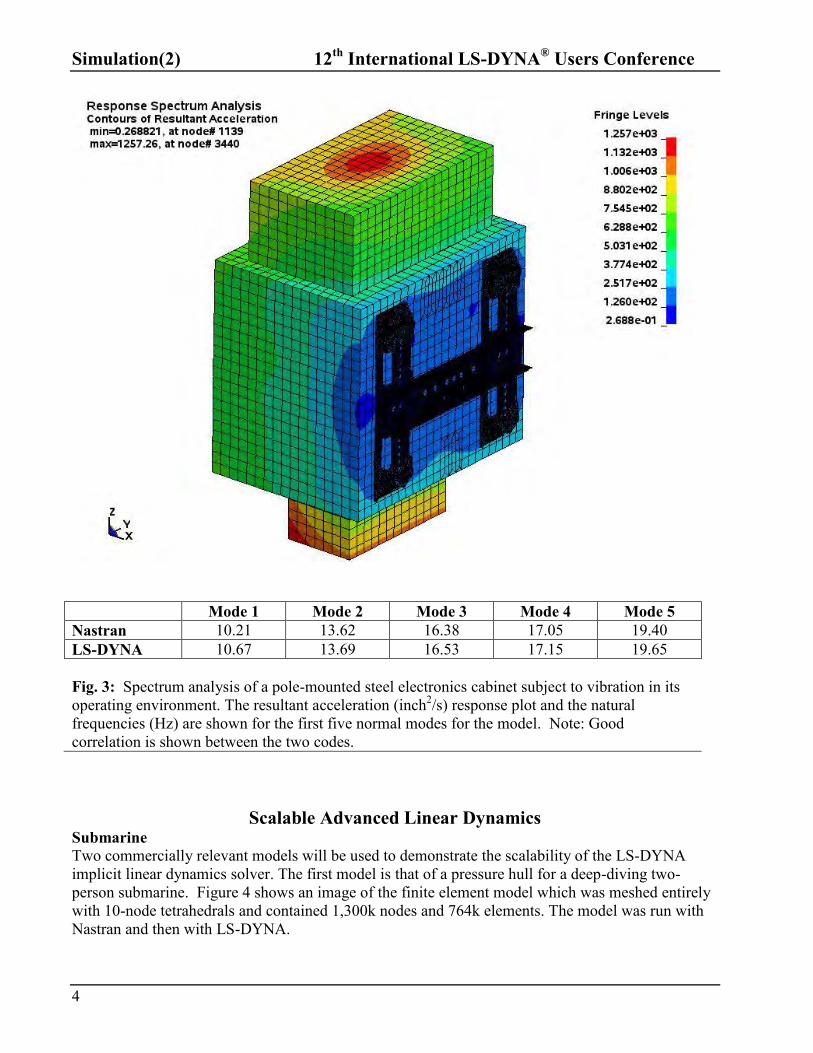
Response-Spectrum Analysis A response-spectrum analysis is a natural extension of a normal mode analysis combined with multiple linear static analyses. The standard analysis sequence is first to extract the normal modes and then to perform a linear state analysis at each mode shape based on an acceleration spectrum. The individual linear analyses are then summed together to provide an estimate of the peak response of a structure subjected to a spectrum of base acceleration, or other excitations. For this example, the FE model under study is a pole-mounted steel electronics cabinet subject to vibration from weather and nearby traffic. The model contains 46,750 nodes, 44,728 shells and 64 beam elements. Standard elastic material properties for steel were used (E =3.0E+07 psi, = 0.3 and = 7.4E-04 lbf*s2/in4). Base acceleration spectrum is provided as input in the z-direction. The SRSS (Square-Root-of-Sum-of-Squares) combination rule is used to combine the modal response for the first 100 modes. Figure 3 gives the resultant acceleration (inch2/s) contour plot and the natural frequencies (Hz) of the first five normal modes.
Simulation(2) 12th International LS-DYNA® Users Conference
4
Mode 1 Mode 2 Mode 3 Mode 4 Mode 5 Nastran 10.21 13.62 16.38 17.05 19.40 LS-DYNA 10.67 13.69 16.53 17.15 19.65 Fig. 3: Spectrum analysis of a pole-mounted steel electronics cabinet subject to vibration in its operating environment. The resultant acceleration (inch2/s) response plot and the natural frequencies (Hz) are shown for the first five normal modes for the model. Note: Good correlation is shown between the two codes.
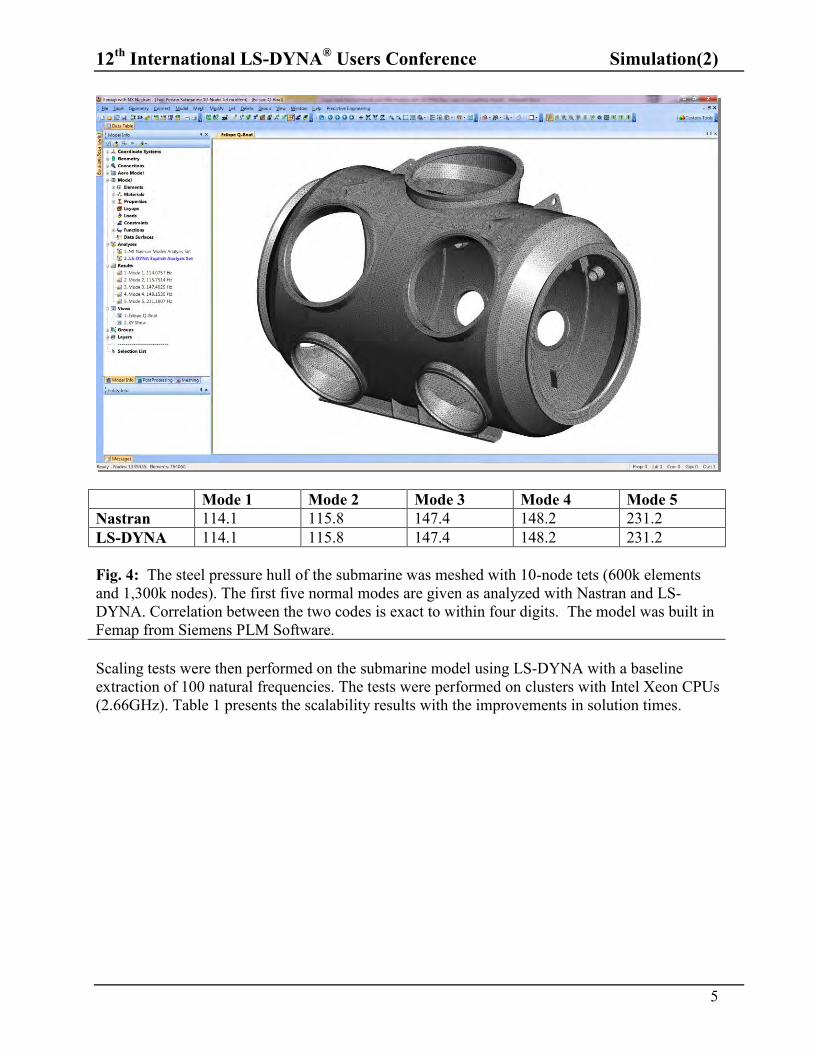
Scalable Advanced Linear Dynamics Submarine Two commercially relevant models will be used to demonstrate the scalability of the LS-DYNA implicit linear dynamics solver. The first model is that of a pressure hull for a deep-diving two- person submarine. Figure 4 shows an image of the finite element model which was meshed entirely with 10-node tetrahedrals and contained 1,300k nodes and 764k elements. The model was run with Nastran and then with LS-DYNA.
12th International LS-DYNA® Users Conference Simulation(2)
5
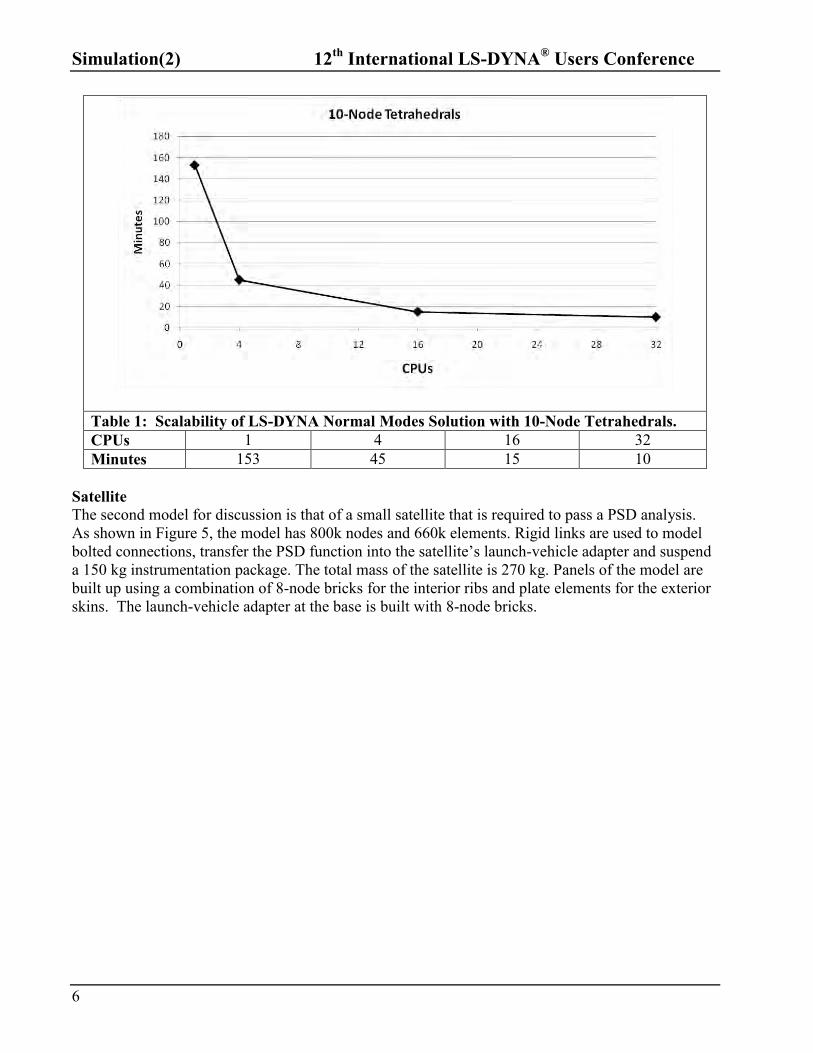
Mode 1 Mode 2 Mode 3 Mode 4 Mode 5 Nastran 114.1 115.8 147.4 148.2 231.2 LS-DYNA 114.1 115.8 147.4 148.2 231.2 Fig. 4: The steel pressure hull of the submarine was meshed with 10-node tets (600k elements and 1,300k nodes). The first five normal modes are given as analyzed with Nastran and LS-DYNA. Correlation between the two codes is exact to within four digits. The model was built in Femap from Siemens PLM Software. Scaling tests were then performed on the submarine model using LS-DYNA with a baseline extraction of 100 natural frequencies. The tests were performed on clusters with Intel Xeon CPUs (2.66GHz). Table 1 presents the scalability results with the improvements in solution times.
Simulation(2) 12th International LS-DYNA® Users Conference
6
Table 1: Scalability of LS-DYNA Normal Modes Solution with 10-Node Tetrahedrals. CPUs 1 4 16 32 Minutes 153 45 15 10
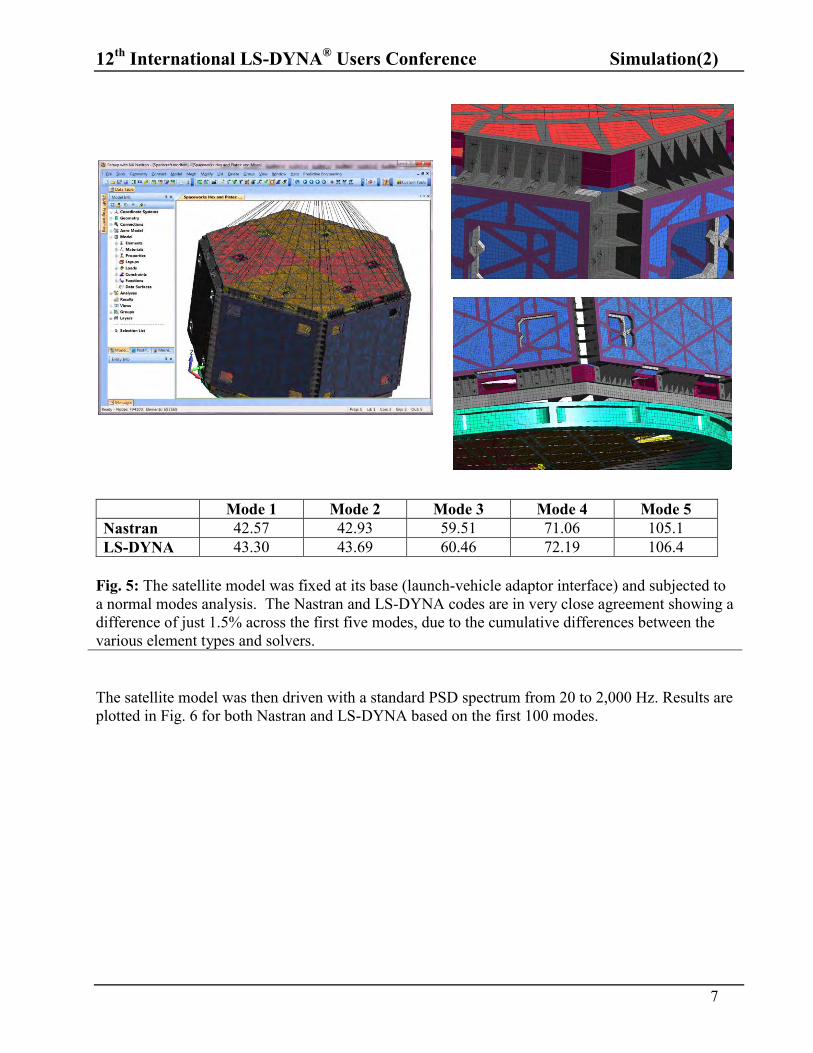
Satellite The second model for discussion is that of a small satellite that is required to pass a PSD analysis. As shown in Figure 5, the model has 800k nodes and 660k elements. Rigid links are used to model bolted connections, transfer the PSD function into the satellite’s launch-vehicle adapter and suspend a 150 kg instrumentation package. The total mass of the satellite is 270 kg. Panels of the model are built up using a combination of 8-node bricks for the interior ribs and plate elements for the exterior skins. The launch-vehicle adapter at the base is built with 8-node bricks.
12th International LS-DYNA® Users Conference Simulation(2)
7
Mode 1 Mode 2 Mode 3 Mode 4 Mode 5 Nastran 42.57 42.93 59.51 71.06 105.1 LS-DYNA 43.30 43.69 60.46 72.19 106.4
Fig. 5: The satellite model was fixed at its base (launch-vehicle adaptor interface) and subjected to a normal modes analysis. The Nastran and LS-DYNA codes are in very close agreement showing a difference of just 1.5% across the first five modes, due to the cumulative differences between the various element types and solvers. The satellite model was then driven with a standard PSD spectrum from 20 to 2,000 Hz. Results are plotted in Fig. 6 for both Nastran and LS-DYNA based on the first 100 modes.
Simulation(2) 12th International LS-DYNA® Users Conference
8
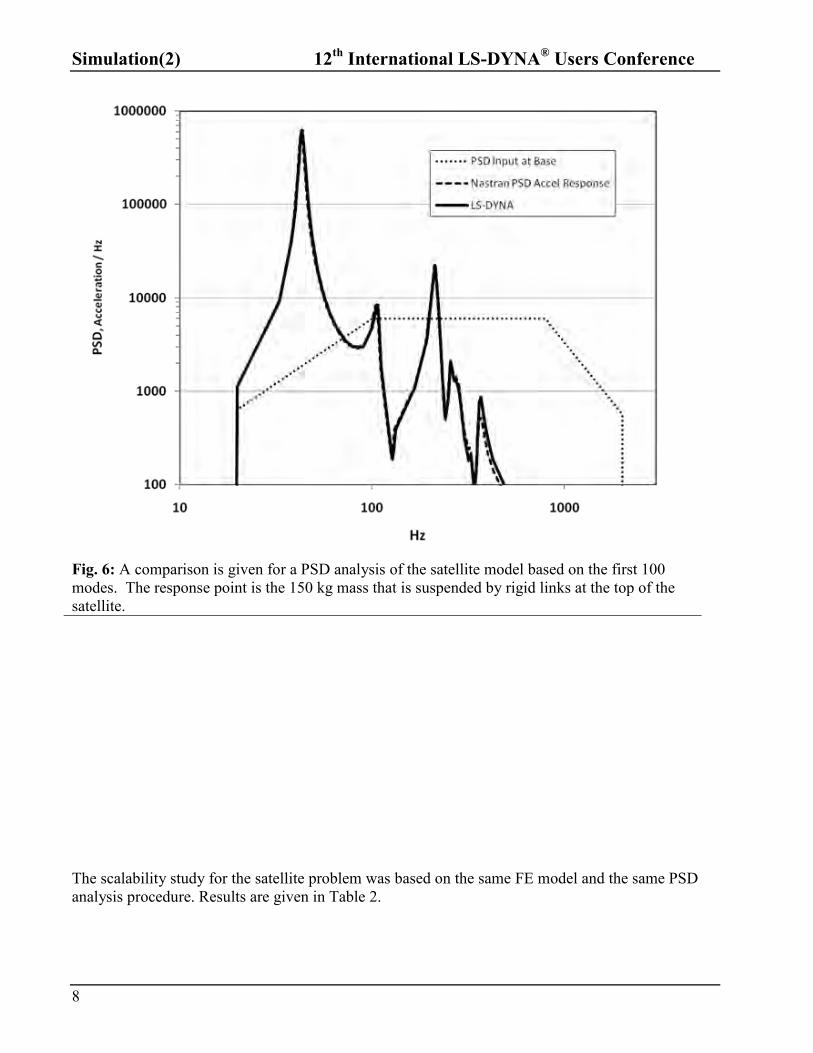
Fig. 6: A comparison is given for a PSD analysis of the satellite model based on the first 100 modes. The response point is the 150 kg mass that is suspended by rigid links at the top of the satellite. The scalability study for the satellite problem was based on the same FE model and the same PSD analysis procedure. Results are given in Table 2.
12th International LS-DYNA® Users Conference Simulation(2)
9
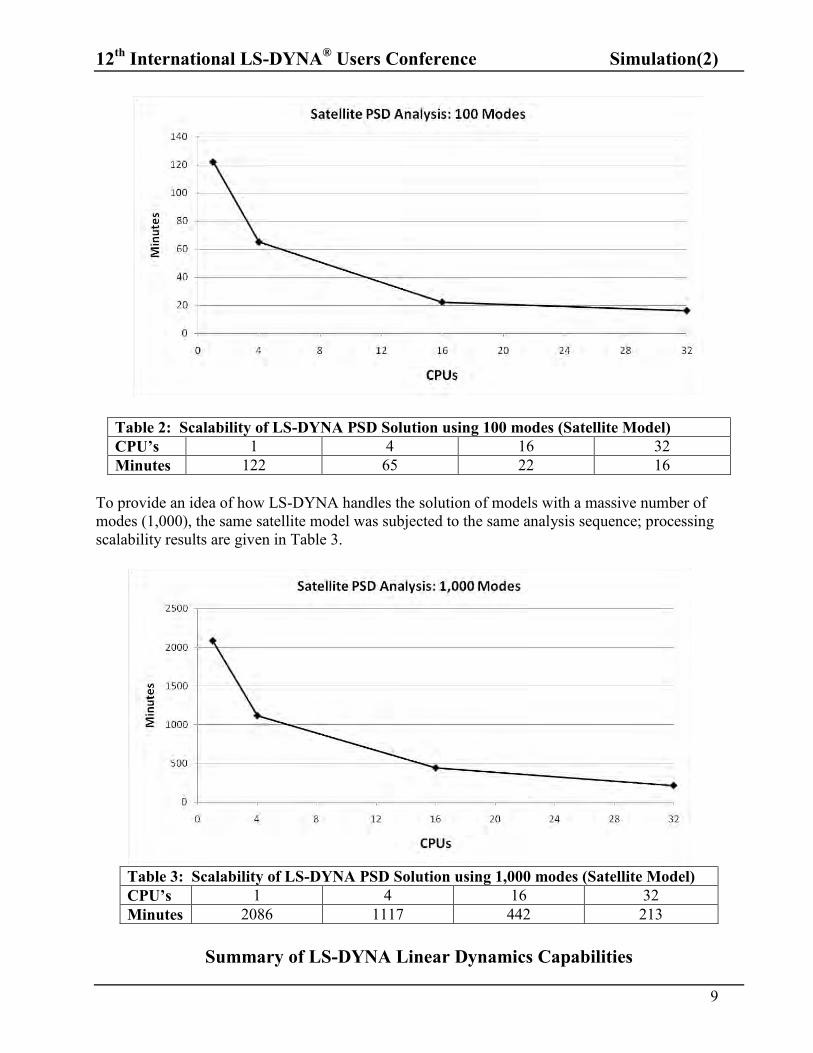
Table 2: Scalability of LS-DYNA PSD Solution using 100 modes (Satellite Model) CPU’s 1 4 16 32 Minutes 122 65 22 16
To provide an idea of how LS-DYNA handles the solution of models with a massive number of modes (1,000), the same satellite model was subjected to the same analysis sequence; processing scalability results are given in Table 3.
Table 3: Scalability of LS-DYNA PSD Solution using 1,000 modes (Satellite Model) CPU’s 1 4 16 32 Minutes 2086 1117 442 213
Summary of LS-DYNA Linear Dynamics Capabilities
Simulation(2) 12th International LS-DYNA® Users Conference
10
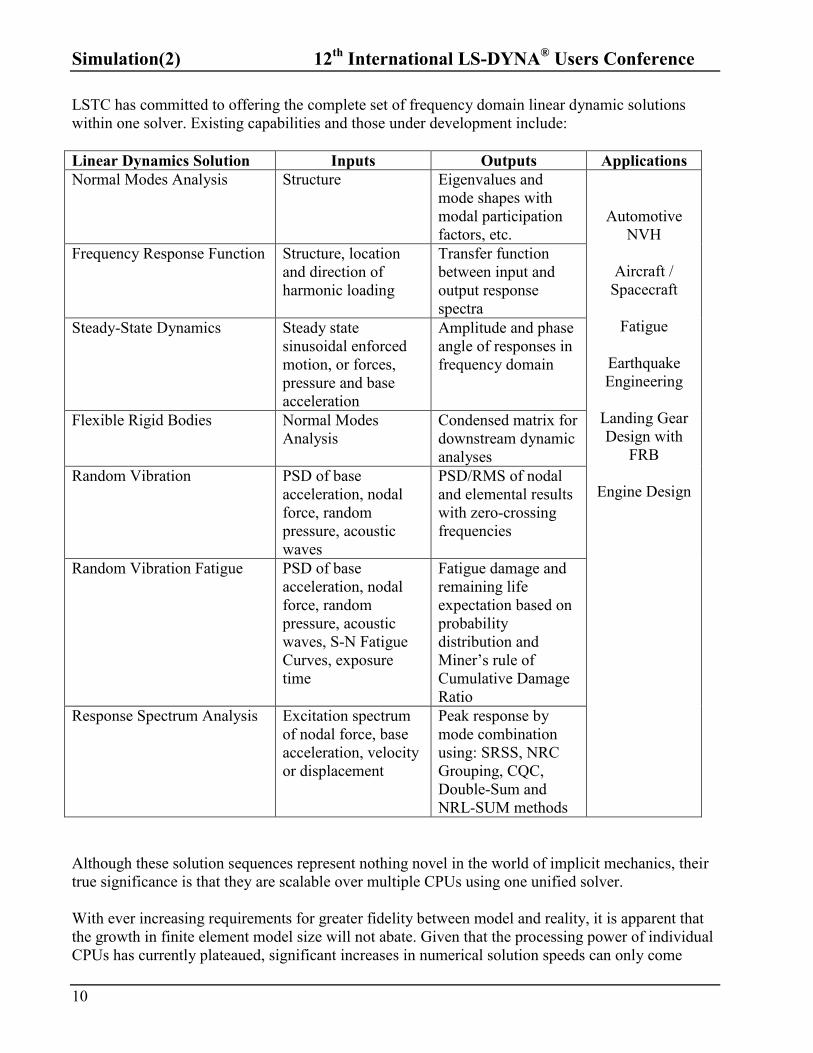
LSTC has committed to offering the complete set of frequency domain linear dynamic solutions within one solver. Existing capabilities and those under development include: Linear Dynamics Solution Inputs Outputs Applications Normal Modes Analysis Structure Eigenvalues and
mode shapes with modal participation factors, etc.
Automotive NVH
Aircraft /
Spacecraft
Fatigue
Earthquake Engineering
Landing Gear Design with
FRB
Engine Design
Frequency Response Function Structure, location and direction of harmonic loading
Transfer function between input and output response spectra
Steady-State Dynamics Steady state sinusoidal enforced motion, or forces, pressure and base acceleration
Amplitude and phase angle of responses in frequency domain
Flexible Rigid Bodies Normal Modes Analysis
Condensed matrix for downstream dynamic analyses
Random Vibration PSD of base acceleration, nodal force, random pressure, acoustic waves
PSD/RMS of nodal and elemental results with zero-crossing frequencies
Random Vibration Fatigue PSD of base acceleration, nodal force, random pressure, acoustic waves, S-N Fatigue Curves, exposure time
Fatigue damage and remaining life expectation based on probability distribution and Miner’s rule of Cumulative Damage Ratio
Response Spectrum Analysis Excitation spectrum of nodal force, base acceleration, velocity or displacement
Peak response by mode combination using: SRSS, NRC Grouping, CQC, Double-Sum and NRL-SUM methods
Although these solution sequences represent nothing novel in the world of implicit mechanics, their true significance is that they are scalable over multiple CPUs using one unified solver. With ever increasing requirements for greater fidelity between model and reality, it is apparent that the growth in finite element model size will not abate. Given that the processing power of individual CPUs has currently plateaued, significant increases in numerical solution speeds can only come
12th International LS-DYNA® Users Conference Simulation(2)
11
about through the efficient use of multiple CPUs. LSTC has consistently focused on the development of a numerical engine that would scale through the use of multiple CPUs across all multi-physics problems from structures to fluids to electromagnetism. This latest addition of linear dynamics to the LS-DYNA solver provides an excellent example of what is possible with a scalable implicit code.
Suggested Reading 1. Shor O., Lev Y., Huang Y., Simulation of a thin walled aluminum tube subjected to base
acceleration using LS-DYNA's vibro-acoustic solver. Proceedings of the 11th International LS-DYNA Users Conference, June 6-8, 2010, Dearborn, Michigan.
2. Huang Y., Wang B., Mode-based frequency response function and steady state dynamics in LS-DYNA. Proceedings of the 11th International LS-DYNA Users Conference, June 6-8, 2010, Dearborn, Michigan.
3. Huang Y., Wang B., Implementation and validation of frequency response function in LS-DYNA. FEA information; July 2009.
4. Rassaian M., Huang Y., Lee J., Structural analysis with vibro-acoustic loads in LS-DYNA. Proceedings of the 10th International LS-DYNA Users Conference, June 8-10, 2008, Dearborn, Michigan.
5. LS-DYNA Theory Manual, Livermore Software Technology Corporation 6. LS-DYNA Keyword User’s Manual, Livermore Software Technology Corporation.
References 1. J Maguire, D J Dawswell, L Gould, Selected Benchmarks for Forced Vibration, NAFEMS.

Simulation(2) 12th International LS-DYNA® Users Conference
12