Embed Size (px)
Citation preview

_____________________________________________________________________________________________________ *Corresponding author: E-mail: [email protected], [email protected];
Asian Journal of Agricultural Extension, Economics & Sociology
7(3): 1-17, 2015; Article no.AJAEES.13231 ISSN: 2320-7027
SCIENCEDOMAIN international
www.sciencedomain.org
Large Scale Foreign Land Deals and Agricultural Trade in Africa1
Adeyemi A. Ogundipe1*, Opeyemi Akinyemi1 and Oluwatomisin M. Ogundipe1
1Department of Economics and Development Studies, College of Business and Social Science,
Covenant University, Ota, Ogun State, Nigeria.
Authors’ contributions
The work was carried out in collaboration among all authors. Author OMO managed the literature searches and wrote the background. Author OA wrote the literature review while author AAO
performed the stylized facts and managed the analyses of the study. All authors read and approved the final manuscript.
Article Information
DOI: 10.9734/AJAEES/2015/13231
Editor(s): (1) Anthony N. Rezitis, Department Business Administration of Food and Agricultural Products, University of Western, Greece.
(2) Jamal Alrusheidat, Assistant and Consultant to Director General for Extension Education Director of Extension Education Department, National Centre for Agricultural Research and Extension (NCARE), Amman, Jordan.
Reviewers: (1) Anonymous, Benue State University, Nigeria.
(2) Anonymous, Savannah State University, USA. (3) Gedion Gamora, Erasmus University, Netherlands.
(4) Anonymous, Italy. Complete Peer review History: http://sciencedomain.org/review-history/10354
Received 8th
August 2014 Accepted 17th July 2015
Published 30th
July 2015
ABSTRACT
This study investigates the implications of foreign land deals in Africa especially with regard to agricultural trade. It is motivated essentially by large scale foreign land deals in Africa, Latin America, Central Asia and Southeast Asia. The empirical model adopted is based on institutional development theory and estimated using the Generalized Method of Moments (GMM). The study found that large scale foreign land deals (LSFLDs) impact negatively on agricultural export in selected countries and the indexes of institutional framework used were found to be significant. Likewise, agricultural land becomes highly significant with relatively larger magnitude when
1 The paper is an updated version of the paper presented at the 23rd Ibima conference on Sustainable Growth, Economic Development and Global Competitiveness held at Valencia Spain, 13th-14th May, 2014. The authors appreciate the valuable contributions of participants at the conference. Other errors and omissions are ours.
Original Research Article
brought to you by COREView metadata, citation and similar papers at core.ac.uk
provided by Covenant University Repository

Ogundipe et al.; AJAEES, 7(3): 1-17, 2015; Article no.AJAEES.13231
2
interacted with institutional indexes. This therefore implies that as more agricultural land is acquired, agricultural export tends to dwindle and incidences of food insecurity are heightened. The evidence from empirical investigation suggests the need for controlling the issue of massive foreign land deals through viable institutional framework, which can be engendered by building sound legal and procedural measures that will protect local rights and take into account the aspirations of local farmers and the welfare of citizenry.
Keywords: Agricultural exports; food security; institutional quality; sys-GMM.
JEL classification: F21; R52; Q15; Q18.
1. INTRODUCTION Africa and Latin America is said to have about 80 percent of world reserves of agricultural land; with Angola, Democratic Republic of Congo (DRC) and Sudan among the seven countries in Africa and Latin America that account for about half of the world land reserves. This, among other factors, has made Africa the most targeted region, which has recorded more than half of the foreign land projects/deals in the world. From available data, there have been incidences of large scale acquisition of land across Africa countries. Over 6,492,684 hectares of land has been acquired in Ethiopia, Ghana, Madagascar, Mali and Sudan. This represents almost half of the arable land in United Kingdom and three times the arable land of Norway. In Sudan and Ethiopia alone, the figures on foreign land deals are about 3.9 million and 1.2 million hectares, respectively [1]. The implications of foreign land deals can be far-reaching; though some argue that there are opportunities of increasing capital inflows, government revenue, among others for the host countries. However, there are serious challenges that the foreign land deals may portend. For African countries, especially those with difficulties in feeding their teaming population, leasing/ selling agricultural lands to foreign investors (who will use them to produce and export food for their population) will worsen the issue of food security. An example is the attempted South Korea Daewoo and Saudi Arabia farming investment in Madagascar and Sudan respectively. The agricultural products produced by foreign farmers are exported to their home countries leaving the recipient countries to lose their land resources and food produce. Another implication is the displacement of small scale farmers from their major means of survival due to their low bargaining power and inadequate knowledge. In most instances they wake up to hear of foreign land deals made by their governments without their inputs [2].
The major frontiers in farmland acquisition deals are countries with land and water constraints but rich in capital, such as Gulf States. Also, Countries such as China, South Korea and India with large populations and food security concerns seeks opportunities to produce food for their teeming population abroad. The present land acquisition in Africa would further increase the incidence of food insecurity in the region. The intervention proposed by the food aid convention targeted at seeking aid to improve the provision of reliable amount of food supplies to developing countries already signifies a problem. The present scramble for Africa’s land poses a serious threat to adequate food production in Africa. This present dilemma comprising increasing upwards shot in food prices, falling food aid to Africa and the rising land acquisition will likely raise the incidence of hunger in the region [3].
The combination of the global crises in food, energy, finance and the environment has driven a dramatic revaluation of land ownership in the past few years with Sub-Saharan Africa recognized as the site for most speculative major land deals [4,5]. The media and empirical researches have attributed foreign land acquisition to the need for production of food and bio-fuels for export to finance rich but resource-deficient countries in the face of the recent food and energy crises. Also, a number of empirical studies attribute the rise in land and farm investments worldwide to a number of factors ranging from growing demand for food, water and fuel; opportunities provided by the speculative market; and countries seeking to hedge against future market upswings in food prices [6,4]. In the same manner, others have attributed the rising interest in land deals, particularly in Africa, Asia and Latin America to the effects of food crisis and population expansion. In the words of [7], emerging literature and the media attributes the “foreignisation of space” to production of food

Ogundipe et al.; AJAEES, 7(3): 1-17, 2015; Article no.AJAEES.13231
3
and bio-fuel for export in the aftermath of recent food and energy crises.
One of the implications of land deals in Africa will be the displacement of local farmers from their ancestral land by turning valuable agricultural land for industrial use. This issue is a plight on Africa endowment, as farmland is not only central to export income for most Africa countries but highly significant to rural livelihood and food security. This makes nearly 70 percent of African population in the rural areas engaging in subsistence agriculture more vulnerable [8]. With the understanding that agriculture remains fundamental to economic growth, poverty alleviation, and environmental sustainability; the rising foreign land acquisition would endanger the prospect of developing Africa countries especially in curbing poverty. The surging food crisis, growing human and environmental pressures, and worries over food security culminate into intense foreign interest in farmland [2]. It is in this recognition that the seven Principles for Responsible Agricultural Investments was initiated by the World Bank, FAO, UNCTAD, and IFAD, and backed by the 2010 G8 Summit in Ontario. This is crucial as the export of most African countries depend largely on commodity products that require land for production. Sectors such as agriculture, mining and quarrying can be adversely affected and in-turn impacts the livelihood, welfare and economic development in developing Africa. Several media reports indicate that the least land deal in terms of acreage was 5,500 hectares; many are in million hectares. This gives some concern, as that the acreage of land in any country is limited in supply, and implies that any foreign acquisition reduces the available land for agricultural purposes [1]. Furthermore, with regards to the purpose of the land deals in Fig. 2, it can be observed that majority of them are for growing food crops such as rice, maize, wheat, sweet sorghum. Others for producing crops needed for bio-fuels, crops for feeding animals, and for investment (hedge fund). This denotes that foreign land acquisition is driven by the need to meet food security and investment that will yield future returns. To this end, this study focuses on the countries in Africa were large land deals have been reported.
The study submits that major land deals in Africa with long duration (100 years) and acreage are made in countries known to have weak institutional quality and poor land governance.
Although investors do promise employment and infrastructural development but often fail to deliver on their promises as there are no strong institutional machineries to drive it. It recommends the urgent need for recipient governments to clarify the kind of investment, how the returns from the land deals are to be distributed. The assessment of social and environmental impacts as well as transparency in decision-making and compensation of displaced land users are also recommended. This study concludes that foreign land acquisition is not utterly bad but it maintains that the recipient countries need to make adequate assessment of investment and development plans when such transactions are to be made, which can be done by setting up committee on land acquisition charged with the responsibility of consultation, implementation and compensation.
2. BACKGROUND/STYLIZED FACTS
2.1 Land and Land Deals in Africa
The demand for land across the world has remained on the increase. The growing population among others is adjudged responsible for this. Since the supply of land is fixed and the demand varies, then there is the issue of inadequate land to meet economic activities. For instance, Fig. 1 reports that the available land for agricultural purposes around the world is consistently reducing. This implies that available land is insufficient for the growing population especially to sustain their agricultural activities. Also, Fig. 1 shows that agricultural land as a percentage of global land area has witnessed considerable decline with some degrees of fluctuations. [2,9], attributed this decline to the use of land for non-food production such as bio-fuels, carbon sequestration, and forest protection. The consequences of unavailability of land to meet the growing demand for it, has brought about foreign land acquisitions. By this, agents demanding for land, seek out opportunities to acquire land in places outside their origin. In recent times, the issue of large scale foreign land acquisitions (LSFLAs) has remained central to debates among media reporters, scholars, policy-makers and urban managers. This is because of the central role of land as an economic resource and the possibility of value appreciation. These LSFLAs are acquired for diverse reasons. Based on this, Fig. 2 presents

Ogundipe et al.; AJAEES, 7(3): 1-17, 2015; Article no.AJAEES.13231
4
the distribution of land projects and their drivers across the regions of the world.
As can be observed in Fig. 2, the proportion of land deal in SSA is far higher than other regions in the world. According to [10], out of 464 land projects, 203 included area information that summed up to 56.6 million hectares (ha) cutting across projects in 81 countries but 48 percent of the projects covered 39.7 million ha, representing about two-third of the total area in Sub-Saharan Africa (SSA). This is distantly followed by East and South Asia with 8.3 million ha.
To further buttress the observation from Fig. 2, [11] claimed that Africa is the most targeted. They observed that from the 754 land deals for which information was available, 56.2 million ha are located in Africa, 17.1 million ha in Asia and 7 million in Latin America. A stunning revelation from their data is that out of the 11 most targeted countries by foreign land investors, about 64 percent are African namely, Ethiopia, DR Congo, Madagascar, Mozambique, Tanzania, Sudan and Zambia.
Fig. 1. Agricultural land per capita and as percentage of global land Source: Oxfam international
Fig. 2. Distribution of projects/ land area across regions of the world Sources: Brüntrup (p.3) and Deininger et al (p.52)

Ogundipe et al.; AJAEES, 7(3): 1-17, 2015; Article no.AJAEES.13231
5
An implication of these land deals is the displacement of local farmers from their ancestral land by turning valuable agricultural land for industrial purposes. Paradoxically, these industrial development and production are not targeted at the benefit of the host community, but for the needs of the countries of origin. The foregoing is a plight to Africa endowment as farmland is highly significant to rural livelihood and national food security. [2,9] noted that the growing human and environmental pressure accompanied by land acquisition has generated
the worries over food security. The food price crisis has increased the anticipated returns on land and water resources, making farmland prices increase across the world. A summary of the major land deals reported in some African countries are presented in Table 1. The land deals reported in Table 1 involved both private foreign firms acquiring land in Africa and those that involved governments, for the period 2006-2012.
Table 1. Summary of land deals in Africa (2006-2012)
Target country Investor’s country Nature of land deals Angola Lonrho (UK) 25000 ha leased for rice. Lonrho is negotiating
for a further 125,000 ha in Mali and Malawi. Cameroun Unknown company (China) 10,000 ha secured for rice. Congo, DR China (ZTE International) 2-8 million ha secured for biofuel oil palm
plantation. Congo, DR Agriculture South Africa (South
Africa) 10 million ha offered to farmers’ union.
Egypt Jenat (Saudi Arabia) 10,000 ha secured for barley, wheat, and livestock feed.
Ethiopia Flora Ecopower (Germany) 13,000 ha secured for biofuel crops; contract farming arrangement.
Ethiopia Sun Biofuel (UK) Land secured for Jatropa (biofuel). Ethiopia India US$4 billion invested, including agriculture,
flower growing and sugar estates. Ethiopia Unknown private investors
(Saudi Arabia) Land leased in exchange for US$100 million investment.
Kenya Qatar 40,000 ha leased for fruit and vegetable cultivation in exchange for funding US$2.3 billion port.
Madagascar Daewoo (South Korea) 1.3 million ha secured for maize. Malawi Djibouti Unknown area of farm land leased. Mali Libya 100,000 ha leased for rice. Mozambique Skebab (Sweden) 100,000 ha secured for biofuel crops. Mozambique China US$800 million investment to expand rice
production from 100,000 to 500,000 metric tons; political opposition to deal.
Nigeria Trans4mation Agrictech Ltd (UK) 10,000 ha secured. Sudan Egypt Land secured to grow 2 million tons of wheat
annually. Sudan Jordan 25000 ha secured for livestock and crops. Sudan Kuwait ‘Giant’ strategic partnership; no further
information. Sudan Qatar Joint holding company setup to invest in
agriculture. Sudan Saudi Arabi (Hail Agricultural
Dev. Co) 9,200-10,117 ha leased for wheat, vegetables and animal feed: 60% paid by Saudi government.
Sudan South Korea 690,000 ha secured for wheat. Sudan United Arab Emirates (UAE) 378,000 ha total invested in by UAE. Sudan UAE (Abu Dhabi fund for
development) 30,000 ha secured for corn, alfalfa, and possibly wheat, potatoes, and beans.
Ogundipe et al.; AJAEES, 7(3): 1-17, 2015; Article no.AJAEES.13231
6
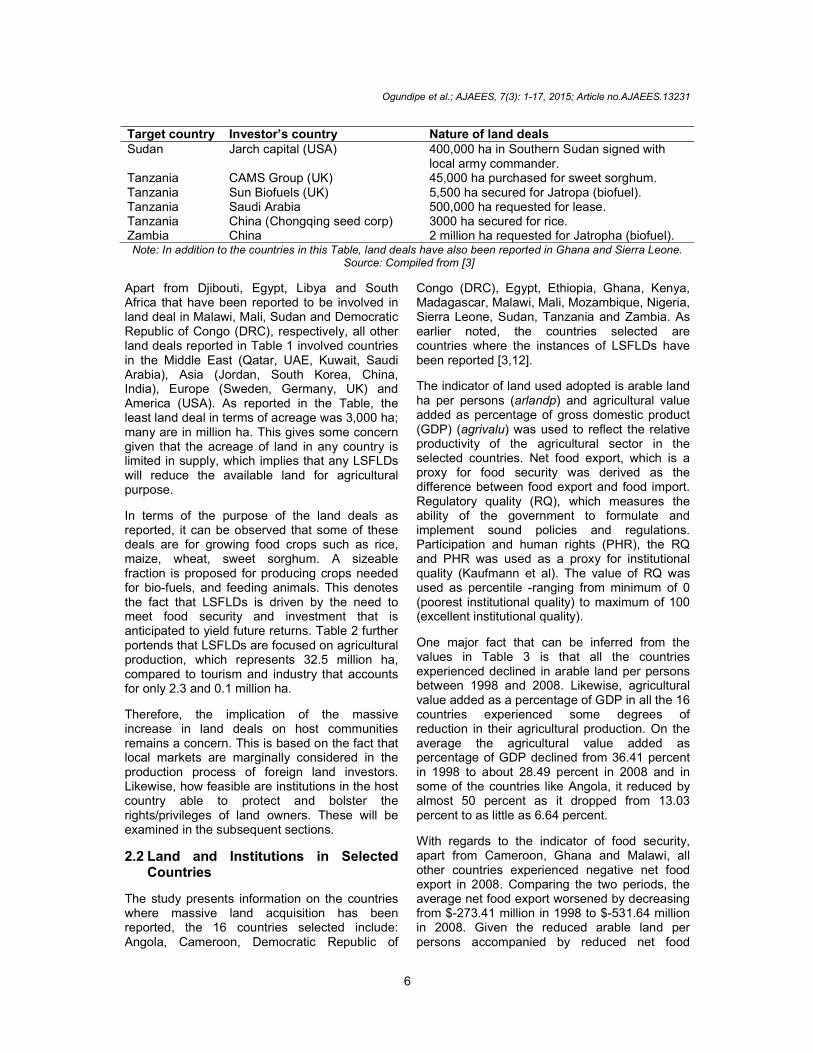
Target country Investor’s country Nature of land deals Sudan Jarch capital (USA) 400,000 ha in Southern Sudan signed with
local army commander. Tanzania CAMS Group (UK) 45,000 ha purchased for sweet sorghum. Tanzania Sun Biofuels (UK) 5,500 ha secured for Jatropa (biofuel). Tanzania Saudi Arabia 500,000 ha requested for lease. Tanzania China (Chongqing seed corp) 3000 ha secured for rice. Zambia China 2 million ha requested for Jatropha (biofuel). Note: In addition to the countries in this Table, land deals have also been reported in Ghana and Sierra Leone.
Source: Compiled from [3]
Apart from Djibouti, Egypt, Libya and South Africa that have been reported to be involved in land deal in Malawi, Mali, Sudan and Democratic Republic of Congo (DRC), respectively, all other land deals reported in Table 1 involved countries in the Middle East (Qatar, UAE, Kuwait, Saudi Arabia), Asia (Jordan, South Korea, China, India), Europe (Sweden, Germany, UK) and America (USA). As reported in the Table, the least land deal in terms of acreage was 3,000 ha; many are in million ha. This gives some concern given that the acreage of land in any country is limited in supply, which implies that any LSFLDs will reduce the available land for agricultural purpose.
In terms of the purpose of the land deals as reported, it can be observed that some of these deals are for growing food crops such as rice, maize, wheat, sweet sorghum. A sizeable fraction is proposed for producing crops needed for bio-fuels, and feeding animals. This denotes the fact that LSFLDs is driven by the need to meet food security and investment that is anticipated to yield future returns. Table 2 further portends that LSFLDs are focused on agricultural production, which represents 32.5 million ha, compared to tourism and industry that accounts for only 2.3 and 0.1 million ha.
Therefore, the implication of the massive increase in land deals on host communities remains a concern. This is based on the fact that local markets are marginally considered in the production process of foreign land investors. Likewise, how feasible are institutions in the host country able to protect and bolster the rights/privileges of land owners. These will be examined in the subsequent sections.
2.2 Land and Institutions in Selected Countries
The study presents information on the countries where massive land acquisition has been reported, the 16 countries selected include: Angola, Cameroon, Democratic Republic of
Congo (DRC), Egypt, Ethiopia, Ghana, Kenya, Madagascar, Malawi, Mali, Mozambique, Nigeria, Sierra Leone, Sudan, Tanzania and Zambia. As earlier noted, the countries selected are countries where the instances of LSFLDs have been reported [3,12].
The indicator of land used adopted is arable land ha per persons (arlandp) and agricultural value added as percentage of gross domestic product (GDP) (agrivalu) was used to reflect the relative productivity of the agricultural sector in the selected countries. Net food export, which is a proxy for food security was derived as the difference between food export and food import. Regulatory quality (RQ), which measures the ability of the government to formulate and implement sound policies and regulations. Participation and human rights (PHR), the RQ and PHR was used as a proxy for institutional quality (Kaufmann et al). The value of RQ was used as percentile -ranging from minimum of 0 (poorest institutional quality) to maximum of 100 (excellent institutional quality).
One major fact that can be inferred from the values in Table 3 is that all the countries experienced declined in arable land per persons between 1998 and 2008. Likewise, agricultural value added as a percentage of GDP in all the 16 countries experienced some degrees of reduction in their agricultural production. On the average the agricultural value added as percentage of GDP declined from 36.41 percent in 1998 to about 28.49 percent in 2008 and in some of the countries like Angola, it reduced by almost 50 percent as it dropped from 13.03 percent to as little as 6.64 percent.
With regards to the indicator of food security, apart from Cameroon, Ghana and Malawi, all other countries experienced negative net food export in 2008. Comparing the two periods, the average net food export worsened by decreasing from $-273.41 million in 1998 to $-531.64 million in 2008. Given the reduced arable land per persons accompanied by reduced net food

Ogundipe et al.; AJAEES, 7(3): 1-17, 2015; Article no.AJAEES.13231
7
export, there could be possible relationship between the two variables. As can also be observed in Table 3, the indicator of institutional quality had an average value of 30.46 in 2008 and some of the countries like DRC and Sudan; it was as low as 5.30 and 7.20, respectively. This reflects the level of weak institutional framework in these countries, which might have been one of the factors responsible for the increased LSFLDs.
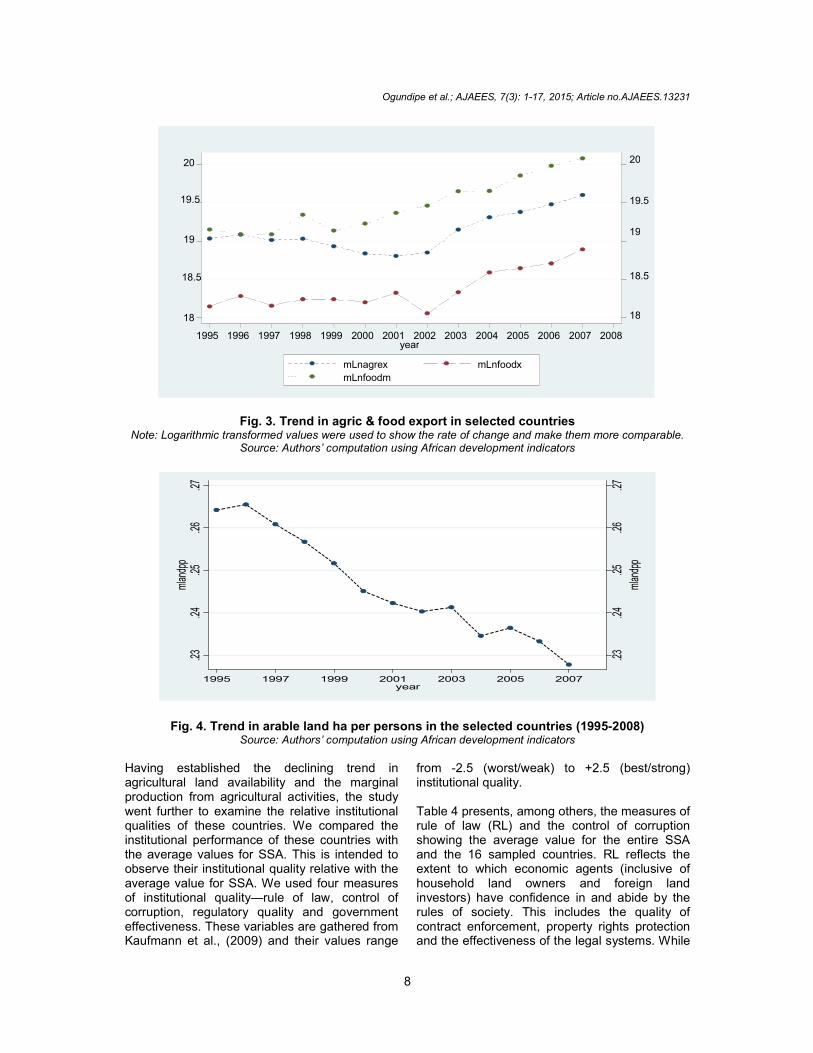
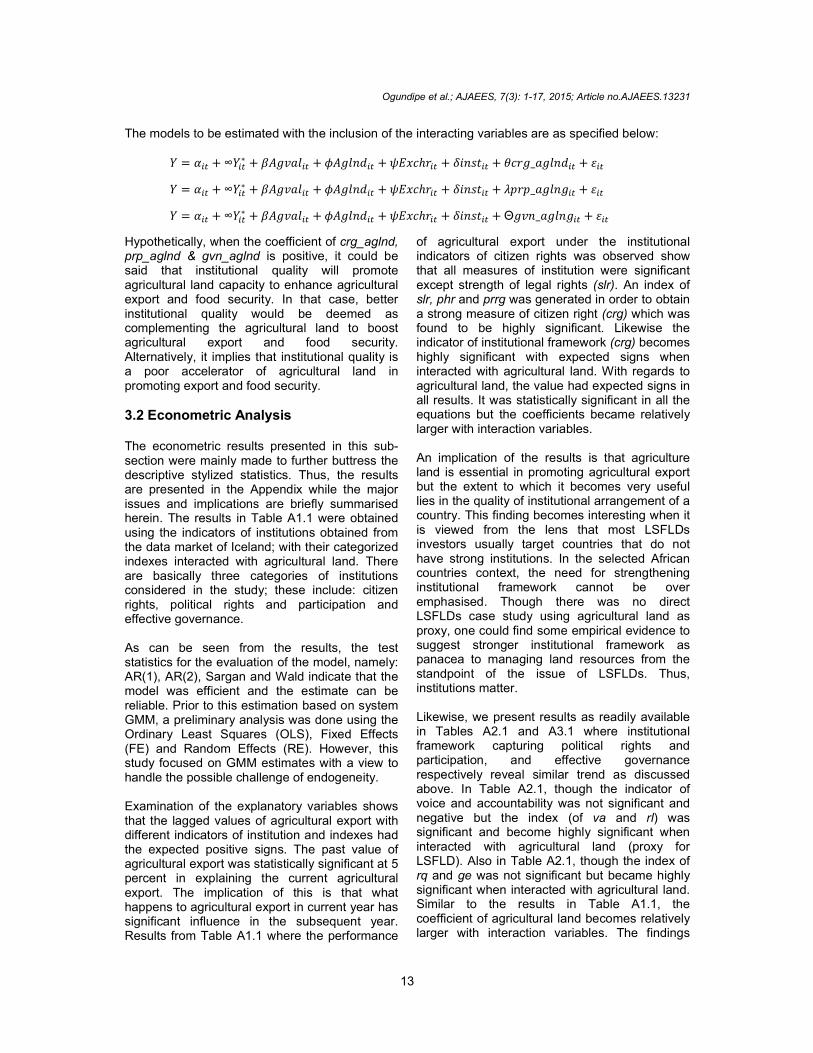
In furtherance, the study examined the trends in agricultural export (agrex), food export (foodx) and food import (foodm) using the mean values of the 16 countries for the period 1995-2008. As shown in Fig. 3, the variables had upward trends; however, agricultural and food exports exhibited some fluctuations. The crucial observation is that the food import was consistently above food
export throughout the period. The trend indicates that the selected countries are increasingly becoming net food importers. This can be attributed among others to the weak institutions and growing insufficiency of land to boost the productive capacity from agricultural activities. Fig. 4 is instructive as the trajectory for land available for agricultural purposes witnessed a consistent decline. The information in the graph about the plot of arable land ha per persons indicates that the value has continuously declined over the period 1995-2008, except in 1996, 2003 and 2005. Another issue is that the value is less than 0.5 ha per persons. As can be observed from the graph, between 1995 and 2007, the value for arable land ha per persons reduced more than 200 percent.
Table 2. Sectors affected by land deals around the world (2006-2009)
All reported deals Reliable data Number of deals Hectares (millions) Number of deals Hectares (millions)
Agriculture 1162 82.9 591 32.5 Forestry 78 3.1 65 2.2 Livestock only 55 0.4 34 0.2 Mining 91 3.9 51 1.6 Tourism 23 2.3 8 2.3 Industry 20 0.3 17 0.1 Conservation 2 0.3 2 0.3 No Information 237 12.8 31 3.8 Total 1668 106 799 43.1
Source: Land matrix data (2012)
Table 3. Indicators of land, food security and institutional quality in selected countries
s/n Country arlandp agrivalu Net food export RQ PHR 2008 2010 2008 2010 2008 2010 2008 2010 2008 2010
1 Angola 0.22 0.19 13.03 6.64 -356.20 -1148.57 5.90 16.90 25.50 38.82 2 Cameroon 0.39 0.32 25.33 19.47 115.36 78.43 26.30 26.10 37.86 32.97 3 DRC 0.14 0.11 47.18 42.47 -182.54 -486.15 1.00 5.30 20.11 31.18 4 Egypt 0.04 0.04 17.11 13.22 -2474.65 -3487.00 15.60 21.30 30.11 33.57 5 Ethiopia 0.16 0.18 52.56 43.83 -105.29 -109.07 12.70 19.80 42.60 32.89 6 Ghana 0.20 0.18 40.23 29.05 357.23 471.06 47.30 55.00 67.41 67.41 7 Kenya 0.16 0.14 31.23 21.05 -196.89 -243.92 35.00 50.70 53.00 54.81 8 Madagascar 0.20 0.16 30.58 24.81 -38.19 -81.28 21.50 41.50 71.53 58.20 9 Malawi 0.23 0.21 35.58 30.11 -47.23 147.34 44.40 38.60 54.82 50.60 10 Mali 0.45 0.39 46.47 36.54 -55.12 -155.44 37.60 40.60 58.22 57.11 11 Mozambique 0.23 0.20 30.84 30.47 -157.31 -275.43 36.60 35.30 64.62 57.07 12 Nigeria 0.25 0.25 49.00 33.00 -839.68 -1964.84 18.00 29.50 45.84 37.49 13 Sierra leone 0.12 0.17 61.80 50.21 -128.15 -109.31 9.30 7.20 48.02 52.33 14 Sudan 0.50 0.48 46.35 26.25 135.26 -745.62 7.80 7.20 15 Tanzania 0.27 0.22 33.76 29.71 -262.38 -343.14 37.10 38.20 63.43 56.93 16 Zambia 0.53 0.43 21.14 18.95 -138.71 -52.84 49.30 41.10 46.81 54.57 Average 0.26 0.23 36.14 28.49 -273.41 -531.64 25.34 30.46 48.66 48.42
Source: Compiled from WDI 2012
Ogundipe et al.; AJAEES, 7(3): 1-17, 2015; Article no.AJAEES.13231
8
Fig. 3. Trend in agric & food export in selected countries Note: Logarithmic transformed values were used to show the rate of change and make them more comparable.
Source: Authors’ computation using African development indicators
Fig. 4. Trend in arable land ha per persons in the selected countries (1995-2008) Source: Authors’ computation using African development indicators
Having established the declining trend in agricultural land availability and the marginal production from agricultural activities, the study went further to examine the relative institutional qualities of these countries. We compared the institutional performance of these countries with the average values for SSA. This is intended to observe their institutional quality relative with the average value for SSA. We used four measures of institutional quality—rule of law, control of corruption, regulatory quality and government effectiveness. These variables are gathered from Kaufmann et al., (2009) and their values range
from -2.5 (worst/weak) to +2.5 (best/strong) institutional quality. Table 4 presents, among others, the measures of rule of law (RL) and the control of corruption showing the average value for the entire SSA and the 16 sampled countries. RL reflects the extent to which economic agents (inclusive of household land owners and foreign land investors) have confidence in and abide by the rules of society. This includes the quality of contract enforcement, property rights protection and the effectiveness of the legal systems. While
.23
.24
.25
.26
.27
mlan
dpp
.23
.24
.25
.26
.27
mlan
dpp
1995 1997 1999 2001 2003 2005 2007year
18
18.5
19
19.5
20
18
18.5
19
19.5
20
1995 1996 1997 1998 1999 2000 2001 2002 2003 2004 2005 2006 2007 2008year
mLnagrex mLnfoodx
mLnfoodm

Ogundipe et al.; AJAEES, 7(3): 1-17, 2015; Article no.AJAEES.13231
9
the control of corruption reveals the extent to which public power is exercised for private gain and the extent of elitist capture of the state for private interests. As reflected in Table 4, the lower these scores, the easier it is for foreign investors to relent in their responsibilities since they are able to influence community leaders and public officers with private gains.
From the Table 4, SSA countries performed poorly, considering that the RL score ranged from -0.71 to -0.77. Similarly, the sampled countries performed even worse as they had a lower score ranging from -0.77 to -0.93. During the period, some countries had score as low as -2.11 and -2.01.
Table 4. Institutional quality in the selected countries and ssa average
1996 1998 2000 2002 2004 2006 2008 2010 Rule of law (RL)
Angola -1.60 -1.57 -1.62 -1.46 -1.34 -1.25 -1.28 -1.24 Cameroun -1.44 -1.15 -1.16 -1.16 -1.14 -1.01 -0.99 -1.04 DRC -1.95 -2.11 -2.01 -1.87 -1.82 -1.79 -1.68 -1.61 Egypt 0.08 -0.06 -0.03 -0.02 0.05 -0.15 -0.09 -0.11 Ethiopia -0.84 -0.72 -0.82 -0.79 -0.69 -0.56 -0.60 -0.76 Ghana -0.32 -0.44 -0.03 -0.11 -0.24 -0.02 -0.10 -0.07 Kenya -0.98 -1.11 -0.96 -1.00 -0.89 -0.89 -0.98 -1.01 Madagascar -0.63 -0.69 -0.32 -0.23 -0.14 -0.41 -0.46 -0.84 Malawi -0.41 -0.56 -0.57 -0.66 -0.42 -0.53 -0.29 -0.14 Mali -0.50 -0.51 -0.47 -0.38 -0.28 -0.40 -0.35 -0.46 Mozambique -0.83 -0.91 -0.81 -0.75 -0.75 -0.70 -0.66 -0.50 Nigeria -1.19 -1.30 -1.14 -1.45 -1.5 -1.14 -1.12 -1.21 Sierra Leone -1.49 -1.18 -1.38 -1.33 -1.1 -1.16 -1.03 -0.94 Sudan -1.60 -1.57 -1.46 -1.24 -1.52 -1.35 -1.50 -1.32 Tanzania -0.21 -0.37 -0.42 -0.46 -0.4 -0.46 -0.28 -0.51 Zambia -0.63 -0.58 -0.55 -0.49 -0.58 -0.63 -0.50 -0.49 Average of 16 -0.91 -0.93 -0.86 -0.84 -0.8 -0.78 -0.74 -0.77 SSA -0.75 -0.73 -0.72 -0.71 -0.77 -0.73 -0.74 -0.74
Source: Authors’ compilation/computation using data from world governance indicator (2012)
Table 5. Institutional quality in the selected countries and SSA average
1996 1998 2000 2002 2004 2006 2008 2010 Control of corruption (CC)
Angola -1.16 -1.39 -1.55 -1.21 -1.31 -1.19 -1.22 -1.33 Cameroun -1.16 -1.22 -1.03 -1.10 -1.08 -1.03 -0.90 -0.98 DRC -2.06 -1.81 -1.71 -1.53 -1.44 -1.51 -1.31 -1.38 Egypt -0.07 -0.28 -0.40 -0.33 -0.46 -0.52 -0.67 -0.56 Ethiopia -1.16 -0.55 -0.45 -0.50 -0.72 -0.65 -0.66 -0.70 Ghana -0.22 -0.31 -0.16 -0.32 -0.27 -0.03 -0.06 0.09 Kenya -1.03 -1.13 -1.00 -1.02 -0.87 -0.89 -1.01 -0.91 Madagascar 0.20 -0.42 -0.05 0.13 -0.12 -0.25 -0.10 -0.27 Malawi -0.22 -0.36 -0.37 -0.97 -0.76 -0.73 -0.59 -0.42 Mali -0.44 -0.62 -0.64 -0.38 -0.37 -0.44 -0.47 -0.68 Mozambique -0.36 -0.71 -0.68 -0.72 -0.74 -0.66 -0.55 -0.40 Nigeria -1.16 -1.17 -1.25 -1.47 -1.36 -1.19 -0.92 -0.99 Sierra Leone -0.78 -0.94 -0.93 -0.80 -0.88 -1.12 -1.07 -0.76 Sudan -1.28 -1.00 -0.93 -1.02 -1.31 -1.17 -1.49 -1.33 Tanzania -1.03 -1.12 -1.11 -1.01 -0.67 -0.40 -0.51 -0.49 Zambia -1.03 -0.92 -0.94 -0.98 -0.86 -0.74 -0.48 -0.57 Average of 16 -0.81 -0.87 -0.83 -0.83 -0.83 -0.78 -0.75 -0.73 SSA -0.59 -0.63 -0.58 -0.59 -0.67 -0.64 -0.62 -0.60
Source: Authors’ compilation/computation using data from World Governance Indicator (2012)

Ogundipe et al.; AJAEES, 7(3): 1-17, 2015; Article no.AJAEES.13231
10
Considering that the countries had negative scores for most of the period apart from Egypt that had positive scores in both 1996 and 2004, it will be rational to conclude that these countries legal system are not efficient to foster the protection of private properties and ensure qualitative contract terms especially in the case of foreign land acquisition. Likewise, the extent of corruption and elitist capture still remain high based on the SSA control of corruption ranging from -0.59 to -0.67. The average value for the sampled countries is also disheartening as it remains in lower pedestal to SSA. This becomes an issue as households and landowners suffer by the dispossession of their ancestral lands to foreign investors, with poor benefits, because of corrupt practices from public officers and traditional leaders. [13] observe that land acquisitions in Africa are cascaded with corruption due to the weakness of the government to enforce proper contractual agreement. This is the case in most parts of Africa where the government and other public officers engage in land contracts with foreigners with the intention of self actualisation. According to [14], the Shonga case in Nigeria is an evident to this, where the displaced white farmers from Zimbabwe were allotted large scale agricultural land which is central to the peoples’ survival. [15] emphasized the height of lack of transparency in the land deal processes in most African countries. This will foster corrupt practices and elitist capture.
The quality of policies formulated by the government and the implementation of same for the promotion of private sector development was examined using the sampled countries. In cases where there is poor regulatory quality, the issues of unfair dealings come to be because there are no adequate institutions to regulate excesses of economic agents when dealing with related parties. From the Table 5, the value of the regulatory quality for SSA was negative in all he period. Similar reflection is observed from the values of the individual countries. Most of the countries had negative values for most of the period. This signifies that in these countries, there are poor policies to promote efficient private sector development.
The issue of land grabbing and the attendant severe consequences on the household and community cannot be resolved without sound regulatory qualities. In some cases, where lands are taken over for exploitation; land degradation and pollution become paramount, and with poor regulatory qualities observed from the Table 5, the communities suffer. Some of these consequences include pollution of the water accessible to the communities, air pollution bringing about organic mutations and the likes. However, the government responsiveness becomes cardinal.
Table 6. Institutional quality in the selected countries and SSA average
1996 1998 2000 2002 2004 2006 2008 2010
Regulatory quality (RQ) Angola -1.45 -1.72 -1.82 -1.48 -1.25 -1.14 -1.06 -1.05 Cameroun -1.13 -0.64 -0.60 -0.89 -0.66 -0.86 -0.83 -0.72 DRC -1.83 -2.41 -2.11 -1.51 -1.59 -1.32 -1.30 -1.60 Egypt 0.01 -0.34 -0.35 -0.50 -0.49 -0.42 -0.18 -0.18 Ethiopia -1.34 -1.18 -1.16 -1.23 -0.96 -0.95 -0.83 -0.88 Ghana -0.38 -0.24 -0.09 -0.46 -0.34 -0.06 -0.02 0.09 Kenya -0.37 -0.34 -0.30 -0.20 -0.28 -0.26 -0.24 -0.13 Madagascar -1.05 -0.82 -0.46 -0.28 -0.32 -0.19 -0.32 -0.59 Malawi -0.29 -0.23 -0.22 -0.47 -0.51 -0.45 -0.48 -0.57 Mali -0.48 -0.24 -0.12 -0.44 -0.45 -0.41 -0.40 -0.47 Mozambique -0.54 -0.29 -0.17 -0.30 -0.46 -0.52 -0.47 -0.37 Nigeria -0.83 -0.93 -0.75 -1.26 -1.34 -0.91 -0.78 -0.78 Sierra Leone -1.61 -1.33 -1.39 -1.27 -1.00 -1.17 -0.97 -0.72 Sudan -1.37 -1.36 -1.44 -1.29 -1.17 -1.21 -1.47 -1.36 Tanzania -0.42 -0.41 -0.25 -0.56 -0.45 -0.31 -0.50 -0.41 Zambia -0.42 -0.12 -0.27 -0.62 -0.53 -0.65 -0.45 -0.49 Average of 16 -0.84 -0.79 -0.72 -0.80 -0.74 -0.68 -0.64 -0.64 SSA -0.75 -0.71 -0.67 -0.68 -0.74 -0.73 -0.74 -0.71
Source: Authors’ compilation/computation using data from world governance indicator (2012)

Ogundipe et al.; AJAEES, 7(3): 1-17, 2015; Article no.AJAEES.13231
11
Table 7. Institutional quality in the selected countries and SSA average
1996 1998 2000 2002 2004 2006 2008 2010 Government Effectiveness (GE)
Angola -0.84 -1.36 -1.46 -1.25 -1.34 -1.43 -1.07 -1.12 Cameroun -1.00 -0.74 -0.67 -0.82 -0.73 -0.92 -0.79 -0.89 DRC -1.69 -1.97 -1.96 -1.74 -1.47 -1.66 -1.68 -1.72 Egypt -0.15 -0.17 -0.21 -0.41 -0.26 -0.61 -0.44 -0.43 Ethiopia -1.28 -0.94 -0.91 -0.93 -0.71 -0.59 -0.41 -0.35 Ghana -0.11 -0.14 0.02 -0.20 -0.27 -0.01 0.04 -0.01 Kenya -0.34 -0.49 -0.54 -0.70 -0.59 -0.62 -0.56 -0.54 Madagascar -0.58 -0.83 -0.64 -0.47 -0.44 -0.57 -0.63 -0.82 Malawi -0.51 -0.31 -0.38 -0.69 -0.70 -0.75 -0.51 -0.40 Mali -1.21 -1.05 -0.87 -0.63 -0.66 -0.77 -0.90 -0.88 Mozambique -0.14 -0.39 -0.43 -0.44 -0.56 -0.59 -0.44 -0.47 Nigeria -0.98 -1.12 -0.94 -0.99 -0.80 -0.88 -0.98 -1.20 Sierra Leone -1.47 -1.46 -1.46 -1.51 -1.12 -1.18 -1.17 -1.19 Sudan -1.12 -1.22 -1.19 -1.13 -1.23 -1.14 -1.28 -1.37 Tanzania -0.73 -0.42 -0.42 -0.35 -0.37 -0.44 -0.48 -0.50 Zambia -1.06 -0.86 -0.86 -0.83 -0.77 -0.78 -0.74 -0.80 Average of 16 -0.82 -0.84 -0.81 -0.82 -0.75 -0.81 -0.75 -0.79 SSA -0.72 -0.69 -0.69 -0.68 -0.72 -0.77 -0.75 -0.77
Source: Authors’ compilation/computation using Data from World Governance Indicator (2012)
This study underpins that in situations where the government are responsive to the ordeals of the citizens, the adverse consequences of land grab will be marginal. This is based on the fact that in cases where foreign investors are not able to meet up with their agreements, the government takes adequate measures to ensure the attainment of such agreement. However, in cases where they are easily influenced, foreign investors will find their way through. The data in Table 5 reveals the extent of government responsiveness by using government effectiveness as a measure. Government effectiveness reflects the quality of public officers, the quality of policy formulation and implementation, and the credibility of the government's commitment to such policies. It includes the independence of the government and the extent they can easily be influenced. As seem in the Table 5, the SSA countries records negative values; this suggests that the governments in these countries can be easily influenced and when policies are developed, the political will to ensure the adherence to such policies will be lacking. Therefore, this signifies the intense extent of land grab in these countries. From the foregoing, this study has been able to prove that institutional quality matter in the extent of foreign land grab in Africa. As the statistics reveal, countries with most incidences of foreign land acquisition have low institutional qualities.
3. DATA AND METHODOLOGY To further buttress the ongoing analysis, the study adopt an empirically investigation of the impact of large scale land acquisition on agricultural export in selected Africa countries where cases of LSFLD have been reported. The study selects 16 countries in Africa where the issue of foreign land deals have been reported. It analyzed the availability of land to agricultural production using the period 1995-2012. This is to establish the extent of land rush in these countries during the periods of media report (2006-2012) as reported in Table 1. Given the role of governance and institutions in this discourse, the study also brought to bear the data on institutional quality including: property rights and rule based government, voice and accountability, strength of legal rights, rule of law, regulatory quality, government effectiveness and property and human rights. The econometric analysis used panel data for the 16 countries for the period 1995-2012. The model estimated draws from institutional development theories. The choice of the period was informed by data availability while cases of LSFLDs informed the choice of the 16 countries that cut across Central, East, North, Southern and West Africa.
The generalised method of moments (GMM) estimator was used due to the short panel

Ogundipe et al.; AJAEES, 7(3): 1-17, 2015; Article no.AJAEES.13231
12
structure as well as ability to handle the challenge of endogeneity as institutions may not be exogenous [16,17,18]. In addition, the availability of land for agricultural production was interacted with indicators of institutional quality with a view to establishing whether or not both variables have joint significant influence on agricultural export and food security.
3.1 Econometric Model The econometric model is based on the fact that Large Scale Foreign Land Acquisitions- LSFLAs may not have a direct measure in terms of its influence on agricultural export and food security. The study adopts the new institutional economics (NIE) theory and the [19] theories of institutional development. Thus, we used a rather indirect proxy with the understanding that the occurrence of large scale foreign land acquisitions (LSFLAs) will reduce the domestic land availability for agricultural production, which may affect agricultural export and food security.
The model for the study is specified as follows:
� = ��� + �������� + �������� + ����ℎ���+ ������� + ���
Since institutions may be endogenous in nature and may cause the problem of endogeneity in
the model. Therefore, equation (1) can be rewritten as:
� = ��� + ∞���
∗ + �������� + ��������+ ����ℎ��� + ������� + ���
Our measures of institutional quality were grouped into three as indicated in Table 8. Indexes capturing different categories of the institutional variables were obtained which include Citizen Rights (crg) generated from strength of legal rights, participation and human rights, and property rights and rule based government. Also, political rights and participation index (prp) was generated from voice and accountability, and rule of law while effective governance index (gvn) was generated from regulatory quality and government effectiveness.
Also, additional variables were generated which shows the interactions between institutional qualities (crg, prp, gvn) and agricultural land as percentage of land area (aglnd). The interaction between the indicators of institutional qualities and agricultural land (crg_aglnd, prp_aglnd & gvn_aglnd) was generated with a view to capture the effect institutional quality on land productivity in Africa.
Table 8. Data sources and measurement
Variable Description Source measurement Agrexp Agricultural export Datamarket of Iceland (World
Bank) Constant US dollar
Agval Agricultural value added (% of GDP)
World development indicators Constant US dollar
Aglnd Agricultural land (% of arable land)
World development Indicators Constant US dollar
Exchr Exchange rate World development indicators Rates Citizen rights Slr Strength of legal rights Datamarket of Iceland (World
Bank) Number
Phr Property and human rights Datamarket of Iceland (World Bank)
Number
Prrbg Property rights and rule based government
Datamarket of Iceland (World Bank)
Number
Political rights and participation Va Voice and accountability World governance indicators Unit Rl Rule of law World governance indicators Unit Effective governance Rq Regulatory quality World governance Indicators Unit Ge Government effectiveness World governance indicators Unit
Source: Compiled by authors
Ogundipe et al.; AJAEES, 7(3): 1-17, 2015; Article no.AJAEES.13231
13
The models to be estimated with the inclusion of the interacting variables are as specified below:
� = ��� + ∞���∗ + �������� + �������� + ����ℎ��� + ������� + ����_������� + ���
� = ��� + ∞���∗ + �������� + �������� + ����ℎ��� + ������� + ����_������� + ���
� = ��� + ∞���∗ + �������� + �������� + ����ℎ��� + ������� +Θ���_������� + ���
Hypothetically, when the coefficient of crg_aglnd, prp_aglnd & gvn_aglnd is positive, it could be said that institutional quality will promote agricultural land capacity to enhance agricultural export and food security. In that case, better institutional quality would be deemed as complementing the agricultural land to boost agricultural export and food security. Alternatively, it implies that institutional quality is a poor accelerator of agricultural land in promoting export and food security. 3.2 Econometric Analysis The econometric results presented in this sub-section were mainly made to further buttress the descriptive stylized statistics. Thus, the results are presented in the Appendix while the major issues and implications are briefly summarised herein. The results in Table A1.1 were obtained using the indicators of institutions obtained from the data market of Iceland; with their categorized indexes interacted with agricultural land. There are basically three categories of institutions considered in the study; these include: citizen rights, political rights and participation and effective governance. As can be seen from the results, the test statistics for the evaluation of the model, namely: AR(1), AR(2), Sargan and Wald indicate that the model was efficient and the estimate can be reliable. Prior to this estimation based on system GMM, a preliminary analysis was done using the Ordinary Least Squares (OLS), Fixed Effects (FE) and Random Effects (RE). However, this study focused on GMM estimates with a view to handle the possible challenge of endogeneity. Examination of the explanatory variables shows that the lagged values of agricultural export with different indicators of institution and indexes had the expected positive signs. The past value of agricultural export was statistically significant at 5 percent in explaining the current agricultural export. The implication of this is that what happens to agricultural export in current year has significant influence in the subsequent year. Results from Table A1.1 where the performance
of agricultural export under the institutional indicators of citizen rights was observed show that all measures of institution were significant except strength of legal rights (slr). An index of slr, phr and prrg was generated in order to obtain a strong measure of citizen right (crg) which was found to be highly significant. Likewise the indicator of institutional framework (crg) becomes highly significant with expected signs when interacted with agricultural land. With regards to agricultural land, the value had expected signs in all results. It was statistically significant in all the equations but the coefficients became relatively larger with interaction variables. An implication of the results is that agriculture land is essential in promoting agricultural export but the extent to which it becomes very useful lies in the quality of institutional arrangement of a country. This finding becomes interesting when it is viewed from the lens that most LSFLDs investors usually target countries that do not have strong institutions. In the selected African countries context, the need for strengthening institutional framework cannot be over emphasised. Though there was no direct LSFLDs case study using agricultural land as proxy, one could find some empirical evidence to suggest stronger institutional framework as panacea to managing land resources from the standpoint of the issue of LSFLDs. Thus, institutions matter. Likewise, we present results as readily available in Tables A2.1 and A3.1 where institutional framework capturing political rights and participation, and effective governance respectively reveal similar trend as discussed above. In Table A2.1, though the indicator of voice and accountability was not significant and negative but the index (of va and rl) was significant and become highly significant when interacted with agricultural land (proxy for LSFLD). Also in Table A2.1, though the index of rq and ge was not significant but became highly significant when interacted with agricultural land. Similar to the results in Table A1.1, the coefficient of agricultural land becomes relatively larger with interaction variables. The findings

Ogundipe et al.; AJAEES, 7(3): 1-17, 2015; Article no.AJAEES.13231
14
from our estimation results have important implication for agricultural trade in developing Africa countries, most especially in the selected countries where LSFLDs were reported. As more arable agricultural land is acquired or grabbed by foreign investors or government, the volume of agricultural produce and exports dwindle which will ultimately widen the incidence of food insecurity, exacerbate poverty trap and culminates into foreign exchange losses. Other explanatory variables especially per capita income had the expected positive sign and significant level. Similar observation can be made for exchange rate. Agricultural value added was mainly significant for agricultural export, indicating that increase in the value of agricultural production will improve agricultural export.
4. CONCLUSION The study, which was basically motivated by large scale foreign land deals (LSFLDs) explored the possible implications of LSFLDs in Africa with respect to agricultural export and food security. This was done by providing some empirical evidences on the 16 selected African countries where there has been instances of LSFLDs. The study concludes that most of the selected countries experienced considerable decline in arable land per persons. Similarly, it was found that most of the selected countries are net food importers indicating threat to food security, which has worsened between 1998 and 2012. The study established that reduction in arable land ha per persons was accompanied by increased net food importation indicating possible association between arable land ha per person and net food import. It was also found that the indicator of institutional quality in the selected countries was rather weak, which was relatively lower than the SSA average. Thus, the study confirms that most investors of LSFLDs mainly target countries that do not have strong institutional quality. In the same manner, the empirical investigation from the study found the interaction variables (crg*aglng, prp*aglng and gvn*aglng) to exert a highly significant variation on agricultural export. This implies that availability of agricultural land has an important implication for agricultural export of the host country. In cases, where land are acquired to service the teeming population of home country of foreign investors; the host country is left vulnerable to incidence of food
insecurity, as majority of rural dwellers in Africa rely on subsistence farming for livelihood. In the same manner, the host country losses foreign exchange accruable from agricultural export, farmer’s income falls, food inflations rises, and the threshold of poverty is enhanced. The study concludes by recommending the need for strengthening institutional framework especially the promotion of reliable legal and procedural mechanism in order to protect local rights and take into cognisance the aspirations of citizens. It also calls for assessment of social and environmental impacts as well as transparency in decision-making whenever there are transactions involving land deals. Thus, the study calls for case study to further provide empirical evidence on impact assessment on samples of land deals in Africa. This will help to examine the negotiation process and possible impact such deals will have on the immediate host community.
COMPETING INTERESTS Authors have declared that no competing interests exist.
REFERENCES 1. Osabuohein S. Evans, Ogundipe A.
Adeyemi, Efobi R. Uchenna. The Land Rush in Africa: Implications and Institutional Panacea. In: Okun, EE. and Asubonteng, K.O (ed). Harnessing land and water resources for improved food security and ecosystem services in Africa. 2013;92-106.
2. Modie A. AFRICA: Universities must halt land grab investments. University World News; 2011. Available:<http://www.universityworldnews.com/article.php?story=2011062512292>
3. International Food Policy Research Institute. IFPRI IFPRI Policy Brief. 2009; 13.
4. Braun and Meinzen-Dick. Land Grabbing by Foreign Investors in Developing Countries: A risks and opportunities. IFPRI Policy Brief. 2009;13.
5. Saturnino M. Borras Jr, Ruth, Hall, Ian, Scoones, White, Ben and Wolford, Wendy. Towards a Better Understanding of Global Land Grabbing: An Editorial Introduction. Journal of Peasant Studies. 2011;38:2: 209 -216.

Ogundipe et al.; AJAEES, 7(3): 1-17, 2015; Article no.AJAEES.13231
15
6. Nidhi Tandon. New agribusiness investments mean wholesale sell-out for women farmers. Gender & Development. 2010;18(3).
7. Annelies Zoomers. Globalization and the Foreignisation of space: Seven processes driving the current land grab. Journal of Peasant Studies. 2010;37:2:429-447.
8. Cotula L, Vermeulen S, Leonard R, Keeley J. Land grab or development opportunity? Agricultural Investment and International Land Deals in Africa, London/Rome: IIED/FAO/IFAD; 2009.
9. Oxfam International. Growing a better future food justice in a resource-constrained world. Oxford: Oxfam GB for Oxfam International; 2011.
10. Deininger K, Byerlee D, Lindsay J, Norton A, Selod H, Stickler M. Rising Global Interest in Farmland. Washington DC The World Bank; 2011.
11. Anseeuw W, Wily AL, Cotula L, Taylor M. Land rights and the rush for land. Findings of the global commercial pressure on land research project. International Land Coalition; 2012.
12. Land Portal. Commercial Pressures on Land; 2011. Available:<http://landportal.info/topic/commercial-pressures-land>
13. Jacques B. Massive, irresponsible lease of African farm land threatens Africa; 2010. Available: http://www.afjn.org/focus-
campaigns/other/other-continental-issues/161-agriculture/1100-massive-irresponsible-lease-of-african-farm-land-threatens-africa.html
14. Aabo E, Kring T. The political economy of large-scale agricultural land acquisitions: Implications for food security and livelihoods/employment creation in rural mozambique. United Nations Development Programme Working Paper. 2012;4.
15. Cotula Lorenzo. The international political economy of global land rush: A critical appraisal of trends, scale, geography and drivers. Journal of Peasant Studies. 2012; 39(3).
16. Acemoglu D, Robinson J. The role of institutions. Commission on Growth and Development Working Paper. 2008;10.
17. Meon P, Sekkat K. Institutional Quality and Trade: Which Institutions? Which Trade, Economic Inquiry. 2008;46(2)227-240.
18. Osabuohien ES. Analysis of international trade performance in selected SSA countries: The impact of institutional framework. Unpublished Ph.D Thesis Submitted to Department of Economics and Development Studies, Covenant University, Ota; 2011.
19. LaPorta R, Lopez-de-Silanes F, Shleifer A, Vishny R. The quality of government. The Journal of Law, Economics and Organization. 1999;15(1):222-279.

Ogundipe et al.; AJAEES, 7(3): 1-17, 2015; Article no.AJAEES.13231
16
APPENDIX
Table A1.1. Agricultural export (citizen rights) Variables (A) (B) (C)
lagrexp lagrexp lagrexp L. lagrexp 0.845*** 0.755*** 0.729*** (0.0371) (0.0539) (0.0675) Agval 0.0113** 0.00799* 0.00805* (0.00498) (0.00471) (0.00467) Aglnd -0.00605*** -0.00750*** -0.216*** (0.00199) (0.00198) (0.0523) Lgdpc 0.328*** 0.208* 0.228** (0.117) (0.111) (0.111) Exchr -5.38e-05 -0.000161*** -0.000125** (4.64e-05) (5.80e-05) (5.51e-05) Slr 0.0187 (0.0267) Phr 0.00718** (0.00327) prrbg 0.208** (0.0855) crg 0.456*** (0.101) crg_aglnd 0.0110*** (0.00266) Constant 0.129 -4.882*** 4.030*** (0.887) (1.294) (1.550) Observations 212 212 212 Number of id 16 16 16
Source: Computed using stata 11.0, Standard errors in parentheses, *** p<0.01, ** p<0.05, * p<0.1
Table A2.1. Agricultural export (political rights and participation)
Variables (E) (F) (G)
lagrexp lagrexp Lagrexp L. lagrexp 0.871*** 0.890*** 0.879*** (0.0456) (0.0492) (0.0435) agval 0.0144* 0.0175** 0.0203* (0.00774) (0.00833) (0.0115) aglnd -0.000484 0.000499 -0.0813*** (0.00102) (0.000917) (0.0212) lgdpc 0.275 0.354* 0.459* (0.194) (0.210) (0.272) exchr -3.72e-05 -1.51e-05 -2.07e-05 (5.31e-05) (5.49e-05) (4.83e-05) va -0.0145 (0.0656) rl 0.236** (0.117) prp 0.117* (0.0606) prp_aglnd 0.00423*** (0.00112) Constant 0.753 -2.665* -0.919 (2.129) (1.384) (2.531) Observations 167 167 167 Number of id 16 16 16
Source: Computed using stata 11.0, Standard errors in parentheses, *** p<0.01, ** p<0.05, * p<0.1

Ogundipe et al.; AJAEES, 7(3): 1-17, 2015; Article no.AJAEES.13231
17
Table A3.1. Agricultural export (effective governance)
Variables (H) (I) (J) lagrexp lagrexp lagrexp
L. lagrexp 0.869*** 0.902*** 0.902*** (0.0474) (0.0518) (0.0473) agval 0.0171** 0.0193** 0.0255** (0.00724) (0.00840) (0.0110) aglnd -0.00223 -0.00144 -0.0717*** (0.00168) (0.00188) (0.0164) lgdpc 0.284 0.369 0.551** (0.196) (0.231) (0.260) exchr -2.90e-05 1.28e-05 3.39e-05 (5.00e-05) (5.08e-05) (5.29e-05) rq 0.192** (0.0846) ge 0.174 (0.153) gvn 0.113 (0.0708) gvn_aglnd 0.00363*** (0.000822) Constant 0.811 -2.926** -2.063 (2.250) (1.397) (2.600) Observations 167 167 167 Number of id 16 16 16
Source: Computed using stata 11.0, Standard errors in parentheses, *** p<0.01, ** p<0.05, * p<0.1
_________________________________________________________________________________ © 2015 Ogundipe et al.; This is an Open Access article distributed under the terms of the Creative Commons Attribution License (http://creativecommons.org/licenses/by/4.0), which permits unrestricted use, distribution, and reproduction in any medium, provided the original work is properly cited.
Peer-review history: The peer review history for this paper can be accessed here:
http://sciencedomain.org/review-history/10354