Embed Size (px)
Citation preview
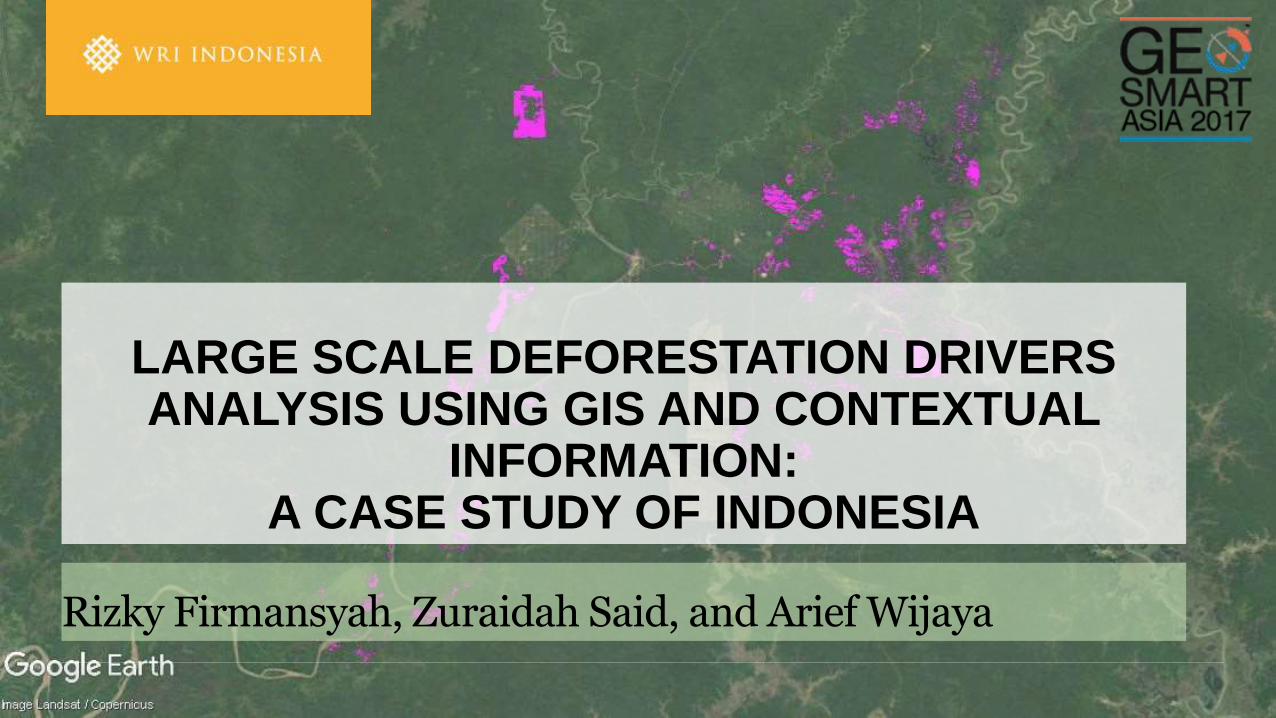
LARGE SCALE DEFORESTATION DRIVERS ANALYSIS USING GIS AND CONTEXTUAL
INFORMATION: A CASE STUDY OF INDONESIA
Rizky Firmansyah, Zuraidah Said, and Arief Wijaya
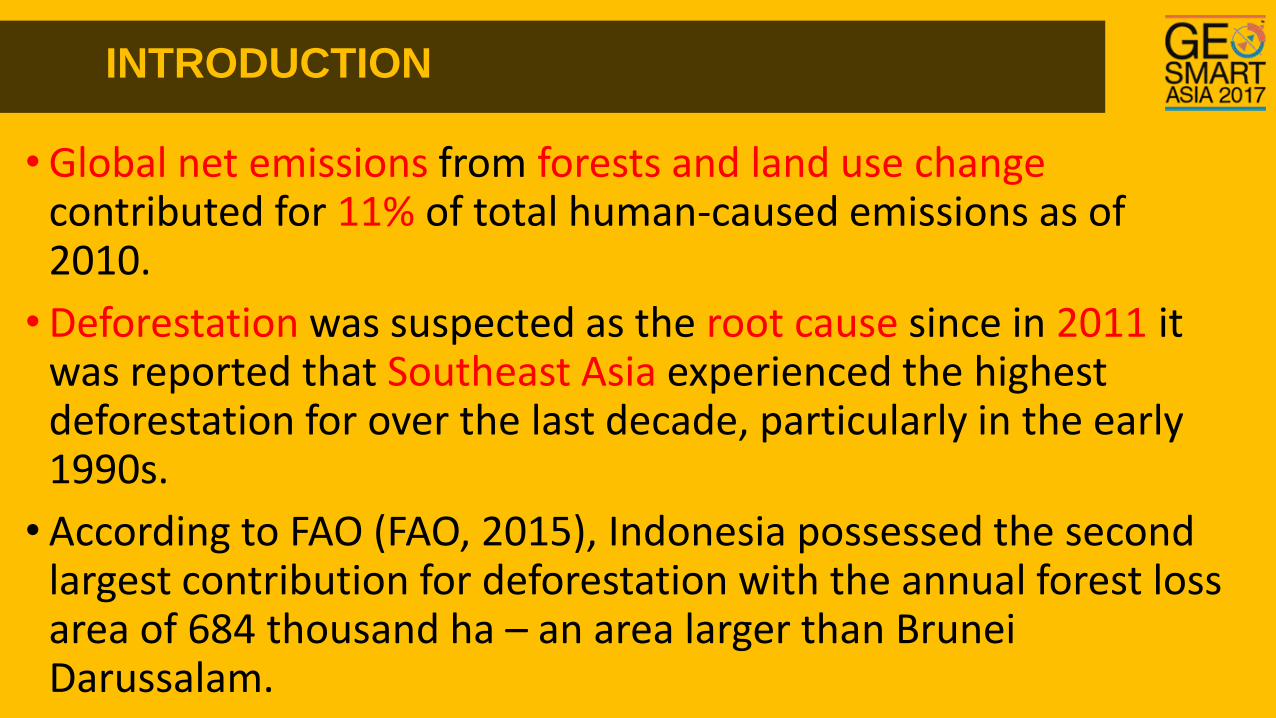
INTRODUCTION
• Global net emissions from forests and land use change contributed for 11% of total human-caused emissions as of 2010.
• Deforestation was suspected as the root cause since in 2011 it was reported that Southeast Asia experienced the highest deforestation for over the last decade, particularly in the early 1990s.
• According to FAO (FAO, 2015), Indonesia possessed the second largest contribution for deforestation with the annual forest loss area of 684 thousand ha – an area larger than Brunei Darussalam.
INTRODUCTION
• In 2010, the Indonesia-Norway REDD+ Partnership was established through an agreement between governments of the two countries. The aim was to support Indonesia’s efforts to reduce emissions from deforestation and degradation (REDD+) of forests and peatland.
• Indonesia has pledge to reduce emissions to 29 – 41% by 2030. Thus, timing information on forest cover changes and monitoring efforts should be taken seriously and reported at national forest reference emission levels/forest reference levels (FREL/FRL).
OBJECTIVES
1. How many forest was lost in Indonesia during the period of 2000 – 2015?
2. What are the main drivers of that loss?
3. Effectiveness of moratorium policy released by Ministry of Forestry in 2011 until 2015.
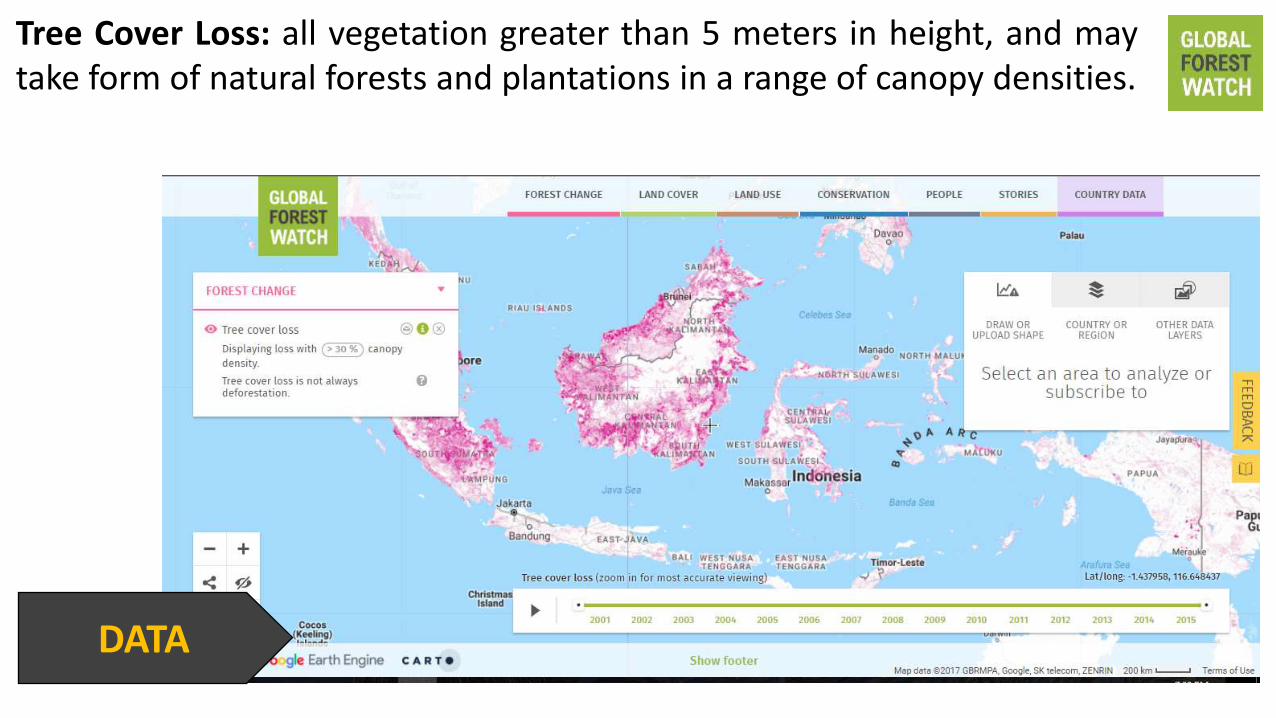
Tree Cover Loss: all vegetation greater than 5 meters in height, and may take form of natural forests and plantations in a range of canopy densities.
DATA
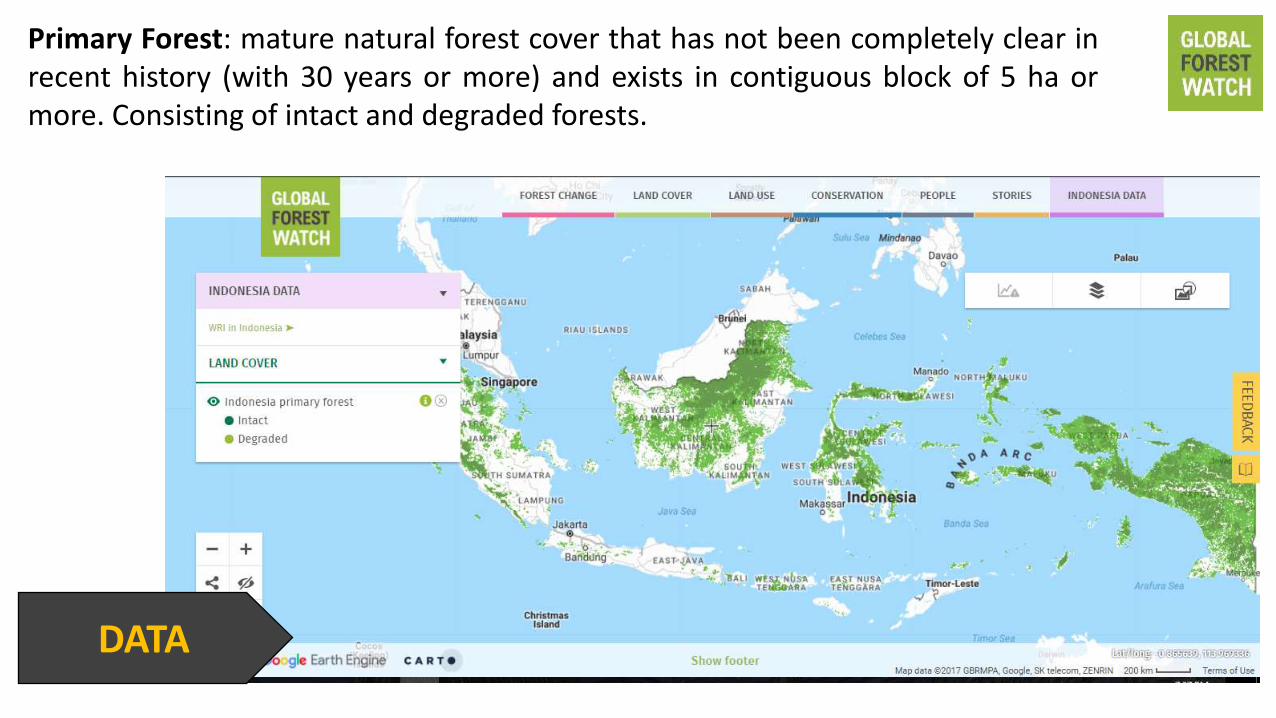
Primary Forest: mature natural forest cover that has not been completely clear in recent history (with 30 years or more) and exists in contiguous block of 5 ha or more. Consisting of intact and degraded forests.
DATA
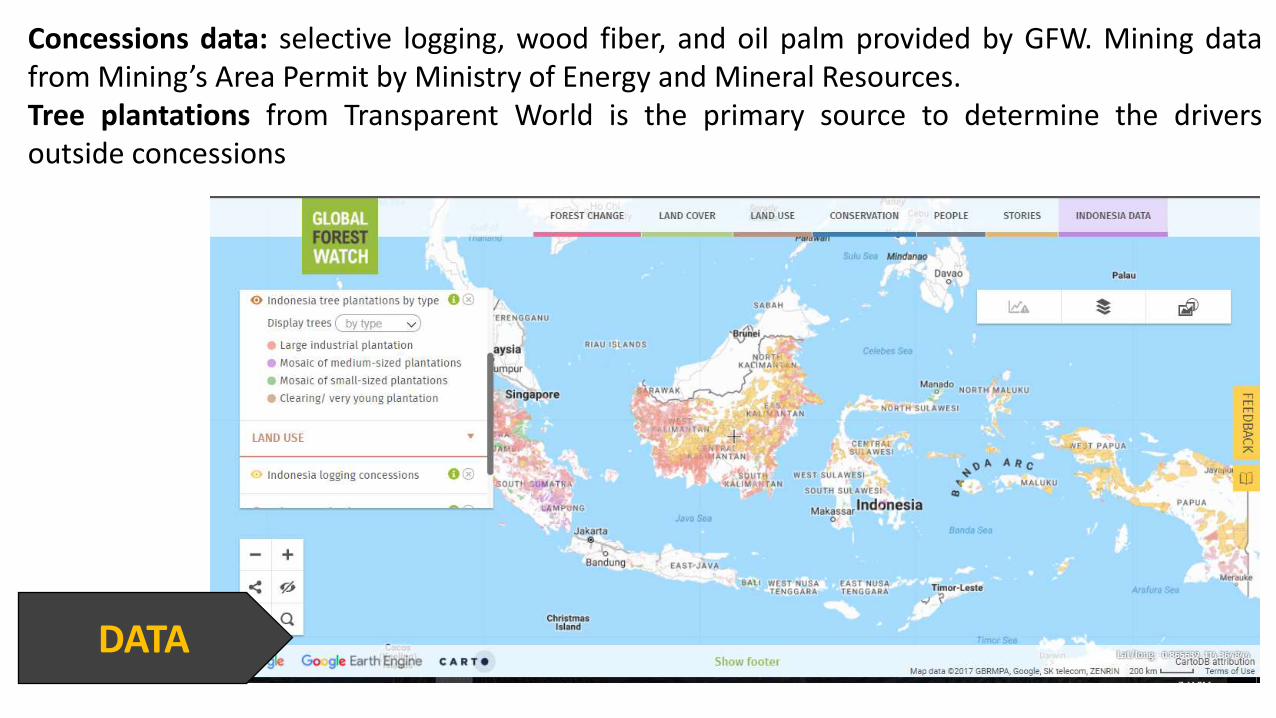
Concessions data: selective logging, wood fiber, and oil palm provided by GFW. Mining data from Mining’s Area Permit by Ministry of Energy and Mineral Resources. Tree plantations from Transparent World is the primary source to determine the drivers outside concessions
DATA
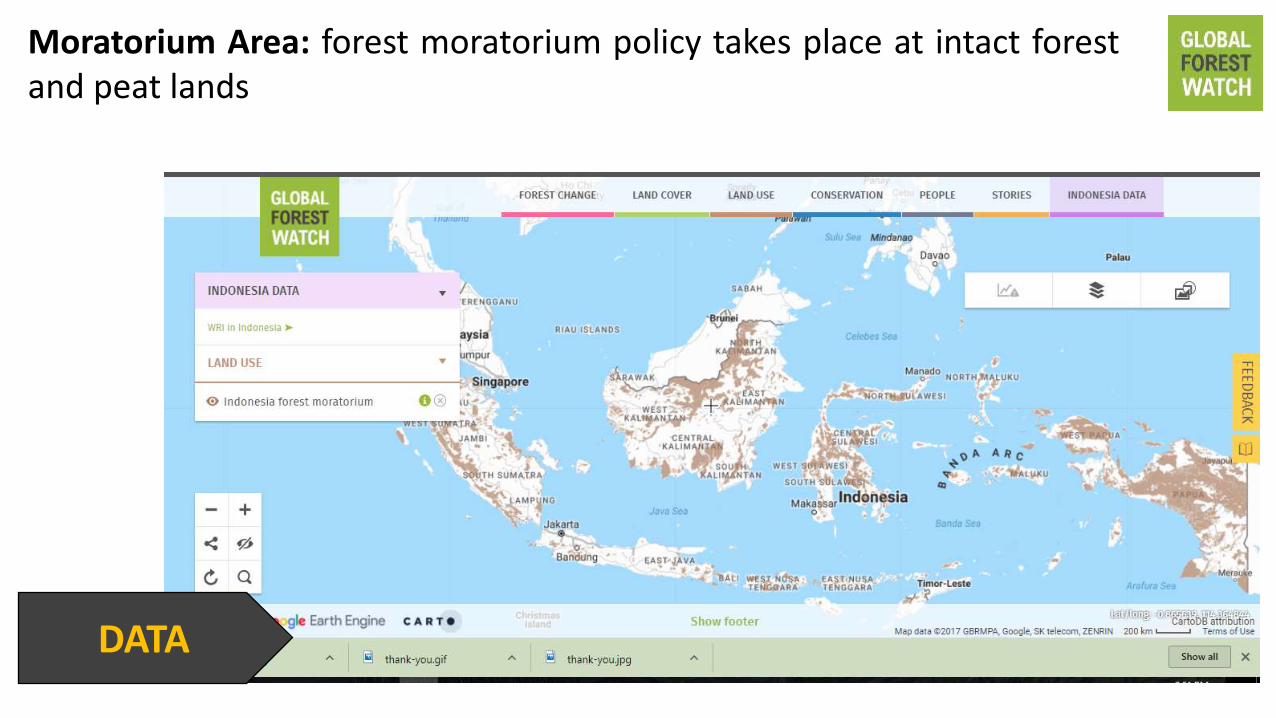
Moratorium Area: forest moratorium policy takes place at intact forest and peat lands
DATA
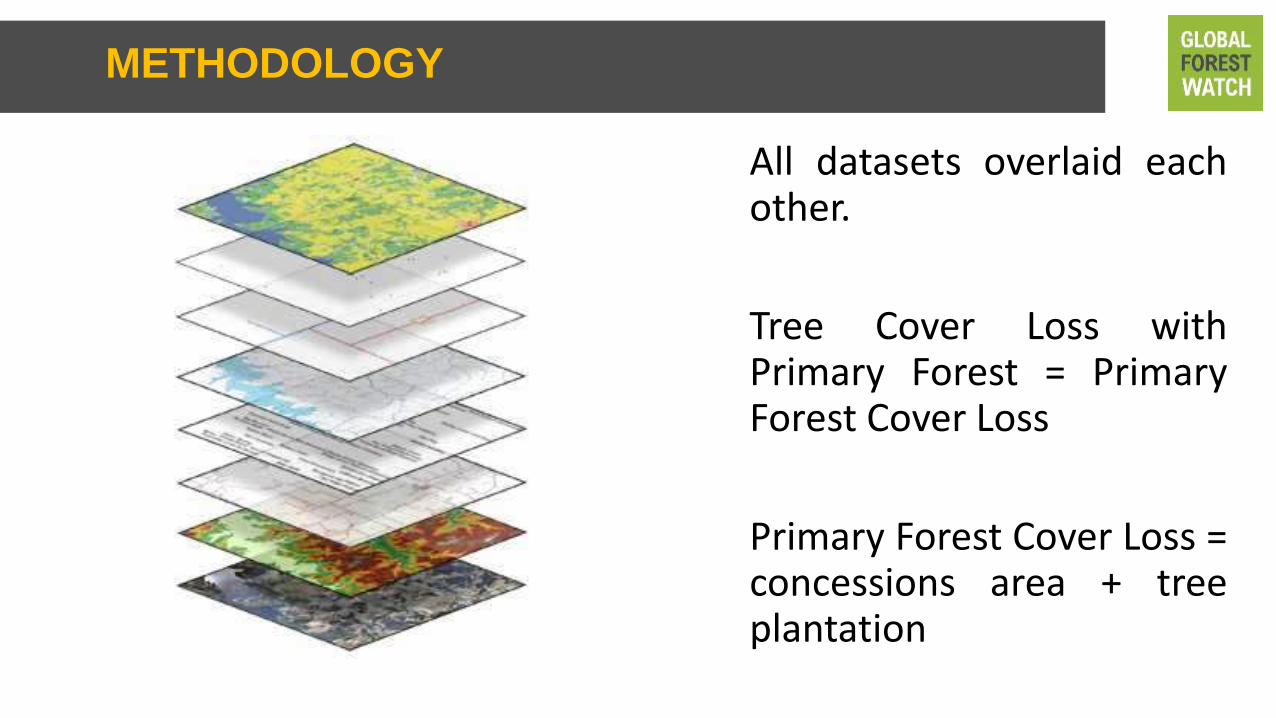
All datasets overlaid each other.
Tree Cover Loss with Primary Forest = Primary Forest Cover Loss
Primary Forest Cover Loss = concessions area + tree plantation
METHODOLOGY
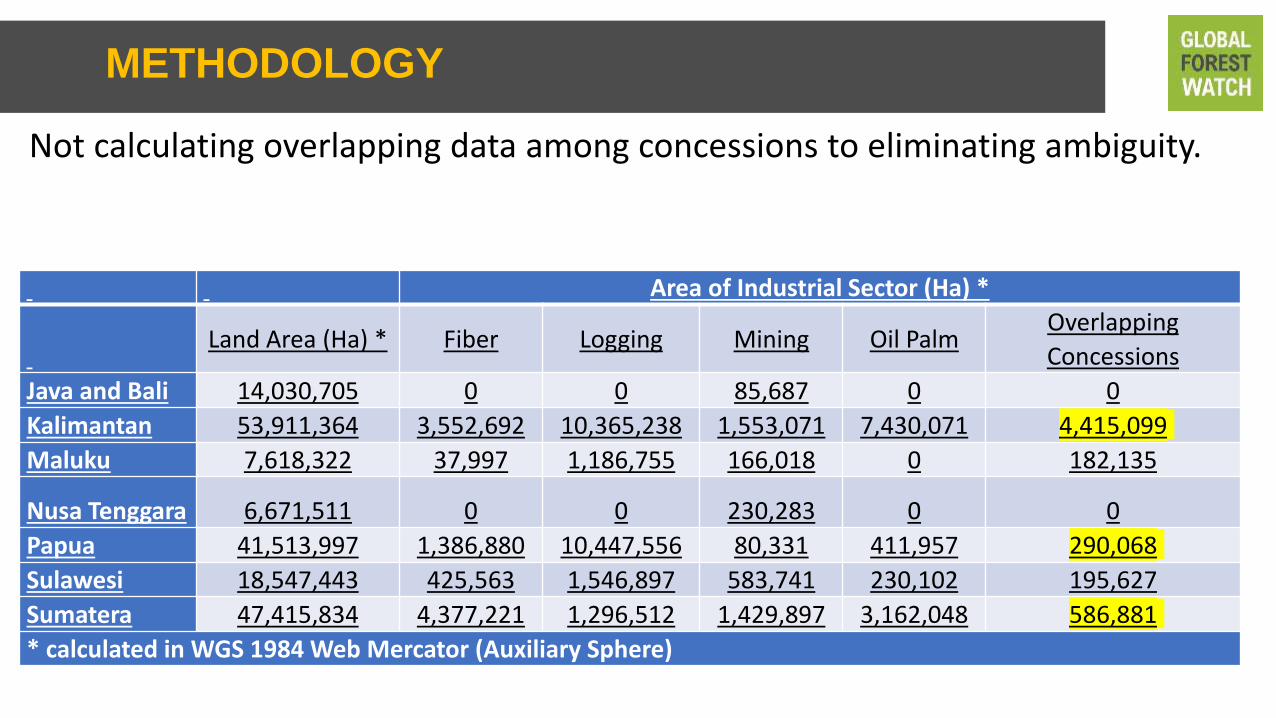
Not calculating overlapping data among concessions to eliminating ambiguity.
METHODOLOGY
Area of Industrial Sector (Ha) *
Land Area (Ha) * Fiber Logging Mining Oil Palm
Overlapping
Concessions
Java and Bali 14,030,705 0 0 85,687 0 0
Kalimantan 53,911,364 3,552,692 10,365,238 1,553,071 7,430,071 4,415,099
Maluku 7,618,322 37,997 1,186,755 166,018 0 182,135
Nusa Tenggara 6,671,511 0 0 230,283 0 0
Papua 41,513,997 1,386,880 10,447,556 80,331 411,957 290,068
Sulawesi 18,547,443 425,563 1,546,897 583,741 230,102 195,627
Sumatera 47,415,834 4,377,221 1,296,512 1,429,897 3,162,048 586,881
* calculated in WGS 1984 Web Mercator (Auxiliary Sphere)
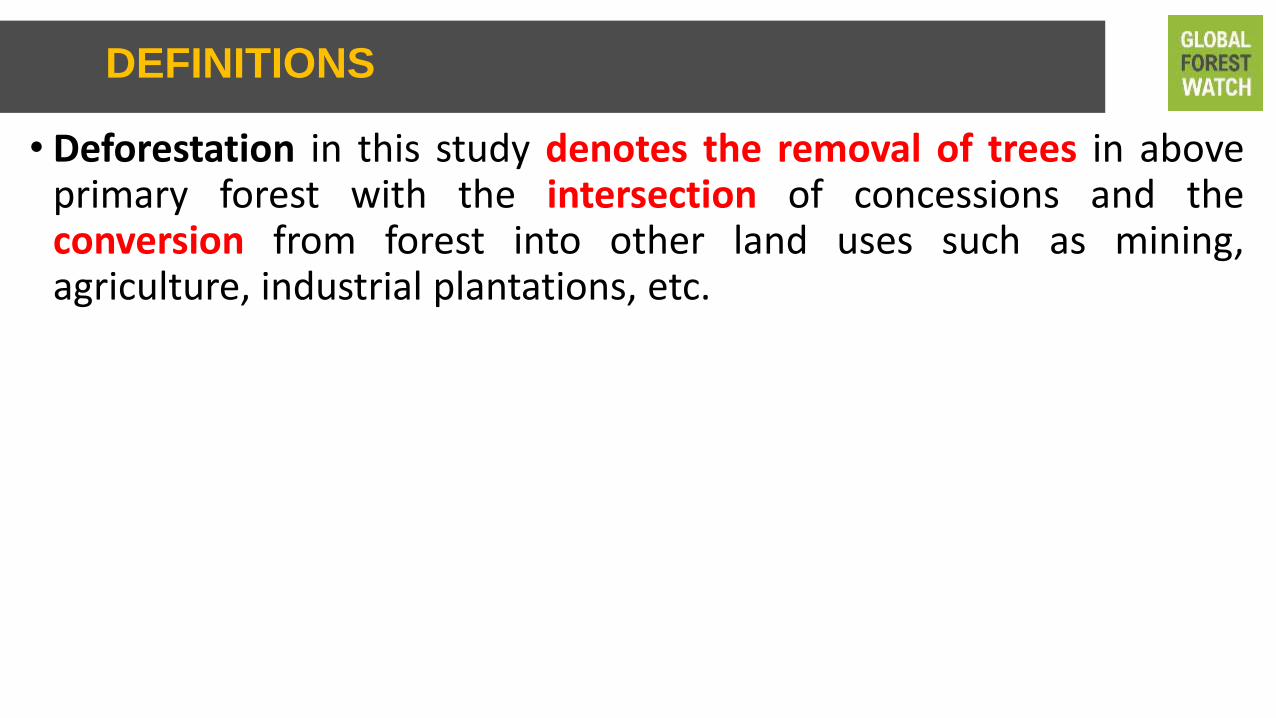
• Deforestation in this study denotes the removal of trees in above primary forest with the intersection of concessions and the conversion from forest into other land uses such as mining, agriculture, industrial plantations, etc.
DEFINITIONS
0.0
0.1
0.2
0.3
0.4
0.5
0.6
0.7
0.8
0.9
1.0
00-01 01-02 02-03 03-04 04-05 05-06 06-07 07-08 08-09 09-10 10-11 11-12 12-13 13-14 14-15
Fore
st C
ove
r Lo
ss (
MH
a)
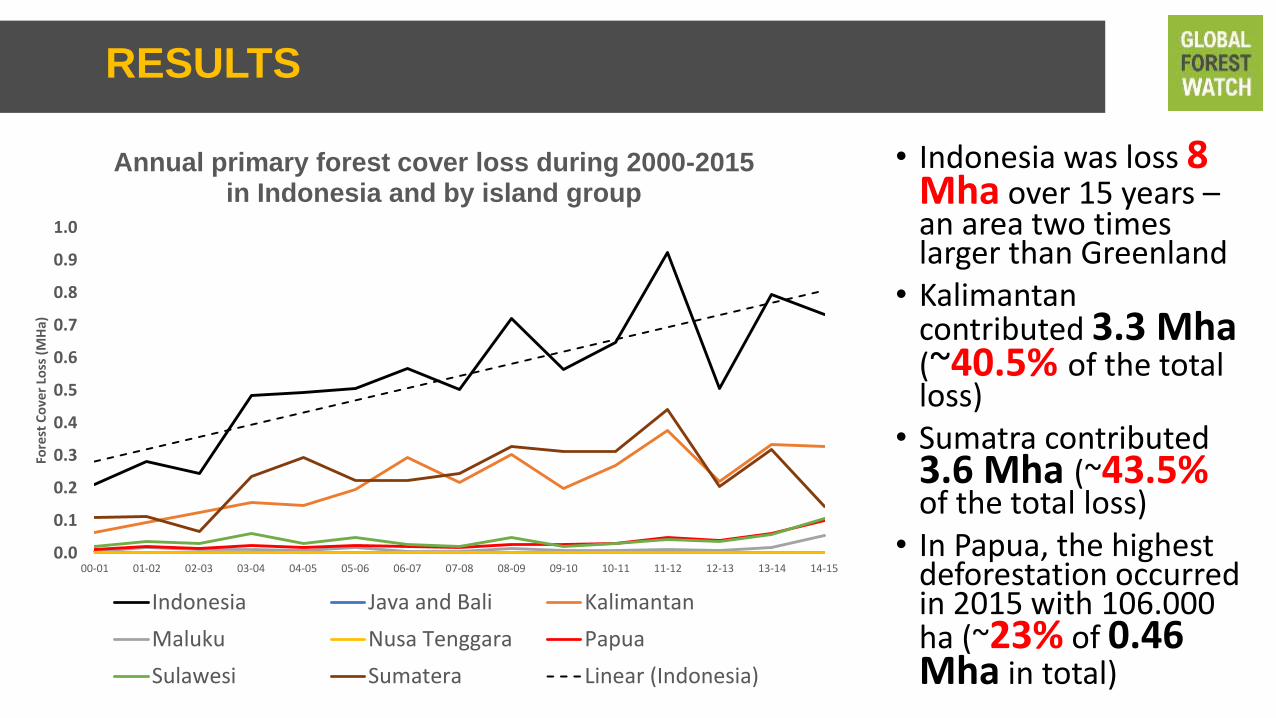
Annual primary forest cover loss during 2000-2015 in Indonesia and by island group
Indonesia Java and Bali Kalimantan
Maluku Nusa Tenggara Papua
Sulawesi Sumatera Linear (Indonesia)
• Indonesia was loss 8 Mha over 15 years – an area two times larger than Greenland
• Kalimantan contributed 3.3 Mha (~40.5% of the total loss)
• Sumatra contributed 3.6 Mha (~43.5% of the total loss)
• In Papua, the highest deforestation occurred in 2015 with 106.000 ha (~23% of 0.46 Mha in total)
RESULTS
0
1,00,000
2,00,000
3,00,000
4,00,000
5,00,000
00-01 01-02 02-03 03-04 04-05 05-06 06-07 07-08 08-09 09-10 10-11 11-12 12-13 13-14 14-15
An
nu
al D
efo
rest
atio
n R
ates
(H
a)
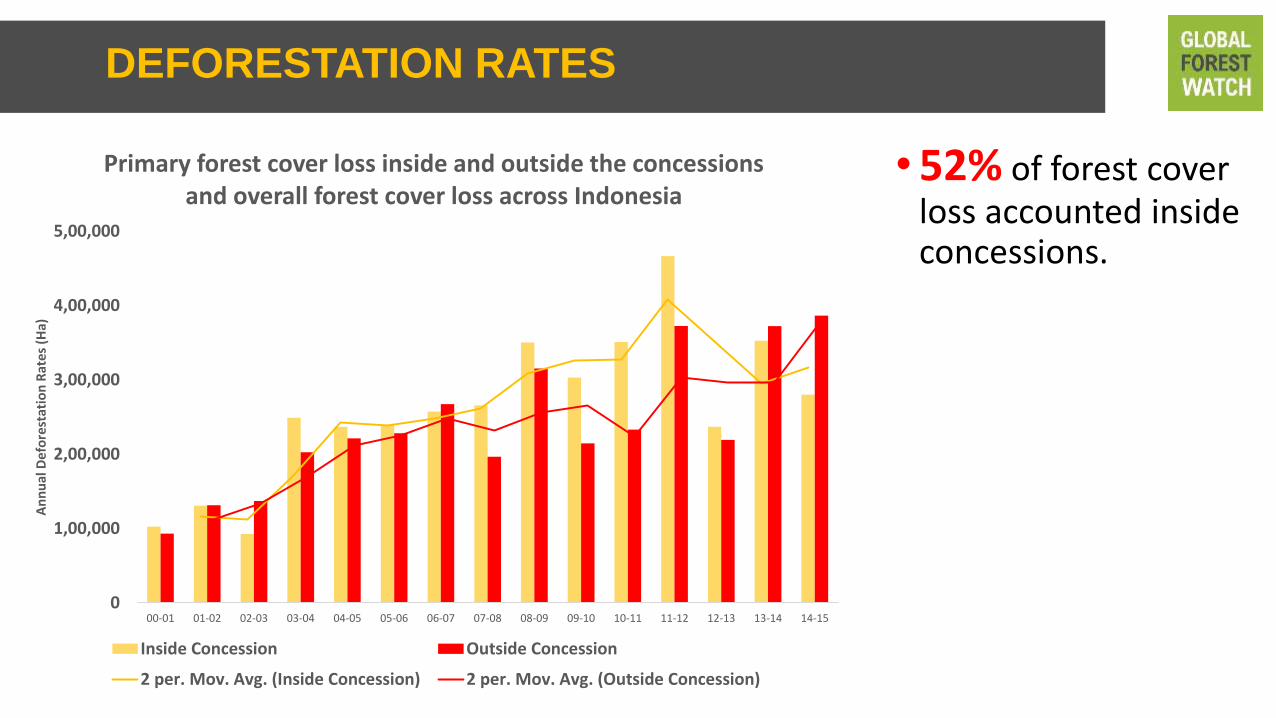
Primary forest cover loss inside and outside the concessions and overall forest cover loss across Indonesia
Inside Concession Outside Concession
2 per. Mov. Avg. (Inside Concession) 2 per. Mov. Avg. (Outside Concession)
•52% of forest cover loss accounted inside concessions.
DEFORESTATION RATES
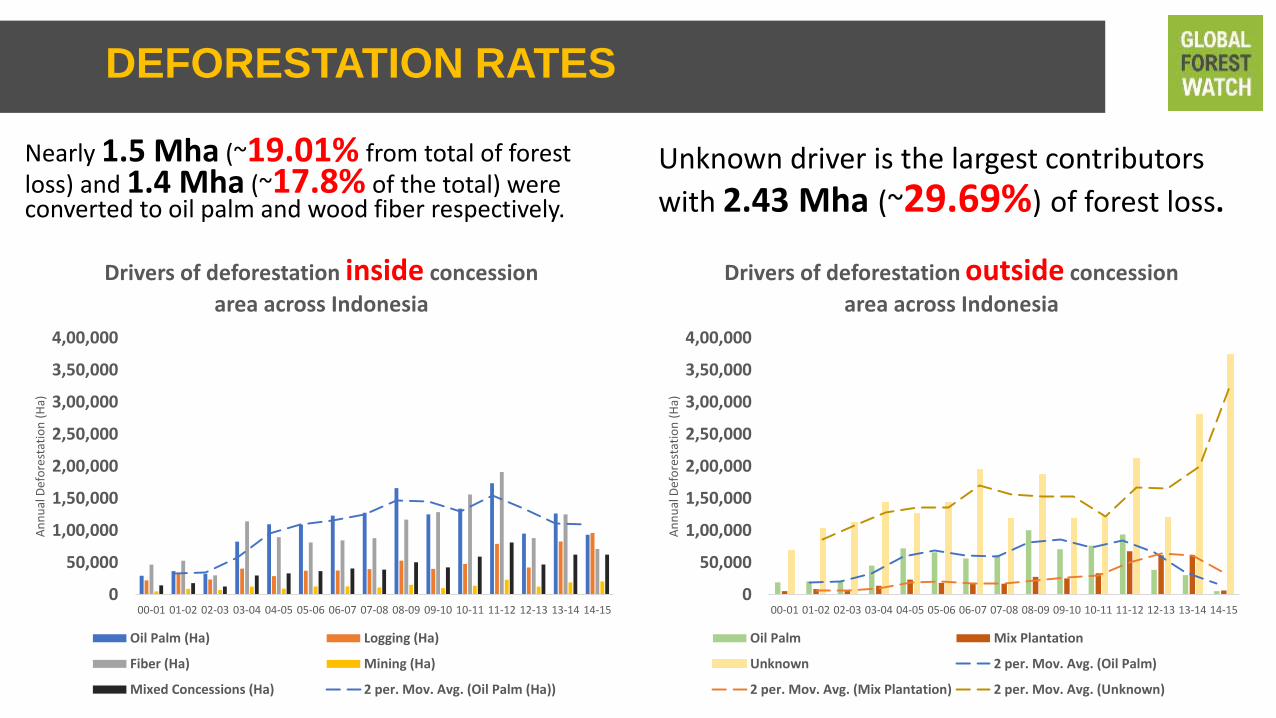
Nearly 1.5 Mha (~19.01% from total of forest loss) and 1.4 Mha (~17.8% of the total) were converted to oil palm and wood fiber respectively.
0
50,000
1,00,000
1,50,000
2,00,000
2,50,000
3,00,000
3,50,000
4,00,000
00-01 01-02 02-03 03-04 04-05 05-06 06-07 07-08 08-09 09-10 10-11 11-12 12-13 13-14 14-15
An
nu
al D
efo
rest
atio
n (
Ha)
Drivers of deforestation inside concession
area across Indonesia
Oil Palm (Ha) Logging (Ha)
Fiber (Ha) Mining (Ha)
Mixed Concessions (Ha) 2 per. Mov. Avg. (Oil Palm (Ha))
Unknown driver is the largest contributors
with 2.43 Mha (~29.69%) of forest loss.
0
50,000
1,00,000
1,50,000
2,00,000
2,50,000
3,00,000
3,50,000
4,00,000
00-01 01-02 02-03 03-04 04-05 05-06 06-07 07-08 08-09 09-10 10-11 11-12 12-13 13-14 14-15
An
nu
al D
efo
rest
atio
n (
Ha)
Drivers of deforestation outside concession
area across Indonesia
Oil Palm Mix Plantation
Unknown 2 per. Mov. Avg. (Oil Palm)
2 per. Mov. Avg. (Mix Plantation) 2 per. Mov. Avg. (Unknown)
DEFORESTATION RATES
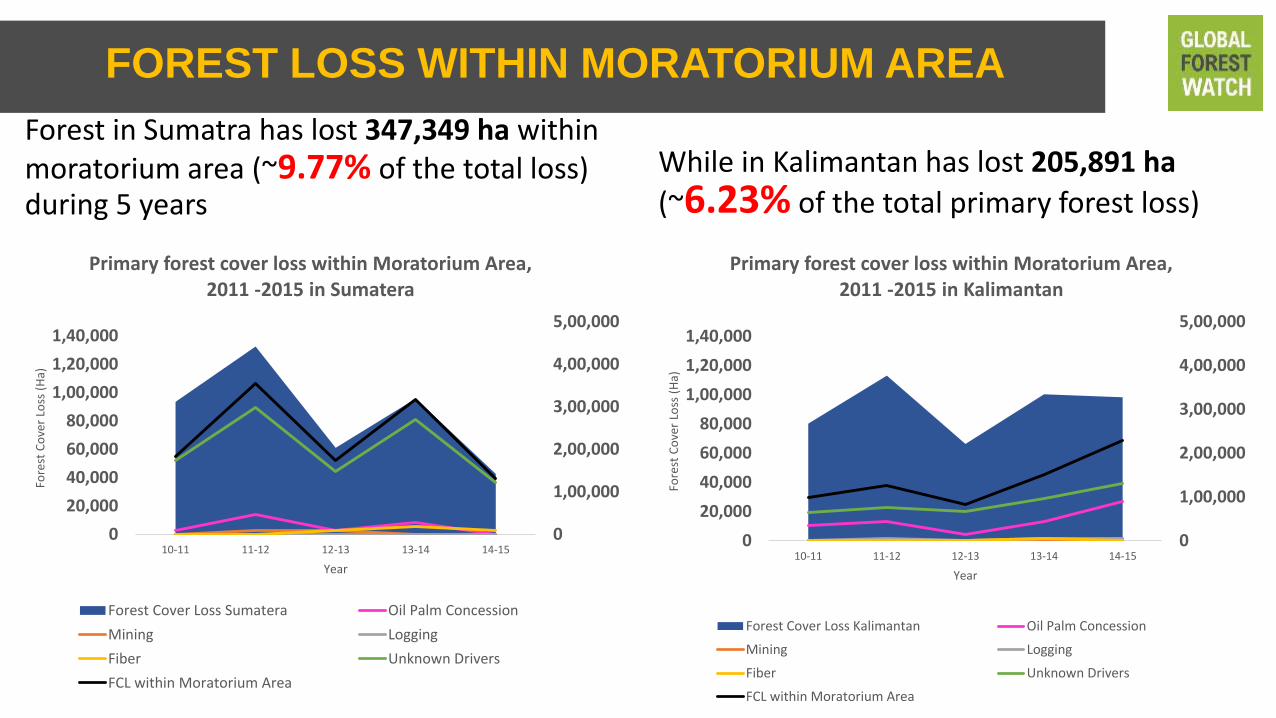
Forest in Sumatra has lost 347,349 ha within moratorium area (~9.77% of the total loss) during 5 years
0
1,00,000
2,00,000
3,00,000
4,00,000
5,00,000
0
20,000
40,000
60,000
80,000
1,00,000
1,20,000
1,40,000
10-11 11-12 12-13 13-14 14-15
Fore
st C
ove
r Lo
ss (
Ha)
Year
Primary forest cover loss within Moratorium Area, 2011 -2015 in Sumatera
Forest Cover Loss Sumatera Oil Palm Concession
Mining Logging
Fiber Unknown Drivers
FCL within Moratorium Area
While in Kalimantan has lost 205,891 ha (~6.23% of the total primary forest loss)
0
1,00,000
2,00,000
3,00,000
4,00,000
5,00,000
0
20,000
40,000
60,000
80,000
1,00,000
1,20,000
1,40,000
10-11 11-12 12-13 13-14 14-15
Fore
st C
ove
r Lo
ss (
Ha)
Year
Primary forest cover loss within Moratorium Area, 2011 -2015 in Kalimantan
Forest Cover Loss Kalimantan Oil Palm Concession
Mining Logging
Fiber Unknown Drivers
FCL within Moratorium Area
FOREST LOSS WITHIN MORATORIUM AREA
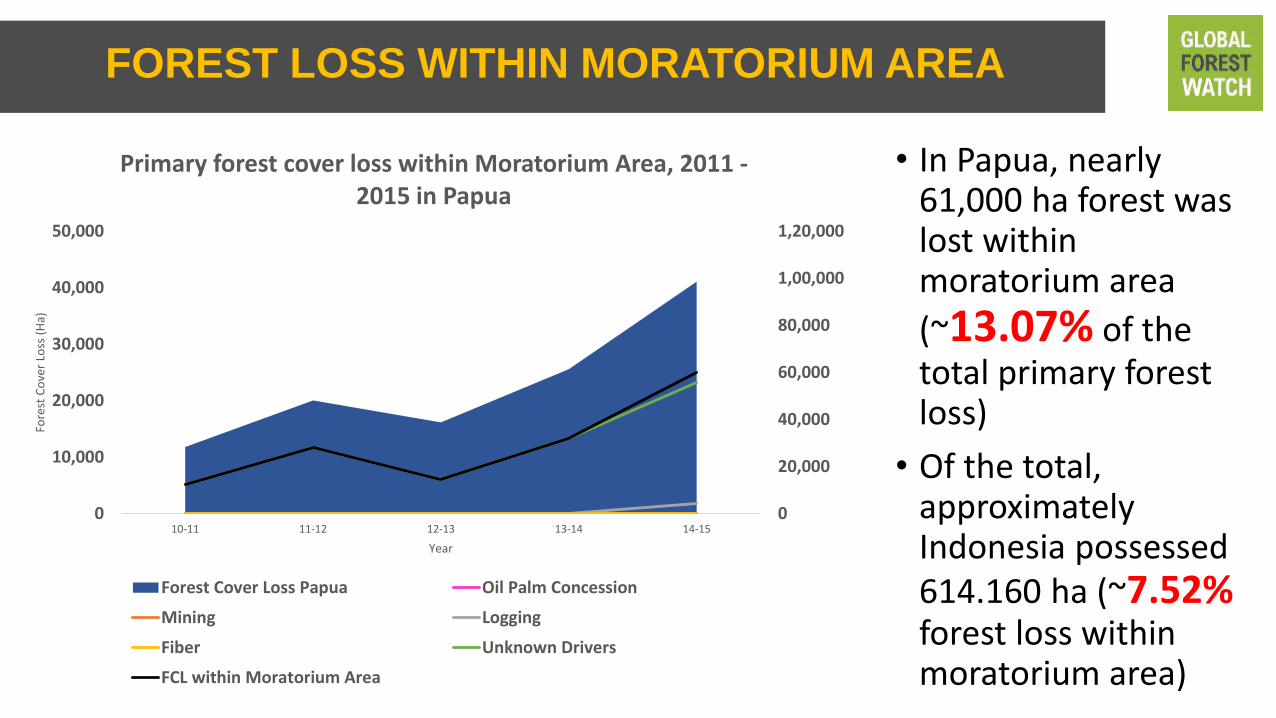
0
20,000
40,000
60,000
80,000
1,00,000
1,20,000
0
10,000
20,000
30,000
40,000
50,000
10-11 11-12 12-13 13-14 14-15
Fore
st C
ove
r Lo
ss (
Ha)
Year
Primary forest cover loss within Moratorium Area, 2011 -2015 in Papua
Forest Cover Loss Papua Oil Palm Concession
Mining Logging
Fiber Unknown Drivers
FCL within Moratorium Area
• In Papua, nearly 61,000 ha forest was lost within moratorium area
(~13.07% of the total primary forest loss)
• Of the total, approximately Indonesia possessed 614.160 ha (~7.52% forest loss within moratorium area)
FOREST LOSS WITHIN MORATORIUM AREA
0
100000
200000
300000
400000
500000
600000
700000
800000
900000
1000000
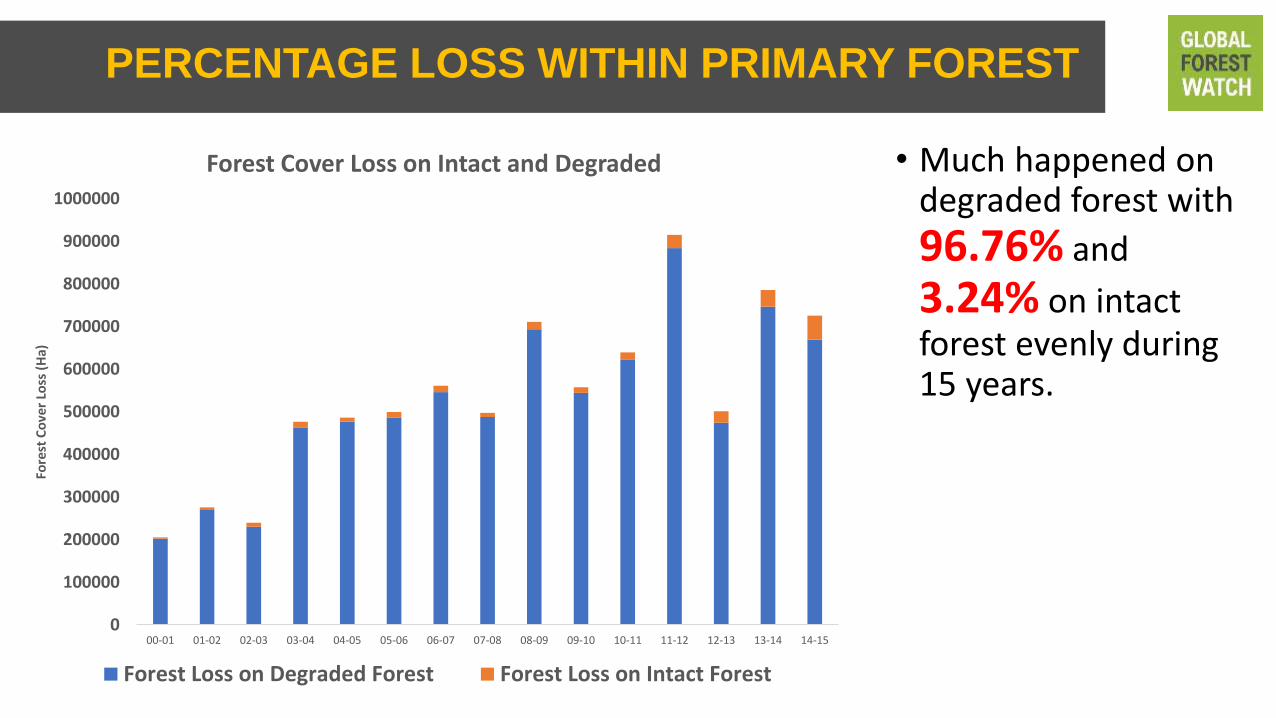
00-01 01-02 02-03 03-04 04-05 05-06 06-07 07-08 08-09 09-10 10-11 11-12 12-13 13-14 14-15
Fore
st C
ove
r Lo
ss (
Ha)
Forest Cover Loss on Intact and Degraded
Forest Loss on Degraded Forest Forest Loss on Intact Forest
• Much happened on degraded forest with
96.76% and
3.24% on intact forest evenly during 15 years.
PERCENTAGE LOSS WITHIN PRIMARY FOREST
• Indonesia lost almost 8.2 Mha of forest cover loss during fifteen years from 2000 – 2015.
Kalimantan and Sumatra were the largest contributors, accounting with 40.5% (~3.3 Mha) and
43.5% (~3.6 Mha) respectively. The major drivers of the forest cover loss during this period were: oil
palm industrial (~1.56 Mha), wood fiber (~1.46 Mha), selective logging (~0.7 Mha), oil palm outside
concession (~0.77 Mha), mixed concession (~0.63 Mha), mix plantation (~0.39 Mha) and mining
(~0.19 Mha), unknown (~2.43 Mha) driver that need to be studied further.
• It is highly important to have greater transparency and more precise delineation of concessions
boundaries, considering the fact that unknown driver has the largest contributors to forest loss. The
Indonesian government has already developed “One Map” initiative to create a single map of
Indonesia for addressing this issue. This map is not only crucial for environmental purposes, but it
could lessen the social conflict with local communities.
SUMMARY OF FINDINGS
• Moratorium Policy is not working effectively since Papua (13.07% of total forest loss), Kalimantan (6.23% of total forest loss), and Sumatera (9.77% of total forest loss) were still experienced deforestation. This policy will be effective to prevent deforestation if the moratorium area is not only taken at primary dry forest and peatland, but also covered in secondary forest.
SUMMARY OF FINDINGS

Thank you