Embed Size (px)
Citation preview
Large-scale chemical dissection of mitochondrialfunctionBridget K Wagner1,5, Toshimori Kitami1,2,5, Tamara J Gilbert1, David Peck1, Arvind Ramanathan1,Stuart L Schreiber1, Todd R Golub1,3 & Vamsi K Mootha1,2,4
Mitochondrial oxidative phosphorylation (OXPHOS) is under the control of both mitochondrial (mtDNA) and nuclear genomes and
is central to energy homeostasis. To investigate how its function and regulation are integrated within cells, we systematically
combined four cell-based assays of OXPHOS physiology with multiplexed measurements of nuclear and mtDNA gene expression
across 2,490 small-molecule perturbations in cultured muscle. Mining the resulting compendium revealed, first, that protein
synthesis inhibitors can decouple coordination of nuclear and mtDNA transcription; second, that a subset of HMG-CoA reductase
inhibitors, combined with propranolol, can cause mitochondrial toxicity, yielding potential clues about the etiology of statin
myopathy; and, third, that structurally diverse microtubule inhibitors stimulate OXPHOS transcription while suppressing
reactive oxygen species, via a transcriptional mechanism involving PGC-1a and ERRa, and thus may be useful in treating
age-associated degenerative disorders. Our screening compendium can be used as a discovery tool both for understanding
mitochondrial biology and toxicity and for identifying novel therapeutics.
Oxidative phosphorylation (OXPHOS) is the core mitochondrialpathway responsible for ATP synthesis. The OXPHOS system consistsof B90 protein components, including all 13 of the proteins that areencoded by the mitochondrial genome (mtDNA)1. On time scales ofseconds to minutes, mitochondrial ATP synthesis is regulated primar-ily by substrate availability and allosteric control2. During growth anddevelopment, however, transcription and translation of OXPHOSgenes are carefully orchestrated between the nuclear and mitochon-drial genomes to achieve sustained, metabolic adaptation. Over 50mutations in the mtDNA and nuclear genome have been linkedto rare, but devastating, inborn errors of OXPHOS metabolism3.Moreover, quantitative declines in OXPHOS activity andefficiency have been linked to nearly all age-associated degenerativediseases, including type 2 diabetes mellitus4–6. Hence, understandingOXPHOS function and regulation, particularly within the contextof the entire cell, has important implications for managing manyhuman diseases.
Traditional approaches to studying energy metabolism in the mito-chondrion have focused either on the kinetics of ATP synthesis inisolated mitochondria or on transcriptional control of mitochondrialcomponents. For instance, classic bioenergetic studies that assessed theeffects of chemical inhibitors on isolated mitochondria2 focused on theacute regulation of mitochondrial activity, ignoring the cell’s ability torespond and adapt over longer time scales. Many of the chemicalreagents used in these studies were incompatible with cellular or whole-animal studies, making it difficult to extend their relevance in vivo.More recently, molecular studies have shed light on the transcriptional
control of OXPHOS7, although relatively little is known about howthese regulatory programs are coupled to other cellular processes.
Our goal was to combine physiologic and genomic profiling ofintact cells in order to probe OXPHOS function and regulation inresponse to thousands of small-molecule perturbations. A systematicmapping between physiology and gene expression may shed light onhow the nuclear genome and mtDNA are coordinated under differentcellular conditions to maintain energy homeostasis. Large-scaleapproaches based on perturbing cells have been used successfully tostudy cell growth8, gene expression9,10 and tumorigenesis11, but noprevious studies appear to have combined cell-based, physiologicalreadouts with genomic profiling. Our integrated approach provides aricher description of cellular mitochondrial state, reporting on morestable changes in the organelle, which can be useful for studying itslonger-term adaptations.
Here, we report the construction of a mitochondrial screeningcompendium and its application to problems in mitochondrialbiology, drug toxicity and therapeutics. Our compendium is freelyavailable and should provide a framework for understanding how theactivity and regulation of mitochondrial OXPHOS are integratedwithin the context of the entire cell.
RESULTS
Systematic profiling of OXPHOS physiology and transcription
We developed high-throughput assays in 384-well format for cellviability, mitochondrial physiology and gene expression (Fig. 1,Methods). We used differentiated C2C12 murine myotubes, a cell
Received 26 November 2007; accepted 31 January 2008; published online 24 February 2008; corrected after print 8 July 2008; doi:10.1038/nbt1387
1Broad Institute of Massachusetts Institute of Technology and Harvard, Seven Cambridge Center, Cambridge, Massachusetts 02142, USA. 2Center for Human GeneticResearch, Massachusetts General Hospital, 185 Cambridge Street, Boston, Massachusetts 02114, USA. 3Department of Pediatric Oncology, Dana-Farber CancerInstitute, 44 Binney Street, Boston, Massachusetts 02115, USA. 4Department of Systems Biology, Harvard Medical School, 200 Longwood Avenue, Boston,Massachusetts 02446, USA. 5These authors contributed equally to this work. Correspondence should be addressed to V.K.M. ([email protected]).
NATURE BIOTECHNOLOGY VOLUME 26 NUMBER 3 MARCH 2008 343
RESOURCE©
2008
Nat
ure
Pub
lishi
ng G
roup
ht
tp://
ww
w.n
atur
e.co
m/n
atur
ebio
tech
nolo
gy

line that has been used extensively to study mitochondrial biogenesisand bioenergetics12. We measured cell viability using a calcein dye13
and monitored mitochondrial physiology by probing four parametersrelated to OXPHOS. These included the JC-1 assay, which measuresmitochondrial membrane potential (DCm)14; the MTT ((3-(4,5-dimethylthiazol-2-yl)-2,5-diphenyltetrazolium bromide)) assay, whichmeasures mitochondrial dehydrogenase activity15; a luciferase-based assay for cellular ATP levels16; and a fluorescent probe (CM-H2DCFDA, (5-(and-6)-chloromethyl-2¢,7¢-dichlorodihydrofluoresceindiacetate), which measures reactive oxygen species (ROS), a by-product of OXPHOS17 (see Methods). We also developed animmunofluorescence-based assay for cytochrome c protein content(see Methods).
To complement these physiological assays, we also performed geneexpression–based high-throughput screening (GE-HTS)18,19 to profiletranscripts associated with nuclear and mtDNA OXPHOS (see Meth-ods). GE-HTS is a facile, high-throughput method that quantifiesdozens of transcripts simultaneously. It is a multiplexed PCR strategythat combines ligation-mediated amplification with multicolored beaddetection to identify and quantify transcripts of interest (see Supple-mentary Fig. 1 online). We adapted GE-HTS to profile simultan-eously all 13 mtDNA-encoded OXPHOS (mtOXPHOS) transcripts aswell as 12 nuclear-encoded OXPHOS (nuOXPHOS) transcripts (Sup-plementary Fig. 1). These 12 nuOXPHOS transcripts include repre-sentatives from all five OXPHOS protein complexes and were selectedbecause they capture virtually all of the variation in gene expressionshown by the entire OXPHOS repertoire, as assessed by analysis ofover 5,000 genome-wide microarrays (data not shown). Of note, ourGE-HTS assay also monitored transcripts that tend to be antic-orrelated to OXPHOS expression or are invariant across many con-ditions as assessed by microarray assays, and thereby assist in dataanalysis (see Methods). Together, our GE-HTS assay faithfully ‘tags’the expression of the entire OXPHOS system. Moreover, because theexpression of OXPHOS genes is so highly correlated, measuring
multiple transcripts increases the signal-to-noise ratio with which wecan detect subtle effects of individual compounds4.
We performed the viability, physiology and gene-expression assaysin duplicate in differentiated C2C12 myotubes following 48-h treat-ment with each of 2,490 compounds. Our chemical library consists ofknown bioactives, two-thirds of which are marketed drugs. Using ascoring algorithm dependent upon the distribution of mock-treated(DMSO) wells20,21, we arrived at a normalized score for each assay ineach well (Supplementary Table 1 online). In our compendium, wehave included data from our screen for cytochrome c protein expres-sion, though we excluded it from subsequent analyses owing to thehigh coefficient of variation. Correlation analysis indicated that ourremaining readouts (one for viability, four for OXPHOS physiologyand one for OXPHOS gene expression) provide complementaryinformation (Supplementary Fig. 2 online).
The resulting compendium is freely available to the public andis useful for dissecting mitochondrial function (SupplementaryTable 1). Unlike traditional approaches for studying mitochondrialfunction, it enables us to track systematically how changes in nuclearand mitochondrial OXPHOS gene expression are coupled to mito-chondrial physiology over thousands of perturbations. We used thisapproach to explore three problems focused on mitochondrial bio-logy, drug toxicity and the identification of novel therapeutics.
Cross-talk between nuclear and mitochondrial genomes
First, we used the compendium to identify the cellular signals involvedin coordinating nuclear OXPHOS (nuOXPHOS) and mtDNAOXPHOS (mtOXPHOS) transcription. Expression of OXPHOSgenes from the two genomes must be tightly coupled to maintainenergy homeostasis in the mitochondrion22,23. Moreover, althoughOXPHOS expression can change in human diseases, it is often unclearwhether the changes are primary or reactive and how these changesrelate to cellular physiology4,24–26. We therefore focused on therelationship between nuOXPHOS and mtOXPHOS transcripts across
Cellularviability
Geneexpression
0.00 0 0 5 0 0
PGC-1α2.550 40 50 250100 500 DMSO
80100
0.5
mtOXPHOS
nuOXPHOS
nuOXPHOS
mtOXPHOS
Anticorrelated
I
II
2
5
4
1
1
6
2 3 4 5 6
3III
IV
AAAA
ATP
Viability
OH
H+H+H+
H+
AAAA
Cmpd 1Viab
ility
Physio
logy
nuOXPHOS
mtO
XPHOS
Cmpd 2
Cmpd 2,490
Duplicate measurementsin 384-well plates
after 48-h treatment
Staurosporine (nM) Rotenone (µM) Staurosporine (nM)CCCP (µM) H2O2 (µM)
1.0
e–
e–
O2
O2
Calcein MTT ATPROS
∆�m
∆�m
0.0
0.5
1.0
0.0
0.5
1.0
0.0
0.5
Physiological measurements1.0 5.0
3.0
1.0
–
···
Figure 1 Complementary profiles of viability, mitochondrial physiology and gene expression across 2,490 chemical perturbations. The calcein assay (1)
measures cell viability and filters out overtly toxic compounds, such as staurosporine. The MTT assay (2) measures cellular dehydrogenase activity, which is
inhibited by the complex I inhibitor rotenone. The JC-1 assay (3) measures the mitochondrial membrane potential (DCm) and drops acutely after the addition
of the mitochondrial uncoupler carbonyl cyanide m-chlorophenylhydrazone (CCCP). A luciferase-based assay measures ATP (4), which is reduced by
staurosporine. CM-H2DCFDA is a fluorescent probe of cellular ROS (5), which can be stimulated by the addition of H2O2. The expression of both nuOXPHOS
and mtOXPHOS transcripts is measured by a multiplex PCR technique, GE-HTS (6). Each column of the heat map represents one sample replicate;
expression levels for each gene are row-normalized. Treatment with PGC-1a, an inducer of OXPHOS gene expression, is used as a positive control. All assays
were performed in biological duplicate in 384-well format after 48 h of treatment in differentiated murine C2C12 myotubes. Data from 2,490 distinctcompounds are incorporated into the screening compendium.
344 VOLUME 26 NUMBER 3 MARCH 2008 NATURE BIOTECHNOLOGY
R E S O U R C E©
2008
Nat
ure
Pub
lishi
ng G
roup
ht
tp://
ww
w.n
atur
e.co
m/n
atur
ebio
tech
nolo
gy

the chemical perturbations. As expected, the majority of compoundsinfluence the two sets of genes in a coordinated manner (Fig. 2a).However, we identified some compounds that decouple the co-ordination between these two genomes (Fig. 2b and SupplementaryTable 2 online), a subset of which we confirmed with follow-up doseresponse curves and RT-PCR analysis (Fig. 2c). Specifically, wediscovered that the eukaryotic protein synthesis inhibitors emetine,anisomycin and cycloheximide preferentially increase nuOXPHOSexpression, implying that translational control might be importantin coordinating the two genomes. Follow-up studies revealed that1 mM cycloheximide elevated nuOXPHOS 1.3-fold but decreasedmtOXPHOS 2.4-fold (Fig. 2c). Notably, we found that nuOXPHOSexpression, but not mtOXPHOS expression, correlated stronglywith cellular ATP levels (Fig. 2b). To determine whether nuOXPHOSexpression drives the changes in ATP levels, or reacts to changesin ATP levels, we performed follow-up time-course analyses with20 mM perphenazine, a compound that decreased nuOXPHOSexpression. Whereas nuOXPHOS expression declined significantly(21%, t-test, P ¼ 0.004) within the first hour of treatment, cellularATP levels remained unchanged (0.6%, t-test, P ¼ 0.84) at these earlytime points. At later time points, however, ATP levels dropped signi-ficantly (8 h: 11% decrease, t-test, P ¼ 1.4 � 10�5, 24 h: 27% decrease,t-test, P ¼ 6.3 � 10�22), suggesting that the decline in nuOXPHOSexpression precedes and drives the decline in cellular ATP levels.
Exploring the mitochondrial basis for drug toxicity
To probe the role of mitochondria in human drug toxicity, we focusedon the statins—3-hydroxy-3-methylglutaryl–coenzyme A (HMG-CoA) reductase inhibitors taken by nearly 100 million patients world-wide. Statins are associated with a 0.1–0.5% incidence of myopathy27,
believed to be caused by ubiquinone depletion, which can block elec-tron transport28. However, clinical and epidemiological studies of theassociation between statins and myopathy have produced conflictingresults28. Of the six statins present in our screening collection, three(fluvastatin, lovastatin and simvastatin) produced strong decreases incellular ATP levels and MTT activity (Fig. 3a). Previous studiesshowed that lovastatin and simvastatin reduce MTT activity andATP levels29, consistent with our high-throughput screening results.To eliminate the possibility that we uncovered two classes basedmerely on potency, we measured cellular ATP levels over doses rangingup to 40 mM. We observed the same segregation of effects, withatorvastatin, pravastatin and rosuvastatin showing little to no effect oncellular or mitochondrial ATP levels (Supplementary Fig. 3 online).
To determine whether this profile might represent a signature ofdrug-induced myopathy, we established a centroid profile for the threemitochondria-active statins (fluvastatin, lovastatin and simvastatin)and sought to identify other clinically used drugs with a similar assayprofile. The ten nearest-neighbor drugs to the centroid statin profile(Fig. 3b) were amoxapine, cyclobenzaprine, propranolol, griseofulvin,pentamidine, paclitaxel, propafenone, ethaverine, trimeprazine andamitriptyline. Notably, five of these compounds (amoxapine, propra-nolol, griseofulvin, pentamidine and paclitaxel) have also been asso-ciated with skeletal muscle myopathy or myalgia30–34, a strikingly highproportion in comparison to the small fraction of all FDA-approveddrugs believed to be associated with this side effect35. This suggeststhat the drug profile might be indicative of myopathy or myalgia.Further examination of the screening data revealed that two electrontransport chain inhibitors—b-dihydrorotenone (a complex I inhibi-tor) and antimycin A (a complex III inhibitor)—were among the 16nearest-neighbor compounds to this assay profile, which providesmechanistic insight into this profile. Together, the data support theidea that myopathy induced by these five other drugs could bemitochondrial in origin.
We were struck by the fact that one of these nearest-neighbor drugsis propranolol, a widely used antihypertensive agent. Follow-up experi-ments confirmed that propranolol, but not other selective b1 blockers,decreases cellular ATP levels in a dose-dependent manner (Supple-mentary Fig. 3). Because many patients take both a statin and ab-blocker for cardioprotection, we were curious whether the two drugsmight interact to cause toxicity. We thus assessed cellular ATP levelsafter treatment with all possible combinations of the six statins in ourcollection and three b-blockers (atenolol, metoprolol and propranolol),with all concentrations falling between 2.5 and 10 mM (Fig. 3c).Although neither atenolol nor metoprolol showed an effect eitheralone or in combination with any statin, propranolol had an additiveeffect on statin-induced decrease in ATP levels, as determined using theBliss independence model (Fig. 3c)36. Our screening compendium andfollow-up experiments (Fig. 3c) thus raise the potentially importanthypothesis that patients on a combination of propranolol and one ofthe three statins (fluvastatin, lovastatin, simvastatin) might be at ahigher risk for developing myopathy or myalgia.
10
10
5
a
b
c
mtO
XP
HO
S g
ene
expr
essi
on
5
nuOXPHOS
mtOXPHOS
ATP
–5
–5
–10
–10
0
0
I
I
I
I
II
II
II
III
III
III
Max
3
–3
Quadrant Compound
Mebendazole 1 1.48 ± 0.11
1.56 ± 0.13
1.09 ± 0.03
0.70 ± 0.06
1.31 ± 0.08
1.45 ± 0.17
1.41 ± 0.19
1.40 ± 0.06
0.78 ± 0.13
0.41 ± 0.07
5
1
1
1
Thimerosal
Perphenazine
Cycloheximide
Deoxysappanone B
nuOXPHOS mtOXPHOSDose (µM)
MinZexp
ZATP
nuOXPHOS gene expression
IV
IV
IV
Figure 2 Coupling of nuclear and mitochondrial OXPHOS expression.
(a) A two-dimensional plot of the composite Z-scores for nuOXPHOS and
mtOXPHOS expression is shown. (b) Row-normalized heat map displaying
the top 15 compounds in each quadrant (I–IV). Heat map of nuOXPHOS and
mtOXPHOS expression is shown along with ATP levels. (c) Real-time PCR
validation of select compounds at the indicated doses, using Atp5a1
(nuOXPHOS) and mt-Co1 (mtOXPHOS) normalized to Hprt1 (internal
control). Values indicate average fold change from mock-treated (DMSO)wells ± s.d. in four biological replicates.
NATURE BIOTECHNOLOGY VOLUME 26 NUMBER 3 MARCH 2008 345
R E S O U R C E©
2008
Nat
ure
Pub
lishi
ng G
roup
ht
tp://
ww
w.n
atur
e.co
m/n
atur
ebio
tech
nolo
gy

Discovering lead compounds for common degenerative diseases
Finally, we searched for lead compounds that might hold therapeuticpotential for common human diseases. As we and others have recentlyshown that a decline in OXPHOS gene expression and an elevation inROS generation are associated with type 2 diabetes4,37,38, neuro-degeneration39 and aging5,6, we queried our compendium to identifycompounds that might be capable of elevating OXPHOS expressionwhile reducing ROS accumulation.
We used two computational strategies to spotlight such compounds(see Methods). First, we developed a simple analytical strategy to
determine whether any structurally related set of compounds mightboost OXPHOS expression while also suppressing ROS accumulation(Supplementary Table 3 online). This strategy involves organizing allcompounds based on structural similarity (Methods) and then askingwhether members of a cluster had concordant scores in a given assay(Fig. 4a). The advantage of this strategy is that individual compoundsmight show a subtle response not detectable in a primary screen withduplicate measurements, whereas the grouped analysis provides addedstatistical power. Second, in a complementary approach, we soughtto identify individual compounds that promote OXPHOS gene
Figure 4 Two complementary strategies to
identify small molecules that boost OXPHOSgene expression and decrease ROS levels.
(a) Mining the compendium for sets of
structurally related compounds that achieve
the desired activity. All compounds were
organized into 624 clusters based on the
chemical descriptors molecular weight, log P,
number of hydrogen bond donors and acceptors,
and number of rotatable bonds. The Mann-
Whitney rank-sum statistic for each cluster and
each assay was then calculated. The significance
of each cluster in each assay is shown, with
points above zero indicating positive composite
scores and points below zero showing negative
composite scores. A nominal P ¼ 0.01 is
delimited by the dashed lines. The red data
points spotlight a single cluster that is
significant for the desired activity, with the
shared chemical scaffold shown. (b) Mining
the compendium for individual compounds thatachieve the desired activity. The distributions
of ROS scores are shown for all compounds (gray) and for compounds associated with the highest OXPHOS gene expression (black). The latter follow a
bimodal distribution, and the smaller mode (bracketed) contains six compounds that elevate OXPHOS expression and decrease ROS levels, with chemical
structures shown.
2a b
c
Com
posi
te Z
-sco
re
Com
posi
te Z
-sco
re
–2
Viability ATP
10
Pro
pran
olol
Ate
nolo
lM
etop
rolo
l
2.55
0
10
2.55
0
10
10
2.5
2.5
Atorvastatin Rosuvastatin Fluvastatin Lovastatin SimvastatinPravastatin
5
50
0 102.5 50 102.5 50 102.5 50 102.5 50 102.5 50
MTT
–4
AtorvastatinPravastatinRosuvastatin
FluvastatinLovastatinSimvastatin
Centroidstatin score(fluvastatin,lovastatin,simvastatin)
0
ROS
2
–2
–4
0
∆�m Viability ATP MTT
Ten nearest drugs
50
0
Percentdecreasein ATP
ROS∆�m
Figure 3 Statin-induced mitochondrial toxicity.
(a) Six of the HMG-CoA reductase inhibitors
(statins) in clinical use are in the chemical
screening collection. Composite Z-scores for cell
viability, ATP generation, MTT activity, DCm,
ROS levels and gene expression are shown, where
negative scores indicate a decrease in signal
compared to mock-treated (DMSO) wells. Thegray shading indicates scores that fall within the
noise envelope. (b) A centroid statin score was
generated by calculating the arithmetic means
of the composite Z-scores for fluvastatin,
lovastatin and simvastatin. The ten nearest-
neighbor clinically used drugs (amoxapine,
cyclobenzaprine, propranolol, griseofulvin,
pentamidine, paclitaxel, propafenone, ethaverine,
trimeprazine and amitriptyline) were identified
by calculating the root-mean-square distance of
each performance vector to the profile of interest.
(c) All six statins were tested in combination
with three clinically used b-adrenergic blockers
(propranolol, atenolol and metoprolol) for their
effects on cellular ATP levels. Compound
concentrations are indicated on each axis, and
the color indicates the change in ATP levels
(ranging from black, for no change, to yellow,
for a 50% decrease). Data represent the averageof six independent replicates; coefficients of
variation were all below 15%.
6
Ele
vate
d sc
ore
Dec
reas
ed s
core
–log
P
0.06 All compounds
134 compoundswith high OXPHOSexpression
a b
Freq
uenc
y 0.04
0.02
Deoxysappanone
Paclitaxel Podofilox Vinblastine
Mebendazole Nocodazole
<–3 –2
OH
HNHH H
NHN
N S N
N
OO
OO
O
O
OOO
OOOO
O
O O
O
O
OH
O
O
OH
OHOH O
O
OO
O N
NN
NH
HO
HO
OO
OO
O
OO
OOOH
NH
ROS level (Z-score)0 2 >3
0
4
2
0
2
4
6
Viabilit
yAT
PM
TTROS
Nuclea
rM
ito∆�m
H OON
NRNH
346 VOLUME 26 NUMBER 3 MARCH 2008 NATURE BIOTECHNOLOGY
R E S O U R C E©
2008
Nat
ure
Pub
lishi
ng G
roup
ht
tp://
ww
w.n
atur
e.co
m/n
atur
ebio
tech
nolo
gy
expression while reducing ROS levels. The advantage of this method isthat it can reveal structurally unrelated compounds that individuallyexert large effect sizes in the two assays of interest. We focused on theupper tail of the combined nuclear and mitochondrial OXPHOS gene-expression distribution (Fig. 4b).
Notably, both analytical strategies spotlighted microtubule modu-lators, including both a microtubule stabilizer (paclitaxel) and severaldestabilizers (mebendazole, nocodazole, podophyllotoxin andvinblastine), as agents that boost OXPHOS expression while suppres-sing ROS levels. The second strategy also yielded deoxysappanone B,a natural product found in sappan wood40, whose molecular modeof action is unknown and has not been previously linked to micro-tubule biology. The other microtubule inhibitors within thecompound collection (colchicine and griseofulvin) did not displaythe same decrease in ROS levels, but did show a modest increase inOXPHOS expression.
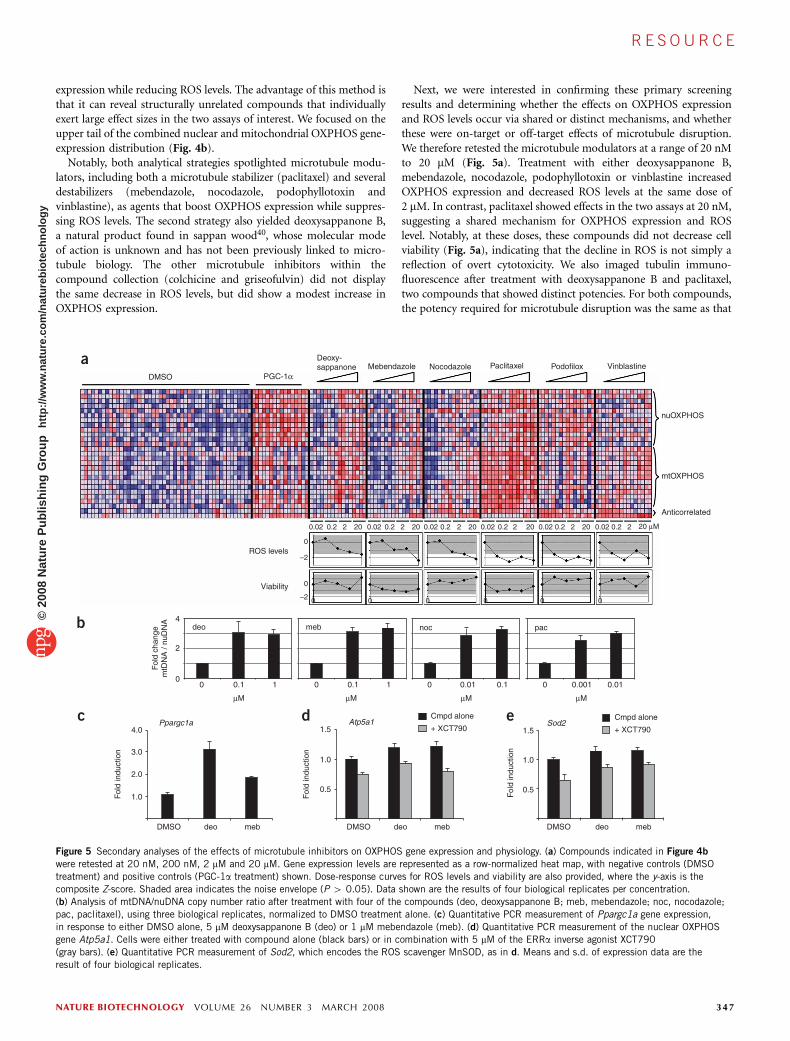
Next, we were interested in confirming these primary screeningresults and determining whether the effects on OXPHOS expressionand ROS levels occur via shared or distinct mechanisms, and whetherthese were on-target or off-target effects of microtubule disruption.We therefore retested the microtubule modulators at a range of 20 nMto 20 mM (Fig. 5a). Treatment with either deoxysappanone B,mebendazole, nocodazole, podophyllotoxin or vinblastine increasedOXPHOS expression and decreased ROS levels at the same dose of2 mM. In contrast, paclitaxel showed effects in the two assays at 20 nM,suggesting a shared mechanism for OXPHOS expression and ROSlevel. Notably, at these doses, these compounds did not decrease cellviability (Fig. 5a), indicating that the decline in ROS is not simply areflection of overt cytotoxicity. We also imaged tubulin immuno-fluorescence after treatment with deoxysappanone B and paclitaxel,two compounds that showed distinct potencies. For both compounds,the potency required for microtubule disruption was the same as that
DMSO
a
b
c d e
Deoxy-sappanone Mebendazole Nocodazole Paclitaxel Podofilox Vinblastine
nuOXPHOS
mtOXPHOS
Anticorrelated
PGC-1α
0.02
ROS levels
4
4.0Ppargc1a
3.0
2.0
Fol
d in
duct
ion
Fol
d in
duct
ion
1.0
DMSO deo meb DMSO
1.5
Cmpd aloneSod2
+ XCT790Cmpd alone
+ XCT790Atp5a1
1.0
0.5
Fol
d in
duct
ion
1.5
1.0
0.5
deo meb DMSO deo meb
Fol
d ch
ange
mtD
NA
/ nu
DN
A
deo meb noc pac
2
00 10.1 0 10.1 0 0.10.01 0 0.010.001
µM µM µM µM
Viability
0.2
0
0 0 0 0 0 0
–2
0
–2
2 20 0.02 0.2 2 20 0.02 0.2 2 20 0.02 0.2 2 20 0.02 0.2 2 20 0.02 0.2 2 20 µM
Figure 5 Secondary analyses of the effects of microtubule inhibitors on OXPHOS gene expression and physiology. (a) Compounds indicated in Figure 4b
were retested at 20 nM, 200 nM, 2 mM and 20 mM. Gene expression levels are represented as a row-normalized heat map, with negative controls (DMSO
treatment) and positive controls (PGC-1a treatment) shown. Dose-response curves for ROS levels and viability are also provided, where the y-axis is the
composite Z-score. Shaded area indicates the noise envelope (P 4 0.05). Data shown are the results of four biological replicates per concentration.
(b) Analysis of mtDNA/nuDNA copy number ratio after treatment with four of the compounds (deo, deoxysappanone B; meb, mebendazole; noc, nocodazole;
pac, paclitaxel), using three biological replicates, normalized to DMSO treatment alone. (c) Quantitative PCR measurement of Ppargc1a gene expression,
in response to either DMSO alone, 5 mM deoxysappanone B (deo) or 1 mM mebendazole (meb). (d) Quantitative PCR measurement of the nuclear OXPHOS
gene Atp5a1. Cells were either treated with compound alone (black bars) or in combination with 5 mM of the ERRa inverse agonist XCT790
(gray bars). (e) Quantitative PCR measurement of Sod2, which encodes the ROS scavenger MnSOD, as in d. Means and s.d. of expression data are the
result of four biological replicates.
NATURE BIOTECHNOLOGY VOLUME 26 NUMBER 3 MARCH 2008 347
R E S O U R C E©
2008
Nat
ure
Pub
lishi
ng G
roup
ht
tp://
ww
w.n
atur
e.co
m/n
atur
ebio
tech
nolo
gy

required to affect OXPHOS expression and ROS levels (Supplemen-tary Fig. 4 online). To our knowledge, deoxysappanone B has notpreviously been linked to microtubule inhibition, but it now has beenpredicted to do so and the prediction has been validated by this study.Given that structurally and mechanistically diverse microtubule mod-ulators increased OXPHOS gene expression, decreased cellular ROSand disrupted microtubules with equivalent potencies, it is likely thatthese effects are directly related to inhibition of microtubules, and notdue to an off-target effect.
Because mtDNA replication and transcription are often coupled41,we sought to determine whether any of these compounds promotedmtDNA replication. At the concentrations tested, several of thesemicrotubule modulators—but not podophyllotoxin or vinblastine—increased mtDNA copy number approximately threefold (Fig. 5b).
We sought to determine the transcriptional mechanism by whichmicrotubule inhibition might promote OXPHOS expression andmtDNA replication while suppressing ROS. We hypothesized thatthese changes might be occurring via PGC-1a, a transcriptionalcoactivator that regulates mitochondrial biogenesis in muscle42 andwhose transcriptional program is diminished in type 2 diabetes4.Consistent with this hypothesis, both mebendazole and deoxysappa-none B induced the expression of Ppargc1a (which encodes PGC-1a)by approximately threefold (Fig. 5c). We have previously shown thatthe transcription factor ERRa serves as a key transcriptional partner ofPGC-1a to drive OXPHOS expression in muscle, and that disruptionof ERRa with the selective inverse agonist XCT790 suppresses PGC-1a–induced OXPHOS expression43. Therefore, we tested whetherXCT790 is capable of inhibiting compound-induced transcription.We observed that both mebendazole and deoxysappanone B increasedthe expression of a nuclear OXPHOS gene, Atp5a1, by B20%, andthat the increase by mebendazole was blunted by XCT790 (Fig. 5d),further suggesting a PGC-1a–dependent mechanism of compoundactivity. The mitochondrial ROS scavenger MnSOD is downstream ofthe same PGC-1a pathway44, and as we observed decreased cellularROS levels after treatment with these small molecules, we also testedthe effects of the compounds on this gene. A similar increase inMnSOD levels, which was only partially suppressible by XCT790, wasobserved with these compounds (Fig. 5e). These results suggest thatmicrotubule modulators both activate OXPHOS transcription andreduce cellular ROS levels in a manner involving PGC-1a and ERRa.
DISCUSSION
The mitochondrion is an extremely complex organelle, with compo-nents derived from both the nuclear and mitochondrial genomes,whose activity must be carefully coupled to cellular metabolism andsignaling. We systematically investigated mitochondrial function usingmultiple physiological and multiplexed gene-expression assays forOXPHOS following chemical perturbations. The gene-expressionand physiological assays provided complementary information andwere jointly useful in interpreting the effects of compound treatment.The compendium is freely available and can be used to investigate thenetwork properties of the mitochondrion. Moreover, because so manyof the 2,490 compounds tested are well characterized, they can be usedimmediately to study mitochondrial biology, as illustrated by the threeapplications we have demonstrated.
First, we focused on how the nuclear genome and mtDNA arecoordinated across a variety of physiological states. As this is the firstcompendium to interrogate the expression of both the nucleargenome and mtDNA, we could show that the bulk of compoundscoordinately regulate expression from both genomes. However, similarto the demonstration that the calcium ionophore A-23187 can elevate
nuOXPHOS while decreasing mtOXPHOS45, we found that eukar-yotic protein synthesis inhibitors disrupt cross-talk between thesetwo genomes. We now have an array of chemical tools (Fig. 2) toinvestigate whether protein synthesis inhibitors also disrupt thenuclear-to-mitochondrial genome cross-talk via known pathways orthrough one or more novel mechanisms.
Second, we mined the compendium to learn about drug toxicity.Our focus on statins revealed a bimodal response from these HMG-CoA reductase inhibitors (Fig. 3), with three compounds (atorvastatin,pravastatin and rosuvastatin) forming a group with no activity in ourphysiological assays and three other compounds (fluvastatin, lovastatinand simvastatin) forming a group showing signs of OXPHOS inhibi-tion. Statins block the synthesis of mevalonate, a precursor not only ofcholesterol but also ubiquinone, a mobile electron carrier in themitochondrion that is critical to OXPHOS function. It has thereforebeen previously suggested that statin myopathy may result from arespiratory chain blockade28. Our data suggest that the statins fluvas-tatin, lovastatin and simvastatin should be examined further for theireffects on skeletal muscle ubiquinone and drug-induced myopathy.Using the statin toxicity signature (Fig. 3a), we also discovered thatpropranolol, a widely used antihypertensive agent, shares the sameprofile of mitochondrial inhibition. b1-selective blockers such asatenolol and metoprolol, however, did not show this pattern of toxicity(Supplementary Fig. 3). The additive interaction we reveal betweenthe statins and propranolol suggests that patients taking both statinsand propranolol might be at increased risk for developing skeletalmuscle myopathy or myalgia. Because many patients with heart diseaseare likely to be on this drug combination, our hypothesis can be testedeasily and may help to account for the conflicting reports on skeletalmuscle myopathy associated with statins.
Third, we queried our compendium for compounds that couldpotentially reverse signatures associated with age-associated degenera-tive diseases. We and others have recently reported that a decline inOXPHOS expression and a rise in ROS levels accompany a numberof common degenerative diseases, including diabetes, neurodegenera-tion and aging4–6,37–39. Using two computational approaches to mineour compendium, we discovered that structurally unrelated micro-tubule modulators with diverse mechanisms of action (both stabilizersand destabilizers) increased OXPHOS expression and decre-ased cellular ROS. Follow-up dose-response studies of mitochondrialfunction and microtubule disruption suggest that these drugs affectOXPHOS expression and ROS levels via an on-target mechanism.
Our studies raise the possibility that manipulation of the micro-tubule pathway may reverse the gene-expression and ROS signaturesassociated with common degenerative diseases and that these mayrepresent therapeutic targets. Previous clinical case reports supportthis hypothesis. Type 1 and type 2 diabetics treated for parasitic worminfections with mebendazole unexpectedly showed improvement bothin fasting blood glucose levels and nonesterified fatty acid metabo-lism46. Blood glucose levels improved without weight loss, suggestingthat the improvement in diabetes was not due to a toxic side effect ofmebendazole. Moreover, deoxysappanone B, a natural product foundin sappan wood, has been reported to be an antidiabetic component ofChinese herbal medicine, although its mechanism was unclear40. Ourdata convincingly demonstrate that deoxysappanone B disruptsmicrotubules (Supplementary Fig. 4).
At a molecular level, we have uncovered an unexpected link betweenmicrotubule disruption and an increase in PGC-1a/ERRa–mediatedOXPHOS gene expression. Although changes in mitochondrialstaining and morphology have been associated with microtubuleinhibitors47, no studies have specifically documented their effects on
348 VOLUME 26 NUMBER 3 MARCH 2008 NATURE BIOTECHNOLOGY
R E S O U R C E©
2008
Nat
ure
Pub
lishi
ng G
roup
ht
tp://
ww
w.n
atur
e.co
m/n
atur
ebio
tech
nolo
gy

OXPHOS expression and ROS levels. It is intriguing to speculate thatperhaps interactions between the cytoskeleton and the mitochondrionare important in integrating cellular homeostasis throughout the cellcycle. As many of these microtubule modulators are used for treatingcancer, our results may enhance understanding of the metabolic basisof chemotherapeutic action.
Building on decades of research in bioenergetics that yielded adetailed, mechanistic understanding of OXPHOS in isolated mito-chondria48, our screening compendium provides a foundation forunderstanding how OXPHOS physiology and regulation are inte-grated within the broader signaling and metabolic network of the cell.Each small-molecule probe modulates a different aspect of cell biology,and our compendium provides insights into how OXPHOS respondsto these perturbations by remodeling at the levels of physiology andgene expression. Because many of the small molecules used in thisstudy are well-characterized bioactives, our compendium provides arich chemical toolkit for manipulating mitochondria in cells andwhole animals in a defined manner. Given the growing number ofrare and common diseases associated with different types of mito-chondrial dysfunction, we anticipate that our compendium will serveas a generic tool for systematically investigating mitochondrial patho-genesis and for restoring mitochondrial function.
METHODSCell culture. C2C12 myoblasts (ATCC) were grown in Dulbecco’s Modified
Eagle’s Medium (DMEM, Mediatech) supplemented with 10% (vol/vol) FBS
and antibiotics (100 mg/ml penicillin/streptomycin mix) in a humidified
atmosphere at 37 1C with 5% CO2. Differentiation into myotubes was induced
at 80% density on ‘day 0’ by changing the medium to DMEM supplemented
with 2% (vol/vol) horse serum.
Cell-based high-throughput screening. For all screening, 4,000 C2C12 myo-
blasts per well were seeded into either black or white 384-well optical-bottom
plates (Nunc) at 50 ml per well. On day 4 of differentiation, 100 nl of each
compound was pin-transferred in duplicate into fresh medium with a steel
pin array, using the CyBi-Well robot (CyBio). To increase the number
of mock-treated wells included in the control distribution, we added an
additional plate containing DMSO alone. Compound-treated plates were
incubated at 37 1C for 48 h. All cell-based assay measurements were performed
using the EnVision plate reader (PerkinElmer). The coefficient of variation for
each of these assays was estimated to be less than 15%. All data has been
deposited in ChemBank: http://chembank.broad.harvard.edu/assays/view-
project.htm?id¼1000453.
Calcein viability assay. Medium was aspirated from plates, and 30 ml per well
1 mM calcein-AM (Molecular Probes) in phenol red–free medium was added.
Plates were incubated for 1 h at 37 1C and washed three times with 50 ml per
well PBS. Fluorescence was measured at excitation and emission wavelengths
(ex/em) of 485 nm/530 nm.
JC-1 mitochondrial membrane potential assay. Upon depolarization, the JC-1
dye is converted from a diffuse green form to red fluorescent J-aggregates. The
ratio of red to green fluorescence serves as a readout of the mitochondrial
membrane potential. Medium was aspirated from plates, and 20 ml per well
3.25 mM JC-1 (Molecular Probes) in phenol red–free medium was added. Plates
were incubated for 2 h at 37 1C and washed three times with 50 ml per well PBS.
Fluorescence was measured first at ex/em 530 nm/580 nm (‘red’) and then at
ex/em 485 nm/530 nm (‘green’).
Assay for cellular ATP levels. 20 ml per well CellTiterGlo reagent (Promega)
was added to 20 ml per well of cell culture medium. Plates were agitated for
2 min and incubated for 10 min at room temperature (22–24 1C) before
luminescence was measured.
MTTassay. Medium was aspirated from plates, and 50 ml per well 0.5 mg/ml
MTT in phenol red–free medium was added. Plates were incubated for 2 h at
37 1C, and this was followed by aspiration of MTT solution, addition of 50 ml
per well DMSO to dissolve formazan crystals, and incubation at 37 1C for
30 min. After incubation, plates were equilibrated to room temperature for an
additional 20–30 min. Absorbance was measured at 540 nm.
Reactive oxygen species assay. Medium was aspirated from plates, and 20 ml
per well 10 mM CM-H2DCFDA (Molecular Probes) in phenol red–free medium
was added. Plates were incubated for 1 h at 37 1C and washed three times with
50 ml per well PBS. Fluorescence was measured at ex/em 485 nm/530 nm.
Cytochrome c protein detection. Cells were fixed with 3.7% (vol/vol) for-
maldehyde in PBS for 30 min and then washed with TBS containing 0.1%
(vol/vol) Tween-20 (TBST) and blocked with TBST + 3% (wt/vol) BSA for 1 h
at room temperature. Cytochrome c was detected by incubating the cells with
primary antibody (Cell Signaling Technology; 1:100) overnight at 4 1C, washing
three times with TBST, and incubating with secondary antibody (Alexa Fluor
488–conjugated anti–mouse IgG, Invitrogen; 1:250) for 1 h at room tempera-
ture. Plates were washed three times with TBST and fluorescence measured at
ex/em 485 nm/530 nm.
Gene expression–based high-throughput screening. We adapted the GE-HTS
assay to monitor both nuclear and mtDNA OXPHOS transcripts. To narrow
down the list of potential genes from nearly 80 nuclear OXPHOS genes, we
used a list of highly co-regulated OXPHOS genes4 that are coordinately
expressed across tissues and are downstream of the PGC-1a transcriptional
coactivator. From this list, we selected genes that showed the highest signal-to-
noise ratio in the microarray analysis of PGC-1a overexpression in C2C12
myotubes43 representing all five OXPHOS complexes. We also selected two
genes that are downregulated by PGC-1a with the best signal-to-noise ratio. As
controls, we selected genes that showed the lowest signal (no treatment effect)
and lowest noise (biological variation) in the PGC-1a overexpression data43, as
well as genes previously found to be invariant from the analysis of multiple
microarray datasets49. We selected control genes that span a wide range of
expression levels to prevent biasing for abundant transcripts. The selected
OXPHOS transcripts capture the bulk of the variation exhibited by the
OXPHOS transcripts represented on over 5,000 publicly available mouse
microarrays on the Affymetrix platform (data not shown).
From the list of OXPHOS genes and control genes for GE-HTS, we designed
probe pairs with T7 and T3 universal primer sites, 40-bp target sequence split
into two 20-bp sequences for each probe, and gene-specific barcode sequence
attached to the 5¢ probe according to the published assay specification19. We
selected 40-bp gene-specific target sequences that are not alternatively spliced
using oligonucleotide sequences found in the Mouse Exonic Evidence-Based
Oligonucleotide Chip (MEEBO, http://alizadehlab.stanford.edu/). Full primer
sequences are included in Supplementary Table 4 online.
The GE-HTS assay was performed as previously described50. Because this
assay measures the final amount of PCR products rather than providing a real-
time measurement of gene expression, we adjusted the parameters in the
original protocol so that the abundance of PCR products were within the linear
range of the assay. We removed 20 ml of medium and added 25 ml of lysis buffer
per well of a 384-well plate, and used 24 PCR cycles instead of the 29 cycles
described50. We used 32 DMSO-treated and 32 PGC-1a adenovirus–treated
wells per 384-well compound plate, with one additional control plate
containing 192 DMSO-treated wells, 32 GFP adenovirus–treated wells
and 160 PGC-1a adenovirus–treated wells. The PGC-1a adenovirus–treated
cells serve as a positive control for increased OXPHOS gene expression, as
previously reported4.
Tubulin immunofluorescence. On day 4 of differentiation, C2C12 myotubes
were treated with each compound for 48 h and then fixed for 5 min in ice-cold
100% methanol. Cells were washed once in 50 ml PBSTB2 (PBS with
0.1% (vol/vol) Tween-20 and 2% (wt/vol) BSA) and blocked in PBSTB2 for
1 h at room temperature or overnight at 4 1C. Cells were incubated with an
anti-a-tubulin (Sigma-Aldrich) antibody, 1:1,000 in PBSTB2, for 1 h at room
temperature, and then washed three times with PBSTB2. Cells were incubated
with secondary antibody (Alexa 488–conjugated anti-mouse antibody, 1:500 in
PBSTB2) (Molecular Probes) and Hoechst 33342 for 1 h at room temperature
and then washed three times in PBSTB2. Cells were visualized using an
automated microscope (IX-Micro, Molecular Devices).
Quantitative PCR of mtDNA and transcripts. mtDNA quantification. Mito-
chondrial DNA copy number was assessed by quantifying the abundance of the
NATURE BIOTECHNOLOGY VOLUME 26 NUMBER 3 MARCH 2008 349
R E S O U R C E©
2008
Nat
ure
Pub
lishi
ng G
roup
ht
tp://
ww
w.n
atur
e.co
m/n
atur
ebio
tech
nolo
gy

mitochondrial gene mt-Co1 (encoding cytochrome c oxidase 1) relative to the
nuclear gene Actb (encoding b-actin). DNA from cells were extracted using
DNeasy (Qiagen) and quantified for mt-Co1 and Actb copy number using
quantitative PCR (Applied Biosystems). The change in the mt-Co1/Actb ratio
between the compound-treated and DMSO control cells represents the fold
change in mtDNA copy number.
Gene expression. We extracted RNA using an RNeasy kit (Qiagen) and
synthesized cDNA using a high-capacity cDNA reverse transcription kit
(Applied Biosystems) with random hexamers, as described by the manufac-
turer. The cDNA was then used for real-time PCR quantification of products
for mouse Atp5a1 (Mm00431960_m1), Sod2 (MnSOD; Mm01313000_m1) and
Ppargc1a (Mm00447183_m1), with Hprt1 (Mm03024075_m1) serving as an
internal control, using TaqMan gene-expression assays (Applied Biosystems).
Statistics. Cell-based screening. Composite Z-scores reflecting compound per-
formance as compared to a mock-treated (DMSO) distribution were calculated
as described20,21 (see also http://chembank.broad.harvard.edu/details.htm?
tag¼Help#screeningData).
GE-HTS. We first eliminated wells that failed the assay reaction by filtering
out wells in which the raw expression value of Rps2 (a control gene) was 2 s.d.
below the median DMSO control value for each plate. We normalized for plate-
to-plate variation by scaling the per-well expression level of each gene to the
median expression level of that gene in PGC-1a control wells on each plate. We
set the median PGC-1a�treated expression value for each gene to 1, and then
normalized for well-to-well variation by dividing the expression level of each
OXPHOS gene by the average value of eight control genes for each well. This
number represents the processed data value.
To score the expression levels of 12 nuclear- and 13 mitochondrial-encoded
OXPHOS genes, we first weighted each gene by its ability to distinguish DMSO
control wells from PGC-1a-treated wells. We calculated the signal-to-noise
ratio49 of each gene using our PGC-1a-treated positive control and DMSO
negative control, and multiplied the expression value of each gene per well by
this signal-to-noise ratio. We then summed these weighted scores over nuclear-
encoded or mitochondrial-encoded OXPHOS genes to derive one score each
for expression within each genome. Composite Z-scores were calculated as
described above.
Similarity between assay profiles. We used the cell-based composite Z-scores
from the ATP, MTT, JC-1 and ROS assays to calculate the root-mean-square
distance between performance vectors, as this statistic gives greater weight to
values far from zero. We obtained centroid statin scores by taking the
arithmetic mean of the composite Z-scores from these four assays.
Identifying structurally related small molecules. We used Pipeline Pilot
(Scitegic) to perform K-means clustering of the molecules based on common
and biologically intuitive chemical features (molecular weight, octanol-water
partition coefficient, number of hydrogen bond donors and acceptors, and
number of rotatable bonds). We set K to 624 to result in an average of
5 compounds per cluster. To detect enrichment for assay performance within
each compound cluster, we performed the Mann-Whitney rank-sum test on
each cluster in each assay.
Note: Supplementary information is available on the Nature Biotechnology website.
ACKNOWLEDGMENTSWe thank Stephanie Norton, Jason Burbank, Mariah Eustice and Nicky Tollidayfor assistance in high-throughput screening; Nathan Billings and Olga Goldbergerfor technical assistance; Oded Shaham, Ken Ross and Paul Clemons forcomputational assistance; and Joel Hirschhorn, Eric Lander and Robert Gould forthoughtful discussions and comments on the manuscript. S.L.S. and T.R.G. areInvestigators of the Howard Hughes Medical Institute. V.K.M. is recipient of aCareer Award in the Biomedical Sciences from the Burroughs Wellcome Fund, aCharles E. Culpeper Scholarship in Medical Science, and a Physician Scientist EarlyCareer Award from the Howard Hughes Medical Institute. This work wassupported by grants from the National Institute of Health (National Institute ofDiabetes and Digestive and Kidney Diseases), the American Diabetes Associationand the Richard and Susan Smith Family Foundation (V.K.M.).
AUTHOR CONTRIBUTIONSV.K.M. conceived of and supervised the project. B.K.W., T.K. and V.K.M. designedthe experiments and analyzed the data. T.J.G., A.R. and B.K.W. carried out
phenotypic screening. D.P. and T.K. carried out GE-HTS experiments. S.L.S. andT.R.G. provided guidance on chemical screening and GE-HTS, respectively, andadvised on analysis. B.K.W., T.K. and V.K.M. wrote the paper.
Published online at http://www.nature.com/naturebiotechnology/
Reprints and permissions information is available online at http://npg.nature.com/
reprintsandpermissions
1. Anderson, S. et al. Sequence and organization of the human mitochondrial genome.Nature 290, 457–465 (1981).
2. Chance, B. & Williams, G.R. Respiratory enzymes in oxidative phosphorylation. III. Thesteady state. J. Biol. Chem. 217, 409–427 (1955).
3. DiMauro, S. & Schon, E.A. Mitochondrial respiratory-chain diseases. N. Engl. J. Med.348, 2656–2668 (2003).
4. Mootha, V.K. et al. PGC-1a-responsive genes involved in oxidative phosphorylation arecoordinately downregulated in human diabetes. Nat. Genet. 34, 267–273 (2003).
5. Petersen, K.F. et al. Mitochondrial dysfunction in the elderly: possible role in insulinresistance. Science 300, 1140–1142 (2003).
6. Balaban, R.S., Nemoto, S. & Finkel, T. Mitochondria, oxidants, and aging. Cell 120,483–495 (2005).
7. Kelly, D.P. & Scarpulla, R.C. Transcriptional regulatory circuits controlling mitochon-drial biogenesis and function. Genes Dev. 18, 357–368 (2004).
8. Weinstein, J.N. et al. An information-intensive approach to the molecular pharmacologyof cancer. Science 275, 343–349 (1997).
9. Hughes, T.R. et al. Functional discovery via a compendium of expression profiles. Cell102, 109–126 (2000).
10. Lamb, J. et al. The Connectivity Map: using gene-expression signatures to connectsmall molecules, genes, and disease. Science 313, 1929–1935 (2006).
11. Ramanathan, A., Wang, C. & Schreiber, S.L. Perturbational profiling of a cell-line modelof tumorigenesis by using metabolic measurements. Proc. Natl. Acad. Sci. USA 102,5992–5997 (2005).
12. Leary, S.C., Battersby, B.J., Hansford, R.G. & Moyes, C.D. Interactions bet-ween bioenergetics and mitochondrial biogenesis. Biochim. Biophys. Acta 1365,522–530 (1998).
13. Dolma, S., Lessnick, S.L., Hahn, W.C. & Stockwell, B.R. Identification of genotype-selective antitumor agents using synthetic lethal chemical screening in engineeredhuman tumor cells. Cancer Cell 3, 285–296 (2003).
14. Smiley, S.T. et al. Intracellular heterogeneity in mitochondrial membrane potentialsrevealed by a J-aggregate-forming lipophilic cation JC-1. Proc. Natl. Acad. Sci. USA88, 3671–3675 (1991).
15. Berridge, M.V. & Tan, A.S. Characterization of the cellular reduction of 3-(4,5-dimethylthiazol-2-yl)-2,5-diphenyltetrazolium bromide (MTT): subcellular localization,substrate dependence, and involvement of mitochondrial electron transport in MTTreduction. Arch. Biochem. Biophys. 303, 474–482 (1993).
16. Crouch, S.P., Kozlowski, R., Slater, K.J. & Fletcher, J. The use of ATP bioluminescenceas a measure of cell proliferation and cytotoxicity. J. Immunol. Methods 160, 81–88(1993).
17. Ye, G., Metreveli, N.S., Ren, J. & Epstein, P.N. Metallothionein prevents diabetes-induced deficits in cardiomyocytes by inhibiting reactive oxygen species production.Diabetes 52, 777–783 (2003).
18. Stegmaier, K. et al. Gene expression–based high-throughput screening (GE-HTS) andapplication to leukemia differentiation. Nat. Genet. 36, 257–263 (2004).
19. Peck, D. et al. A method for high-throughput gene expression signature analysis.Genome Biol. 7, R61 (2006).
20. Kim, Y.K. et al. Relationship of stereochemical and skeletal diversity of small moleculesto cellular measurement space. J. Am. Chem. Soc. 126, 14740–14745 (2004).
21. Franz, A.K., Dreyfuss, P.D. & Schreiber, S.L. Synthesis and cellular profiling of diverseorganosilicon small molecules. J. Am. Chem. Soc. 129, 1020–1021 (2007).
22. Larsson, N.G. & Clayton, D.A. Molecular genetic aspects of human mitochondrialdisorders. Annu. Rev. Genet. 29, 151–178 (1995).
23. Clayton, D.A. Transcription of the mammalian mitochondrial genome. Annu. Rev.Biochem. 53, 573–594 (1984).
24. Antonetti, D.A., Reynet, C. & Kahn, C.R. Increased expression of mitochondrial-encoded genes in skeletal muscle of humans with diabetes mellitus. J. Clin. Invest.95, 1383–1388 (1995).
25. Huang, X. et al. Insulin-regulated mitochondrial gene expression is associated withglucose flux in human skeletal muscle. Diabetes 48, 1508–1514 (1999).
26. Heddi, A., Stepien, G., Benke, P.J. & Wallace, D.C. Coordinate induction of energy geneexpression in tissues of mitochondrial disease patients. J. Biol. Chem. 274,22968–22976 (1999).
27. Graham, D.J. et al. Incidence of hospitalized rhabdomyolysis in patients treated withlipid-lowering drugs. J. Am. Med. Assoc. 292, 2585–2590 (2004).
28. Dirks, A.J. & Jones, K.M. Statin-induced apoptosis and skeletal myopathy. Am. J.Physiol. 291, C1208–C1212 (2006).
29. van Vliet, A.K., Negre-Aminou, P., van Thiel, G.C., Bolhuis, P.A. & Cohen, L.H. Action oflovastatin, simvastatin, and pravastatin on sterol synthesis and their antiproliferativeeffect in cultured myoblasts from human striated muscle. Biochem. Pharmacol. 52,1387–1392 (1996).
30. Frendin, T.J. & Swainson, C.P. Acute renal failure secondary to non-traumatic rhabdo-myolysis following amoxapine overdose. N. Z. Med. J. 98, 690–691 (1985).
31. Blessing, W. & Walsh, J.C. Myotonia precipitated by propranolol therapy. Lancet 309,73–74 (1977).
350 VOLUME 26 NUMBER 3 MARCH 2008 NATURE BIOTECHNOLOGY
R E S O U R C E©
2008
Nat
ure
Pub
lishi
ng G
roup
ht
tp://
ww
w.n
atur
e.co
m/n
atur
ebio
tech
nolo
gy

32. Davidson, B.K. Myositis associated with griseofulvin therapy. Am. Fam. Physician 52,1277 (1995).
33. Delobel, P. & Pradinaud, R. Rhabdomyolysis associated with pentamidine isethionatetherapy for American cutaneous leishmaniasis. J. Antimicrob. Chemother. 51,1319–1320 (2003).
34. Rowinsky, E.K. et al. Phase I and pharmacologic study of paclitaxel and cisplatin withgranulocyte colony-stimulating factor: neuromuscular toxicity is dose-limiting. J. Clin.Oncol. 11, 2010–2020 (1993).
35. Aronson, J.K. Ed. Meyler’s Side Effects of Drugs 15th edn. (Elsevier Science,Burlington, Massachusetts, USA, 2006).
36. Bliss, C.I. The toxicity of poisons applied jointly. Ann. Appl. Biol. 26, 585–615(1939).
37. Kelley, D.E., He, J., Menshikova, E.V. & Ritov, V.B. Dysfunction of mitochondria inhuman skeletal muscle in type 2 diabetes. Diabetes 51, 2944–2950 (2002).
38. Houstis, N., Rosen, E.D. & Lander, E.S. Reactive oxygen species have a causal role inmultiple forms of insulin resistance. Nature 440, 944–948 (2006).
39. Lustbader, J.W. et al. ABAD directly links Ab to mitochondrial toxicity in Alzheimer’sdisease. Science 304, 448–452 (2004).
40. Li, W.L., Zheng, H.C., Bukuru, J. & De Kimpe, N. Natural medicines used in thetraditional Chinese medical system for therapy of diabetes mellitus. J. Ethnopharma-col. 92, 1–21 (2004).
41. Bonawitz, N.D., Clayton, D.A. & Shadel, G.S. Initiation and beyond: multiple functionsof the human mitochondrial transcription machinery. Mol. Cell 24, 813–825(2006).
42. Wu, Z. et al. Mechanisms controlling mitochondrial biogenesis and respiration throughthe thermogenic coactivator PGC-1. Cell 98, 115–124 (1999).
43. Mootha, V.K. et al. Erra and Gabpa/b specify PGC-1a-dependent oxidative phosphor-ylation gene expression that is altered in diabetic muscle. Proc. Natl. Acad. Sci. USA101, 6570–6575 (2004).
44. Valle, I., Alvarez-Barrientos, A., Arza, E., Lamas, S. & Monsalve, M. PGC-1alpharegulates the mitochondrial antioxidant defense system in vascular endothelial cells.Cardiovasc. Res. 66, 562–573 (2005).
45. Freyssenet, D., Irrcher, I., Connor, M.K., DiCarlo, M. & Hood, D.A. Calcium-regulatedchanges in mitochondrial phenotype in skeletal muscle cells. Am. J. Phys. 286,1053–1061 (2004).
46. Caprio, S. et al. Improvement of metabolic control in diabetic patients duringmebendazole administration: preliminary studies. Diabetologia 27, 52–55 (1984).
47. Karbowski, M. et al. Opposite effects of microtubule-stabilizing and microtubule-destabilizing drugs on biogenesis of mitochondria in mammalian cells. J. Cell Sci.114, 281–291 (2001).
48. Mitchell, P. Coupling of phosphorylation to electron and hydrogen transfer by a chemi-osmotic type of mechanism. Nature 199, 144–148 (1961).
49. Lee, P.D., Sladek, R., Greenwood, C.M. & Hudson, T.J. Control genes and variability:absence of ubiquitous reference transcripts in diverse mammalian expression studies.Genome Res. 12, 292–297 (2002).
50. Hieronymus, H. et al. Gene expression signature-based chemical genomic predictionidentifies a novel class of HSP90 pathway modulators. Cancer Cell 10, 321–330(2006).
NATURE BIOTECHNOLOGY VOLUME 26 NUMBER 3 MARCH 2008 351
R E S O U R C E©
2008
Nat
ure
Pub
lishi
ng G
roup
ht
tp://
ww
w.n
atur
e.co
m/n
atur
ebio
tech
nolo
gy
nature biotechnology volume 26 number 7 july 2008 831
Corrigendum: Large-scale chemical dissection of mitochondrial functionBridget K Wagner, Toshimori Kitami, Tamara J Gilbert, David Peck, Arvind Ramanathan, Stuart L Schreiber, Todd R Golub & Vamsi K MoothaNat. Biotechnol. 26, 343–351 (2008); published online 24 February 2008; corrected after print 8 July 2008
In the version of this article initially published, on p.348, column 2, paragraph 2, line 7, the following sentence was incorrect: “Statins block the synthesis of cholesterol—a precursor to ubiquinone….” It should have read “Statins block the synthesis of mevalonate, a precursor not only of cholesterol but also ubiquinone, ….” The error has been corrected in the HTML and PDF versions of the article.
Corrigendum: Isolation and directed differentiation of neural crest stem cells derived from human embryonic stem cellsGabsang Lee, Hyesoo Kim, Yechiel Elkabetz, George Al Shamy, Georgia Panagiotakos, Tiziano Barberi, Viviane Tabar & Lorenz StuderNat. Biotechnol. 25, 1468–1475 (2007); published online 25 November 2007; corrected after print 8 July 2008
In the version of this article initially published, a reference was missing from the first paragraph. A new sentence and the reference (no. 6) have been added: “A recent study characterized neural crest differentiation from cloned bovine blastocysts via a neural rosette intermediate6. Other….” Subsequent references have been renumbered. The corrections have been made in the HTML and PDF versions of the article.
Erratum: Looking forward, looking backAnonymousNat. Biotechnol. 26, 475 (2008); published online May 2008; corrected after print 13 June 2008
In the version of this article initially published, in paragraph 4, the generic name and ligand given for Avastin are incorrect. The correct generic name is bevacizumab and its target is VEGF (vascular endothelial growth factor). The error has been corrected in the HTML and PDF versions of the article.
Erratum: Is personalized medicine finally arriving?Malorye AllisonNat. Biotechnol. 26, 509–517 (2008); published May, 2008; corrected after print 8 July 2008
In the version of this article initially published, Table 1 (pp. 510–511) contained two errors. In the entry for Agendia, the product Mammaprint was described as providing information on chemotherapy options for breast cancer patients. In fact Mammaprint is a prognostic test. In the entry for Genomic Health, the product Oncotype Dx was described as providing information on breast cancer recurrence. Oncotype DX also provides information on the response to chemotherapy. The error has been corrected in the HTML and PDF versions of the article.
corr igenda and errata©
2008
Nat
ure
Pub
lishi
ng G
roup
ht
tp://
ww
w.n
atur
e.co
m/n
atur
ebio
tech
nolo
gy