Embed Size (px)
Citation preview
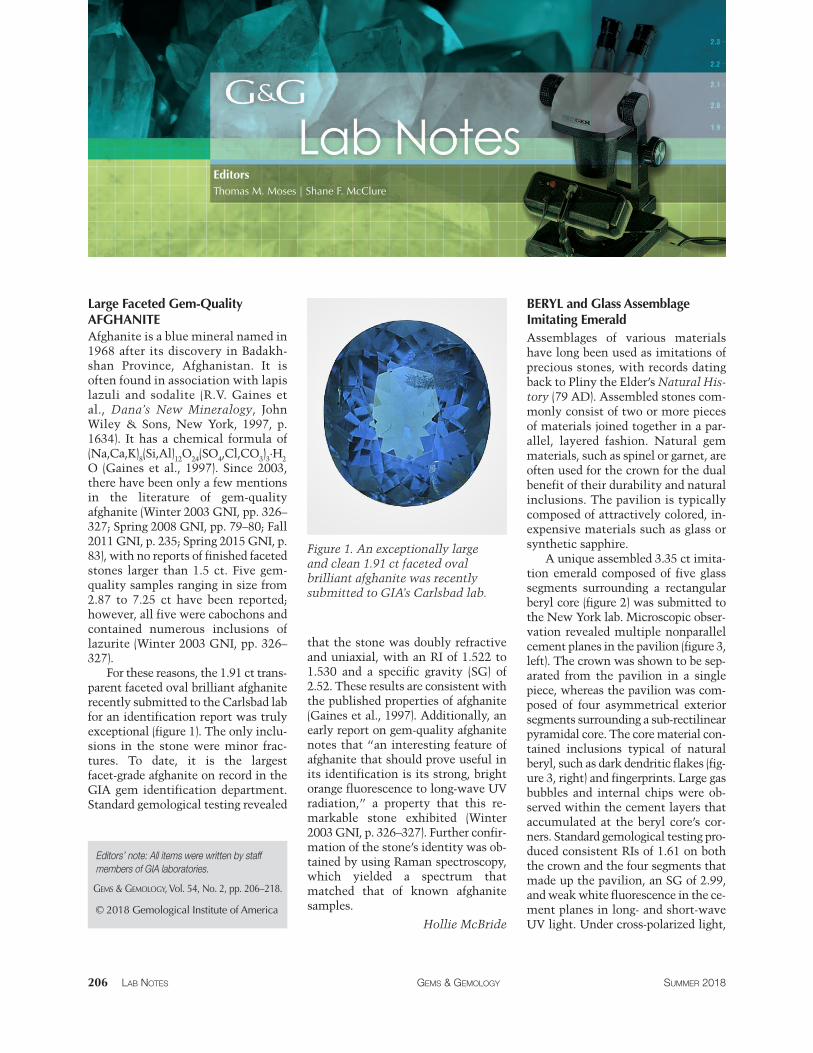
Figure 1. An exceptionally large and clean 1.91 ct faceted oval brilliant afghanite was recently submitted to GIA’s Carlsbad lab.
Editors Thomas M. Moses | Shane F. McClure
© 2018 Gemological Institute of America
GEMS & GEMOLOGY, Vol. 54, No. 2, pp. 206–218.
Editors’ note: All items were written by staff members of GIA laboratories.
206 LAB NOTES GEMS & GEMOLOGY SUMMER 2018
Large Faceted Gem-Quality AFGHANITE Afghanite is a blue mineral named in 1968 after its discovery in Badakh-shan Province, Afghanistan. It is often found in association with lapis lazuli and sodalite (R.V. Gaines et al., Dana’s New Mineralogy, John Wiley & Sons, New York, 1997, p. 1634). It has a chemical formula of (Na,Ca,K) (Si,Al) O (SO ,Cl,CO ) ·H 8 12 24 4 3 3 2 O (Gaines et al., 1997). Since 2003, there have been only a few mentions in the literature of gem-quality afghanite (Winter 2003 GNI, pp. 326– 327; Spring 2008 GNI, pp. 79–80; Fall 2011 GNI, p. 235; Spring 2015 GNI, p. 83), with no reports of finished faceted stones larger than 1.5 ct. Five gem-quality samples ranging in size from 2.87 to 7.25 ct have been reported; however, all five were cabochons and contained numerous inclusions of lazurite (Winter 2003 GNI, pp. 326– 327).
For these reasons, the 1.91 ct trans-parent faceted oval brilliant afghanite recently submitted to the Carlsbad lab for an identification report was truly exceptional (figure 1). The only inclu-sions in the stone were minor frac-tures. To date, it is the largest facet-grade afghanite on record in the GIA gem identification department. Standard gemological testing revealed
that the stone was doubly refractive and uniaxial, with an RI of 1.522 to 1.530 and a specific gravity (SG) of 2.52. These results are consistent with the published properties of afghanite (Gaines et al., 1997). Additionally, an early report on gem-quality afghanite notes that “an interesting feature of afghanite that should prove useful in its identification is its strong, bright orange fluorescence to long-wave UV radiation,” a property that this re-markable stone exhibited (Winter 2003 GNI, p. 326–327). Further confir-mation of the stone’s identity was ob-tained by using Raman spectroscopy, which yielded a spectrum that matched that of known afghanite samples.
Hollie McBride
BERYL and Glass Assemblage Imitating Emerald Assemblages of various materials have long been used as imitations of precious stones, with records dating back to Pliny the Elder’s Natural His-tory (79 AD). Assembled stones com-monly consist of two or more pieces of materials joined together in a par-allel, layered fashion. Natural gem materials, such as spinel or garnet, are often used for the crown for the dual benefit of their durability and natural inclusions. The pavilion is typically composed of attractively colored, in-expensive materials such as glass or synthetic sapphire.
A unique assembled 3.35 ct imita-tion emerald composed of five glass segments surrounding a rectangular beryl core (figure 2) was submitted to the New York lab. Microscopic obser-vation revealed multiple nonparallel cement planes in the pavilion (figure 3, left). The crown was shown to be sep-arated from the pavilion in a single piece, whereas the pavilion was com-posed of four asymmetrical exterior segments surrounding a sub-rectilinear pyramidal core. The core material con-tained inclusions typical of natural beryl, such as dark dendritic flakes (fig-ure 3, right) and fingerprints. Large gas bubbles and internal chips were ob-served within the cement layers that accumulated at the beryl core’s cor-ners. Standard gemological testing pro-duced consistent RIs of 1.61 on both the crown and the four segments that made up the pavilion, an SG of 2.99, and weak white fluorescence in the ce-ment planes in long- and short-wave UV light. Under cross-polarized light,
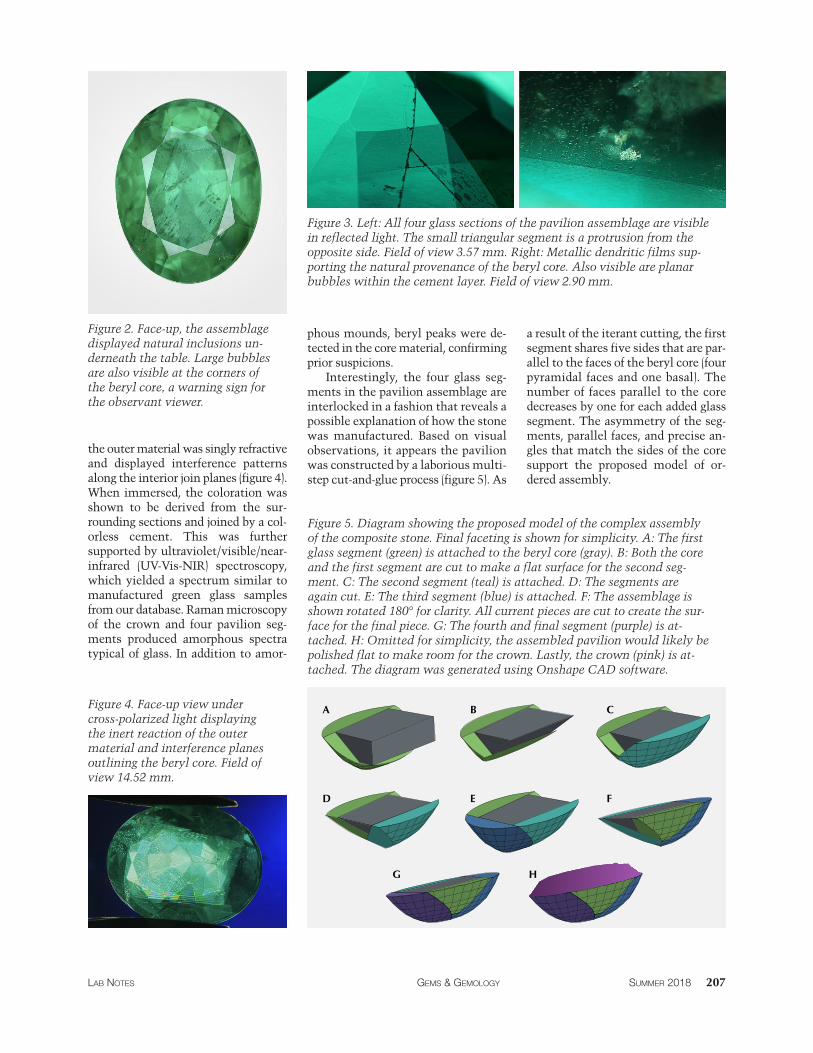
Figure 2. Face-up, the assemblage displayed natural inclusions un-derneath the table. Large bubbles are also visible at the corners of the beryl core, a warning sign for the observant viewer.
the outer material was singly refractive and displayed interference patterns along the interior join planes (figure 4). When immersed, the coloration was shown to be derived from the sur-rounding sections and joined by a col-orless cement. This was further supported by ultraviolet/visible/near-infrared (UV-Vis-NIR) spectroscopy, which yielded a spectrum similar to manufactured green glass samples from our database. Raman microscopy of the crown and four pavilion seg-ments produced amorphous spectra typical of glass. In addition to amor-
Figure 3. Left: All four glass sections of the pavilion assemblage are visible in reflected light. The small triangular segment is a protrusion from the opposite side. Field of view 3.57 mm. Right: Metallic dendritic films sup-porting the natural provenance of the beryl core. Also visible are planar bubbles within the cement layer. Field of view 2.90 mm.
phous mounds, beryl peaks were de-tected in the core material, confirming prior suspicions.
Interestingly, the four glass seg-ments in the pavilion assemblage are interlocked in a fashion that reveals a possible explanation of how the stone was manufactured. Based on visual observations, it appears the pavilion was constructed by a laborious multi-step cut-and-glue process (figure 5). As
a result of the iterant cutting, the first segment shares five sides that are par-allel to the faces of the beryl core (four pyramidal faces and one basal). The number of faces parallel to the core decreases by one for each added glass segment. The asymmetry of the seg-ments, parallel faces, and precise an-gles that match the sides of the core support the proposed model of or-dered assembly.
Figure 4. Face-up view under cross-polarized light displaying the inert reaction of the outer material and interference planes outlining the beryl core. Field of view 14.52 mm.
Figure 5. Diagram showing the proposed model of the complex assembly of the composite stone. Final faceting is shown for simplicity. A: The first glass segment (green) is attached to the beryl core (gray). B: Both the core and the first segment are cut to make a flat surface for the second seg-ment. C: The second segment (teal) is attached. D: The segments are again cut. E: The third segment (blue) is attached. F: The assemblage is shown rotated 180° for clarity. All current pieces are cut to create the sur-face for the final piece. G: The fourth and final segment (purple) is at-tached. H: Omitted for simplicity, the assembled pavilion would likely be polished flat to make room for the crown. Lastly, the crown (pink) is at-tached. The diagram was generated using Onshape CAD software.
A
D
B
E
G H
C
F
LAB NOTES GEMS & GEMOLOGY SUMMER 2018 207
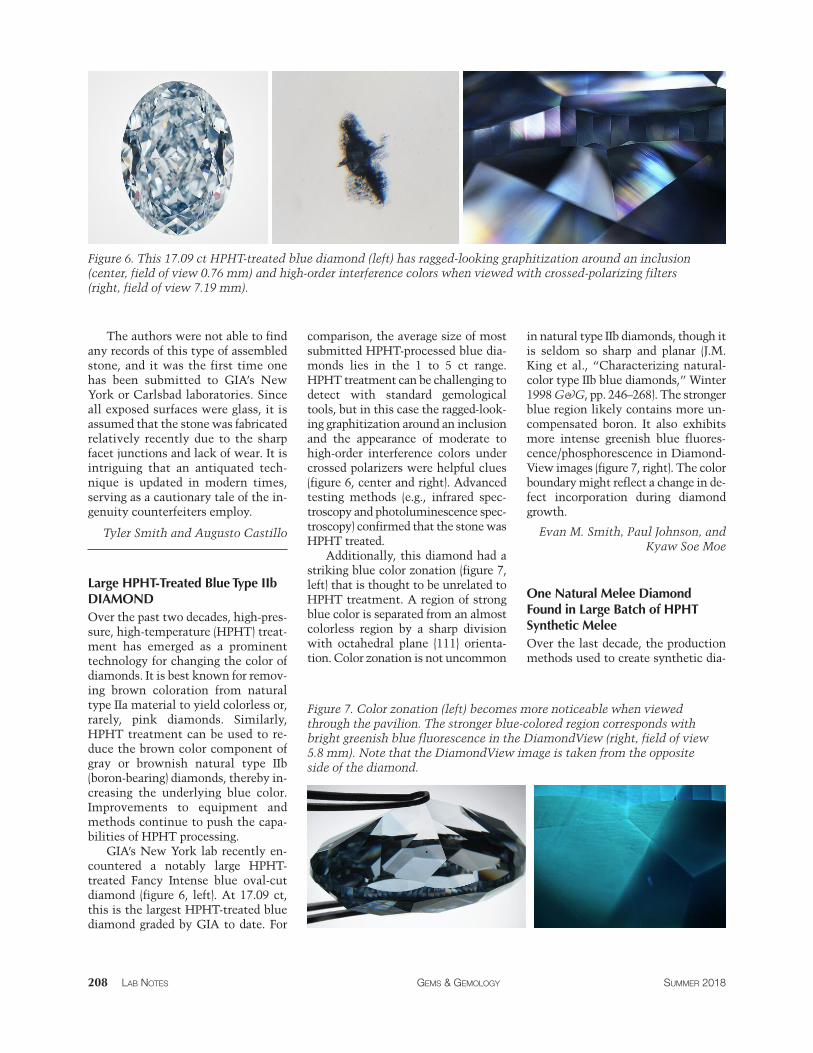
Figure 6. This 17.09 ct HPHT-treated blue diamond (left) has ragged-looking graphitization around an inclusion (center, field of view 0.76 mm) and high-order interference colors when viewed with crossed-polarizing filters (right, field of view 7.19 mm).
The authors were not able to find any records of this type of assembled stone, and it was the first time one has been submitted to GIA’s New York or Carlsbad laboratories. Since all exposed surfaces were glass, it is assumed that the stone was fabricated relatively recently due to the sharp facet junctions and lack of wear. It is intriguing that an antiquated tech-nique is updated in modern times, serving as a cautionary tale of the in-genuity counterfeiters employ.
Tyler Smith and Augusto Castillo
Large HPHT-Treated Blue Type IIb DIAMOND Over the past two decades, high-pres-sure, high-temperature (HPHT) treat-ment has emerged as a prominent technology for changing the color of diamonds. It is best known for remov-ing brown coloration from natural type IIa material to yield colorless or, rarely, pink diamonds. Similarly, HPHT treatment can be used to re-duce the brown color component of gray or brownish natural type IIb (boron-bearing) diamonds, thereby in-creasing the underlying blue color. Improvements to equipment and methods continue to push the capa-bilities of HPHT processing.
GIA’s New York lab recently en-countered a notably large HPHT-treated Fancy Intense blue oval-cut diamond (figure 6, left). At 17.09 ct, this is the largest HPHT-treated blue diamond graded by GIA to date. For
comparison, the average size of most submitted HPHT-processed blue dia-monds lies in the 1 to 5 ct range. HPHT treatment can be challenging to detect with standard gemological tools, but in this case the ragged-look-ing graphitization around an inclusion and the appearance of moderate to high-order interference colors under crossed polarizers were helpful clues (figure 6, center and right). Advanced testing methods (e.g., infrared spec-troscopy and photoluminescence spec-troscopy) confirmed that the stone was HPHT treated.
Additionally, this diamond had a striking blue color zonation (figure 7, left) that is thought to be unrelated to HPHT treatment. A region of strong blue color is separated from an almost colorless region by a sharp division with octahedral plane {111} orienta-tion. Color zonation is not uncommon
in natural type IIb diamonds, though it is seldom so sharp and planar (J.M. King et al., “Characterizing natural-color type IIb blue diamonds,” Winter 1998 G&G, pp. 246–268). The stronger blue region likely contains more un-compensated boron. It also exhibits more intense greenish blue fluores-cence/phosphorescence in Diamond-View images (figure 7, right). The color boundary might reflect a change in de-fect incorporation during diamond growth.
Evan M. Smith, Paul Johnson, and Kyaw Soe Moe
One Natural Melee Diamond Found in Large Batch of HPHT Synthetic Melee Over the last decade, the production methods used to create synthetic dia-
Figure 7. Color zonation (left) becomes more noticeable when viewed through the pavilion. The stronger blue-colored region corresponds with bright greenish blue fluorescence in the DiamondView (right, field of view 5.8 mm). Note that the DiamondView image is taken from the opposite side of the diamond.
208 LAB NOTES GEMS & GEMOLOGY SUMMER 2018
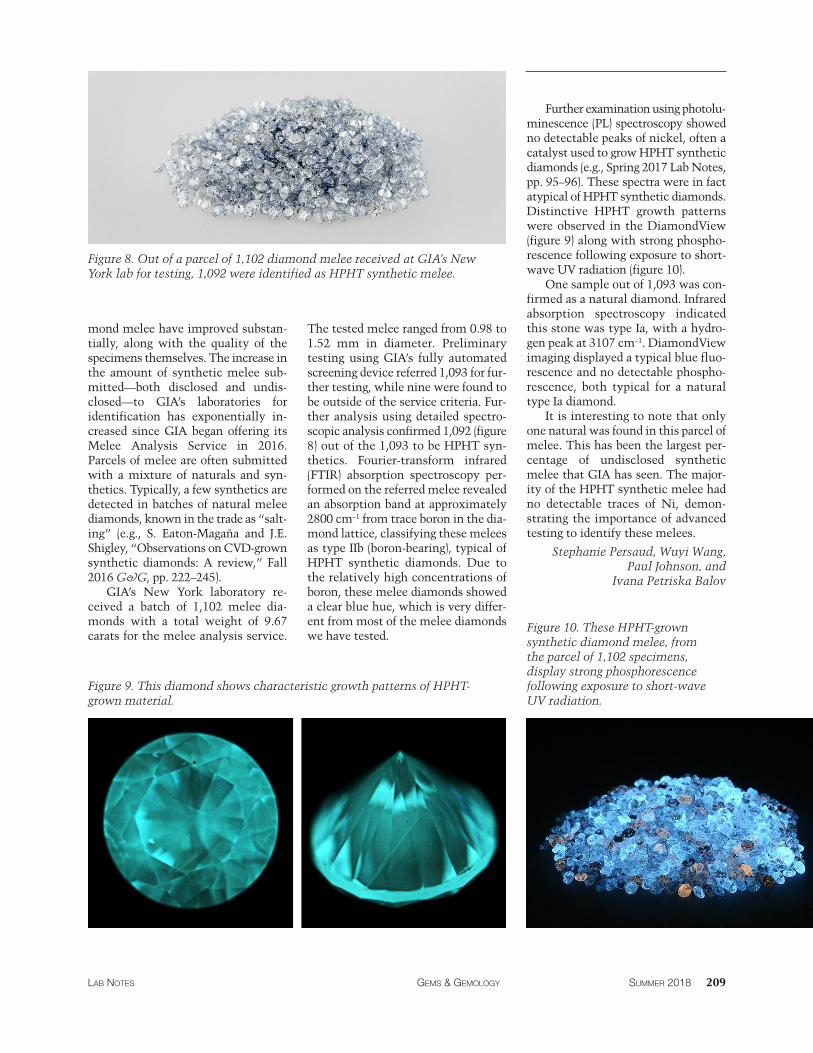
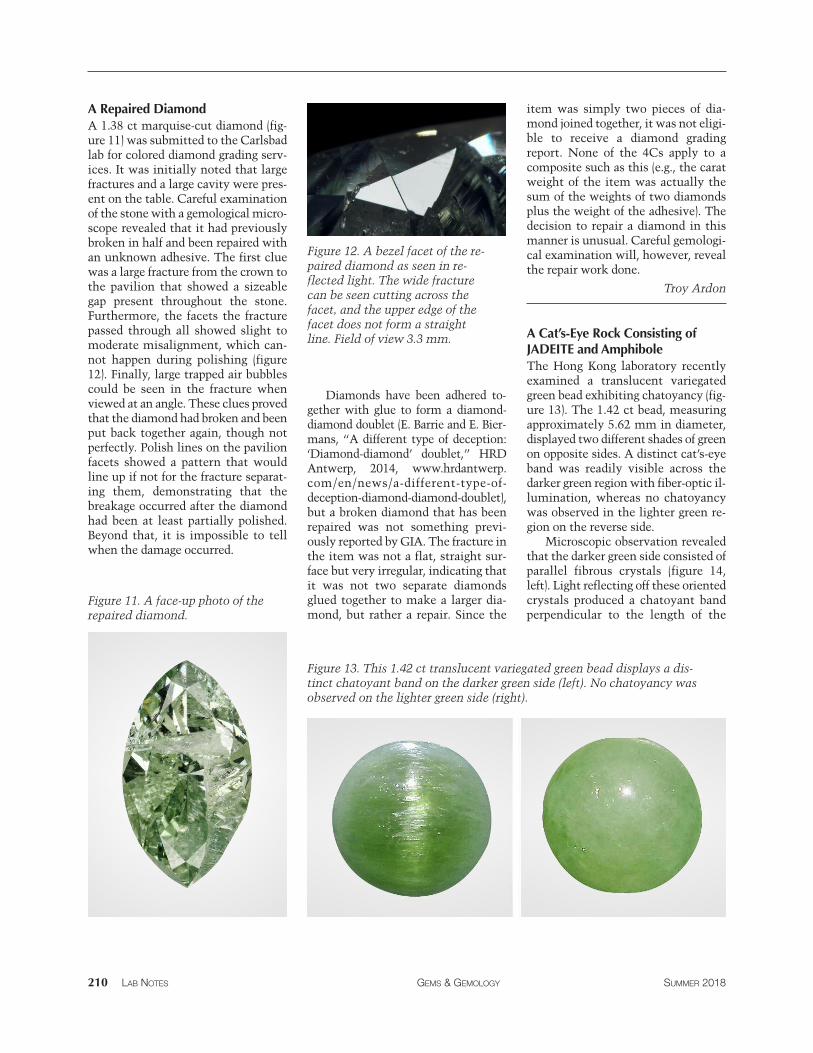
Figure 8. Out of a parcel of 1,102 diamond melee received at GIA’s New York lab for testing, 1,092 were identified as HPHT synthetic melee.
mond melee have improved substan-tially, along with the quality of the specimens themselves. The increase in the amount of synthetic melee sub-mitted—both disclosed and undis-closed—to GIA’s laboratories for identification has exponentially in-creased since GIA began offering its Melee Analysis Service in 2016. Parcels of melee are often submitted with a mixture of naturals and syn-thetics. Typically, a few synthetics are detected in batches of natural melee diamonds, known in the trade as “salt-ing” (e.g., S. Eaton-Magaña and J.E. Shigley, “Observations on CVD-grown synthetic diamonds: A review,” Fall 2016 G&G, pp. 222–245).
GIA’s New York laboratory re-ceived a batch of 1,102 melee dia-monds with a total weight of 9.67 carats for the melee analysis service.
The tested melee ranged from 0.98 to 1.52 mm in diameter. Preliminary testing using GIA’s fully automated screening device referred 1,093 for fur-ther testing, while nine were found to be outside of the service criteria. Fur-ther analysis using detailed spectro-scopic analysis confirmed 1,092 (figure 8) out of the 1,093 to be HPHT syn-thetics. Fourier-transform infrared (FTIR) absorption spectroscopy per-formed on the referred melee revealed an absorption band at approximately 2800 cm–1 from trace boron in the dia-mond lattice, classifying these melees as type IIb (boron-bearing), typical of HPHT synthetic diamonds. Due to the relatively high concentrations of boron, these melee diamonds showed a clear blue hue, which is very differ-ent from most of the melee diamonds we have tested.
Further examination using photolu-minescence (PL) spectroscopy showed no detectable peaks of nickel, often a catalyst used to grow HPHT synthetic diamonds (e.g., Spring 2017 Lab Notes, pp. 95–96). These spectra were in fact atypical of HPHT synthetic diamonds. Distinctive HPHT growth patterns were observed in the DiamondView (figure 9) along with strong phospho-rescence following exposure to short-wave UV radiation (figure 10).
One sample out of 1,093 was con-firmed as a natural diamond. Infrared absorption spectroscopy indicated this stone was type Ia, with a hydro-gen peak at 3107 cm–1. DiamondView imaging displayed a typical blue fluo-rescence and no detectable phospho-rescence, both typical for a natural type Ia diamond.
It is interesting to note that only one natural was found in this parcel of melee. This has been the largest per-centage of undisclosed synthetic melee that GIA has seen. The major-ity of the HPHT synthetic melee had no detectable traces of Ni, demon-strating the importance of advanced testing to identify these melees.
Stephanie Persaud, Wuyi Wang, Paul Johnson, and
Ivana Petriska Balov
Figure 9. This diamond shows characteristic growth patterns of HPHT-grown material.
Figure 10. These HPHT-grown synthetic diamond melee, from the parcel of 1,102 specimens, display strong phosphorescence following exposure to short-wave UV radiation.
LAB NOTES GEMS & GEMOLOGY SUMMER 2018 209
A Repaired Diamond A 1.38 ct marquise-cut diamond (fig-ure 11) was submitted to the Carlsbad lab for colored diamond grading serv-ices. It was initially noted that large fractures and a large cavity were pres-ent on the table. Careful examination of the stone with a gemological micro-scope revealed that it had previously broken in half and been repaired with an unknown adhesive. The first clue was a large fracture from the crown to the pavilion that showed a sizeable gap present throughout the stone. Furthermore, the facets the fracture passed through all showed slight to moderate misalignment, which can-not happen during polishing (figure 12). Finally, large trapped air bubbles could be seen in the fracture when viewed at an angle. These clues proved that the diamond had broken and been put back together again, though not perfectly. Polish lines on the pavilion facets showed a pattern that would line up if not for the fracture separat-ing them, demonstrating that the breakage occurred after the diamond had been at least partially polished. Beyond that, it is impossible to tell when the damage occurred.
Figure 11. A face-up photo of the repaired diamond.
Figure 12. A bezel facet of the re-paired diamond as seen in re-flected light. The wide fracture can be seen cutting across the facet, and the upper edge of the facet does not form a straight line. Field of view 3.3 mm.
Diamonds have been adhered to-gether with glue to form a diamond-diamond doublet (E. Barrie and E. Bier-mans, “A different type of deception: ‘Diamond-diamond’ doublet,” HRD Antwerp, 2014, www.hrdantwerp. com/en/news/a-different-type-of-deception-diamond-diamond-doublet), but a broken diamond that has been repaired was not something previ-ously reported by GIA. The fracture in the item was not a flat, straight sur-face but very irregular, indicating that it was not two separate diamonds glued together to make a larger dia-mond, but rather a repair. Since the
item was simply two pieces of dia-mond joined together, it was not eligi-ble to receive a diamond grading report. None of the 4Cs apply to a composite such as this (e.g., the carat weight of the item was actually the sum of the weights of two diamonds plus the weight of the adhesive). The decision to repair a diamond in this manner is unusual. Careful gemologi-cal examination will, however, reveal the repair work done.
Troy Ardon
A Cat’s-Eye Rock Consisting of JADEITE and Amphibole The Hong Kong laboratory recently examined a translucent variegated green bead exhibiting chatoyancy (fig-ure 13). The 1.42 ct bead, measuring approximately 5.62 mm in diameter, displayed two different shades of green on opposite sides. A distinct cat’s-eye band was readily visible across the darker green region with fiber-optic il-lumination, whereas no chatoyancy was observed in the lighter green re-gion on the reverse side.
Microscopic observation revealed that the darker green side consisted of parallel fibrous crystals (figure 14, left). Light reflecting off these oriented crystals produced a chatoyant band perpendicular to the length of the
Figure 13. This 1.42 ct translucent variegated green bead displays a dis-tinct chatoyant band on the darker green side (left). No chatoyancy was observed on the lighter green side (right).
210 LAB NOTES GEMS & GEMOLOGY SUMMER 2018
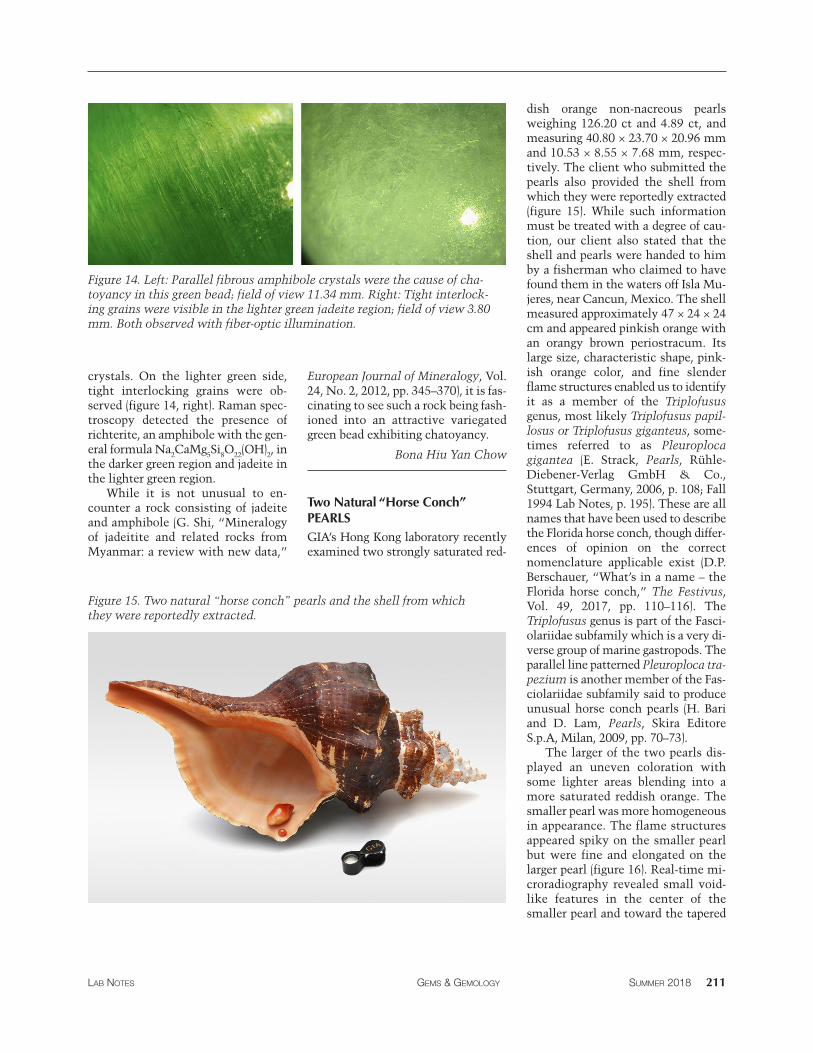
Figure 14. Left: Parallel fibrous amphibole crystals were the cause of cha-toyancy in this green bead; field of view 11.34 mm. Right: Tight interlock-ing grains were visible in the lighter green jadeite region; field of view 3.80 mm. Both observed with fiber-optic illumination.
crystals. On the lighter green side, tight interlocking grains were ob-served (figure 14, right). Raman spec-troscopy detected the presence of richterite, an amphibole with the gen-eral formula Na CaMg Si O (OH) , in 2 5 8 22 2 the darker green region and jadeite in the lighter green region.
While it is not unusual to en-counter a rock consisting of jadeite and amphibole (G. Shi, “Mineralogy of jadeitite and related rocks from Myanmar: a review with new data,”
European Journal of Mineralogy, Vol. 24, No. 2, 2012, pp. 345–370), it is fas-cinating to see such a rock being fash-ioned into an attractive variegated green bead exhibiting chatoyancy.
Bona Hiu Yan Chow
Two Natural “Horse Conch” PEARLS GIA’s Hong Kong laboratory recently examined two strongly saturated red-
Figure 15. Two natural “horse conch” pearls and the shell from which they were reportedly extracted.
dish orange non-nacreous pearls weighing 126.20 ct and 4.89 ct, and measuring 40.80 × 23.70 × 20.96 mm and 10.53 × 8.55 × 7.68 mm, respec-tively. The client who submitted the pearls also provided the shell from which they were reportedly extracted (figure 15). While such information must be treated with a degree of cau-tion, our client also stated that the shell and pearls were handed to him by a fisherman who claimed to have found them in the waters off Isla Mu-jeres, near Cancun, Mexico. The shell measured approximately 47 × 24 × 24 cm and appeared pinkish orange with an orangy brown periostracum. Its large size, characteristic shape, pink-ish orange color, and fine slender flame structures enabled us to identify it as a member of the Triplofusus genus, most likely Triplofusus papil-losus or Triplofusus giganteus, some-times referred to as Pleuroploca gigantea (E. Strack, Pearls, Rühle-Diebener-Verlag GmbH & Co., Stuttgart, Germany, 2006, p. 108; Fall 1994 Lab Notes, p. 195). These are all names that have been used to describe the Florida horse conch, though differ-ences of opinion on the correct nomenclature applicable exist (D.P. Berschauer, “What’s in a name – the Florida horse conch,” The Festivus, Vol. 49, 2017, pp. 110–116). The Triplofusus genus is part of the Fasci-olariidae subfamily which is a very di-verse group of marine gastropods. The parallel line patterned Pleuroploca tra-pezium is another member of the Fas-ciolariidae subfamily said to produce unusual horse conch pearls (H. Bari and D. Lam, Pearls, Skira Editore S.p.A, Milan, 2009, pp. 70–73).
The larger of the two pearls dis-played an uneven coloration with some lighter areas blending into a more saturated reddish orange. The smaller pearl was more homogeneous in appearance. The flame structures appeared spiky on the smaller pearl but were fine and elongated on the larger pearl (figure 16). Real-time mi-croradiography revealed small void-like features in the center of the smaller pearl and toward the tapered
LAB NOTES GEMS & GEMOLOGY SUMMER 2018 211
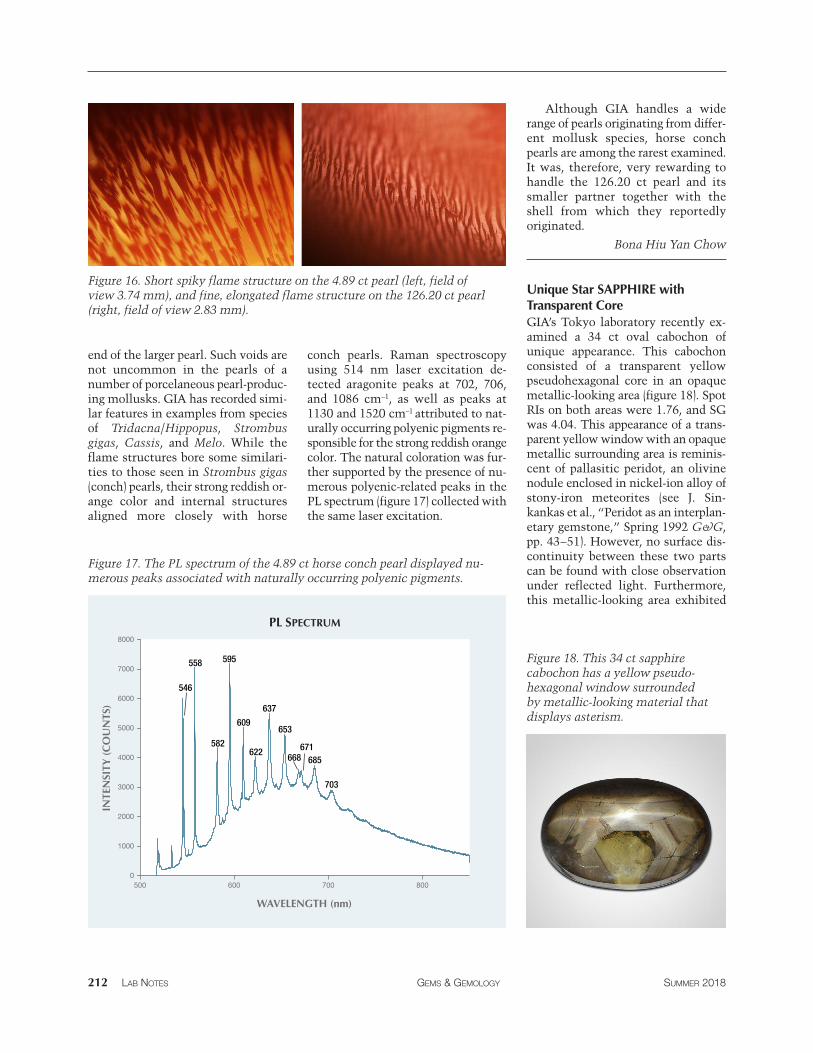
Figure 16. Short spiky flame structure on the 4.89 ct pearl (left, field of view 3.74 mm), and fine, elongated flame structure on the 126.20 ct pearl (right, field of view 2.83 mm).
end of the larger pearl. Such voids are not uncommon in the pearls of a number of porcelaneous pearl-produc-ing mollusks. GIA has recorded simi-lar features in examples from species of Tridacna/Hippopus, Strombus gigas, Cassis, and Melo. While the flame structures bore some similari-ties to those seen in Strombus gigas (conch) pearls, their strong reddish or-ange color and internal structures aligned more closely with horse
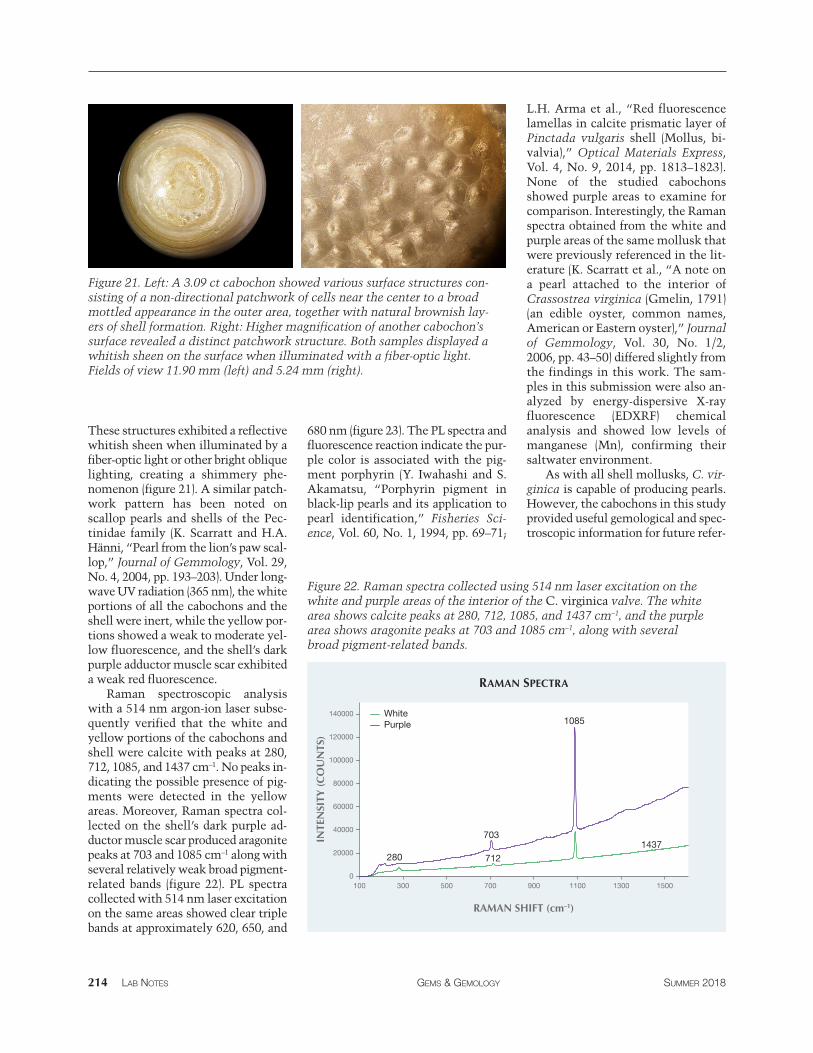
conch pearls. Raman spectroscopy using 514 nm laser excitation de-tected aragonite peaks at 702, 706, and 1086 cm–1 , as well as peaks at 1130 and 1520 cm–1 attributed to nat-urally occurring polyenic pigments re-sponsible for the strong reddish orange color. The natural coloration was fur-ther supported by the presence of nu-merous polyenic-related peaks in the PL spectrum (figure 17) collected with the same laser excitation.
Although GIA handles a wide range of pearls originating from differ-ent mollusk species, horse conch pearls are among the rarest examined. It was, therefore, very rewarding to handle the 126.20 ct pearl and its smaller partner together with the shell from which they reportedly originated.
Bona Hiu Yan Chow
Figure 17. The PL spectrum of the 4.89 ct horse conch pearl displayed nu-merous peaks associated with naturally occurring polyenic pigments.
Unique Star SAPPHIRE with Transparent Core GIA’s Tokyo laboratory recently ex-amined a 34 ct oval cabochon of unique appearance. This cabochon consisted of a transparent yellow pseudohexagonal core in an opaque metallic-looking area (figure 18). Spot RIs on both areas were 1.76, and SG was 4.04. This appearance of a trans-parent yellow window with an opaque metallic surrounding area is reminis-cent of pallasitic peridot, an olivine nodule enclosed in nickel-ion alloy of stony-iron meteorites (see J. Sin-kankas et al., “Peridot as an interplan-etary gemstone,” Spring 1992 G&G, pp. 43–51). However, no surface dis-continuity between these two parts can be found with close observation under reflected light. Furthermore, this metallic-looking area exhibited
PL SPECTRUM
500 600 700 800
WAVELENGTH (nm)
INTE
NSI
TY (
CO
UN
TS)
0
1000
2000
3000
4000
5000
6000
7000
8000
546
558
582
595
609
637
622
653
668 671 685
703
Figure 18. This 34 ct sapphire cabochon has a yellow pseudo-hexagonal window surrounded by metallic-looking material that displays asterism.
212 LAB NOTES GEMS & GEMOLOGY SUMMER 2018
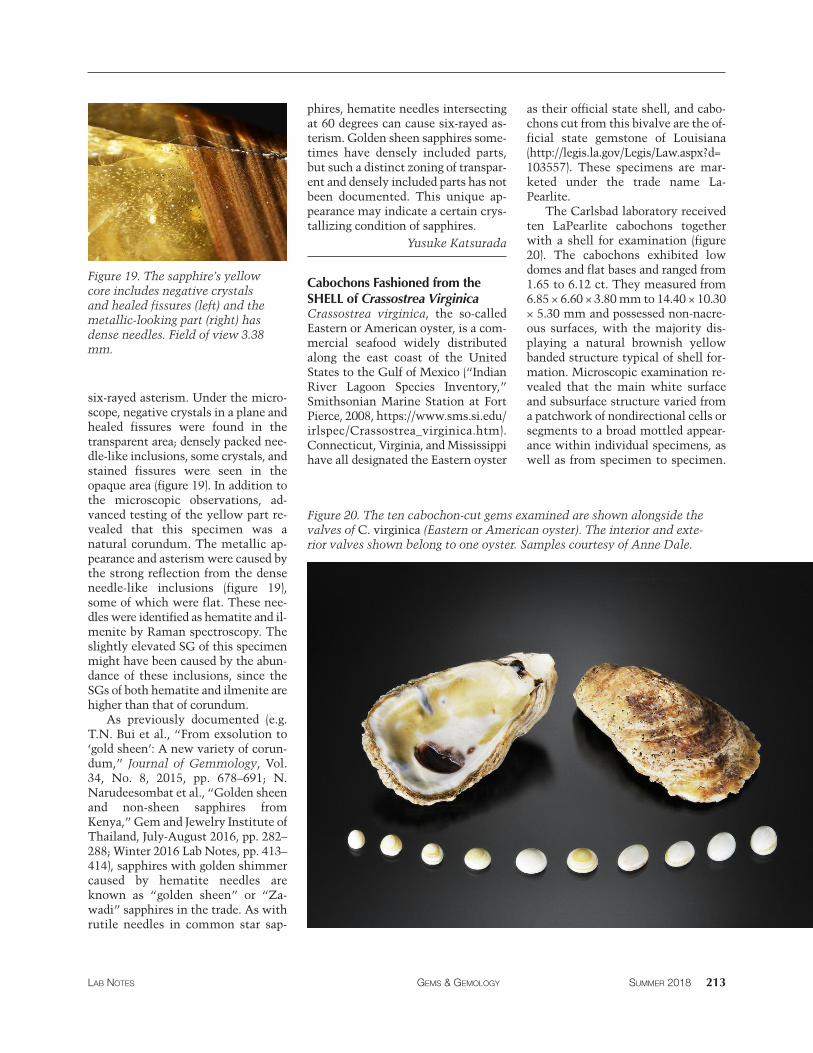
Figure 19. The sapphire’s yellow core includes negative crystals and healed fissures (left) and the metallic-looking part (right) has dense needles. Field of view 3.38 mm.
six-rayed asterism. Under the micro-scope, negative crystals in a plane and healed fissures were found in the transparent area; densely packed nee-dle-like inclusions, some crystals, and stained fissures were seen in the opaque area (figure 19). In addition to the microscopic observations, ad-vanced testing of the yellow part re-vealed that this specimen was a natural corundum. The metallic ap-pearance and asterism were caused by the strong reflection from the dense needle-like inclusions (figure 19), some of which were flat. These nee-dles were identified as hematite and il-menite by Raman spectroscopy. The slightly elevated SG of this specimen might have been caused by the abun-dance of these inclusions, since the SGs of both hematite and ilmenite are higher than that of corundum.
As previously documented (e.g. T.N. Bui et al., “From exsolution to ‘gold sheen’: A new variety of corun-dum,” Journal of Gemmology, Vol. 34, No. 8, 2015, pp. 678–691; N. Narudeesombat et al., “Golden sheen and non-sheen sapphires from Kenya,” Gem and Jewelry Institute of Thailand, July-August 2016, pp. 282– 288; Winter 2016 Lab Notes, pp. 413– 414), sapphires with golden shimmer caused by hematite needles are known as “golden sheen” or “Za-wadi” sapphires in the trade. As with rutile needles in common star sap-
phires, hematite needles intersecting at 60 degrees can cause six-rayed as-terism. Golden sheen sapphires some-times have densely included parts, but such a distinct zoning of transpar-ent and densely included parts has not been documented. This unique ap-pearance may indicate a certain crys-tallizing condition of sapphires.
Yusuke Katsurada
Cabochons Fashioned from the SHELL of Crassostrea Virginica Crassostrea virginica, the so-called Eastern or American oyster, is a com-mercial seafood widely distributed along the east coast of the United States to the Gulf of Mexico (“Indian River Lagoon Species Inventory,” Smithsonian Marine Station at Fort Pierce, 2008, https://www.sms.si.edu/ irlspec/Crassostrea_virginica.htm). Connecticut, Virginia, and Mississippi have all designated the Eastern oyster
as their official state shell, and cabo-chons cut from this bivalve are the of-ficial state gemstone of Louisiana (http://legis.la.gov/Legis/Law.aspx?d= 103557). These specimens are mar-keted under the trade name La-Pearlite.
The Carlsbad laboratory received ten LaPearlite cabochons together with a shell for examination (figure 20). The cabochons exhibited low domes and flat bases and ranged from 1.65 to 6.12 ct. They measured from 6.85 × 6.60 × 3.80 mm to 14.40 × 10.30 × 5.30 mm and possessed non-nacre-ous surfaces, with the majority dis-playing a natural brownish yellow banded structure typical of shell for-mation. Microscopic examination re-vealed that the main white surface and subsurface structure varied from a patchwork of nondirectional cells or segments to a broad mottled appear-ance within individual specimens, as well as from specimen to specimen.
Figure 20. The ten cabochon-cut gems examined are shown alongside the valves of C. virginica (Eastern or American oyster). The interior and exte-rior valves shown belong to one oyster. Samples courtesy of Anne Dale.
LAB NOTES GEMS & GEMOLOGY SUMMER 2018 213
These structures exhibited a reflective 680 nm (figure 23). The PL spectra and whitish sheen when illuminated by a fluorescence reaction indicate the pur-fiber-optic light or other bright oblique ple color is associated with the pig-lighting, creating a shimmery phe- ment porphyrin (Y. Iwahashi and S. nomenon (figure 21). A similar patch- Akamatsu, “Porphyrin pigment in work pattern has been noted on black-lip pearls and its application to scallop pearls and shells of the Pec- pearl identification,” Fisheries Sci-tinidae family (K. Scarratt and H.A. ence, Vol. 60, No. 1, 1994, pp. 69–71; Hänni, “Pearl from the lion’s paw scal-lop,” Journal of Gemmology, Vol. 29, No. 4, 2004, pp. 193–203). Under long-wave UV radiation (365 nm), the white portions of all the cabochons and the shell were inert, while the yellow por-tions showed a weak to moderate yel-low fluorescence, and the shell’s dark purple adductor muscle scar exhibited a weak red fluorescence.
Raman spectroscopic analysis with a 514 nm argon-ion laser subse-quently verified that the white and yellow portions of the cabochons and shell were calcite with peaks at 280, 712, 1085, and 1437 cm–1 . No peaks in-dicating the possible presence of pig-ments were detected in the yellow areas. Moreover, Raman spectra col-lected on the shell’s dark purple ad-ductor muscle scar produced aragonite peaks at 703 and 1085 cm–1 along with several relatively weak broad pigment-related bands (figure 22). PL spectra collected with 514 nm laser excitation on the same areas showed clear triple bands at approximately 620, 650, and
Figure 21. Left: A 3.09 ct cabochon showed various surface structures con-sisting of a non-directional patchwork of cells near the center to a broad mottled appearance in the outer area, together with natural brownish lay-ers of shell formation. Right: Higher magnification of another cabochon’s surface revealed a distinct patchwork structure. Both samples displayed a whitish sheen on the surface when illuminated with a fiber-optic light. Fields of view 11.90 mm (left) and 5.24 mm (right).
L.H. Arma et al., “Red fluorescence lamellas in calcite prismatic layer of Pinctada vulgaris shell (Mollus, bi-valvia),” Optical Materials Express, Vol. 4, No. 9, 2014, pp. 1813–1823). None of the studied cabochons showed purple areas to examine for comparison. Interestingly, the Raman spectra obtained from the white and purple areas of the same mollusk that were previously referenced in the lit-erature (K. Scarratt et al., “A note on a pearl attached to the interior of Crassostrea virginica (Gmelin, 1791) (an edible oyster, common names, American or Eastern oyster),” Journal of Gemmology, Vol. 30, No. 1/2, 2006, pp. 43–50) differed slightly from the findings in this work. The sam-ples in this submission were also an-alyzed by energy-dispersive X-ray fluorescence (EDXRF) chemical analysis and showed low levels of manganese (Mn), confirming their saltwater environment.
As with all shell mollusks, C. vir-ginica is capable of producing pearls. However, the cabochons in this study provided useful gemological and spec-troscopic information for future refer-
Figure 22. Raman spectra collected using 514 nm laser excitation on the white and purple areas of the interior of the C. virginica valve. The white area shows calcite peaks at 280, 712, 1085, and 1437 cm–1, and the purple area shows aragonite peaks at 703 and 1085 cm–1, along with several broad pigment-related bands.
RAMAN SPECTRA
INTE
NSI
TY (
CO
UN
TS)
0
20000
40000
60000
80000
140000
120000
100000
White Purple 1085
703
712
1437 280
100 300 500 700 900 1100 1300 1500
RAMAN SHIFT (cm–1)
214 LAB NOTES GEMS & GEMOLOGY SUMMER 2018
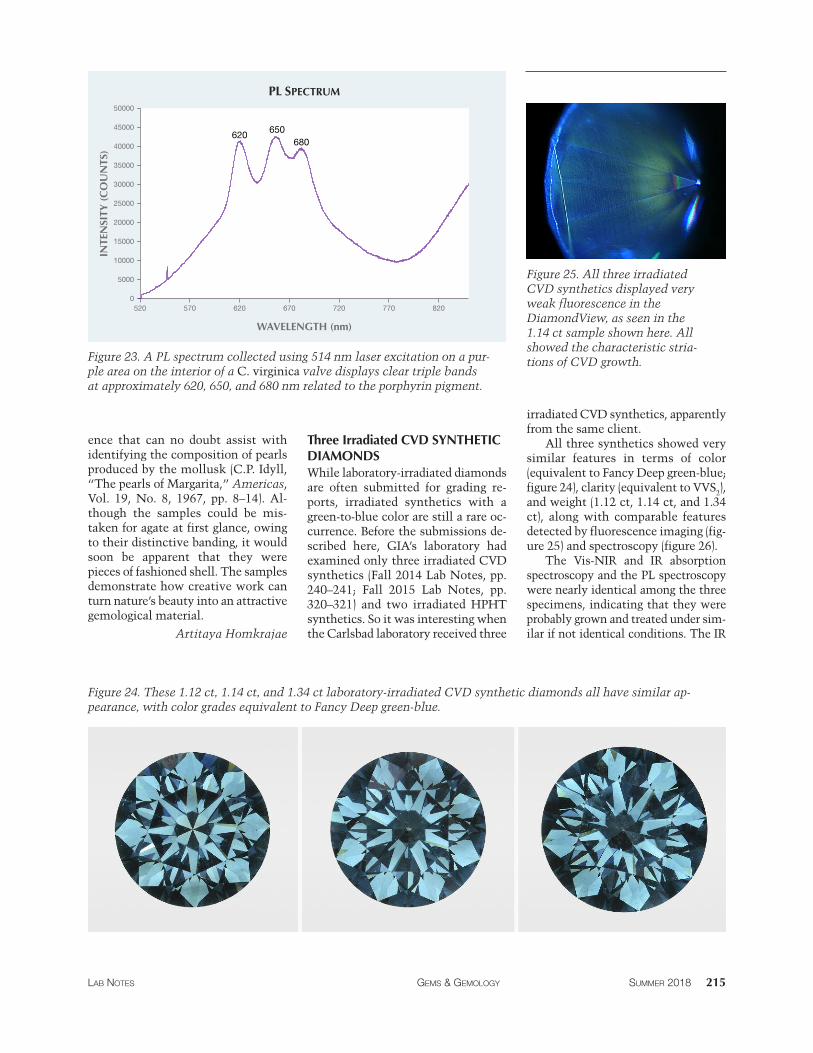
Figure 23. A PL spectrum collected using 514 nm laser excitation on a pur-
ple area on the interior of a C. virginica valve displays clear triple bands at approximately 620, 650, and 680 nm related to the porphyrin pigment.
PL SPECTRUM IN
TEN
SITY
(C
OU
NTS
)
0
10000
20000
30000
40000
15000
25000
35000
45000
50000
5000
620 650
680
520 570 620 670 720 770 820
WAVELENGTH (nm)
Figure 24. These 1.12 ct, 1.14 ct, and 1.34 ct laboratory-irradiated CVD synthetic diamonds all have similar ap-pearance, with color grades equivalent to Fancy Deep green-blue.
Figure 25. All three irradiated CVD synthetics displayed very weak fluorescence in the DiamondView, as seen in the 1.14 ct sample shown here. All showed the characteristic stria-tions of CVD growth.
LAB NOTES GEMS & GEMOLOGY SUMMER 2018 215
ence that can no doubt assist with identifying the composition of pearls produced by the mollusk (C.P. Idyll, “The pearls of Margarita,” Americas, Vol. 19, No. 8, 1967, pp. 8–14). Al-though the samples could be mis-taken for agate at first glance, owing to their distinctive banding, it would soon be apparent that they were pieces of fashioned shell. The samples demonstrate how creative work can turn nature’s beauty into an attractive gemological material.
Artitaya Homkrajae
Three Irradiated CVD SYNTHETIC DIAMONDS While laboratory-irradiated diamonds are often submitted for grading re-ports, irradiated synthetics with a green-to-blue color are still a rare oc-currence. Before the submissions de-scribed here, GIA’s laboratory had examined only three irradiated CVD synthetics (Fall 2014 Lab Notes, pp. 240–241; Fall 2015 Lab Notes, pp. 320–321) and two irradiated HPHT synthetics. So it was interesting when the Carlsbad laboratory received three
irradiated CVD synthetics, apparently from the same client.
All three synthetics showed very similar features in terms of color (equivalent to Fancy Deep green-blue; figure 24), clarity (equivalent to VVS2), and weight (1.12 ct, 1.14 ct, and 1.34 ct), along with comparable features detected by fluorescence imaging (fig-ure 25) and spectroscopy (figure 26).
The Vis-NIR and IR absorption spectroscopy and the PL spectroscopy were nearly identical among the three specimens, indicating that they were probably grown and treated under sim-ilar if not identical conditions. The IR
t
VIS-NIR ABSORPTION SPECTRA A
BSO
RBA
NC
E
GR2
TR12
464.3
595 nm center GR1
1.12 ct
1.14 ct
1.34 ct
450 500 550 600 650 700 750 800 850
WAVELENGTH (nm)
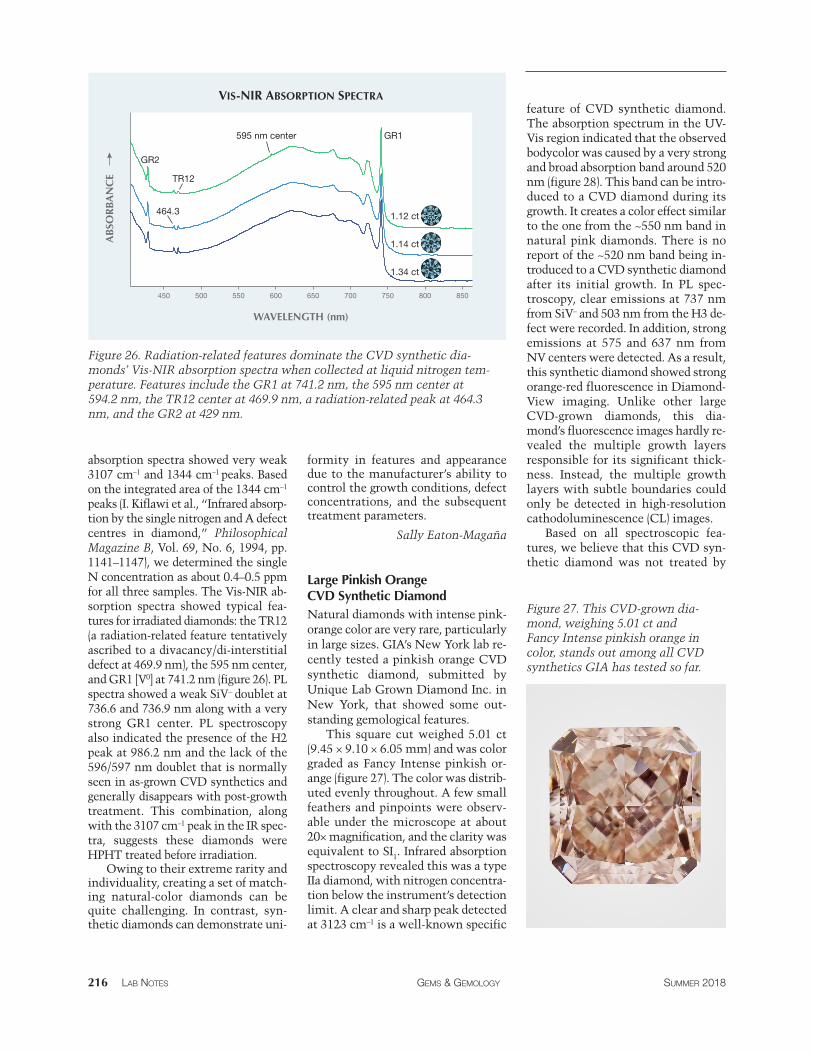
Figure 26. Radiation-related features dominate the CVD synthetic dia-monds’ Vis-NIR absorption spectra when collected at liquid nitrogen tem-perature. Features include the GR1 at 741.2 nm, the 595 nm center at 594.2 nm, the TR12 center at 469.9 nm, a radiation-related peak at 464.3 nm, and the GR2 at 429 nm.
absorption spectra showed very weak 3107 cm–1 and 1344 cm–1 peaks. Based on the integrated area of the 1344 cm–1
peaks (I. Kiflawi et al., “Infrared absorp-tion by the single nitrogen and A defect centres in diamond,” Philosophical Magazine B, Vol. 69, No. 6, 1994, pp. 1141–1147), we determined the single N concentration as about 0.4–0.5 ppm for all three samples. The Vis-NIR ab-sorption spectra showed typical fea-tures for irradiated diamonds: the TR12 (a radiation-related feature tentatively ascribed to a divacancy/di-interstitial defect at 469.9 nm), the 595 nm center, and GR1 [V0] at 741.2 nm (figure 26). PL spectra showed a weak SiV– doublet at 736.6 and 736.9 nm along with a very strong GR1 center. PL spectroscopy also indicated the presence of the H2 peak at 986.2 nm and the lack of the 596/597 nm doublet that is normally seen in as-grown CVD synthetics and generally disappears with post-growth treatment. This combination, along with the 3107 cm–1 peak in the IR spec-tra, suggests these diamonds were HPHT treated before irradiation.
Owing to their extreme rarity and individuality, creating a set of match-ing natural-color diamonds can be quite challenging. In contrast, syn-thetic diamonds can demonstrate uni-
formity in features and appearance due to the manufacturer’s ability to control the growth conditions, defect concentrations, and the subsequent treatment parameters.
Sally Eaton-Magaña
Large Pinkish Orange CVD Synthetic Diamond Natural diamonds with intense pink-orange color are very rare, particularly in large sizes. GIA’s New York lab re-cently tested a pinkish orange CVD synthetic diamond, submitted by Unique Lab Grown Diamond Inc. in New York, that showed some out-standing gemological features.
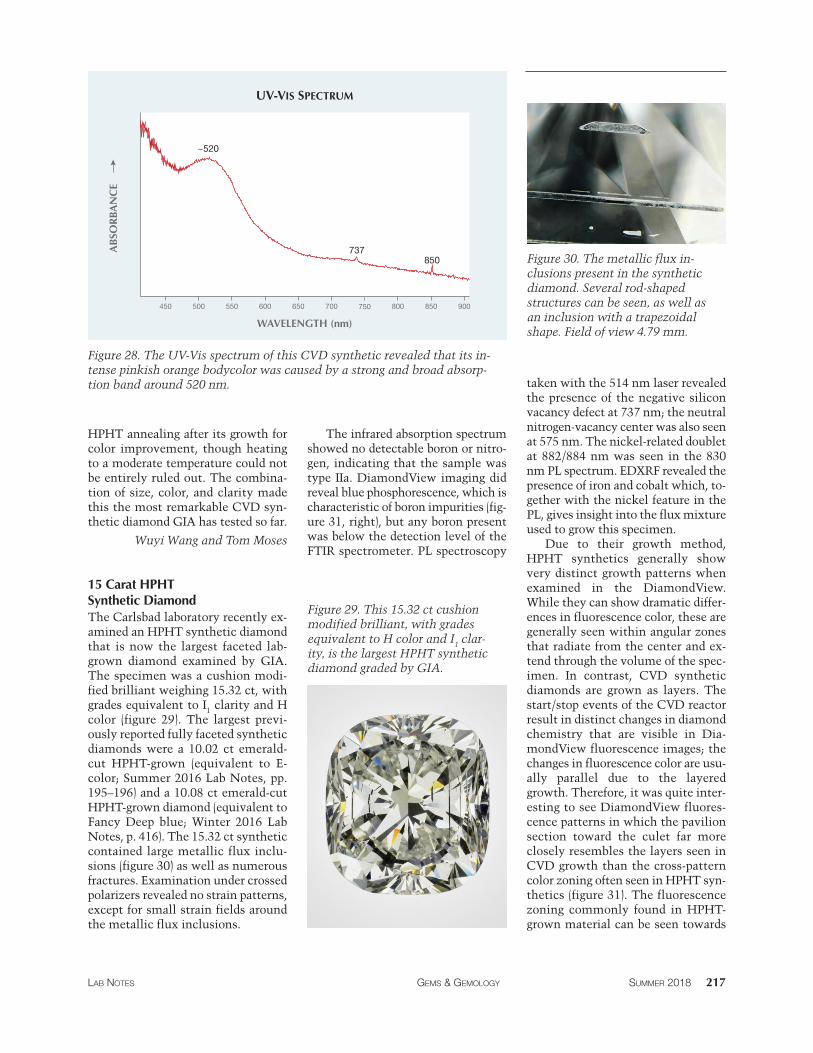
This square cut weighed 5.01 ct (9.45 × 9.10 × 6.05 mm) and was color graded as Fancy Intense pinkish or-ange (figure 27). The color was distrib-uted evenly throughout. A few small feathers and pinpoints were observ-able under the microscope at about 20× magnification, and the clarity was equivalent to SI1. Infrared absorption spectroscopy revealed this was a type IIa diamond, with nitrogen concentra-tion below the instrument’s detection limit. A clear and sharp peak detected at 3123 cm–1 is a well-known specific
feature of CVD synthetic diamond. The absorption spectrum in the UV-Vis region indicated that the observed bodycolor was caused by a very strong and broad absorption band around 520 nm (figure 28). This band can be intro-duced to a CVD diamond during its growth. It creates a color effect similar to the one from the ~550 nm band in natural pink diamonds. There is no report of the ~520 nm band being in-troduced to a CVD synthetic diamond after its initial growth. In PL spec-troscopy, clear emissions at 737 nm from SiV– and 503 nm from the H3 de-fect were recorded. In addition, strong emissions at 575 and 637 nm from NV centers were detected. As a result, this synthetic diamond showed strong orange-red fluorescence in Diamond-View imaging. Unlike other large CVD-grown diamonds, this dia-mond’s fluorescence images hardly re-vealed the multiple growth layers responsible for its significant thick-ness. Instead, the multiple growth layers with subtle boundaries could only be detected in high-resolution cathodoluminescence (CL) images.
Based on all spectroscopic fea-tures, we believe that this CVD syn-thetic diamond was not treated by
Figure 27. This CVD-grown dia-mond, weighing 5.01 ct and Fancy Intense pinkish orange in color, stands out among all CVD synthetics GIA has tested so far.
216 LAB NOTES GEMS & GEMOLOGY SUMMER 2018
t
UV-VIS SPECTRUM
AB
SOR
BAN
CE
~520
737 850
450 500 550 600 650 700 750 800 850 900
WAVELENGTH (nm)
Figure 28. The UV-Vis spectrum of this CVD synthetic revealed that its in-tense pinkish orange bodycolor was caused by a strong and broad absorp-tion band around 520 nm.
HPHT annealing after its growth for color improvement, though heating to a moderate temperature could not be entirely ruled out. The combina-tion of size, color, and clarity made this the most remarkable CVD syn-thetic diamond GIA has tested so far.
Wuyi Wang and Tom Moses
15 Carat HPHT Synthetic Diamond The Carlsbad laboratory recently ex-amined an HPHT synthetic diamond that is now the largest faceted lab-grown diamond examined by GIA. The specimen was a cushion modi-fied brilliant weighing 15.32 ct, with grades equivalent to I1 clarity and H color (figure 29). The largest previ-ously reported fully faceted synthetic diamonds were a 10.02 ct emerald-cut HPHT-grown (equivalent to E-color; Summer 2016 Lab Notes, pp. 195–196) and a 10.08 ct emerald-cut HPHT-grown diamond (equivalent to Fancy Deep blue; Winter 2016 Lab Notes, p. 416). The 15.32 ct synthetic contained large metallic flux inclu-sions (figure 30) as well as numerous fractures. Examination under crossed polarizers revealed no strain patterns, except for small strain fields around the metallic flux inclusions.
The infrared absorption spectrum showed no detectable boron or nitro-gen, indicating that the sample was type IIa. DiamondView imaging did reveal blue phosphorescence, which is characteristic of boron impurities (fig-ure 31, right), but any boron present was below the detection level of the FTIR spectrometer. PL spectroscopy
Figure 30. The metallic flux in-clusions present in the synthetic diamond. Several rod-shaped structures can be seen, as well as an inclusion with a trapezoidal shape. Field of view 4.79 mm.
Figure 29. This 15.32 ct cushion modified brilliant, with grades equivalent to H color and I1 clar-ity, is the largest HPHT synthetic diamond graded by GIA.
taken with the 514 nm laser revealed the presence of the negative silicon vacancy defect at 737 nm; the neutral nitrogen-vacancy center was also seen at 575 nm. The nickel-related doublet at 882/884 nm was seen in the 830 nm PL spectrum. EDXRF revealed the presence of iron and cobalt which, to-gether with the nickel feature in the PL, gives insight into the flux mixture used to grow this specimen.
Due to their growth method, HPHT synthetics generally show very distinct growth patterns when examined in the DiamondView. While they can show dramatic differ-ences in fluorescence color, these are generally seen within angular zones that radiate from the center and ex-tend through the volume of the spec-imen. In contrast, CVD synthetic diamonds are grown as layers. The start/stop events of the CVD reactor result in distinct changes in diamond chemistry that are visible in Dia-mondView fluorescence images; the changes in fluorescence color are usu-ally parallel due to the layered growth. Therefore, it was quite inter-esting to see DiamondView fluores-cence patterns in which the pavilion section toward the culet far more closely resembles the layers seen in CVD growth than the cross-pattern color zoning often seen in HPHT syn-thetics (figure 31). The fluorescence zoning commonly found in HPHT-grown material can be seen towards
LAB NOTES GEMS & GEMOLOGY SUMMER 2018 217
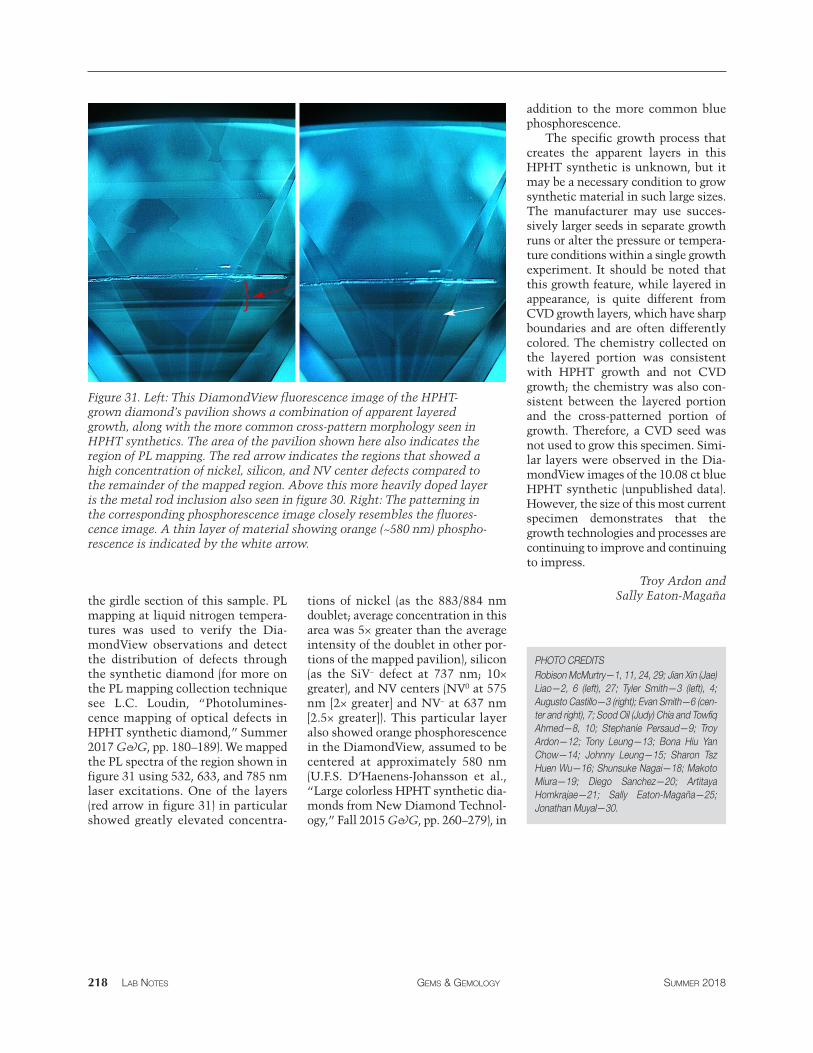
Figure 31. Left: This DiamondView fluorescence image of the HPHT-grown diamond’s pavilion shows a combination of apparent layered growth, along with the more common cross-pattern morphology seen in HPHT synthetics. The area of the pavilion shown here also indicates the region of PL mapping. The red arrow indicates the regions that showed a high concentration of nickel, silicon, and NV center defects compared to the remainder of the mapped region. Above this more heavily doped layer is the metal rod inclusion also seen in figure 30. Right: The patterning in the corresponding phosphorescence image closely resembles the fluores-cence image. A thin layer of material showing orange (~580 nm) phospho-rescence is indicated by the white arrow.
PHOTO CREDITS Robison McMurtry—1, 11, 24, 29; Jian Xin (Jae) Liao—2, 6 (left), 27; Tyler Smith—3 (left), 4; Augusto Castillo—3 (right); Evan Smith—6 (cen-ter and right), 7; Sood Oil (Judy) Chia and Towfiq Ahmed—8, 10; Stephanie Persaud—9; Troy Ardon—12; Tony Leung—13; Bona Hiu Yan Chow—14; Johnny Leung—15; Sharon Tsz Huen Wu—16; Shunsuke Nagai—18; Makoto Miura—19; Diego Sanchez—20; Artitaya Homkrajae—21; Sally Eaton-Magaña—25; Jonathan Muyal—30.
}
218 LAB NOTES GEMS & GEMOLOGY SUMMER 2018
the girdle section of this sample. PL mapping at liquid nitrogen tempera-tures was used to verify the Dia-mondView observations and detect the distribution of defects through the synthetic diamond (for more on the PL mapping collection technique see L.C. Loudin, “Photolumines-cence mapping of optical defects in HPHT synthetic diamond,” Summer 2017 G&G, pp. 180–189). We mapped the PL spectra of the region shown in figure 31 using 532, 633, and 785 nm laser excitations. One of the layers (red arrow in figure 31) in particular showed greatly elevated concentra-
tions of nickel (as the 883/884 nm doublet; average concentration in this area was 5× greater than the average intensity of the doublet in other por-tions of the mapped pavilion), silicon (as the SiV– defect at 737 nm; 10× greater), and NV centers (NV0 at 575 nm [2× greater] and NV– at 637 nm [2.5× greater]). This particular layer also showed orange phosphorescence in the DiamondView, assumed to be centered at approximately 580 nm (U.F.S. D’Haenens-Johansson et al., “Large colorless HPHT synthetic dia-monds from New Diamond Technol-ogy,” Fall 2015 G&G, pp. 260–279), in
addition to the more common blue phosphorescence.
The specific growth process that creates the apparent layers in this HPHT synthetic is unknown, but it may be a necessary condition to grow synthetic material in such large sizes. The manufacturer may use succes-sively larger seeds in separate growth runs or alter the pressure or tempera-ture conditions within a single growth experiment. It should be noted that this growth feature, while layered in appearance, is quite different from CVD growth layers, which have sharp boundaries and are often differently colored. The chemistry collected on the layered portion was consistent with HPHT growth and not CVD growth; the chemistry was also con-sistent between the layered portion and the cross-patterned portion of growth. Therefore, a CVD seed was not used to grow this specimen. Simi-lar layers were observed in the Dia-mondView images of the 10.08 ct blue HPHT synthetic (unpublished data). However, the size of this most current specimen demonstrates that the growth technologies and processes are continuing to improve and continuing to impress.
Troy Ardon and Sally Eaton-Magaña