Embed Size (px)
Citation preview
1
LARGE EDDY SIMULATION OF HIGHLY TURBULENT UNDER-EXPANDED HYDROGEN
AND METHANE JETS FOR GASEOUS-FUELLED INTERNAL COMBUSTION ENGINES
A. Hamzehloo and P.G. Aleiferis*
Department of Mechanical Engineering, University College London, UK
*Author for Correspondence:
Dr. Pavlos Aleiferis
University College London
Department of Mechanical Engineering
Torrington Place, London WC1E 7JE, UK
Tel: +44-(0)20-76793862, Fax: +44-(0)20-73880180
E-mail: [email protected]
Full length article accepted for publication in the International Journal of Hydrogen Energy
2
ABSTRACT
Burning hydrogen in conventional internal combustion (IC) engines is associated with zero carbon-based
tailpipe exhaust emissions. In order to obtain high volumetric efficiency and eliminate abnormal combustion
modes such as preignition and backfire, in-cylinder direct injection (DI) of hydrogen is considered preferable
for a future generation of hydrogen IC engines. However, hydrogen’s low density requires high injection
pressures for fast hydrogen penetration and sufficient in-cylinder mixing. Such pressures lead to chocked
flow conditions during the injection process which result in the formation of turbulent under-expanded
hydrogen jets. In this context, fundamental understanding of the under-expansion process and turbulent
mixing just after the nozzle exit is necessary for the successful design of an efficient hydrogen injection
system and associated injection strategies. The current study used large-eddy simulation (LES) to investigate
the characteristics of hydrogen under-expanded jets with different nozzle pressure ratios (NPR), namely 8.5,
10, 30 and 70. A test case of methane injection with NPR=8.5 was also simulated for direct comparison with
the hydrogen jetting under the same NPR. The near-nozzle shock structure, the geometry of the Mach disk
and reflected shock angle, as well as the turbulent shear layer were all captured in very good agreement with
data available in the literature. Direct comparison between hydrogen and methane fuelling showed that the
ratio of the specific heats had a noticeable effect on the near-nozzle shock structure and dimensions of the
Mach disk. It was observed that with methane, mixing did not occur before the Mach disk, whereas with
hydrogen high levels of momentum exchange and mixing appeared at the boundary of the jet. This was
believed to be the effect of the high turbulence fluctuations at the nozzle exit of the hydrogen jet which
triggered Gortler vortices. Generally, the primary mixing was observed to occur after the location of the
Mach disk and particularly close to the jet boundaries where large-scale turbulence played a dominant role. It
was also found that NPR had significant effect on the mixture’s local fuel richness. Finally, it was noted that
applying higher injection pressure did not essentially increase the penetration length of the hydrogen jets and
that there could be an optimum NPR that would introduce more enhanced mixing whilst delivering sufficient
fuel in less time. Such an optimum NPR could be in the region of 100 based on the geometry and
observations of the current study.
3
1. INTRODUCTION
1.1 Hydrogen-Fuelled Internal Combustion Engines
In order to tackle issues related to the ever increasing cost of conventional fuels and carbon emissions, it is
necessary to diversify towards cleaner and more sustainable fuels. Accordingly, several liquids and gases
have been proposed as alternative fuels for internal combustion (IC) engines; among them, gaseous hydrogen
(H2) can offer a promising long-term solution. The concept of a hydrogen economy has been proposed since
the mid-1970s [1, 2]. Several experimental and computational studies have been conducted on the
development of hydrogen-fuelled IC engines in the past 15 years [3–22]. Port fuel injection (PFI) [6–12] and
in-cylinder Direct Injection (DI) [13–22] of hydrogen are the two typical options for hydrogen-fuelled IC
engines. DI offers higher volumetric efficiency and eliminates abnormal combustion modes such as pre-
ignition and backfire. These attributes, in conjunction with the flexibility in possible injection strategies,
make DI preferable for hydrogen IC engines. However, hydrogen’s low density requires high injection
pressures in order to achieve fast fuel delivery and optimise mixture formation. Such pressures lead to
turbulent under-expanded hydrogen jets past the nozzle exit [18, 22]. Therefore, fundamental understanding
of the under-expansion process and turbulent mixing just after the nozzle exit is necessary for the design of
an efficient hydrogen injection system and associated injection strategies for enhanced engine performance.
1.2 Under-Expanded Jets
1.2.1 Definition
The ratio of the nozzle total pressure (P0) to the ambient (in-cylinder) static pressure (P∞), namely the nozzle
pressure ratio (NPR), has a significant effect on the characteristics of a gaseous jet issuing from a circular
nozzle. Based on the level of NPR, jets can be classified as subsonic, moderately under-expanded and highly
under-expanded [23─25]. Specifically, Donaldson and Snedeker [25] categorized the gaseous jets into three
major types based on the NPR (P0/P∞) and under-expansion ratio (P1/P∞) as subsonic (1>P∞/P0>0.528,
P1/P∞=1), moderately under-expanded (0.48>P∞/P0≥0.26, 1.1<P1/P∞≤2) and highly under-expanded
(0.26≥P∞/P0≥0, 2≤P1/P∞≤∞). For NPR above ~4 the jet is considered to be highly under-expanded. As
illustrated in Figure 1, at such condition, infinite number of Mach waves, namely the Prandtl-Meyer
expansion fan, form at the nozzle lip that spread out to the jet boundary and reflect as weak compression
waves which form the intercepting oblique shock that is ended by a slightly curved strong normal shock so-
called Mach disk [23]. The intercepting shock and the Mach disk form the first shock cell that is labelled
“barrel shape shock” since it has a cylindrical shape. On a 2-D plane a reflected shock and a slip line is seen
at the “triple point” which is the merging location of the intercepting shock and the Mach disk (see Figure 1).
The flow behind the Mach disk is subsonic, whilst the flow behind the reflected shock is still supersonic
[23─25]. For higher degrees of under-expansion, e.g. NPR8, the subsonic core behind the Mach disk
rapidly accelerates and becomes supersonic once more, which then shapes a second shock cell that may
resemble the first shock cell and even include a normal shock comparable to the Mach disk [25]. At
4
extremely high levels of NPR, a very large Mach disk forms at the nozzle exit, with no additional normal
shocks downstream, and the jet then decays resembling a subsonic jet [25].
1.2.2 Near-nozzle Sonic Characteristics
The near-nozzle sonic characteristics of under-expanded jets are quantified by several important parameters
that include the dimensions of the Mach disk, angle of reflected shock at the triple point and length of the
shear layer thickness (maximum distance between the slip line and reflected shock). These, not only provide
important information regarding the upstream condition and effective injection pressure, but also have
significant effect on the annular shear layer thickness and consequently on the mixing characteristics of the
under-expanded jet. These parameters can also be used as fundamental measures for comparing under-
expanded jets with different values of NPR and also for validating numerical models of these types of jets.
The Mach disk’s dimensions are typically characterised by the axial distance of the disk from the nozzle exit,
i.e. the Mach disk height (Hdisk), and the distance between the two triple points (see Figure 1) i.e. the Mach
disk width (Wdisk). The reflected shock angle and shear layer thickness are significantly affected by the Mach
disk dimensions and although there is still not a universal relation available for these two parameters, several
correlations have been suggested for predicting Hdisk and Wdisk.
By conducting experimental investigations and with the assumption of choked condition at the nozzle exit
(Ma=1), Crist et al. [23] suggested that the relation between NPR and the Mach disk height can be given by:
1
√2.4 (1)
By assuming a large Mach number at the location of the Mach disk (Madisk>>1) and by combining equation
(1) with some isentropic relations, Crist et al. [23] also derived a correlation which relates Hdisk to Madisk and
the ratio of specific heats (γ) as follows:
~ ⁄ 14.8
12
⁄
(2)
Ewan and Moodie [26] and Antsupov [27] separately suggested the following correlations in order to predict
Hdisk and Wdisk:
0.77 0.068 . (3)
log
34
(4)
where P1 is the static pressure at the nozzle exit. Velikorodny and Kudriakov [28] reported that by using
theoretical analysis based on dimensional groups the following relations can be derived for the Mach disk:
12
11
(5)
5
11 1
1 (6)
where ζ is an empirical constant that accounts for the growth of the mixing layer. A commonly used
experimental correlation for the Mach disk height was proposed by Ashkenas and Sherman [29] as follows:
0.67 (7)
1.2.3 Mixing Characteristics
The jet tip penetration (Ztip) and its volumetric growth (Vjet) are two key properties of under-expanded
gaseous fuel jets when it comes to air/fuel mixing. They have direct effects on the mechanism of mixture
preparation and degree of fuel stratification and can influence in return the combustion quality and tailpipe
emissions level.
The tip penetration of under-expanded jets has been subject to many theoretical studies. Turner [30] was the
first to develop a mathematical model for the under-expanded gaseous jets. The model approximates the
geometry of a gaseous jet as a spherical head vortex and a quasi-steady jet region that conveys the
momentum; momentum is constantly supplied thorough the nozzle orifice and is passed between the quasi-
steady region and the head vortex. Hill and Ouellette [31] employed Turner’s model to develop an analytical
relationship for the tip penetration as follows:
Z (8)
where M is the momentum flow rate supplied by the nozzle and Γ is a scaling constant related to the
entrainment level (normally has a value of ~3 for jets issued from round nozzles). As dictated by equation (8)
and also as formulated by Abraham [32], the jet penetration under conditions similar to those prevailing in
DI engines (under-expanded with Reynolds number in order of 105) obeys a linear dependency on the square
root of time. However, experiments have shown that this linear relation is achieved after an initial non-linear
transient behaviour [33].
1.3 Literature Survey
Experimental studies of the near-nozzle shock structure and mixing characteristics of under-expanded jets
have been conducted by several researchers using wind tunnel facilities, Schlieren and shadowgraph
photography, Rayleigh scattering, Laser Doppler Anemometry (LDA) and Planar Laser-Induced
Fluorescence (PLIF) in order to measure the mixing parameters and visualise the near-field shock structure
of under-expanded air/nitrogen jets [23, 25, 26, 29, 34–37]. Computational studies of under-expanded jets
have been performed using compressible Euler equations [38–41], Reynolds Averaged Navier-Stokes
(RANS) and Large Eddy Simulation (LES) methodologies [41–52], mainly for air jets or by assuming the
injection of a passive scalar. Early studies were also conducted by analytical approaches and the method of
characteristics [24, 53]. Prudhomme and Haj-Hariri [38] examined moderate and highly under-expanded jets
6
by solving the axisymmetric Euler equations with a finite element solver and Roe’s approximate method
[54]. Their implicit computational framework was able to predict the location of the Mach disk and the wave
structure inside the jet. However, in order to study the mixing characteristics of under-expanded jets by
including molecular diffusion effects (that can be significant with hydrogen fuelling), use of the Navier-
Stokes equations is necessary rather than Euler’s equations. RANS simulations are low in cost and have been
proven accurate at capturing the shock structure of under-expanded jets [42–46], but their ability to predict
the mixing of highly turbulent jets remains unclear as results can be quite sensitive to the choice of
turbulence model. Therefore, LES is considered more suitable for modelling the details of highly turbulent
under-expanded jets and the following sub-section presents a brief review of relevant studies.
1.3.1 LES Modelling
For simulations of under-expanded jets for aerospace applications where massive attached faces (e.g. nozzle
inner wall) and complex shear flows exist with strong compressibility at high temperatures, Detached Eddy
Simulation (DES) has been suggested. DES is based on a hybrid RANS/LES methodology where RANS is
employed at regions close to walls (attached) and LES for the remaining volume of the domain. This is a
more feasible option to LES since the latter requires considerably finer grid close to the walls [47, 48].
However, for conditions relevant to injectors of gaseous-fuelled engines, it has been shown [49–51] that if
the injector body has been included in the computational domain by assigning a slip wall condition LES can
be used with good level of accuracy (more details discussed later in the current paper). For example,
Dauptain et al. [49, 50] used Smagorinsky LES on an unstructured tetrahedral grid with an explicit third-
order solver that featured a centred shock capturing algorithm to study free and impinging under-expanded
jets. Different number of cells were investigated by these authors and it was found that a grid with D/20 cell
size close to the nozzle exit could provide grid independency of the results. Recently Vourinen et al. [51]
modelled the injection of a passive scalar with NPR in range of 4.5–8.5 using an implicit LES (ILES)
technique. The near-nozzle shock structure and the strong compression effects were taken into account by
using a bulk viscosity model in conjunction with a second-order filter that was activated at the location of the
strong shocks. Vourinen et al. [51] also showed that the Mach disk dimensions and shock structure were in
very good agreement with the experimental observations of Yu et al. [37, 52] that included PLIF
visualisation. Important mixing characteristics, e.g. jet tip penetration and jet volumetric growth of a passive
scalar with nitrogen properties for NPR≤8.5 were also investigated by Vourinen et al. [51] and a new scaling
parameter for the volumetric growth of under-expanded jets was proposed.
1.3.2 Numerical Modelling of Hydrogen Under-Expanded Jets
Most previous studies on under-expanded jets have considered large diameter nozzles with air/nitrogen as
working gas. There are very limited data in the literature on under-expanded hydrogen jets (or other light
gases such as helium), especially for nozzles with diameters relevant to IC engine injectors. Velikorodny and
Kurdriakov [28] studied computationally under-expanded air and helium jets issued from a circular nozzle
with D=1 mm and NPR=30. The numerical methodology employed the Advection Upstream Splitting
Method (AUSM+) [55] for the convective fluxes and direct solution of the governing equations without Sub-
Grid Scale (SGS) turbulence models. It was found that the near-field shock structure of the helium jet
7
required more time than the air jet to reach quasi-steady conditions. Ruggles and Ekoto [56] used Schlieren
photography to visualise the near nozzle shock structure and Planar Laser Rayleigh Scatter imaging in order
to measure the instantaneous mole fraction downstream of the Mach disk in an under-expanded hydrogen jet
issued from a nozzle with diameter D=1.5 mm and with NPR=10. The Mach disk, the reflected shocks and
the oblique shock trains after the Mach disk were clearly captured by the visualisation technique. Ruggles
and Ekoto [56] noticed that air and hydrogen may have mixed within the slip region and bypassed the Mach
disk, therefore, notional nozzle theories that assumed that all gas passed the Mach disk were not accurate
enough. It was suggested that more experimental and computational works were required in order to clarify
the hydrogen-air mixing behaviour very close to the nozzle exit. Gorle et al. [57] and Gorle and Iaccarino
[58] conducted experimental (Schlieren) and computational (RANS and LES) studies of under-expanded
hydrogen jets from a nozzle with diameter D=2 mm and NPR=30. It was noticed that both RANS and LES
were able to capture the near nozzle shock structure of under-expanded hydrogen jets in good agreement
with experiments. Khaksarfard et al. [59] investigated numerically the release of high pressure hydrogen
(10–70 MPa) into ambient through a hole with diameter D=5mm. The Able-Noble real gas Equation of State
(EoS) was used by the latter authors and it was found that for very high injection pressures the ideal gas
equation underestimated the release velocity; e.g. for injection pressure of 70 MPa the velocity was
underestimated by 20%. They concluded that for injection pressures above 10 MPa a real gas equation must
be used in order to obtain accurate results. Recently Bonelli et al. [60] used k-ε RANS modelling with a
special correction in the dissipation terms (to account for the so called ‘round-jet anomaly’) in conjunction
with three different EoS, namely ideal gas, van der Waals, and Redlich-Kwong. They studied high pressure
injection of hydrogen (P0=75 MPa, T0=300 K) into still nitrogen (P∞=5 MPa, T∞=300 K) through a nozzle
with inner and outer diameters of 0.3 mm and 0.6 mm, respectively. These authors noticed that the van der
Waals and Redlich-Kwong EoS predicted lower mass flow rate of hydrogen by 10% and 8.7%, respectively,
than the ideal gas EoS. It was also found that at very high injection pressures (Po>>10 MPa) the ideal gas
underestimated the Mach disk height and overestimated the Mach disk width in comparison to real gas EoS
[60].
1.4 Present Contribution
Very little computational studies have been conducted on under-expanded hydrogen jets particularly with
respect to conditions of DI for hydrogen-fuelled IC engines. Previous computational work by the current
authors [22] partially focused on RANS and LES of under-expanded hydrogen jets where a stepped-shape
nozzle was investigated using a moderately-fine grid size. The current study aimed to investigate further the
near-nozzle shock structure and mixing characteristics of highly turbulent under-expanded hydrogen jets by:
Conducting LES on a very fine unstructured hexahedral grid and making direct comparisons between
hydrogen and methane gas injection.
Studying the effect of increasing NPR on the under-expansion and mixing characteristics of hydrogen
jets.
Investigating the transient flow development upstream of the nozzle exit, i.e. inside the nozzle volume of
high-pressure gaseous injectors.
8
Obtaining a set of reference values for the near nozzle shock structure, namely the Mach disk height and
width, the reflected shock angle, the shear layer thickness and the length of the first subsonic core.
Quantifying and comparing the jet penetration length and volumetric growth for hydrogen and methane
fuelling.
Studying the effect of hydrogen’s high diffusivity and low density on the sonic and mixing
characteristics.
2. COMPUTATIONAL METHODOLOGY
2.1 Numerical Formulation
The viscous flow of a Newtonian multi-component compressible fluid of N species (Y1, Y2, Y3, … Yi, …, YN)
is governed by the Navier-Stokes equations and species transport equations [61, 62]. For N species, N-1
transport equations are solved; the mass fraction of the Nth component is determined by the restriction that
the total mass fraction must be unity. Pressure is coupled to density and temperature by the ideal gas EoS.
The STAR-CCM+ code was used for the solution of the governing equations within the objectives of the
current work. The code benefits from a coupled finite volume method that discretises and solves the
governing equations simultaneously using an implicit time marching approach. To provide efficient solution
a preconditioning matrix is integrated into the set of equations that consequently requires viscous and
inviscid fluxes to be defined [61]. In the present study in order to express the inviscid fluxes, the AUSM+
scheme was applied because it is believed to be accurate and robust in solving fluid flows that contain
discontinuity such as shock waves [55]. AUSM+ uses a separate splitting for the pressure terms and also
avoids an explicit artificial dissipation. AUSM+ discretises the fluxes directly as follows:
1, , , … , 1, , , … , (9)
where mi is the mass flux across a cell interface, mi+ is defined as (mi + |mi|)/2, mi
- is defined as (mi – |mi|)/2,
and Pi is the pressure flux. The mass flux and pressure flux are calculated on the basis of local flow
characteristics to ensure precise information propagation inside the fluid for convective and acoustic
processes. The viscous fluxes can be written in terms of the stress tensor T which is defined using
Boussinesq’s approximation as [61]:
(10)
μ μ
23
∙ (11)
With LES the governing equations are filtered in such a way that the turbulence scales greater than the grid
resolution are solved directly and the smaller scales are modelled using SGS models that define the turbulent
viscosity μt that is used in equation (11) to calculate the turbulent stress tensor:
2μ
23μ ∙ (12)
where S is the strain rate tensor computed from the resolved velocity field as:
12
(13)
9
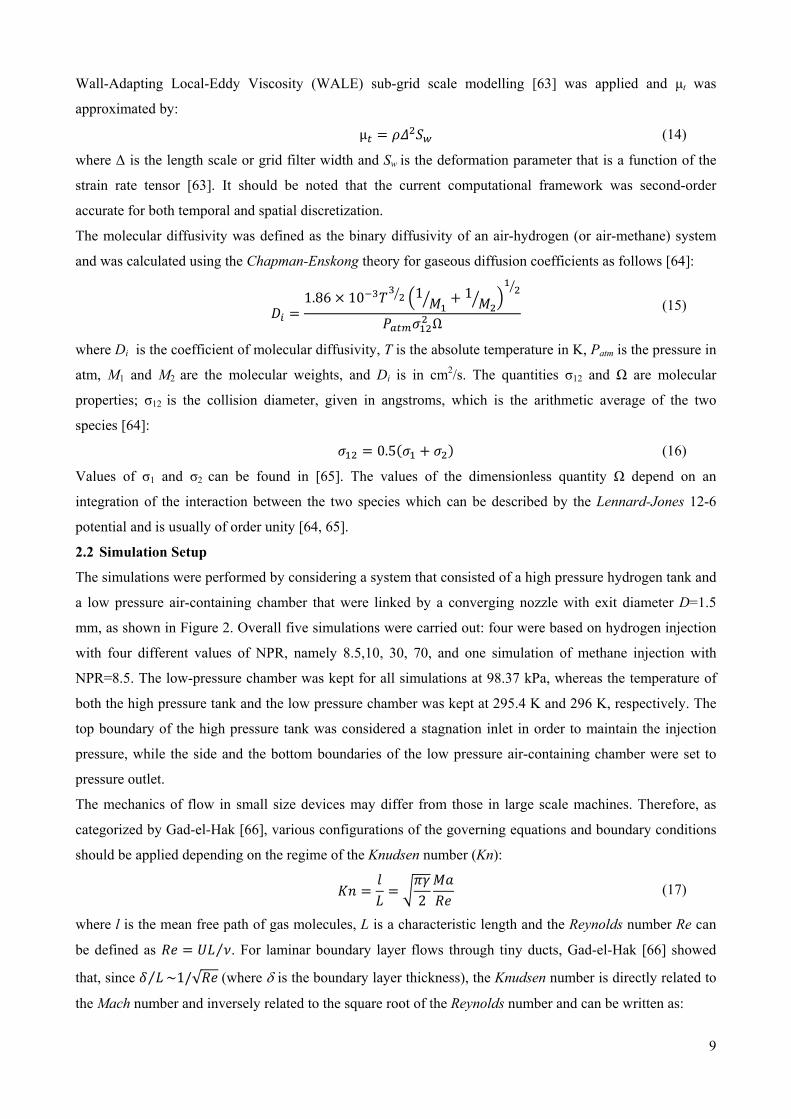
Wall-Adapting Local-Eddy Viscosity (WALE) sub-grid scale modelling [63] was applied and μt was
approximated by:
μ (14)
where Δ is the length scale or grid filter width and Sw is the deformation parameter that is a function of the
strain rate tensor [63]. It should be noted that the current computational framework was second-order
accurate for both temporal and spatial discretization.
The molecular diffusivity was defined as the binary diffusivity of an air-hydrogen (or air-methane) system
and was calculated using the Chapman-Enskong theory for gaseous diffusion coefficients as follows [64]:
1.86 10 1 1
Ω (15)
where Di is the coefficient of molecular diffusivity, T is the absolute temperature in K, Patm is the pressure in
atm, M1 and M2 are the molecular weights, and Di is in cm2/s. The quantities σ12 and Ω are molecular
properties; σ12 is the collision diameter, given in angstroms, which is the arithmetic average of the two
species [64]:
0.5 (16)
Values of σ1 and σ2 can be found in [65]. The values of the dimensionless quantity Ω depend on an
integration of the interaction between the two species which can be described by the Lennard-Jones 12-6
potential and is usually of order unity [64, 65].
2.2 Simulation Setup
The simulations were performed by considering a system that consisted of a high pressure hydrogen tank and
a low pressure air-containing chamber that were linked by a converging nozzle with exit diameter D=1.5
mm, as shown in Figure 2. Overall five simulations were carried out: four were based on hydrogen injection
with four different values of NPR, namely 8.5,10, 30, 70, and one simulation of methane injection with
NPR=8.5. The low-pressure chamber was kept for all simulations at 98.37 kPa, whereas the temperature of
both the high pressure tank and the low pressure chamber was kept at 295.4 K and 296 K, respectively. The
top boundary of the high pressure tank was considered a stagnation inlet in order to maintain the injection
pressure, while the side and the bottom boundaries of the low pressure air-containing chamber were set to
pressure outlet.
The mechanics of flow in small size devices may differ from those in large scale machines. Therefore, as
categorized by Gad-el-Hak [66], various configurations of the governing equations and boundary conditions
should be applied depending on the regime of the Knudsen number (Kn):
2 (17)
where l is the mean free path of gas molecules, L is a characteristic length and the Reynolds number Re can
be defined as ⁄ . For laminar boundary layer flows through tiny ducts, Gad-el-Hak [66] showed
that, since ⁄ ~1/√ (where is the boundary layer thickness), the Knudsen number is directly related to
the Mach number and inversely related to the square root of the Reynolds number and can be written as:
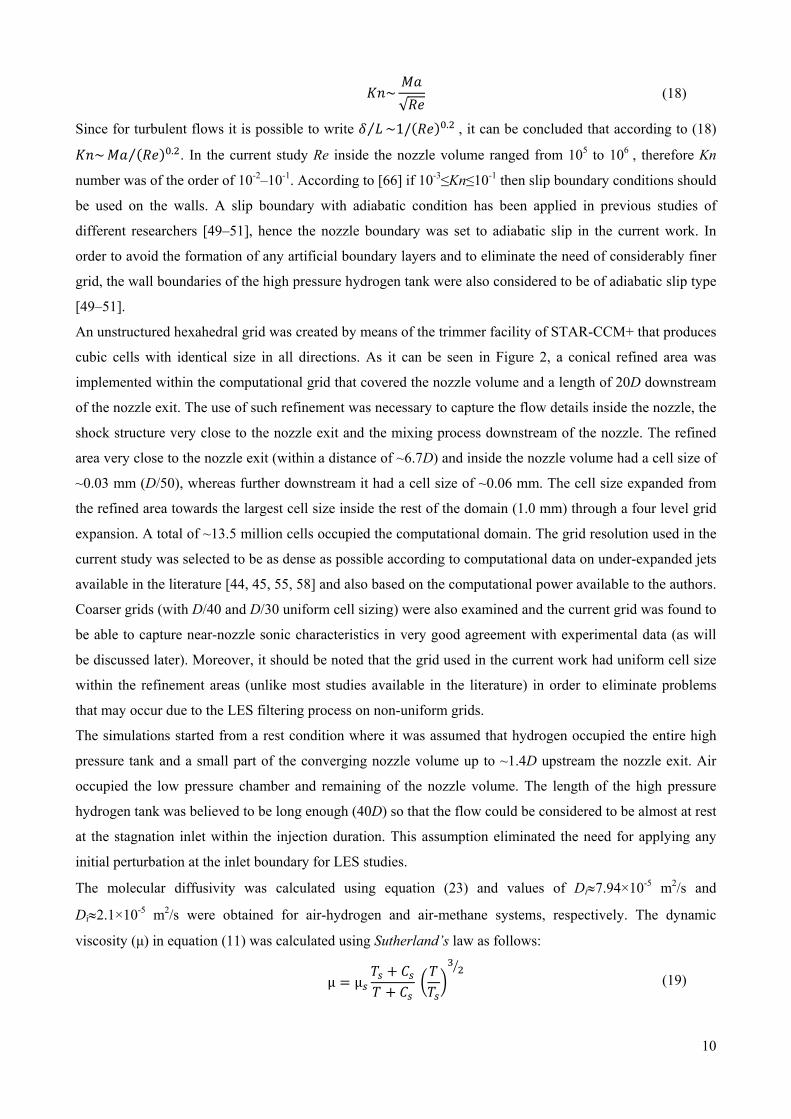
10
~√
(18)
Since for turbulent flows it is possible to write ⁄ ~1/ . , it can be concluded that according to (18)
~ .⁄ . In the current study Re inside the nozzle volume ranged from 105 to 106 , therefore Kn
number was of the order of 10-2–10-1. According to [66] if 10-3≤Kn≤10-1 then slip boundary conditions should
be used on the walls. A slip boundary with adiabatic condition has been applied in previous studies of
different researchers [49–51], hence the nozzle boundary was set to adiabatic slip in the current work. In
order to avoid the formation of any artificial boundary layers and to eliminate the need of considerably finer
grid, the wall boundaries of the high pressure hydrogen tank were also considered to be of adiabatic slip type
[49–51].
An unstructured hexahedral grid was created by means of the trimmer facility of STAR-CCM+ that produces
cubic cells with identical size in all directions. As it can be seen in Figure 2, a conical refined area was
implemented within the computational grid that covered the nozzle volume and a length of 20D downstream
of the nozzle exit. The use of such refinement was necessary to capture the flow details inside the nozzle, the
shock structure very close to the nozzle exit and the mixing process downstream of the nozzle. The refined
area very close to the nozzle exit (within a distance of ~6.7D) and inside the nozzle volume had a cell size of
~0.03 mm (D/50), whereas further downstream it had a cell size of ~0.06 mm. The cell size expanded from
the refined area towards the largest cell size inside the rest of the domain (1.0 mm) through a four level grid
expansion. A total of ~13.5 million cells occupied the computational domain. The grid resolution used in the
current study was selected to be as dense as possible according to computational data on under-expanded jets
available in the literature [44, 45, 55, 58] and also based on the computational power available to the authors.
Coarser grids (with D/40 and D/30 uniform cell sizing) were also examined and the current grid was found to
be able to capture near-nozzle sonic characteristics in very good agreement with experimental data (as will
be discussed later). Moreover, it should be noted that the grid used in the current work had uniform cell size
within the refinement areas (unlike most studies available in the literature) in order to eliminate problems
that may occur due to the LES filtering process on non-uniform grids.
The simulations started from a rest condition where it was assumed that hydrogen occupied the entire high
pressure tank and a small part of the converging nozzle volume up to ~1.4D upstream the nozzle exit. Air
occupied the low pressure chamber and remaining of the nozzle volume. The length of the high pressure
hydrogen tank was believed to be long enough (40D) so that the flow could be considered to be almost at rest
at the stagnation inlet within the injection duration. This assumption eliminated the need for applying any
initial perturbation at the inlet boundary for LES studies.
The molecular diffusivity was calculated using equation (23) and values of Di7.94×10-5 m2/s and
Di2.1×10-5 m2/s were obtained for air-hydrogen and air-methane systems, respectively. The dynamic
viscosity (μ) in equation (11) was calculated using Sutherland’s law as follows:
μ μ (19)
11
where μs and Ts are reference viscosity and reference temperature values, respectively, and Cs is the
Sutherland’s constant; those values have been tabulated in table 1 for air, hydrogen and methane. For the
mixture viscosity, either mass-weighted mixing or volume-weighted mixing methods can be used. Both
methods were examined and similar results achieved. However, since for non-ideal gas mixtures a volume-
weighted approach is suggested as good practice by the code developers, a volume-weighted mixing
methodology was finally selected in the current work to allow direct comparison between the ideal gas
results obtained here and non-ideal gas studies to be conducted in the future.
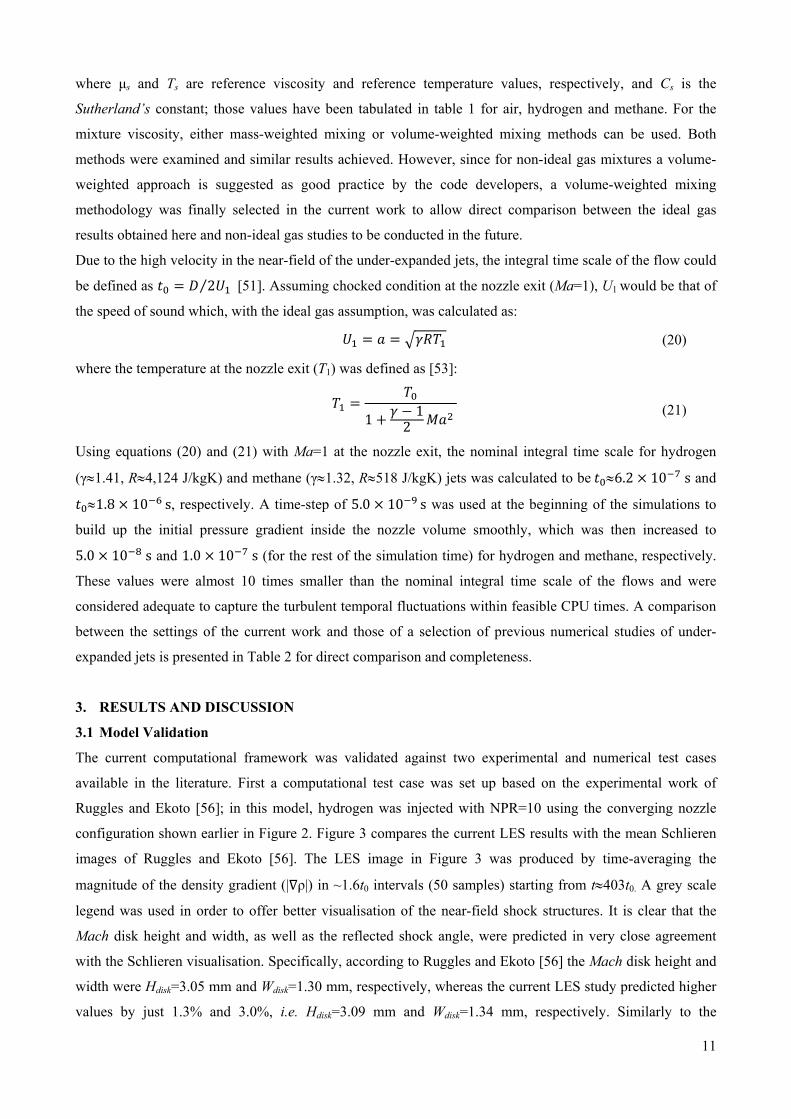
Due to the high velocity in the near-field of the under-expanded jets, the integral time scale of the flow could
be defined as 2 ⁄ [51]. Assuming chocked condition at the nozzle exit (Ma=1), U1 would be that of
the speed of sound which, with the ideal gas assumption, was calculated as:
(20)
where the temperature at the nozzle exit (T1) was defined as [53]:
11
2
(21)
Using equations (20) and (21) with Ma=1 at the nozzle exit, the nominal integral time scale for hydrogen
(γ1.41, R4,124 J/kgK) and methane (γ1.32, R518 J/kgK) jets was calculated to be 6.2 10 s and
1.8 10 s, respectively. A time-step of 5.0 10 s was used at the beginning of the simulations to
build up the initial pressure gradient inside the nozzle volume smoothly, which was then increased to
5.0 10 s and 1.0 10 s (for the rest of the simulation time) for hydrogen and methane, respectively.
These values were almost 10 times smaller than the nominal integral time scale of the flows and were
considered adequate to capture the turbulent temporal fluctuations within feasible CPU times. A comparison
between the settings of the current work and those of a selection of previous numerical studies of under-
expanded jets is presented in Table 2 for direct comparison and completeness.
3. RESULTS AND DISCUSSION
3.1 Model Validation
The current computational framework was validated against two experimental and numerical test cases
available in the literature. First a computational test case was set up based on the experimental work of
Ruggles and Ekoto [56]; in this model, hydrogen was injected with NPR=10 using the converging nozzle
configuration shown earlier in Figure 2. Figure 3 compares the current LES results with the mean Schlieren
images of Ruggles and Ekoto [56]. The LES image in Figure 3 was produced by time-averaging the
magnitude of the density gradient (| ρ|) in ~1.6t0 intervals (50 samples) starting from t403t0. A grey scale
legend was used in order to offer better visualisation of the near-field shock structures. It is clear that the
Mach disk height and width, as well as the reflected shock angle, were predicted in very close agreement
with the Schlieren visualisation. Specifically, according to Ruggles and Ekoto [56] the Mach disk height and
width were Hdisk=3.05 mm and Wdisk=1.30 mm, respectively, whereas the current LES study predicted higher
values by just 1.3% and 3.0%, i.e. Hdisk=3.09 mm and Wdisk=1.34 mm, respectively. Similarly to the
12
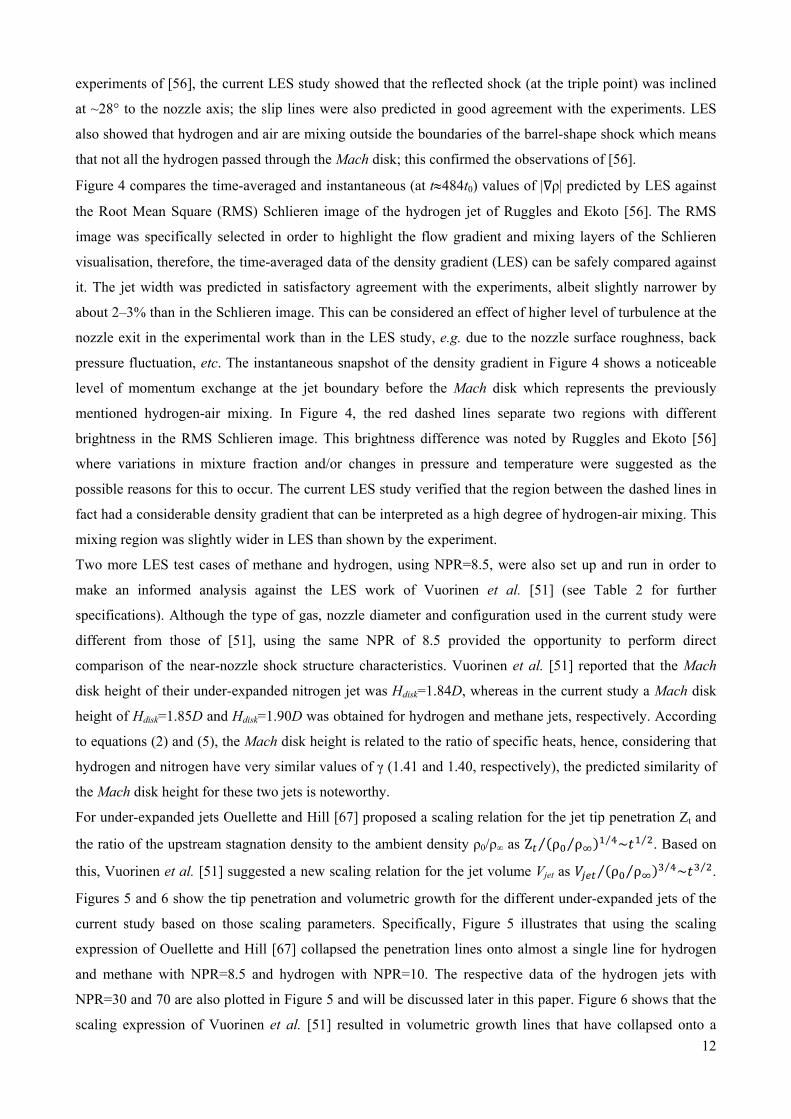
experiments of [56], the current LES study showed that the reflected shock (at the triple point) was inclined
at ~28° to the nozzle axis; the slip lines were also predicted in good agreement with the experiments. LES
also showed that hydrogen and air are mixing outside the boundaries of the barrel-shape shock which means
that not all the hydrogen passed through the Mach disk; this confirmed the observations of [56].
Figure 4 compares the time-averaged and instantaneous (at t484t0) values of | ρ| predicted by LES against
the Root Mean Square (RMS) Schlieren image of the hydrogen jet of Ruggles and Ekoto [56]. The RMS
image was specifically selected in order to highlight the flow gradient and mixing layers of the Schlieren
visualisation, therefore, the time-averaged data of the density gradient (LES) can be safely compared against
it. The jet width was predicted in satisfactory agreement with the experiments, albeit slightly narrower by
about 2–3% than in the Schlieren image. This can be considered an effect of higher level of turbulence at the
nozzle exit in the experimental work than in the LES study, e.g. due to the nozzle surface roughness, back
pressure fluctuation, etc. The instantaneous snapshot of the density gradient in Figure 4 shows a noticeable
level of momentum exchange at the jet boundary before the Mach disk which represents the previously
mentioned hydrogen-air mixing. In Figure 4, the red dashed lines separate two regions with different
brightness in the RMS Schlieren image. This brightness difference was noted by Ruggles and Ekoto [56]
where variations in mixture fraction and/or changes in pressure and temperature were suggested as the
possible reasons for this to occur. The current LES study verified that the region between the dashed lines in
fact had a considerable density gradient that can be interpreted as a high degree of hydrogen-air mixing. This
mixing region was slightly wider in LES than shown by the experiment.
Two more LES test cases of methane and hydrogen, using NPR=8.5, were also set up and run in order to
make an informed analysis against the LES work of Vuorinen et al. [51] (see Table 2 for further
specifications). Although the type of gas, nozzle diameter and configuration used in the current study were
different from those of [51], using the same NPR of 8.5 provided the opportunity to perform direct
comparison of the near-nozzle shock structure characteristics. Vuorinen et al. [51] reported that the Mach
disk height of their under-expanded nitrogen jet was Hdisk=1.84D, whereas in the current study a Mach disk
height of Hdisk=1.85D and Hdisk=1.90D was obtained for hydrogen and methane jets, respectively. According
to equations (2) and (5), the Mach disk height is related to the ratio of specific heats, hence, considering that
hydrogen and nitrogen have very similar values of γ (1.41 and 1.40, respectively), the predicted similarity of
the Mach disk height for these two jets is noteworthy.
For under-expanded jets Ouellette and Hill [67] proposed a scaling relation for the jet tip penetration Zt and
the ratio of the upstream stagnation density to the ambient density ρ0/ρ∞ as Z ρ ρ⁄ ⁄ ~ ⁄⁄ . Based on
this, Vuorinen et al. [51] suggested a new scaling relation for the jet volume Vjet as ρ ρ⁄ ⁄ ~ ⁄⁄ .
Figures 5 and 6 show the tip penetration and volumetric growth for the different under-expanded jets of the
current study based on those scaling parameters. Specifically, Figure 5 illustrates that using the scaling
expression of Ouellette and Hill [67] collapsed the penetration lines onto almost a single line for hydrogen
and methane with NPR=8.5 and hydrogen with NPR=10. The respective data of the hydrogen jets with
NPR=30 and 70 are also plotted in Figure 5 and will be discussed later in this paper. Figure 6 shows that the
scaling expression of Vuorinen et al. [51] resulted in volumetric growth lines that have collapsed onto a
13
single line for the hydrogen jets with NPR=8.5 and 10. However, the methane jet with NPR=8.5 did not
show a collapsed behaviour onto the same line to that of hydrogen. This can be a result of the much higher
diffusivity of hydrogen in comparison to that of methane which can produce a considerably bulkier jet for
hydrogen.
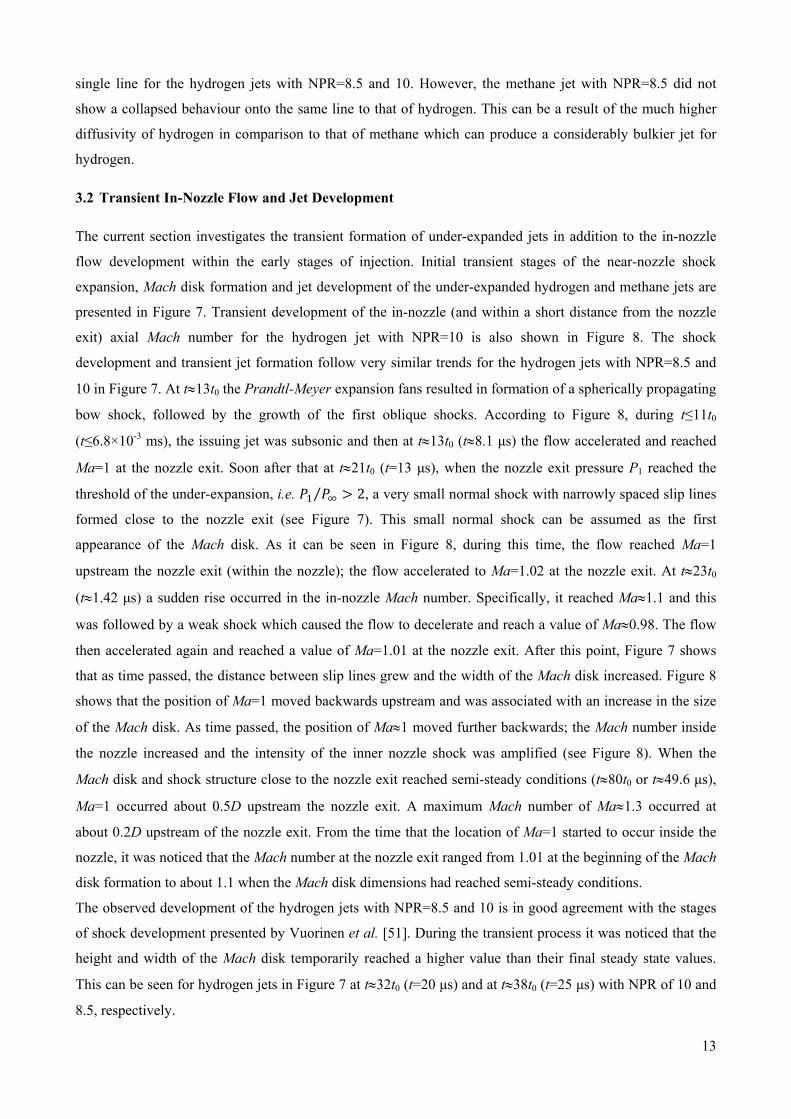
3.2 Transient In-Nozzle Flow and Jet Development
The current section investigates the transient formation of under-expanded jets in addition to the in-nozzle
flow development within the early stages of injection. Initial transient stages of the near-nozzle shock
expansion, Mach disk formation and jet development of the under-expanded hydrogen and methane jets are
presented in Figure 7. Transient development of the in-nozzle (and within a short distance from the nozzle
exit) axial Mach number for the hydrogen jet with NPR=10 is also shown in Figure 8. The shock
development and transient jet formation follow very similar trends for the hydrogen jets with NPR=8.5 and
10 in Figure 7. At t13t0 the Prandtl-Meyer expansion fans resulted in formation of a spherically propagating
bow shock, followed by the growth of the first oblique shocks. According to Figure 8, during t≤11t0
(t≤6.8×10⁻³ ms), the issuing jet was subsonic and then at t13t0 (t8.1 μs) the flow accelerated and reached
Ma=1 at the nozzle exit. Soon after that at t21t0 (t=13 μs), when the nozzle exit pressure P1 reached the
threshold of the under-expansion, i.e. ⁄ 2, a very small normal shock with narrowly spaced slip lines
formed close to the nozzle exit (see Figure 7). This small normal shock can be assumed as the first
appearance of the Mach disk. As it can be seen in Figure 8, during this time, the flow reached Ma=1
upstream the nozzle exit (within the nozzle); the flow accelerated to Ma=1.02 at the nozzle exit. At t23t0
(t1.42 μs) a sudden rise occurred in the in-nozzle Mach number. Specifically, it reached Ma1.1 and this
was followed by a weak shock which caused the flow to decelerate and reach a value of Ma0.98. The flow
then accelerated again and reached a value of Ma=1.01 at the nozzle exit. After this point, Figure 7 shows
that as time passed, the distance between slip lines grew and the width of the Mach disk increased. Figure 8
shows that the position of Ma=1 moved backwards upstream and was associated with an increase in the size
of the Mach disk. As time passed, the position of Ma1 moved further backwards; the Mach number inside
the nozzle increased and the intensity of the inner nozzle shock was amplified (see Figure 8). When the
Mach disk and shock structure close to the nozzle exit reached semi-steady conditions (t80t0 or t49.6 μs),
Ma=1 occurred about 0.5D upstream the nozzle exit. A maximum Mach number of Ma1.3 occurred at
about 0.2D upstream of the nozzle exit. From the time that the location of Ma=1 started to occur inside the
nozzle, it was noticed that the Mach number at the nozzle exit ranged from 1.01 at the beginning of the Mach
disk formation to about 1.1 when the Mach disk dimensions had reached semi-steady conditions.
The observed development of the hydrogen jets with NPR=8.5 and 10 is in good agreement with the stages
of shock development presented by Vuorinen et al. [51]. During the transient process it was noticed that the
height and width of the Mach disk temporarily reached a higher value than their final steady state values.
This can be seen for hydrogen jets in Figure 7 at t32t0 (t=20 μs) and at t38t0 (t=25 μs) with NPR of 10 and
8.5, respectively.
14
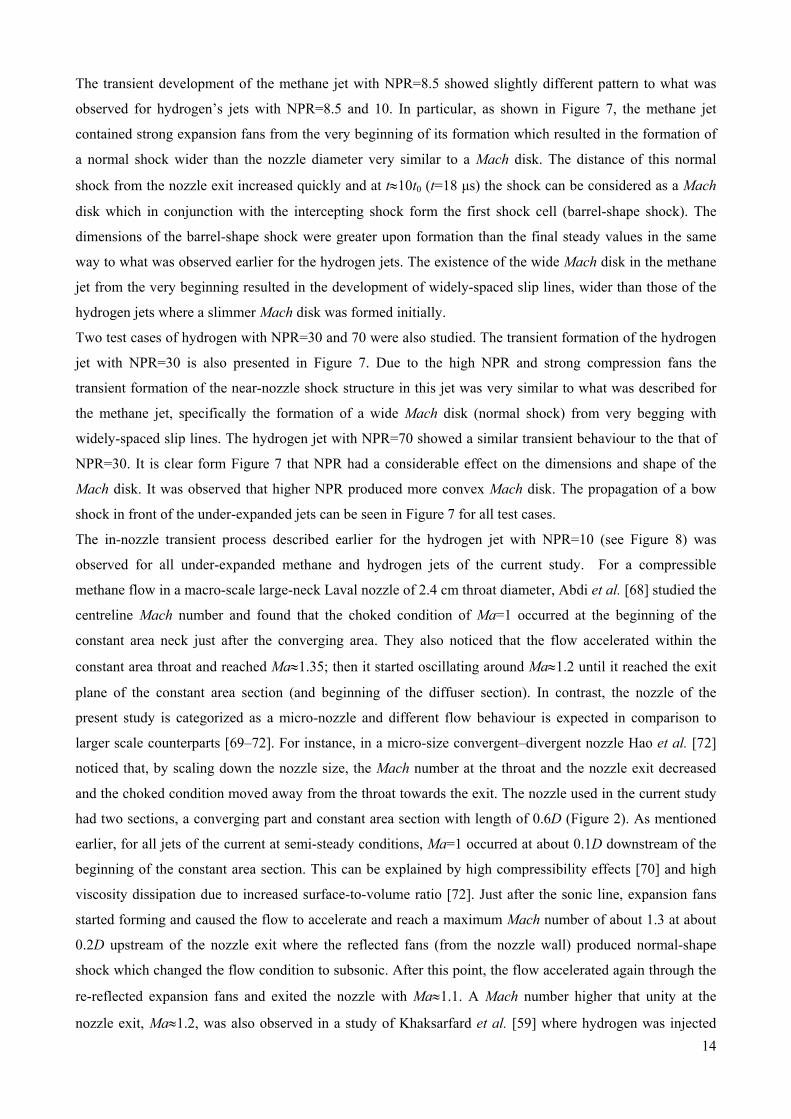
The transient development of the methane jet with NPR=8.5 showed slightly different pattern to what was
observed for hydrogen’s jets with NPR=8.5 and 10. In particular, as shown in Figure 7, the methane jet
contained strong expansion fans from the very beginning of its formation which resulted in the formation of
a normal shock wider than the nozzle diameter very similar to a Mach disk. The distance of this normal
shock from the nozzle exit increased quickly and at t10t0 (t=18 μs) the shock can be considered as a Mach
disk which in conjunction with the intercepting shock form the first shock cell (barrel-shape shock). The
dimensions of the barrel-shape shock were greater upon formation than the final steady values in the same
way to what was observed earlier for the hydrogen jets. The existence of the wide Mach disk in the methane
jet from the very beginning resulted in the development of widely-spaced slip lines, wider than those of the
hydrogen jets where a slimmer Mach disk was formed initially.
Two test cases of hydrogen with NPR=30 and 70 were also studied. The transient formation of the hydrogen
jet with NPR=30 is also presented in Figure 7. Due to the high NPR and strong compression fans the
transient formation of the near-nozzle shock structure in this jet was very similar to what was described for
the methane jet, specifically the formation of a wide Mach disk (normal shock) from very begging with
widely-spaced slip lines. The hydrogen jet with NPR=70 showed a similar transient behaviour to the that of
NPR=30. It is clear form Figure 7 that NPR had a considerable effect on the dimensions and shape of the
Mach disk. It was observed that higher NPR produced more convex Mach disk. The propagation of a bow
shock in front of the under-expanded jets can be seen in Figure 7 for all test cases.
The in-nozzle transient process described earlier for the hydrogen jet with NPR=10 (see Figure 8) was
observed for all under-expanded methane and hydrogen jets of the current study. For a compressible
methane flow in a macro-scale large-neck Laval nozzle of 2.4 cm throat diameter, Abdi et al. [68] studied the
centreline Mach number and found that the choked condition of Ma=1 occurred at the beginning of the
constant area neck just after the converging area. They also noticed that the flow accelerated within the
constant area throat and reached Ma1.35; then it started oscillating around Ma1.2 until it reached the exit
plane of the constant area section (and beginning of the diffuser section). In contrast, the nozzle of the
present study is categorized as a micro-nozzle and different flow behaviour is expected in comparison to
larger scale counterparts [69–72]. For instance, in a micro-size convergent–divergent nozzle Hao et al. [72]
noticed that, by scaling down the nozzle size, the Mach number at the throat and the nozzle exit decreased
and the choked condition moved away from the throat towards the exit. The nozzle used in the current study
had two sections, a converging part and constant area section with length of 0.6D (Figure 2). As mentioned
earlier, for all jets of the current at semi-steady conditions, Ma=1 occurred at about 0.1D downstream of the
beginning of the constant area section. This can be explained by high compressibility effects [70] and high
viscosity dissipation due to increased surface-to-volume ratio [72]. Just after the sonic line, expansion fans
started forming and caused the flow to accelerate and reach a maximum Mach number of about 1.3 at about
0.2D upstream of the nozzle exit where the reflected fans (from the nozzle wall) produced normal-shape
shock which changed the flow condition to subsonic. After this point, the flow accelerated again through the
re-reflected expansion fans and exited the nozzle with Ma1.1. A Mach number higher that unity at the
nozzle exit, Ma1.2, was also observed in a study of Khaksarfard et al. [59] where hydrogen was injected
15
with P0=34.5 MPa into atmospheric ambient. However, in their work the presented injection duration was
not long enough (25 μs) to show the Mach number peak and the transient in-nozzle flow in the same way that
was captured in the current study. In another study, where high pressure flow of nitrogen through an ejector
device (vacuum jet) was investigated [73], the in-nozzle Mach number showed similar variations to those of
the current study, as well as an exit Mach number higher than unity. Certainly further work is required in
order to study in detail the behaviour of the in-nozzle transient compressible flow characteristics in tiny-sized
nozzles. The effects of nozzle design and dimensions form a part of work in progress by the current authors
and will be discussed in a future publication.
3.3 Near-Nozzle Shock Structure
Instantaneous snapshots of both methane and hydrogen jets with NPR=8.5 are shown in Figure 9. The grey-
scaling corresponds to density gradients as discussed earlier. Figure 9 also shows a close-up view of the
near-nozzle shock structure of both jets at a semi-steady condition. The Prandtl-Meyer expansion fans,
barrel-shape shock, Mach disk dimensions, as well as angle of reflected shock, triple points and slip lines,
were all captured in very good agreement with the classic definition of an under-expanded jet [23–26] and
also with computational results [49–51] and experimental visualisations [37] presented by other authors.
Figure 9 also illustrates how the upper range of the legend in the grey-scaled images of | ρ| can have
significant effect on visualising details of the flow’s characteristics. Specifically, decreasing the upper limit
of the legend from | ρ|=2,000 to | ρ|=500 intensifies the clarity of the acoustic pressure waves emitted by
the under-expanded jets. The pictures of Figure 9 are in great agreement with the LES visualisation of the
under-expanded air jets of Dauptain et al. [49, 50]. Table 3 presents quantitatively a comparison of the
important near-field shock characteristics of the different under-expanded jets of the current study.
As mentioned earlier, the Mach disk height can be estimated using the empirical equations (1), (3), (5) and
(7). For a specific substance these empirical relations can be adapted to:
(22)
in which CH is an empirical constant that can be defined by the slope of the lines in Figure 10. Those lines
are based on the results of the current study and on previously mentioned empirical relations. Figure 10
shows that the Mach disk height predicted by the current LES study is in agreement with the empirical
relation of Ashkenaz and Sherman [29], i.e. equation (7), for (P0/P∞)0.5≤5. For higher values of (P0/P∞)0.5
though, the difference between the Hdisk of the current study and that of equation (7) increased and at
(P0/P∞)0.58.4 a difference of about 3.8% was quantified. The current study suggested a value of CH=0.71 for
the empirical constant of equation (22), particularly for under-expanded hydrogen jets. According to [59],
CH0.67 may not be accurate enough for injection pressures above P0=10 MPa. The current study suggests
that in addition to the injection pressure, NPR is also important and for nozzle pressure ratios greater than
about 70 the linear relation between Hdisk/D and (P0/P∞)0.5 may not be valid.
16
As shown in Table 3, by increasing NPR from 8.5 to 10, the Mach disk height and width of the under-
expanded hydrogen jet increased by ~11% and ~23%, respectively. Then by increasing NPR from 10 to 30
an increase of ~83% and ~151% could be seen for the height and width of the Mach disk, respectively. This
showed a considerably higher level of sensitivity of the width of the Mach disk to NPR in comparison to its
height. The correlation suggested by Antsupov [27], i.e. equation (4), was also used to estimate the width of
Mach disk and values of 1.065, 1.33, and 3.12 were obtained for NPR of 8.5, 10 and 30, respectively.
According to Table 3, the current LES study predicted Mach disk width very close to equation (4) for
NPR=8.5 and 10, whilst for NPR=30 a value higher by ~8% was predicted by LES. Reordering equation (6)
for the coefficient ζ and using values of Mach disk height and width obtained from the current LES work, ζ
was estimated to be ~0.72, ~0.80 and ~1.1 for NPR of 8.5, 10, and 30, respectively. Examining more nozzle
pressure ratios could provide the opportunity to plot ζ versus NPR and consequently estimate the Mach disk
width based on its height.
Direct comparison between the methane and hydrogen jets at NPR=8.5 (see Figure 9) reveals that the height
of methane’s Mach disk is ~2.5% larger than that of hydrogen’s. According to equations (2) and (5) the
Mach disk height is weakly related to the ratio of specific heats. If the ratio of specific heats for hydrogen
and methane is used to calculate the Mach disk height by equation (5) (γ1.41 and 1.32, respectively), a
difference of 2.1% is calculated between the two jets which is very close to the 2.5% predicted by LES. It
was also found that the Mach disk width with NPR=8.5 was ~12% wider for methane than for hydrogen (see
Table 3).
The angle of the reflected shock at the triple point was found to be β=28.5 for both methane and hydrogen
jets with NPR=8.5, the same to that reported by Vuorinen et al. [51]. Increasing the NPR from 8.5 to 10
reduced the reflected shock angle slightly to β=28. It was noticed that further increase in NPR did not have
any noticeable effect on the reflected shock angle and for NPR=30 this was also 28. For NPR=70, the value
of β could not be measured with sufficient accuracy because the reflected shock was located outside of the
refined area of the computational grid; however, based on observations of the present work and previous
studies [51] it is believed that for NPR=70 the reflected shock angle would also be about 28, i.e. beyond
NPR=10 the value of β remains almost constant.
From Figure 9 it is evident that the shear layer thickness δ was wider for methane than for hydrogen.
Specifically, for NPR=8.5, the methane jet had δ0.47D in comparison to δ0.22D for hydrogen, i.e. the
shear layer was wider by about 115% for methane. The value of δ for hydrogen is in satisfactory agreement
with the value of δ0.25D for the under-expanded nitrogen jet with NPR=8.5 of [51]. It was also noticed that
by increasing the NPR from 8.5 to 10 and then to 30 the shear layer thickness reduced by about 3% and 19%,
respectively (see Table 3).
3.4 Flow Characteristics of Under-Expanded Jets
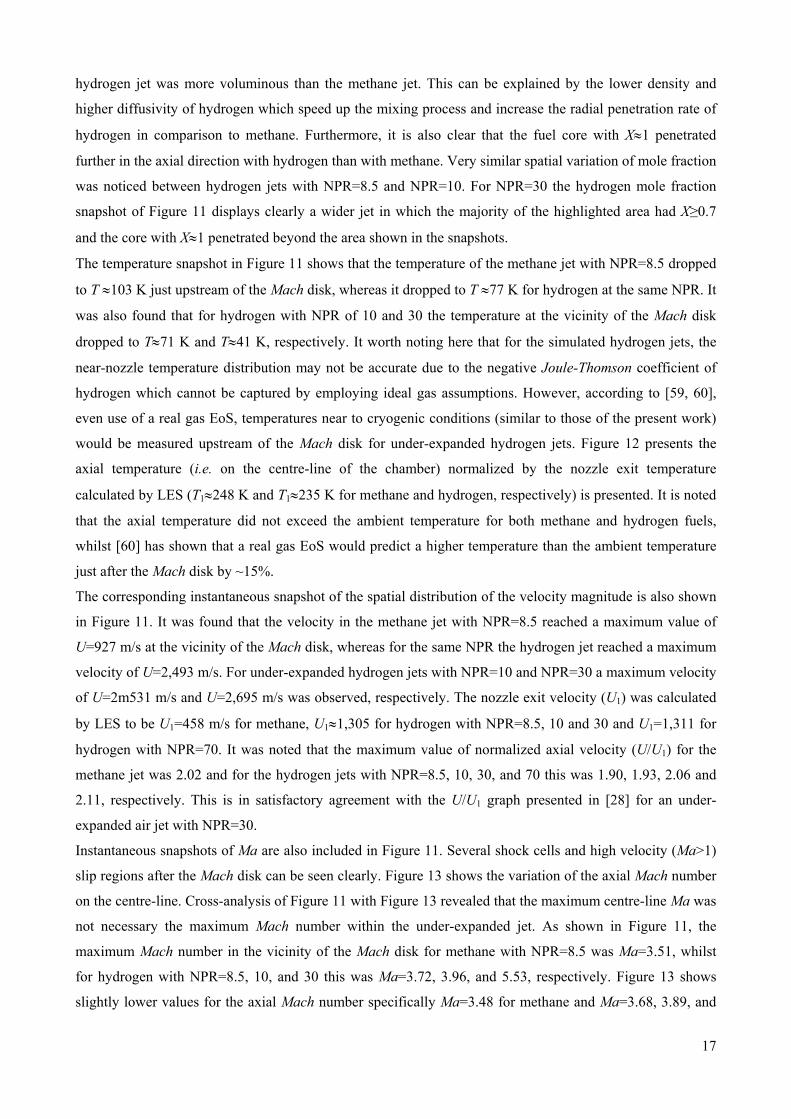
Instantaneous snapshots of fuel mole fraction (H2 or CH4), temperature, velocity and Mach number are
presented at t=0.2 ms after the start of injection in Figure 11 for various values of NPR. A semi opaque mask
has been applied on these snapshots to highlight the main region of interest in the core of the jets. Hydrogen-
air mixing prior to the location of the Mach disk is evident. It is also clear that for the same NPR of 8.5, the
17
hydrogen jet was more voluminous than the methane jet. This can be explained by the lower density and
higher diffusivity of hydrogen which speed up the mixing process and increase the radial penetration rate of
hydrogen in comparison to methane. Furthermore, it is also clear that the fuel core with X1 penetrated
further in the axial direction with hydrogen than with methane. Very similar spatial variation of mole fraction
was noticed between hydrogen jets with NPR=8.5 and NPR=10. For NPR=30 the hydrogen mole fraction
snapshot of Figure 11 displays clearly a wider jet in which the majority of the highlighted area had X≥0.7
and the core with X1 penetrated beyond the area shown in the snapshots.
The temperature snapshot in Figure 11 shows that the temperature of the methane jet with NPR=8.5 dropped
to T 103 K just upstream of the Mach disk, whereas it dropped to T 77 K for hydrogen at the same NPR. It
was also found that for hydrogen with NPR of 10 and 30 the temperature at the vicinity of the Mach disk
dropped to T71 K and T41 K, respectively. It worth noting here that for the simulated hydrogen jets, the
near-nozzle temperature distribution may not be accurate due to the negative Joule-Thomson coefficient of
hydrogen which cannot be captured by employing ideal gas assumptions. However, according to [59, 60],
even use of a real gas EoS, temperatures near to cryogenic conditions (similar to those of the present work)
would be measured upstream of the Mach disk for under-expanded hydrogen jets. Figure 12 presents the
axial temperature (i.e. on the centre-line of the chamber) normalized by the nozzle exit temperature
calculated by LES (T1248 K and T1235 K for methane and hydrogen, respectively) is presented. It is noted
that the axial temperature did not exceed the ambient temperature for both methane and hydrogen fuels,
whilst [60] has shown that a real gas EoS would predict a higher temperature than the ambient temperature
just after the Mach disk by ~15%.
The corresponding instantaneous snapshot of the spatial distribution of the velocity magnitude is also shown
in Figure 11. It was found that the velocity in the methane jet with NPR=8.5 reached a maximum value of
U=927 m/s at the vicinity of the Mach disk, whereas for the same NPR the hydrogen jet reached a maximum
velocity of U=2,493 m/s. For under-expanded hydrogen jets with NPR=10 and NPR=30 a maximum velocity
of U=2m531 m/s and U=2,695 m/s was observed, respectively. The nozzle exit velocity (U1) was calculated
by LES to be U1=458 m/s for methane, U11,305 for hydrogen with NPR=8.5, 10 and 30 and U1=1,311 for
hydrogen with NPR=70. It was noted that the maximum value of normalized axial velocity (U/U1) for the
methane jet was 2.02 and for the hydrogen jets with NPR=8.5, 10, 30, and 70 this was 1.90, 1.93, 2.06 and
2.11, respectively. This is in satisfactory agreement with the U/U1 graph presented in [28] for an under-
expanded air jet with NPR=30.
Instantaneous snapshots of Ma are also included in Figure 11. Several shock cells and high velocity (Ma>1)
slip regions after the Mach disk can be seen clearly. Figure 13 shows the variation of the axial Mach number
on the centre-line. Cross-analysis of Figure 11 with Figure 13 revealed that the maximum centre-line Ma was
not necessary the maximum Mach number within the under-expanded jet. As shown in Figure 11, the
maximum Mach number in the vicinity of the Mach disk for methane with NPR=8.5 was Ma=3.51, whilst
for hydrogen with NPR=8.5, 10, and 30 this was Ma=3.72, 3.96, and 5.53, respectively. Figure 13 shows
slightly lower values for the axial Mach number specifically Ma=3.48 for methane and Ma=3.68, 3.89, and
18
5.44 for hydrogen with NPR=8.5, 10 and 30, respectively. The maximum axial Mach number for the under-
expanded hydrogen jet with NPR=70 was Ma=6.73.
As explained earlier in the current work (and also described in detail in reference [25]), after the Mach disk
and depending on the level of NPR, the flow can accelerate and reach Ma1 several times. In the present
work for methane at NPR=8.5 and hydrogen at NPR=8.5 and 10 it was noticed that just after the Mach disk
the subsonic flow started accelerating and after a specific distance (z/D=3.016, 3.205 and 3.306,
respectively) it started slowing down. For the hydrogen jet with NPR=8.5 the acceleration process caused the
jet to reach Ma1.01 therefore the acceleration length and the length of the subsonic core just after the Mach
disk were the same and equal to lsub1.35D. The Mach number in the methane jet of NPR=8.5 and the
hydrogen jet of NPR=10 reached the maximum values of Ma0.74 and Ma0.82, respectively. Then, further
downstream, a second acceleration process led to Ma>0.9, i.e. to the sonic threshold. For the hydrogen jet
with NPR=30, past the Mach disk, the jet started fluctuating in the range of Ma=0.6–0.7. At z/D5.1 the jest
reached Ma=0.91 which created a subsonic length of lsub3.8D. For the hydrogen jet with NPR=70 no major
flow acceleration was noticed past the Mach disk and the jet continued decaying in a subsonic manner,
similarly to what has been described in [25].
Figures 14 and 15 illustrate the axial pressure (P) and normalized axial density (ρ/ρ1) (i.e. on the centre-line
of the chamber) for the methane and hydrogen jets. A higher transient fluctuation of both axial pressure and
normalized axial density was seen for hydrogen with NPR=8.5 in comparison to the methane jet at the same
NPR; this indicated higher compressibility effects for the hydrogen jet. In the vicinity of the Mach disk for
the methane jet and hydrogen jets with NPR=8.5, 10 and 30, the pressure reached a value higher than the
ambient pressure and then started fluctuating around the ambient value. For hydrogen with NPR=70, the
pressure jumped to a value lower than the ambient just after the Mach disk and then increased, but with a
lower level of fluctuation in comparison to the other test cases. Hydrogen’s density dropped to values as low
as ~0.02 kg/m3 and then increased almost instantly past the Mach disk due to the normal shock
recompression. After the Mach disk location, density increased towards the ambient value via a fluctuating
pattern. It was noticed that a lower NPR would result in higher density fluctuations and, consequently, a
faster growth rate of the jet’s axial density. The nozzle exit density (ρ1) for the methane jet with NPR=8.5
and for the hydrogen jets with NPR=8.5, 10, 30 and 70 was 3.04, 0.39, 0.46, 1.37 and 3.23 kg/m3,
respectively. These values resulted in respective mass flow rates of 2.46, 0.90, 1.06, 3.16 and 7.49 g/s.
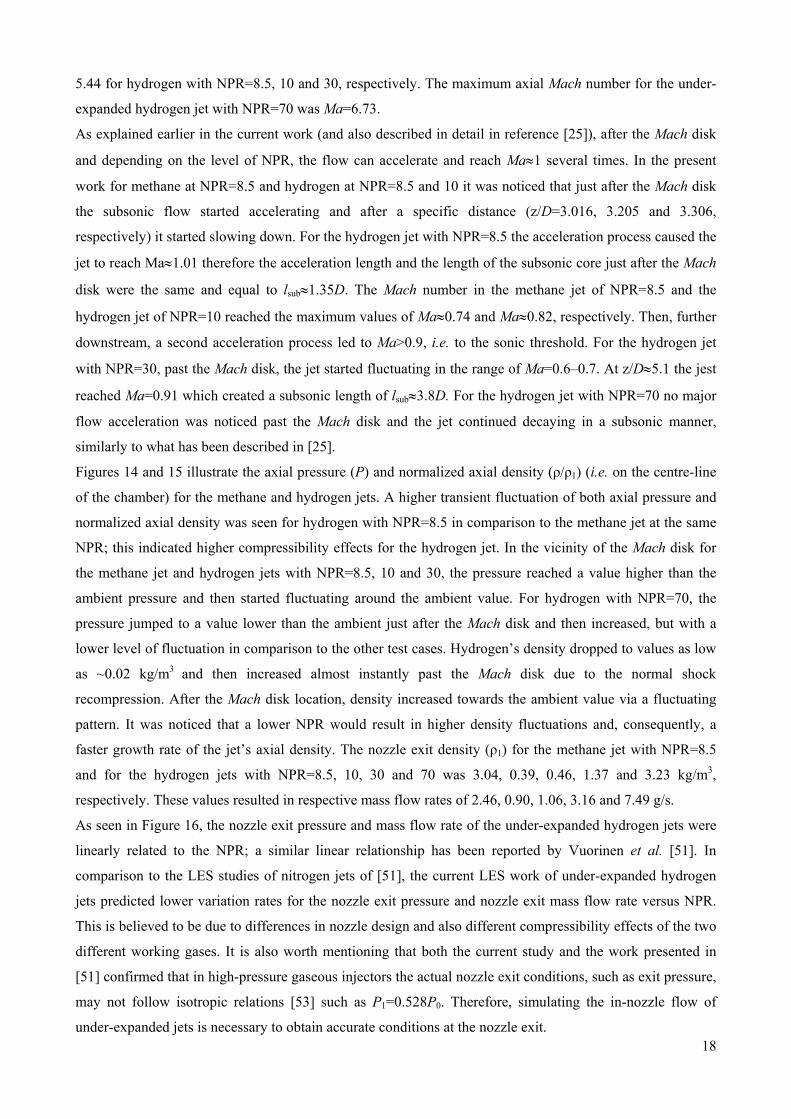
As seen in Figure 16, the nozzle exit pressure and mass flow rate of the under-expanded hydrogen jets were
linearly related to the NPR; a similar linear relationship has been reported by Vuorinen et al. [51]. In
comparison to the LES studies of nitrogen jets of [51], the current LES work of under-expanded hydrogen
jets predicted lower variation rates for the nozzle exit pressure and nozzle exit mass flow rate versus NPR.
This is believed to be due to differences in nozzle design and also different compressibility effects of the two
different working gases. It is also worth mentioning that both the current study and the work presented in
[51] confirmed that in high-pressure gaseous injectors the actual nozzle exit conditions, such as exit pressure,
may not follow isotropic relations [53] such as P1=0.528P0. Therefore, simulating the in-nozzle flow of
under-expanded jets is necessary to obtain accurate conditions at the nozzle exit.
19
3.5 Mixing Characteristics
As seen in Figures 4 and 9, methane-air mixing did not occur before the Mach disk. In contrast, the strong
fluctuations at the jet boundary before the Mach disk of the hydrogen jet represented considerable level of
momentum exchange and mixing just by the border of the barrel-shape shock. This mixing is associated with
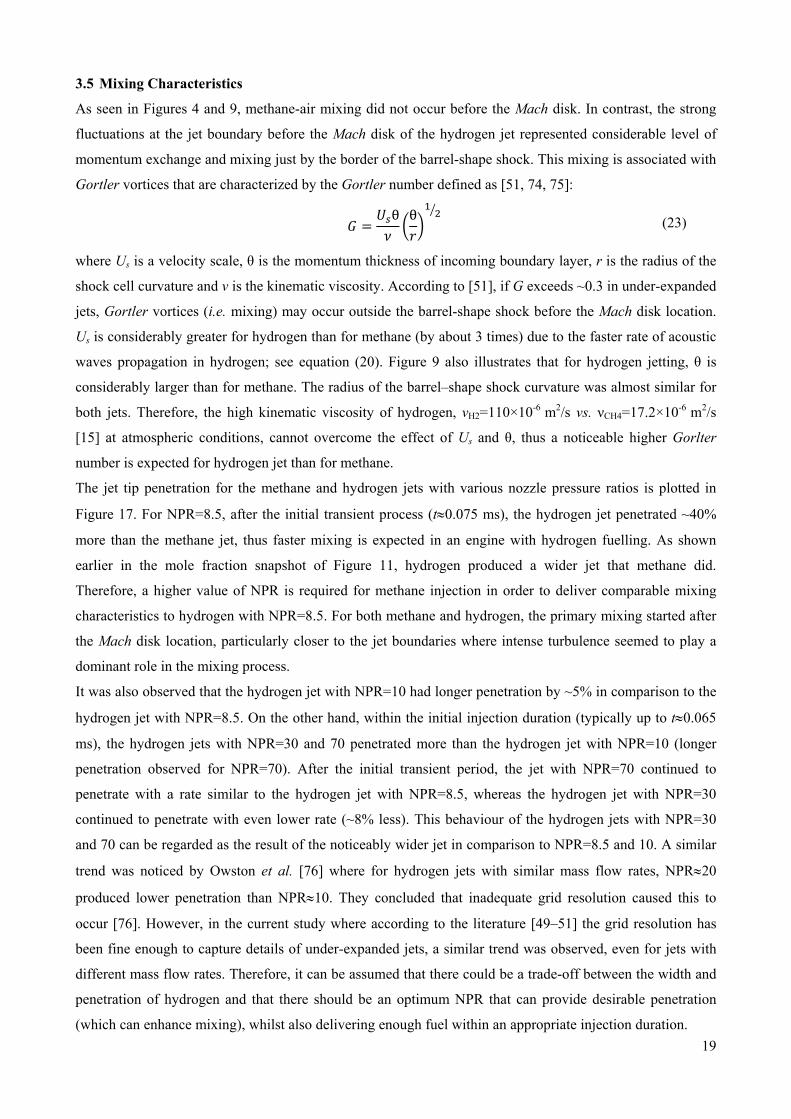
Gortler vortices that are characterized by the Gortler number defined as [51, 74, 75]:
θ θ (23)
where Us is a velocity scale, θ is the momentum thickness of incoming boundary layer, r is the radius of the
shock cell curvature and ν is the kinematic viscosity. According to [51], if G exceeds ~0.3 in under-expanded
jets, Gortler vortices (i.e. mixing) may occur outside the barrel-shape shock before the Mach disk location.
Us is considerably greater for hydrogen than for methane (by about 3 times) due to the faster rate of acoustic
waves propagation in hydrogen; see equation (20). Figure 9 also illustrates that for hydrogen jetting, θ is
considerably larger than for methane. The radius of the barrel–shape shock curvature was almost similar for
both jets. Therefore, the high kinematic viscosity of hydrogen, νH2=110×10-6 m2/s vs. νCH4=17.2×10⁻⁶ m2/s
[15] at atmospheric conditions, cannot overcome the effect of Us and θ, thus a noticeable higher Gorlter
number is expected for hydrogen jet than for methane.
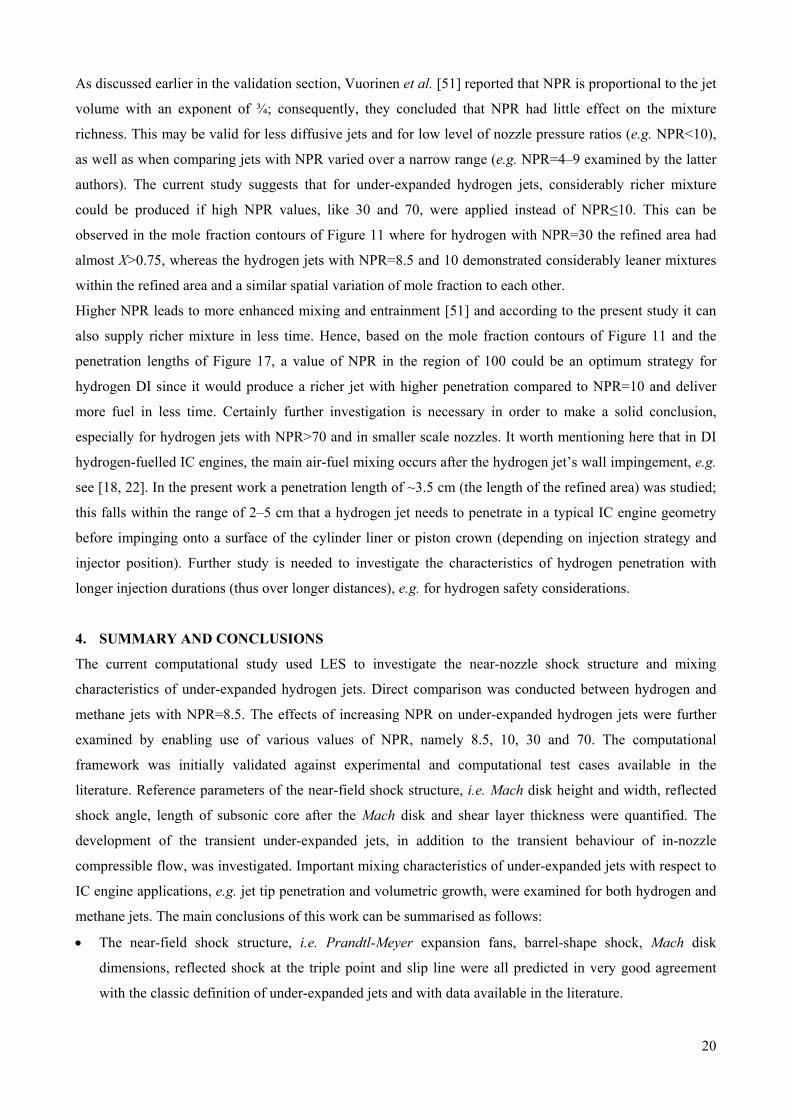
The jet tip penetration for the methane and hydrogen jets with various nozzle pressure ratios is plotted in
Figure 17. For NPR=8.5, after the initial transient process (t0.075 ms), the hydrogen jet penetrated ~40%
more than the methane jet, thus faster mixing is expected in an engine with hydrogen fuelling. As shown
earlier in the mole fraction snapshot of Figure 11, hydrogen produced a wider jet that methane did.
Therefore, a higher value of NPR is required for methane injection in order to deliver comparable mixing
characteristics to hydrogen with NPR=8.5. For both methane and hydrogen, the primary mixing started after
the Mach disk location, particularly closer to the jet boundaries where intense turbulence seemed to play a
dominant role in the mixing process.
It was also observed that the hydrogen jet with NPR=10 had longer penetration by ~5% in comparison to the
hydrogen jet with NPR=8.5. On the other hand, within the initial injection duration (typically up to t0.065
ms), the hydrogen jets with NPR=30 and 70 penetrated more than the hydrogen jet with NPR=10 (longer
penetration observed for NPR=70). After the initial transient period, the jet with NPR=70 continued to
penetrate with a rate similar to the hydrogen jet with NPR=8.5, whereas the hydrogen jet with NPR=30
continued to penetrate with even lower rate (~8% less). This behaviour of the hydrogen jets with NPR=30
and 70 can be regarded as the result of the noticeably wider jet in comparison to NPR=8.5 and 10. A similar
trend was noticed by Owston et al. [76] where for hydrogen jets with similar mass flow rates, NPR20
produced lower penetration than NPR10. They concluded that inadequate grid resolution caused this to
occur [76]. However, in the current study where according to the literature [49–51] the grid resolution has
been fine enough to capture details of under-expanded jets, a similar trend was observed, even for jets with
different mass flow rates. Therefore, it can be assumed that there could be a trade-off between the width and
penetration of hydrogen and that there should be an optimum NPR that can provide desirable penetration
(which can enhance mixing), whilst also delivering enough fuel within an appropriate injection duration.
20
As discussed earlier in the validation section, Vuorinen et al. [51] reported that NPR is proportional to the jet
volume with an exponent of ¾; consequently, they concluded that NPR had little effect on the mixture
richness. This may be valid for less diffusive jets and for low level of nozzle pressure ratios (e.g. NPR<10),
as well as when comparing jets with NPR varied over a narrow range (e.g. NPR=4–9 examined by the latter
authors). The current study suggests that for under-expanded hydrogen jets, considerably richer mixture
could be produced if high NPR values, like 30 and 70, were applied instead of NPR≤10. This can be
observed in the mole fraction contours of Figure 11 where for hydrogen with NPR=30 the refined area had
almost X>0.75, whereas the hydrogen jets with NPR=8.5 and 10 demonstrated considerably leaner mixtures
within the refined area and a similar spatial variation of mole fraction to each other.
Higher NPR leads to more enhanced mixing and entrainment [51] and according to the present study it can
also supply richer mixture in less time. Hence, based on the mole fraction contours of Figure 11 and the
penetration lengths of Figure 17, a value of NPR in the region of 100 could be an optimum strategy for
hydrogen DI since it would produce a richer jet with higher penetration compared to NPR=10 and deliver
more fuel in less time. Certainly further investigation is necessary in order to make a solid conclusion,
especially for hydrogen jets with NPR>70 and in smaller scale nozzles. It worth mentioning here that in DI
hydrogen-fuelled IC engines, the main air-fuel mixing occurs after the hydrogen jet’s wall impingement, e.g.
see [18, 22]. In the present work a penetration length of ~3.5 cm (the length of the refined area) was studied;
this falls within the range of 2–5 cm that a hydrogen jet needs to penetrate in a typical IC engine geometry
before impinging onto a surface of the cylinder liner or piston crown (depending on injection strategy and
injector position). Further study is needed to investigate the characteristics of hydrogen penetration with
longer injection durations (thus over longer distances), e.g. for hydrogen safety considerations.
4. SUMMARY AND CONCLUSIONS
The current computational study used LES to investigate the near-nozzle shock structure and mixing
characteristics of under-expanded hydrogen jets. Direct comparison was conducted between hydrogen and
methane jets with NPR=8.5. The effects of increasing NPR on under-expanded hydrogen jets were further
examined by enabling use of various values of NPR, namely 8.5, 10, 30 and 70. The computational
framework was initially validated against experimental and computational test cases available in the
literature. Reference parameters of the near-field shock structure, i.e. Mach disk height and width, reflected
shock angle, length of subsonic core after the Mach disk and shear layer thickness were quantified. The
development of the transient under-expanded jets, in addition to the transient behaviour of in-nozzle
compressible flow, was investigated. Important mixing characteristics of under-expanded jets with respect to
IC engine applications, e.g. jet tip penetration and volumetric growth, were examined for both hydrogen and
methane jets. The main conclusions of this work can be summarised as follows:
The near-field shock structure, i.e. Prandtl-Meyer expansion fans, barrel-shape shock, Mach disk
dimensions, reflected shock at the triple point and slip line were all predicted in very good agreement
with the classic definition of under-expanded jets and with data available in the literature.
21
During the initial transient process the height and width of the Mach disk of both methane and hydrogen
jets temporarily reached higher values than those observed at steady state.
The near-nozzle shock structure of the methane jet with NPR=8.5 showed slightly different pattern to the
hydrogen jets of NPR=8.5 and 10. The methane jet contained strong expansion fans from the very
beginning of its formation and resulted in a normal shock wider than the nozzle diameter that was very
similar to a Mach disk. In turn, this led to widely-spaced slip lines in comparison to those of the
hydrogen jets which were associated with a slim Mach disk.
For hydrogen with NPR=30, the transient formation of the near-nozzle shock structure was comparable
to that of the methane jet with NPR=8.5, i.e. with presence of a wide Mach disk (normal shock) from the
very beginning and widely-spaced slip lines.
The height and width of the Mach disk were very sensitive to NPR. A higher degree of sensitivity was
noticed for the width of the disk than for its height. Increasing NPR from 10 to 30 for hydrogen resulted
in an increase of 83% and 150% in the height and width of the Mach disk, respectively.
The methane jet with NPR=8.5 had larger height and width by 2.5% and 12%, respectively, than the
corresponding hydrogen jet, potentially due to the lower ratio of specific heats (γ) of methane.
For methane, mixing did not occur before the Mach disk, whereas for hydrogen high level of momentum
exchange and mixing was observed at the boundaries of the jet. This is believed to be related to the effect
of higher turbulent fluctuations at the nozzle exit and the larger Gortler number for hydrogen which
triggered the presence of Gortler vortices and initiated the mixing process.
For all under-expanded jets at semi-steady conditions, chocked flow of Ma1 occurred inside the nozzle
volume at about 0.5D upstream of the nozzle exit. A maximum Ma of about 1.3 was calculated about
0.2D upstream of the nozzle exit whilst the nozzle exit Ma was about 1.1. Considering the small scale of
the nozzle, high viscosity dissipation due to large surface-to-volume ratio and also exceptional
compressible effects are potential reasons for this behaviour. However, more work is required in order to
clarify the in-nozzle transient hydrogen flow behaviour of small-size nozzles.
The angle of the reflected shock at the triple point was 28.5 for both methane and hydrogen fuelling
with NPR=8.5. Increasing NPR from 8.5 to 10 reduced slightly the reflected shock angle to 28, whilst
further increase in NPR did not have any noticeable effect on this angle.
For NPR=8.5 the shear layer thickness was wider for methane than for hydrogen by 114%. Increasing
NPR for hydrogen from 8.5 to 10 and then 30 led to a narrower shear layer by 3% and 19%, respectively.
The difference between methane and hydrogen jets in terms of the penetration length and volumetric
growth was found to come from differences in both sonic characteristics and diffusivity. The sonic
characteristics of the two jets were different due to differences in the ratio of specific heats and density.
This resulted in hydrogen reaching higher supersonic velocities than methane and considerably higher
penetration. Additionally, the higher diffusivity of hydrogen resulted in the formation of a bulkier jet
(due to accelerated radial mixing) compared to methane fuelling.
22
It was confirmed that both the nozzle exit pressure and nozzle mass flow rate of under-expanded
hydrogen jets were linearly related to NPR. For NPR=8.5 the hydrogen jet penetrated about 40% more
than the methane jet, thus faster in-cylinder mixing is expected for hydrogen. Higher NPR was required
for methane in order to deliver comparable mixing characteristics to those of a hydrogen jet.
Higher NPR did not necessarily increase the hydrogen jet’s penetration. After the initial transient process
of ~0.1 ms, the jet with NPR=70 showed a penetration length comparable to that with NPR=8.5.
NPR=30 produced even lower penetration by about 8%. NPR=100 could be the optimum for hydrogen
injection with the current geometry but further study is needed for a widely applicable conclusion.
Values of NPR in excess of 30 can have significant effect on the mixture richness within under-expanded
hydrogen jets and can provide richer mixture in less time.
For all methane and hydrogen jets studied in the current work, the main mixing was observed to start
after the Mach disk location and particularly close to the jet boundaries where intense turbulence was
noticed to play a dominant role in the mixing process.
Finally it should be noted that the in-cylinder operating conditions of hydrogen-fuelled engines can be
significantly different from the ambient conditions used within the objectives of the current study, i.e.
elevated pressures and temperatures, depending on injection timing. However, although the conditions used
here are representative primarily of processes with early injection strategies (i.e. intake stoke and early
compression stroke injection timings), the different NPR values used in the current study provided
significant information regarding characteristics of under-expanded transient jets and in-nozzle gaseous flow
behaviour which can be used to design advanced high pressure gaseous injection systems including high-
pressure hydrogen injectors. Additionally, it is noted that for under-expanded jets the sonic characteristics do
not depend on the downstream condition (in-cylinder) and are primarily affected by the level of NPR. For
instance let’s consider two jets with NPR=10 which the first one is injected with 10 bar into 1 bar ambient
and the other one is injected into a 10 bar ambient with 100 bar injection pressure. The near-nozzle shock
structure for both jets would be expected to be quite similar. However, mixing characteristics particularly
downstream of the Mach disk would be different. The characteristics of under-expanded hydrogen and
methane jets under elevated conditions of ambient pressure and temperature are also being investigated by
the current authors and will be discussed in a future publication.
ACKNOWLEDGEMENTS
The authors acknowledge the use of University College London’s Legion High Performance Computing
Facility (Legion@UCL) and associated support services in the completion of this work. The authors would
also like to thank all members of the UCL Internal Combustion Engines Group for their assistance and many
valuable discussions.
23
REFERENCES
[1] Bokris J. O’M., The Origin of Ideas on a Hydrogen Economy and its Solution to the Decay of the
Environment, International Journal of Hydrogen Energy, Vol. 27, 2002, pp. 731–740.
[2] Lattin W.C., and Utgikar V.P., Transition to hydrogen economy in the United States: A 2006 status
report, International Journal of Hydrogen Energy, Vol. 32, 2007, pp. 3230–3237.
[3] White C.M., Steeper R.R., and Lutz A.E., The hydrogen-fueled internal combustion engine: A technical
review, International Journal of Hydrogen Energy, Vol. 31, 2006, pp. 1292–1305.
[4] Verhelst S., and Wallner T., Hydrogen-fueled internal combustion engines, Progress in Energy and
Combustion Science, Vol. 35, 2009, pp. 490–527.
[5] Al-Baghdadi M., and Al-Janabi H.A., A prediction study of a spark ignition supercharged hydrogen
engine, Energy Conversion and Management, Vol. 44, 2003, pp. 3143–3150.
[6] Berckmüller M., Rottengruber H., Eder A., Brehm N. et al., Potentials of a Charged SI-Hydrogen Engine,
SAE Technical Paper 2003-01-3210, 2003.
[7] Verhelst S., and Sierens R., Combustion Studies for PFI Hydrogen IC Engines, SAE Technical Paper
2007-01-3610, 2007.
[8] Verhelst S., Maesschalck P., Rombaut N., and Sierens R., Increasing the power output of hydrogen
internal combustion engines by means of supercharging and exhaust gas recirculation, International Journal
of Hydrogen Energy, Vol. 34, 2009, pp. 4406–4412.
[9] Kawahara N., and Tomita E., Visualization of auto-ignition and pressure wave during knocking in a
hydrogen spark-ignition engine, International Journal of Hydrogen Energy, Vol. 34, 2009, pp. 3156-3163.
[10] Rakopoulos C.D., Kosmadakis G.M., and Pariotis E.G., Evaluation of a combustion model for the
simulation of hydrogen spark-ignition engines using a CFD code, International Journal of Hydrogen Energy,
Vol. 35, 2010, pp. 12545–12560.
[11] Rakopoulos C.D., Kosmadakis G.M., Demuynck J., De Paepe M., and Verhelst S., A combined
experimental and numerical study of thermal processes, performance and nitric oxide emissions in a
hydrogen-fueled spark-ignition engine, International Journal of Hydrogen Energy, Vol. 36, 2011, pp. 5163–
5180.
[12] Aleiferis P.G., and Rosati M.F., Flame chemiluminescence and OH LIF imaging in a hydrogen-fuelled
spark-ignition engine, International Journal of Hydrogen Energy, Vol. 37, 2012, pp. 1797–1812.
[13] Kaiser S. and White C., PIV and PLIF to Evaluate Mixture Formation in a Direct-Injection Hydrogen-
Fuelled Engine, SAE Int. J. Engine, 2009, pp. 657–668.
[14] Wallner T., Nande A., and Naber J., Evaluation of Injector Location and Nozzle Design in a Direct-
Injection Hydrogen Research Engine, SAE Technical Paper 2008-01-1785, 2008.
[15] Rosati M., and Aleiferis, P.G., Hydrogen SI and HCCI Combustion in a Direct-Injection Optical
Engine, SAE Int. J. Engines, 2009, pp. 1710–1736.
[16] Scarcelli R., Wallner T. Salazar V., and Kaiser S., Modeling and Experiments on Mixture Formation in
a Hydrogen Direct-Injection Research Engine, SAE Int. J. Engines, 2010, pp. 530–541.
24
[17] Salazar V. and Kaiser S., An Optical Study of Mixture Preparation in a Hydrogen-fueled Engine with
Direct Injection Using Different Nozzle Designs, SAE Int. J. Engines 2010, 119–131.
[18] Scarcelli R., Wallner T., Matthias N., Salazar V. et al., Mixture Formation in Direct Injection Hydrogen
Engines: CFD and Optical Analysis of Single- and Multi-Hole Nozzles, SAE Int. J. Engines, 2011, pp.
2361–2375.
[19] Roy M., Kawahara N., Tomita E., and Fujitani T., High-Pressure Hydrogen Jet and Combustion
Characteristics in a Direct-Injection Hydrogen Engine, SAE Int. J. Fuels Lubr., 2012, pp. 1414-1425.
[20] Nakagawa K., Yamane K., and Ohira T., Potential of Large Output Power, High Thermal Efficiency,
Near-zero NOx Emission, Supercharged, Lean-burn, Hydrogen-fuelled, Direct Injection Engines, Energy
Procedia, Vol. 29, 2012, pp. 455–462.
[21] Aleiferis P.G., and Rosati M.F., Controlled autoignition of hydrogen in a direct-injection optical engine,
Combustion and Flame, Vol. 159, 2012, pp. 2500–2515.
[22] Hamzehloo A., and Aleiferis, P.G, Computational Study of Hydrogen Direct Injection for Internal
Combustion Engines, SAE Technical Paper 2013-01-2524, 2013.
[23] Crist S., Sherman P. M., and Glass D. R., Study of the highly underexpanded sonic jet, AIAA J. Vol. 4,
1966, pp. 68-71.
[24] Abbett M., The Mach Disk in Underexpanded Exhaust Plumes, AIAA Journal, Vol. 9, 1971, pp. 512–
514.
[25] Donaldson C. DuP., and Snedeker R. S. 1971 A study of free jet impingement. Part 1. Mean properties
of free and impinging jets. J. Fluid Mech. 1971, Vol. 45, pp. 281–319.
[26] Ewan BCR, Moodie K, Structure and velocity measurements in underexpanded jets, Combustion
Science and Technology 1986; Vol. 45, pp. 275–288.
[27] Antsupov A.V., Properties of underexpanded and overexpanded supersonic gas jets. Soviet Physics and
Technical Physics, 1974, Vol. 19, pp. 234–238.
[28] Velikorodny A., and Kudriakov S., Numerical study of the near-field of highly underexpanded turbulent
gas jets, International Journal of Hydrogen Energy, Vol. 37, 2012, pp. 17390–17399.
[29] Ashkenas H., and Sherman F.S., The structure and utilization of supersonic free jets in low density wind
tunnel. In Advances in Applied Mechanics—Rarefied Gas Dynamics. Academic Press: New York, 1965, pp.
84–105.
[30] Turner J.S., The starting plume in neutral surroundings, J. Fluid Mech, Vol.13, 1962, pp. 356-368.
[31] Hill P.G., and Ouellette P., Transient turbulent gaseous fuel jets for diesel engines, Journal of Fluids
Engineering, Vol.121, 1999, pp. 93-101.
[32] Abraham J., Entrainment characteristics of transient gas jets, Numerical Heat Transfer, Vol.30, 1996,
pp. 3478-364.
[33] Petersen B., and Ghandhi J., Transient High-Pressure Hydrogen Jet Measurements, SAE Technical
Paper 2006-04-03, 2006.
[34] Chuech S.G., Lai M.C., and Faeth G.M., Structure of turbulent sonic underexpanded free jets, AIAA
Journal, Vol. 27, 1989, pp. 549–556.
25
[35] Panda J., and Seasholtz R. G., Measurement of shock structure and shock–vortex interaction in
underexpanded jets using Rayleigh scattering, Phys. Fluids, Vol. 11, 1999.
[36] Yuceil K.B., and Otugen M.V., Scaling parameters for underexpanded supersonic jets, Physics of
Fluids, Vol. 14, 2002.
[37] Yu J., Vuorinen V., Hillamo H., Sarjovaara T. et al., An Experimental Study on High Pressure Pulsed
Jets for DI Gas Engine Using Planar Laser-Induced Fluorescence, SAE Technical Paper 2012-01-1655,
2012.
[38] Prudhomme S. M., Haj-Hariri H, Investigation of supersonic underexpanded jets using adaptive
unstructured finite elements, Finite Elements in Analysis and Design, Vol. 17, 1994, pp. 21-40,
[39] Irie T., Yasunobu T., Kashimura H., and Setoguchi T., Characteristics of the Mack Disk in the
underexpanded jet in which the back pressure continuously changes with time, Journal of Thermal Science,
Vol. 12, 2003, pp. 132–137.
[40] Cheng T. S. and Lee K. S., Numerical simulations of underexpanded supersonic jet and free shear layer
using WENO schemes, International Journal of Heat and Fluid Flow, Vol. 26, 2005, pp. 755-770.
[41] Suzuki H., Endo M., and Sakakibara Y., Structure and Oscillation of Underexpanded Jet, Open Journal
of Fluid Dynamics, Vol. 3, 2013, pp. 85–91.
[42] Dubs P., Khalij M., Benelmir R., and Tazibt A., Study on the dynamical characteristics of a supersonic
high pressure ratio underexpanded impinging ideal gas jet through numerical simulations, Mechanics
Research Communications, Vol. 38, 2011, pp. 267–273.
[43] Chauvet N., Deck S., and Jacquin L., Numerical Study of Mixing Enhancement in a Supersonic Round
Jet, AIAA Journal, Vol. 45, 2007, pp. 1675-1687.
[44] Lehnasch G., and Bruel P., A robust methodology for RANS simulations of highly underexpanded jets,
International Journal for Numerical Methods in Fluids, Vol. 56, 2008, pp. 2179-2205.
[45] White T., Milton B., 2008. Shock wave calibration of under expanded natural gas fuel jets. Shock
Waves, Vol. 18, 2008, pp. 353–364.
[46] Chin C., Li M., Harkin C., Rochwerger T., Chan L., and Ooi A., Investigation of the Flow Structures in
Supersonic Free and Impinging Jet Flows, Journal of Fluids Engineering, Vol. 135, 2013.
[47] Chauvet N., Deck S., and Jacquin L., Zonal Detached Eddy Simulation of a Controlled Propulsive Jet,
AIAA Journal, Vol. 45, 2007, pp. 2458-2473.
[48] Deck S., Delayed detached eddy simulation of the end-effect regime and side-loads in an overexpanded
nozzle flow, Shock Waves, 2009, Vol. 19, pp. 239-249.
[49] Dauptain A., Cuenot B., and Gicquel Y.M., Large-eddy simulation of a stable supersonic jet impinging
on flat plate, AIAA J. Vol. 48, 2010, pp. 2325–2337.
[50] Dauptain A., and Gicquel Y.M., Large Eddy Simulation of Supersonic Impinging Jets, AIAA J. Vol. 50,
2012, pp. 1560–1574.
[51] Vuorinen V., Yu J., Tirunagari S., Kaario O., Larmi M., et al, Large-eddy simulation of highly
underexpanded transient gas jets, Phys. Fluids, Vol. 23, 2011.
26
[52] Yu J., Vuorinen V., Kaario O., Sarjovaara T., and Larmi M., Visualization and analysis of the
characteristics of transitional underexpanded jets, International Journal of Heat and Fluid Flow, Vol. 44,
2013, pp. 140–154.
[53] Anderson J. D., Modern compressible flow: with historical prespective, 3rd Edition, McGraw-Hill, 2003.
[54] Roe P.L., Approximate Riemann solvers, parameter vectors, and difference schemes, Journal of
Computational Physics, Vol. 43, 1981, pp. 357-372
[55] Liou M. S., and Steffen C. J., A New Flux Splitting Scheme, Journal of Computational Physics, Vol.
107, pp. 23–39, 1993.
[56] Ruggles A.J., and Ekoto I.W., Ignitability and mixing of underexpanded hydrogen jets, International
Journal of Hydrogen Energy, Vol. 37, 2012, pp. 17549–17560.
[57] Gorlé C., and Gamba M., Ham F., Investigation of an underexpanded hydrogen jet in quiescent air using
numerical simulations and experiments, Annual Research Briefs 2010, Center for Turbulence Research,
Stanford University.
[58] Gorlé C., and Iaccarino G., Large eddy and Reynolds-Averaged Navier-Stokes simulations of an
underexpanded sonic jet, 7th European Symposium on Aerothermodynamics, European Space Agency,
Netherlands, 2011.
[59] Khaksarfard R., Kameshki M. R., and Paraschivoiu M., Numerical simulation of high pressure release
and dispersion of hydrogen into air with real gas model, Shock Waves, Vol. 20, 2010, pp. 205–216.
[60] Bonelli F., Viggiano A., and Magi V., A Numerical Analysis of Hydrogen Underexpanded Jets Under
Real Gas Assumption, Journal of Fluids Engineering, Vol. 135, 2013.
[61] Weiss J. M., and Smith W. A., Preconditioning Applied to Variable and Constant Density Flows, AIAA
J., Vol. 33, 1995, pp. 2050–2057.
[62] Weiss J. M., Maruszewski J. P., and Smith W. A., Implicit Solution of Preconditioned Navier–Stokes
Equations Using Algebraic Multigrid, AIAA J., Vol. 37, 1999, pp. 29–36.
[63] Nicoud F., and Ducros F., Subgrid-Scale Stress Modelling Based on the Square of the Velocity Gradient
Tensor, Flow, Turbulence and Combustion, Vol. 62, 1999, pp. 183–200.
[64] Cussler E.L., Diffusion: mass transfer in fluid systems, Third edition, Cambridge University Press,
2009.
[65] Hirschfelder J.O., Curtiss C.F., and Bird R.B., Molecular Theory of Gases and Liquids, John Wiley &
Sons, Second Edition, 1964.
[66] Gad-el-Hak M., The Fluid Mechanics of Microdevices – The freeman Scholar Lecture, 1999, Journal of
Fluid Engineering, pp. 5–33.
[67] Ouellette P., Hill P.G., Turbulent Transient Gas Injections, Journal of Fluid Engineering, 2000, pp. 743–
753.
[68] Abdi M.A., Jassim E., Haghighi M., and Muzychka Y., Applications of CFD in Natural Gas Processing
and Transportation, Computational Fluid Dynamics, 2010, Hyoung Woo Oh (Ed.).
[69] Ho C., and Tai Y., Micro-Electro-Mechanical-Systems (MEMS) and Fluid Flows, Annual Reviews
Fluid Mechanics, Vol. 30, 1998, pp. 579–612.
27
[70] Jie D., Diao X., Cheong K.B., and Yong L.K., Navier–Stokes simulations of gas flow in micro devices,
Journal of Micromechanics and Microengineering, Vol. 10, 2000, pp. 372–379.
[71] Rostami A.A., Mujumdar A.S., and Saniei N., Flow and heat transfer for gas flowing in microchannels:
a review, Heat and Mass Transfer, Vol. 38, 2002, pp. 359–367.
[72] Hao P.F, Ding Y., Yao Z., He F., and Zhu K. Size effect on gas flow in micro nozzles, Journal of
Micromechanics and Microengineering, Vol. 15, 2005, pp. 2069–2073.
[73] Zhu Y., and Jiang P., Experimental and numerical investigation of the effect of shock wave
characteristics on the ejector performance, International Journal of Refrigeration, Vol. 40, 2014, pp. 31–42.
[74] Hall P., Taylor-Gortler vortices in fully developed or boundary-layer flows: linear theory, Journal of
Fluid Mechanics, Vol. 124, 1982, pp. 475–494.
[75] Saric W.S.m, Gortler Vortices, Annual Reviews Fluid Mechanics, Vol. 26, 1994, pp 379–409.
[76] Owston R., Magi V., and Abraham J., Fuel-Air Mixing Characteristics of DI Hydrogen Jets, SAE Int. J.
Engines, 2009, pp. 693–712.

28
NOMENCLATURE
AUSM Advection Upstream Splitting Method
Cp Specific heat
Cs Sutherland’s constant
CH4 Methane
D Nozzle exit diameter
Di Diffusion coefficient
DES Detached Eddy Simulation
DNS Direct Numerical Simulation
DI Direct Injection
ff Inviscid fluxes
FV Finite Volume
gf Viscous fluxes
G Gortler number
H2 Hydrogen
Hdisk Mach disk height
I Identity matrix
IC Internal Combustion
ILES Implicit Large Eddy Simulation
k Turbulent kinetic energy
Kn Knudsen number
lsub Subsonic length after the Mach disk
LDA Laser Doppler Anemometry
LES Large Eddy Simulation
Mi Molecular weight
Ma Mach number
Ma1 Nozzle exit Mach number
NPR Nozzle Pressure Ratio
P Fluid pressure
P0 Stagnation pressure
P1 Nozzle exit pressure
P∞ Ambient pressure
PFI Port Fuel Injection
PLIF Planar laser-induced fluorescence
R Gas constant
r Radius of the shock cell curvature
RANS Reynolds Averaged Navier-Stokes
Re Reynolds Number
29
S Strain tensor
t Simulation time
t0 Integral time scale
T Transpose sign
T Temperature
T0 Stagnation temperature
T1 Nozzle exit temperature
Ts Reference temperature in Sutherland’s law
T Viscous stress tensor
U Velocity magnitude
U1 Nozzle exit velocity
Us Velocity scale in Gortler number
V Velocity vector
V Computational cell volume
Vjet Under-expanded jet volume
Wdisk Mach disk width
WENO Weighted Essentially Non-Oscillatory
X Mole fraction
Yi Mixture species
z Axial distance from the nozzle exit
Zt Jet tip penetration
Special characters
Reflected shock angle
γ Ratio of specific heats
ε Turbulent dissipation rate
Δ Length scale (LES grid filter)
δ Shear layer thickness in under-expanded jets
δ Boundary layer thickness
θ Thickness of incoming boundary layer
μ Dynamic viscosity
μs Reference viscosity in Sutherland’s law
μt Turbulent viscosity
ν Kinematic viscosity
ρ Density
ρ1 Nozzle exit density
σ Molecular Schmidt number
σ12 Collision diameter

30
ω Specific dissipation rate
Ω Molecular property in Chapman-Enskong formulation
Gradient operator
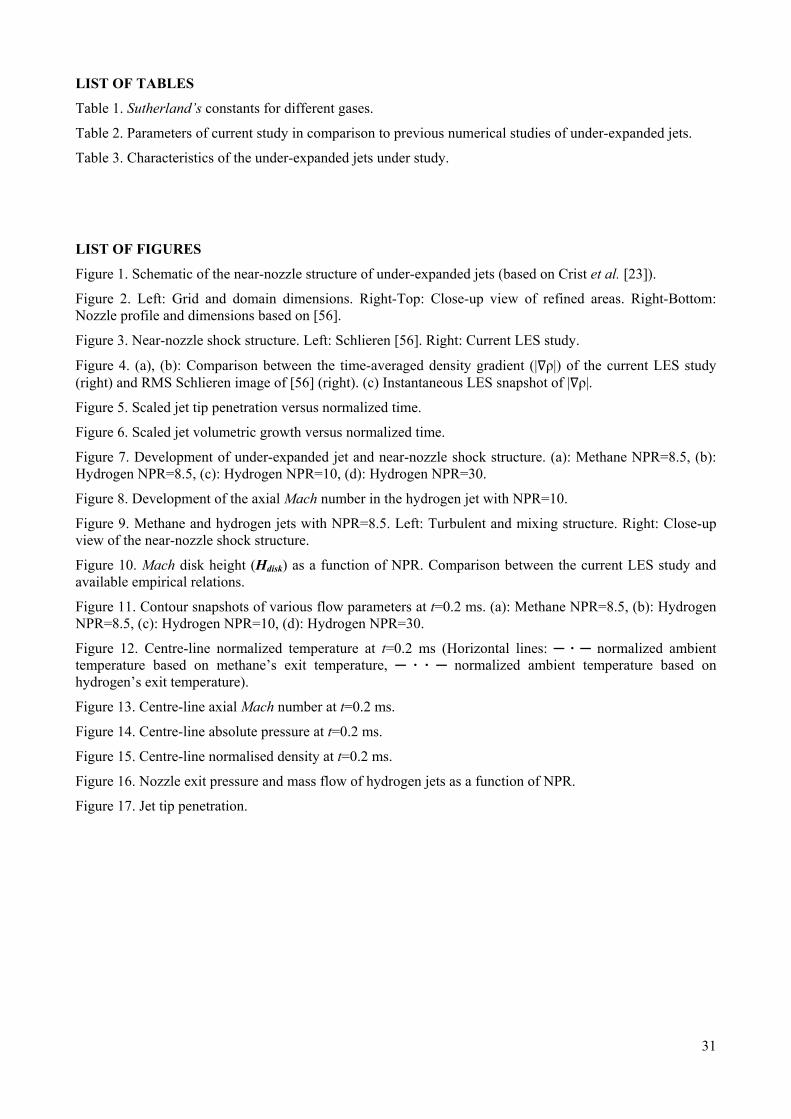
31
LIST OF TABLES
Table 1. Sutherland’s constants for different gases.
Table 2. Parameters of current study in comparison to previous numerical studies of under-expanded jets.
Table 3. Characteristics of the under-expanded jets under study.
LIST OF FIGURES
Figure 1. Schematic of the near-nozzle structure of under-expanded jets (based on Crist et al. [23]).
Figure 2. Left: Grid and domain dimensions. Right-Top: Close-up view of refined areas. Right-Bottom: Nozzle profile and dimensions based on [56].
Figure 3. Near-nozzle shock structure. Left: Schlieren [56]. Right: Current LES study.
Figure 4. (a), (b): Comparison between the time-averaged density gradient (| ρ|) of the current LES study (right) and RMS Schlieren image of [56] (right). (c) Instantaneous LES snapshot of | ρ|.
Figure 5. Scaled jet tip penetration versus normalized time.
Figure 6. Scaled jet volumetric growth versus normalized time.
Figure 7. Development of under-expanded jet and near-nozzle shock structure. (a): Methane NPR=8.5, (b): Hydrogen NPR=8.5, (c): Hydrogen NPR=10, (d): Hydrogen NPR=30.
Figure 8. Development of the axial Mach number in the hydrogen jet with NPR=10.
Figure 9. Methane and hydrogen jets with NPR=8.5. Left: Turbulent and mixing structure. Right: Close-up view of the near-nozzle shock structure.
Figure 10. Mach disk height (Hdisk) as a function of NPR. Comparison between the current LES study and available empirical relations.
Figure 11. Contour snapshots of various flow parameters at t=0.2 ms. (a): Methane NPR=8.5, (b): Hydrogen NPR=8.5, (c): Hydrogen NPR=10, (d): Hydrogen NPR=30.
Figure 12. Centre-line normalized temperature at t=0.2 ms (Horizontal lines: ─ ∙ ─ normalized ambient temperature based on methane’s exit temperature, ─ ∙ ∙ ─ normalized ambient temperature based on hydrogen’s exit temperature).
Figure 13. Centre-line axial Mach number at t=0.2 ms.
Figure 14. Centre-line absolute pressure at t=0.2 ms.
Figure 15. Centre-line normalised density at t=0.2 ms.
Figure 16. Nozzle exit pressure and mass flow of hydrogen jets as a function of NPR.
Figure 17. Jet tip penetration.
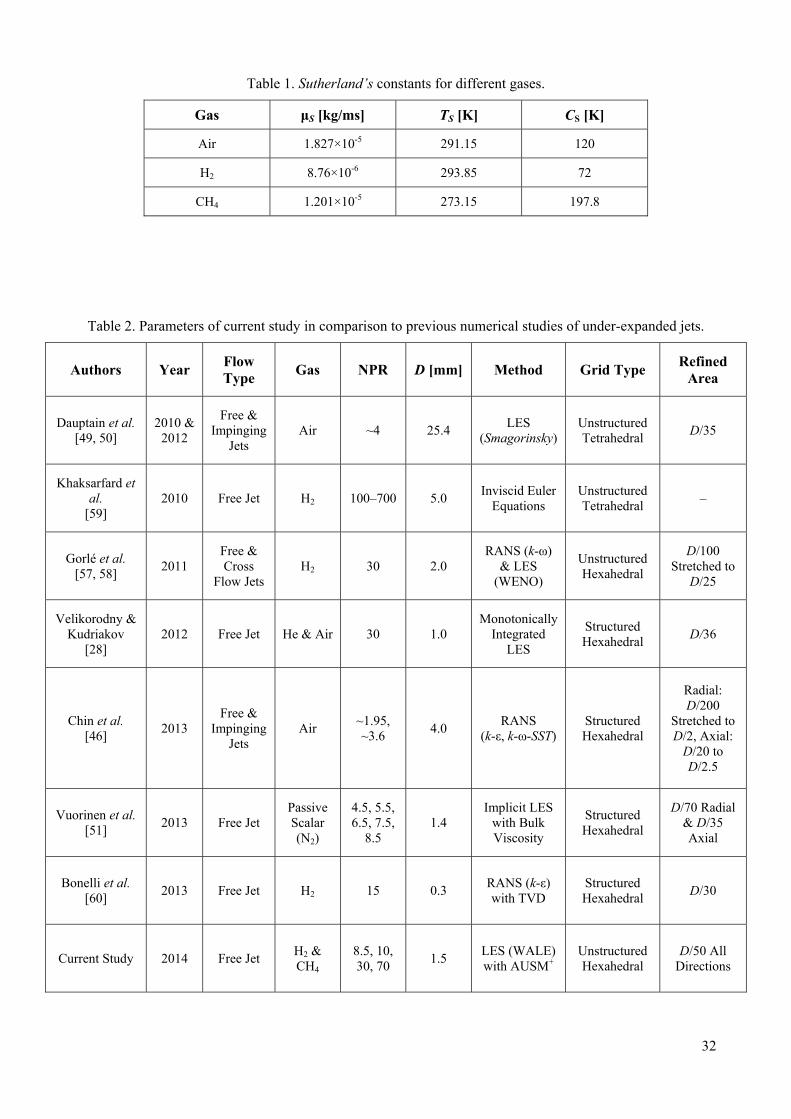
32
Table 1. Sutherland’s constants for different gases.
Gas μS [kg/ms] TS [K] CS [K]
Air 1.827×10⁻⁵ 291.15 120
H2 8.76×10⁻⁶ 293.85 72
CH4 1.201×10⁻⁵ 273.15 197.8
Table 2. Parameters of current study in comparison to previous numerical studies of under-expanded jets.
Authors Year Flow Type
Gas NPR D [mm] Method Grid Type Refined
Area
Dauptain et al. [49, 50]
2010 & 2012
Free & Impinging
Jets Air ~4 25.4
LES (Smagorinsky)
Unstructured Tetrahedral
D/35
Khaksarfard et al.
[59] 2010 Free Jet H2 100–700 5.0
Inviscid Euler Equations
Unstructured Tetrahedral
–
Gorlé et al. [57, 58]
2011 Free & Cross
Flow Jets H2 30 2.0
RANS (k-ω) & LES
(WENO)
Unstructured Hexahedral
D/100 Stretched to
D/25
Velikorodny & Kudriakov
[28] 2012 Free Jet He & Air 30 1.0
Monotonically Integrated
LES
Structured Hexahedral
D/36
Chin et al. [46]
2013 Free &
Impinging Jets
Air ~1.95, ~3.6
4.0 RANS
(k-ε, k-ω-SST) Structured Hexahedral
Radial: D/200
Stretched to D/2, Axial:
D/20 to D/2.5
Vuorinen et al. [51]
2013 Free Jet Passive Scalar (N2)
4.5, 5.5, 6.5, 7.5,
8.5 1.4
Implicit LES with Bulk Viscosity
Structured Hexahedral
D/70 Radial & D/35 Axial
Bonelli et al. [60]
2013 Free Jet H2 15 0.3 RANS (k-ε) with TVD
Structured Hexahedral
D/30
Current Study 2014 Free Jet H2 & CH4
8.5, 10, 30, 70
1.5 LES (WALE) with AUSM+
Unstructured Hexahedral
D/50 All Directions
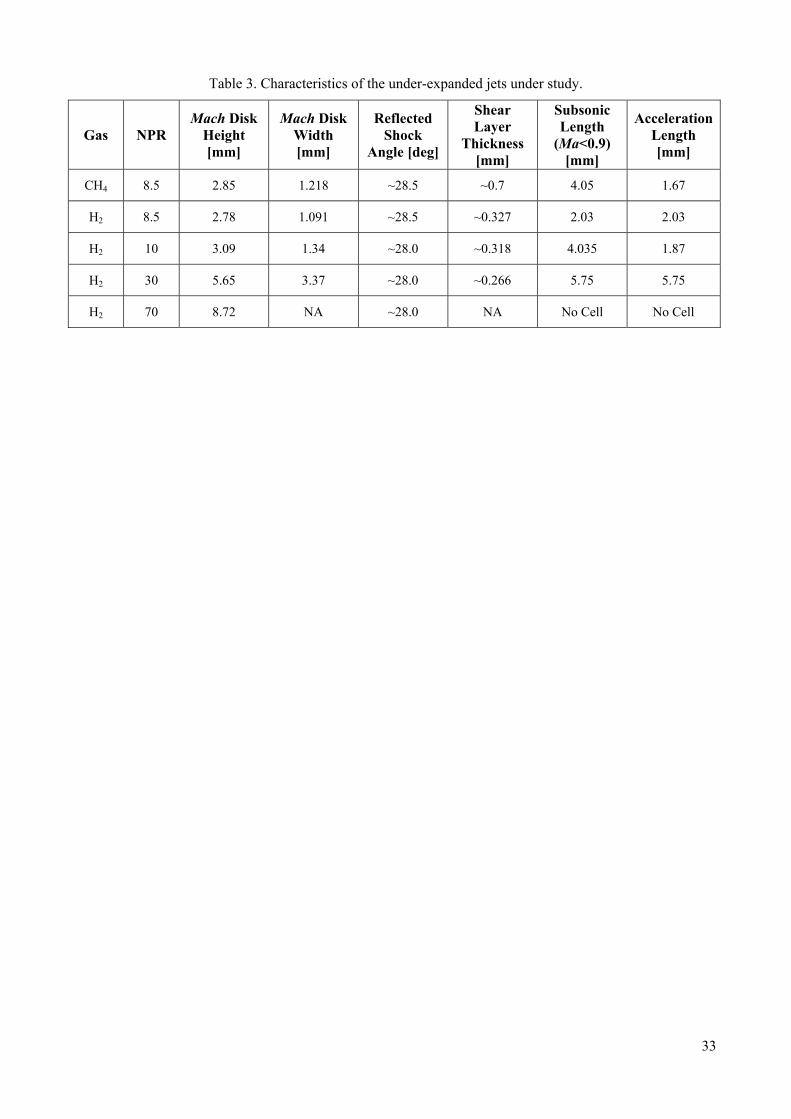
33
Table 3. Characteristics of the under-expanded jets under study.
Gas NPR Mach Disk
Height [mm]
Mach Disk Width [mm]
Reflected Shock
Angle [deg]
Shear Layer
Thickness [mm]
Subsonic Length
(Ma<0.9) [mm]
Acceleration Length [mm]
CH4 8.5 2.85 1.218 ~28.5 ~0.7 4.05 1.67
H2 8.5 2.78 1.091 ~28.5 ~0.327 2.03 2.03
H2 10 3.09 1.34 ~28.0 ~0.318 4.035 1.87
H2 30 5.65 3.37 ~28.0 ~0.266 5.75 5.75
H2 70 8.72 NA ~28.0 NA No Cell No Cell
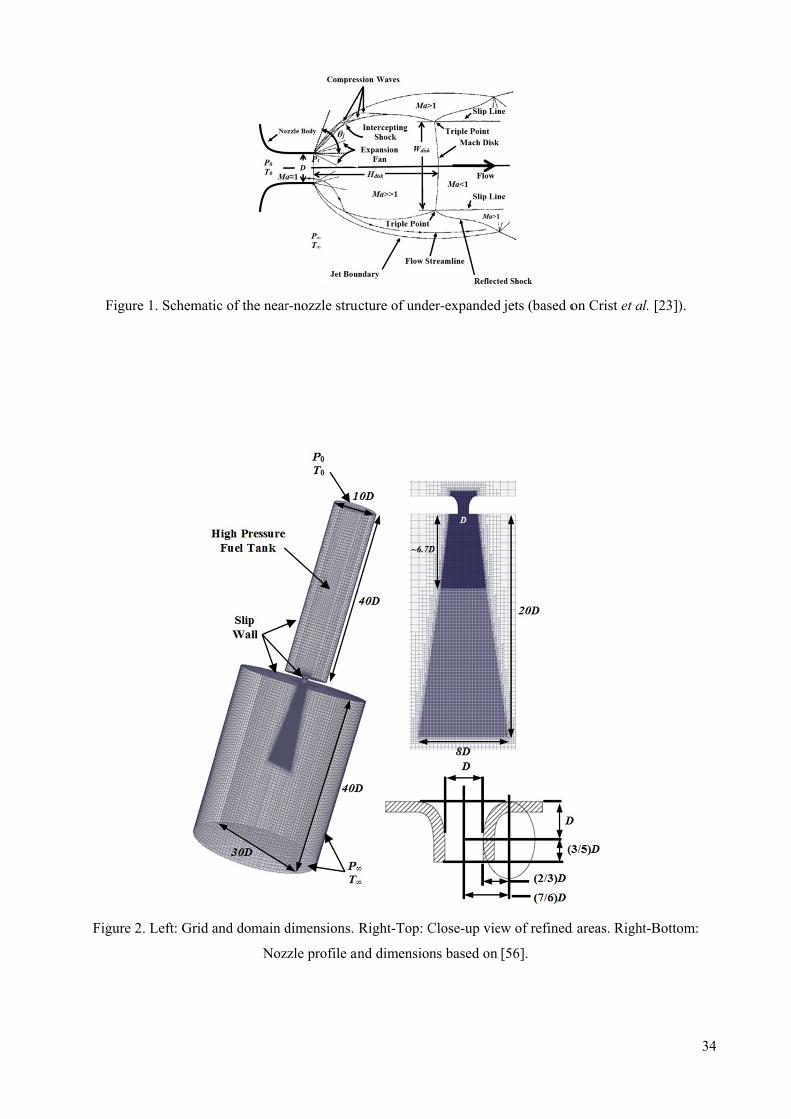
Figure
Figure 2.
e 1. Schemati
. Left: Grid a
ic of the near
and domain d
Noz
r-nozzle stru
dimensions.
zzle profile an
ucture of und
Right-Top: C
nd dimensio
er-expanded
Close-up vie
ns based on
jets (based o
w of refined
[56].
on Crist et al
d areas. Right
34
l. [23]).
t-Bottom:
4
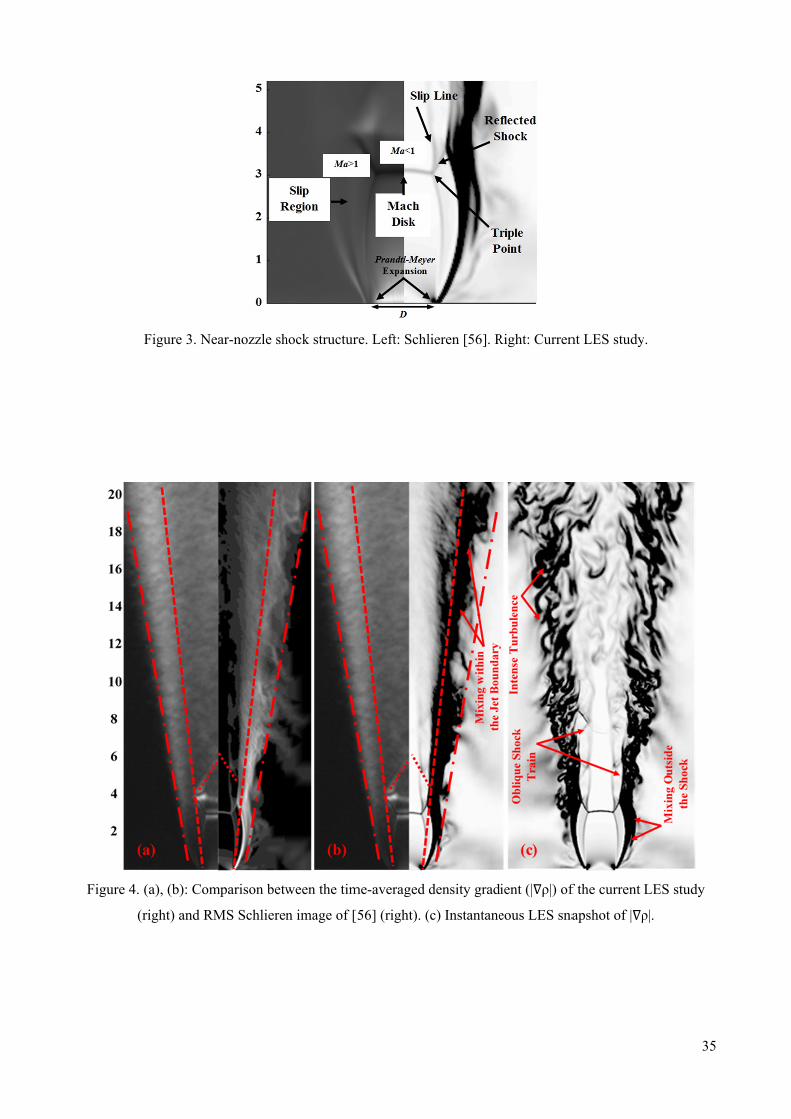
Figure 4.
(r
Figure 3. Ne
(a), (b): Com
right) and RM
ear-nozzle sh
mparison betw
MS Schlieren
hock structur
ween the tim
n image of [5
re. Left: Schl
me-averaged
56] (right). (
lieren [56]. R
density grad
(c) Instantane
Right: Curren
ient (| ρ|) of
eous LES sna
nt LES study
f the current
apshot of | ρ
35
y.
LES study
ρ|.
5
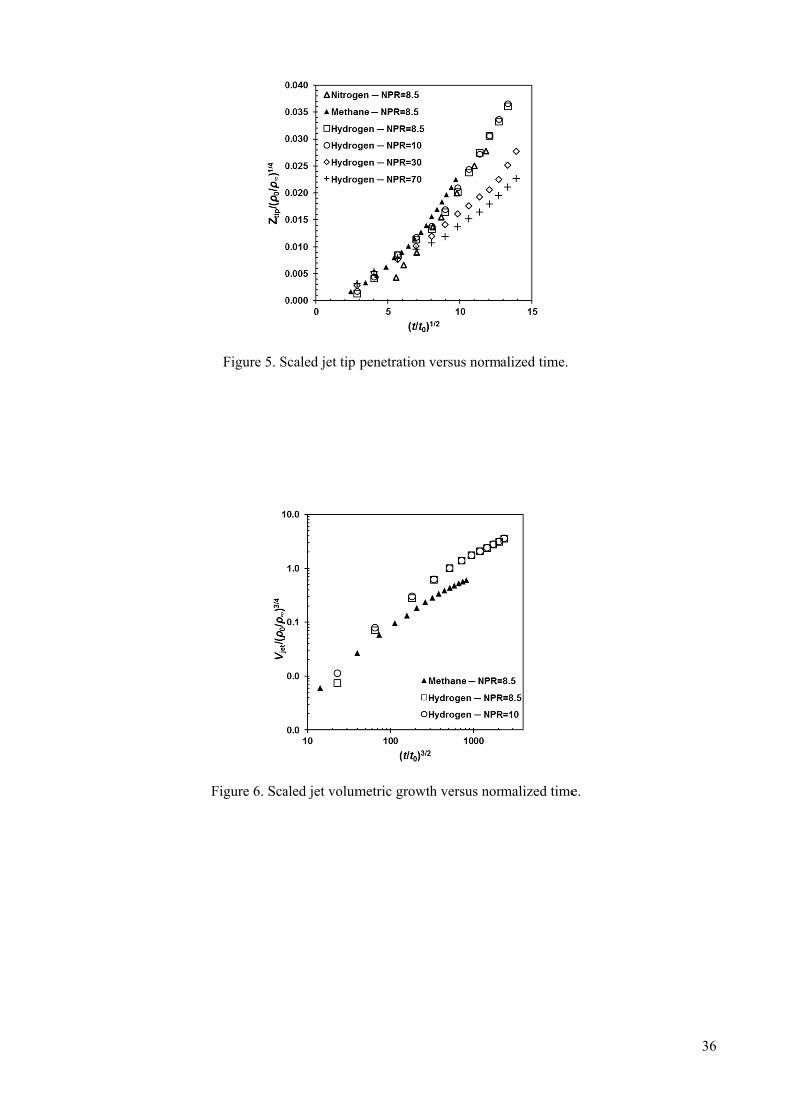
F
Figure 5. S
Figure 6. Sca
Scaled jet tip
aled jet volum
penetration
metric growt
versus norm
th versus nor
alized time.
rmalized timee.
366
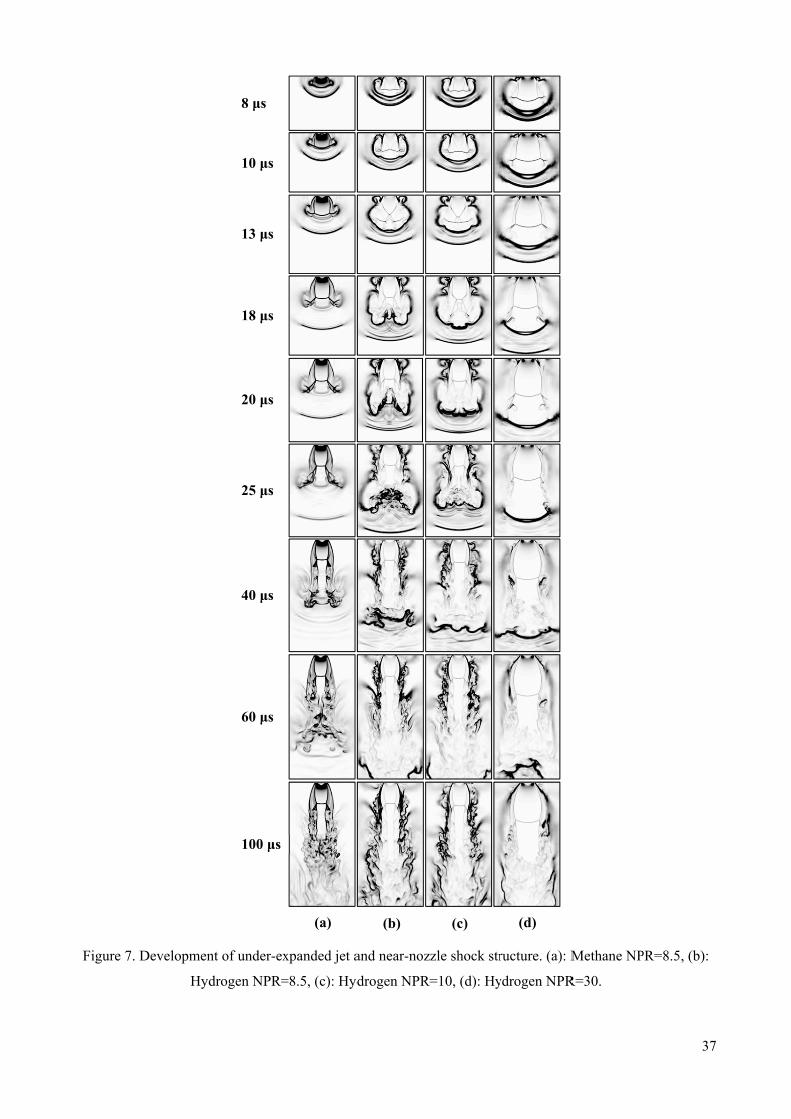
Figure 7. D
Development
Hyd
t of under-ex
drogen NPR=
8 μs
10 μs
13 μs
18 μs
20 μs
25 μs
40 μs
60 μs
100 μs
xpanded jet a
=8.5, (c): Hyd
(a)
and near-noz
drogen NPR
(b)
zzle shock str
R=10, (d): Hy
(c)
ructure. (a): M
ydrogen NPR
(d)
Methane NP
R=30.
37
PR=8.5, (b):
7
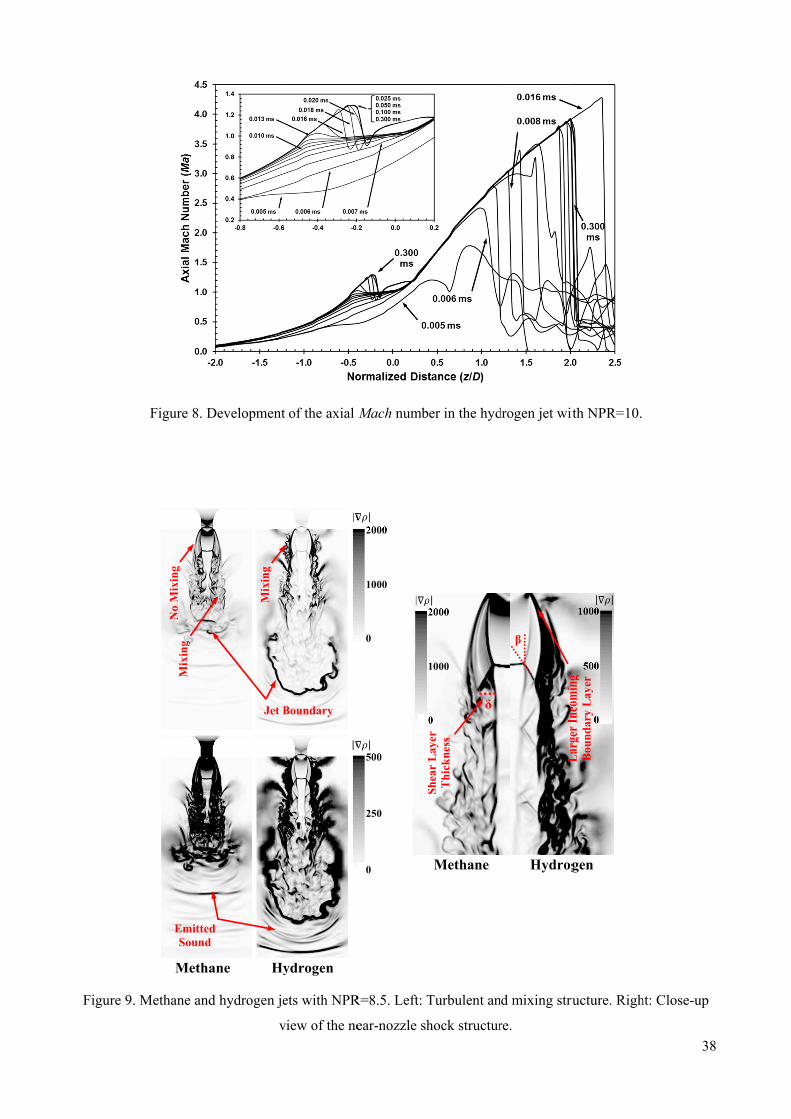
Figure 9. M
Figure 8. D
Methane and
Mix
ing
EmittedSound
No
Mix
ing
Metha
Development
d hydrogen je
v
d
Jet B
Mix
ing
ane Hy
of the axial
ets with NPR
iew of the ne
|
|
Boundary
ydrogen
Mach numb
R=8.5. Left: T
ear-nozzle sh
2
1
0
|
ShL
2000
1000
0
|
500
250
0
|
er in the hyd
Turbulent an
hock structur
Methane
2000
1000
0
|
Shea
r L
ayer
T
hic
kn
ess
δ
drogen jet wit
nd mixing stru
re.
Hydrog
Lar
ger
Inco
min
g
β
ith NPR=10.
ructure. Righ
gen
1000
500
0
| |
Lar
ger
Inco
min
g B
ound
ary
Lay
er
38
ht: Close-up
8
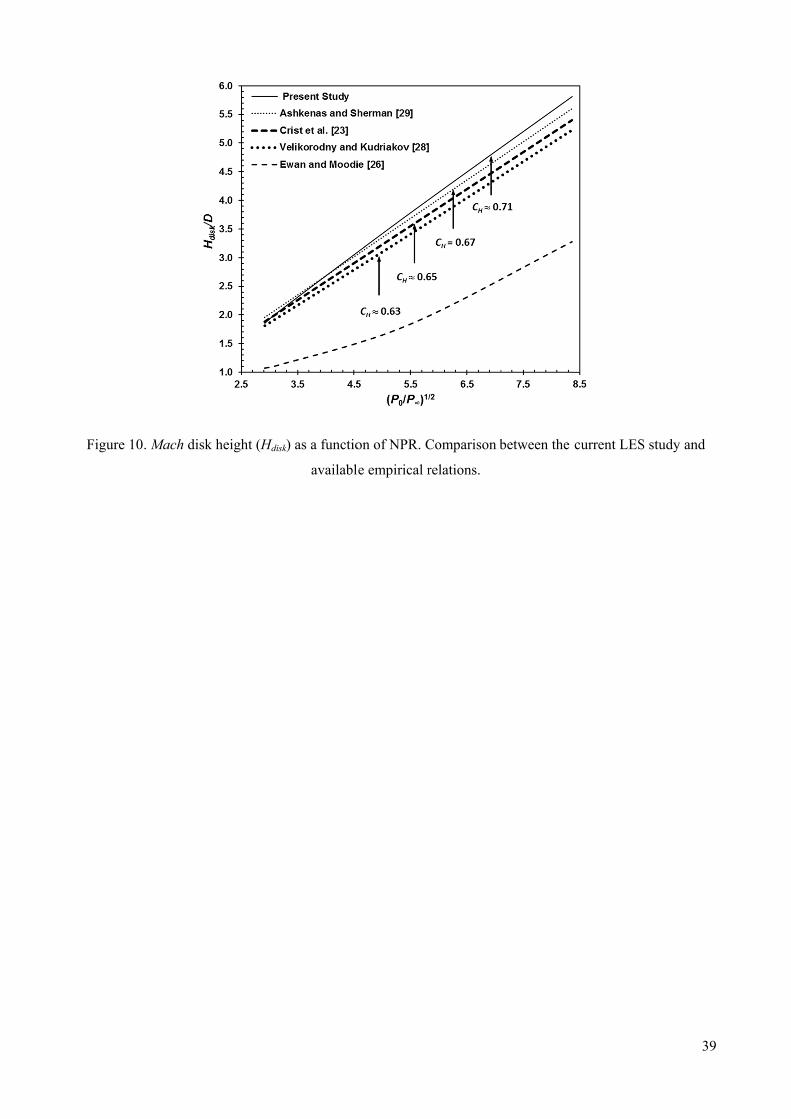
Figure 10
. Mach disk height (Hdisk
k) as a functio
availabl
on of NPR. C
le empirical r
Comparison b
relations.
between the
current LES
39
S study and
9
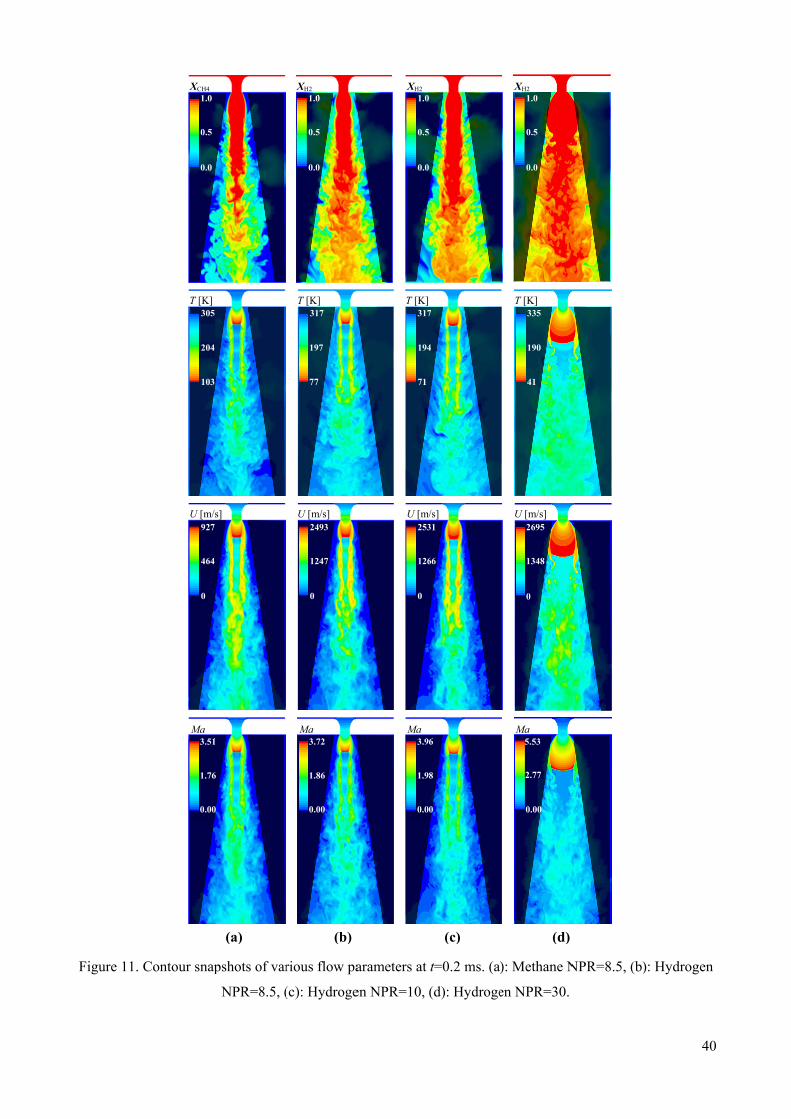
Figure 11.
Contour snap
XCH4
0.0
1.0
0.5
T [K]
103
305
204
U [m/927
0
464
3.51
1.76
0.00
Ma
pshots of var
NPR=8.5, (
5
/s]
7
1
6
0
(a)
rious flow pa
(c): Hydroge
0.0
1.0
0.5
XH2
T [K]
77
317
197
U [m/s]
2493
0
1247
3.72
1.86
0.00
Ma
(b)
arameters at
en NPR=10,
XH2
0.0
1.0
0.5
T [K]
71
317
194
U [m/253
0
126
3.9
1.9
0.0
Ma
t=0.2 ms. (a)
(d): Hydroge
7
4
/s]
31
66
6
8
0
(c)
): Methane N
en NPR=30.
U [m/s]
2695
0
1348
T [K]
41
335
190
XH2
0.0
1.0
0.5
5.53
2.77
0.00
Ma
(d)
NPR=8.5, (b)
40
): Hydrogen
0
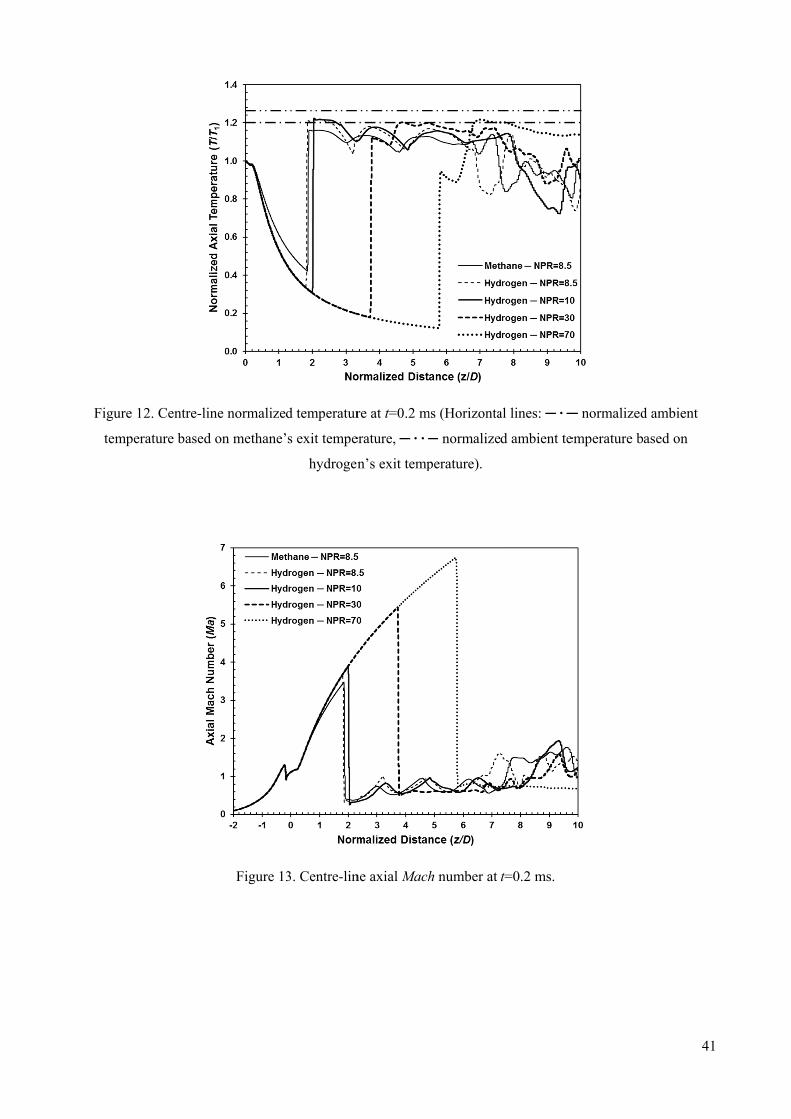
Figure 1
temper
2. Centre-lin
rature based
ne normalize
on methane’
Figure 13
d temperatur
s exit tempe
hydrogen
3. Centre-lin
re at t=0.2 m
erature, ─ ∙ ∙ ─
n’s exit temp
ne axial Mach
ms (Horizonta
─ normalize
perature).
h number at
al lines: ─ ∙ ─
d ambient te
t=0.2 ms.
─ normalized
emperature b
41
d ambient
ased on
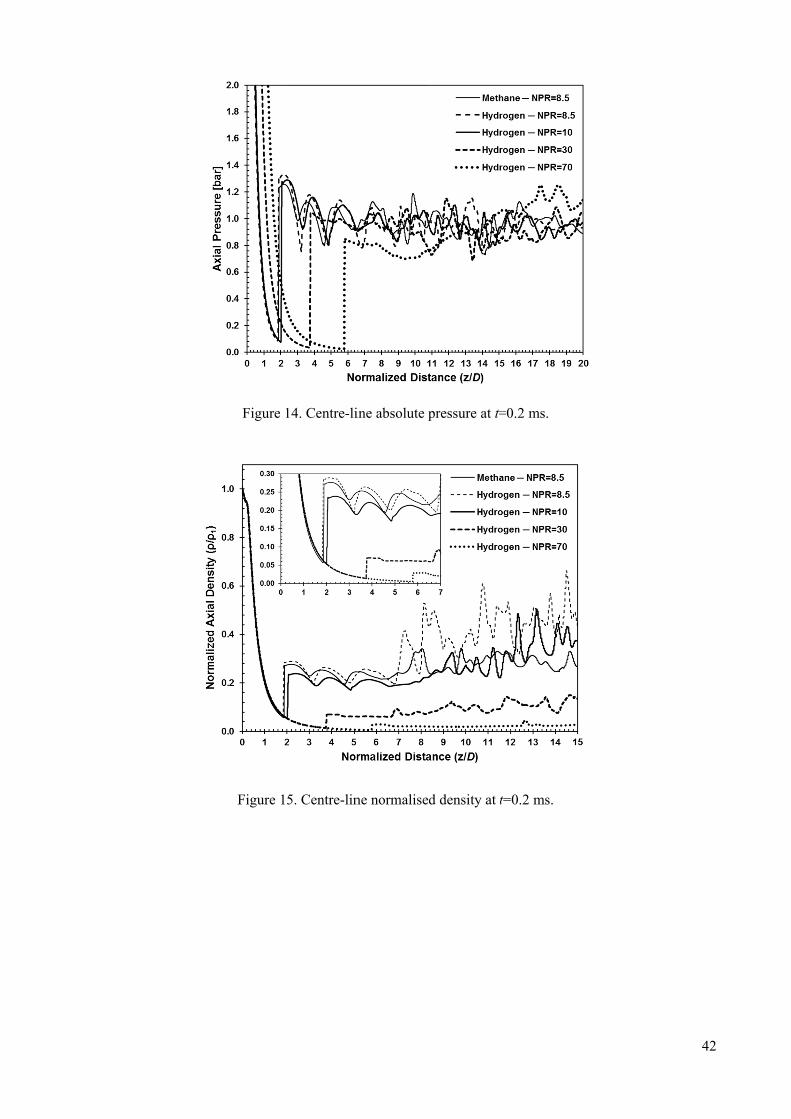
Figure 1
Figure 1
14. Centre-li
5. Centre-lin
ine absolute p
ne normalise
pressure at t=
d density at t
=0.2 ms.
t=0.2 ms.
422
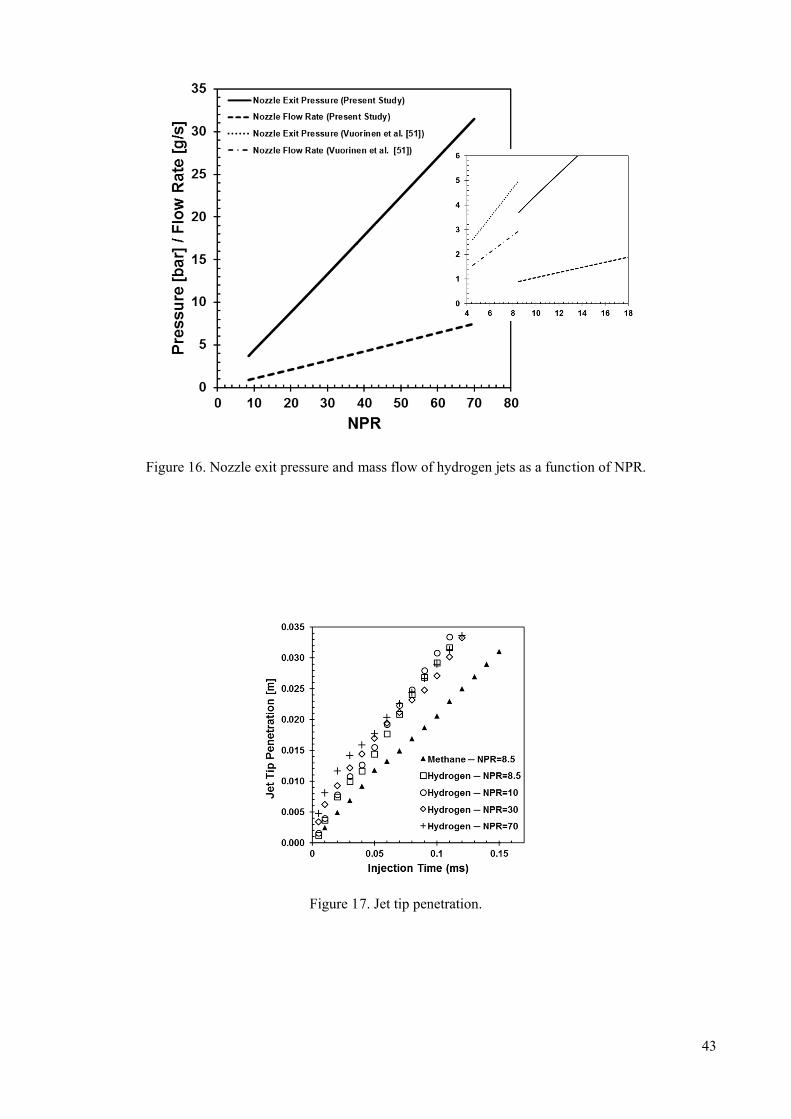
Figure 16. NNozzle exit ppressure and m
Figure 1
mass flow o
17. Jet tip pen
f hydrogen je
netration.
ets as a funct
tion of NPR
43
.
3