Embed Size (px)
Citation preview

Large Eddy Simulation of a Scale-model Turbofan forFan Noise Source DiagnosticC. Perez Arroyo1, T. Leonard1, M. Sanjose1*, S. Moreau1, F. Duchaine2
SYM
POSI
A
ON ROTATING MACHIN
ERY
ISROMAC 2017
InternationalSymposium on
Transport Phenomenaand
Dynamics of RotatingMachinery
Maui, Hawaii
December 16-21, 2017
AbstractA wall-modeled Large Eddy Simulation (LES) of the turbulent �ow in the NASA Source DiagnosticTest turbofan is successfully performed for the �rst time. A good agreement with aerodynamicmeasurements is observed for both Reynolds Averaged Navier-Stokes and LES results, althoughthe LES provides be�er results in the tip regions where large coherent structures appear and no�ow separation on the stator vanes is observed. In the LES the boundary layer naturally transitionto turbulence on the blade suction side but remains quasi laminar over most of its pressure side.�e rotor-wake turbulence yielding the stage broadband noise is then seen to be quasi isotropic.Transition on the downstream stator vanes is not triggered by the wake impingement but ratheroccurs at mid-chord. Finally, acoustics are investigated using both Ffowcs Williams & Hawkings’and Goldstein’s analogies from the recorded LES noise source on the stator vanes. �e la�er analogyprovides levels much closer to the measurements especially at high frequencies, although the resultsare most likely still in�uenced by too coherent rotor tip secondary �ow at low frequencies.KeywordsFan stage — Large Eddy Simulation — aeroacoustic1Department of Mechanical Engineering, University of Sherbrooke, �ebec, Canada2CFD Team and GlobC Team, CERFACS, Toulouse, France*Corresponding author: [email protected]
INTRODUCTION
Turbofan architecture has evolved toward an increasing con-tribution of the fan to the thrust. At approach conditions,the fan noise has become one of the main contributors witha main broadband content mostly in the forward arc of theengine. �is will be all the more the case for future turbo-engines that will involve Ultra-High By-pass Ratio (UHBR)turbofans. For these architectures, fan noise is projected tobecome the dominant source overall. In a classical turbo-fan as the present con�guration, the interaction between thewake of the rotor and equally-distributed Outlet-Guide Vanes(OGV) has been found to be the dominant mechanism thatcontributes to fan noise [1, 2]. On the one hand, tonal noisecan be more easily controlled by clever choice of blade countsaccording to Tyler & Sofrin rules[3] and taking advantage ofthe duct �ltering to have the �rst Blade Passing Frequency(BPF) cut-o� for instance. Moreover proper nacelle and ex-haust duct liners can also damp both forward and backwardprogagating tones [1]. On the other hand, broadband noisehas a signi�cant contribution much harder to control espe-cially at high frequencies given the high number of cut-onmodes for modern engines with low hub-to-tip ratio. Yet,with increasing noise regulations for commercial aircra�s,it becomes mandatory to get a be�er understanding of thenoise generation and propagation for fan and OGV interac-tion broadband noise in order to be able to properly guidefurther noise reduction technology development.
Progress in High Performance Computing (HPC) has al-lowed for the correct prediction of complex �ows around
isolated parts of turbomachines with Reynolds AveragedNavier-Stokes (RANS), unsteady RANS, Large Eddy Simula-tions (LES) and high-�delity Direct Numerical Simulations(DNS) as shown in reviews from Tucker [4] and McMullanet al. [5]. However, only the la�er two methods (LES andDNS) can provide the multi-scale noise sources that yieldbroadband noise. A recent review from Gourdain et al. [6]gives an overview of LES industrial compressor �ows andreports simulations with full stages highlighting the cost ofLES for multistage compressors [7, 8]. But all these simu-lations involved low-pressure compressor with small bladespans, reduced rotor-stator distances and moderate Reynoldsnumbers based on the chord. Only de Laborderie et al. [7]considered the noise generation, but stressed the di�cultiesof predictions associated with limited passage simulations.More recently high-pressure turbines have been consideredthat involve both higher Mach and Reynolds numbers [9],and dealt with their noise generation and the propagation ofcombustion noise through them [10].
In that context, the ”Fan Noise Source Diagnostic Test”(SDT) experimental set-up was investigated by NASA pro-viding an extensive database of aerodynamic sources andaeroacoustic diagnostics of the broadband fan/OGV inter-action mechanism [11, 12, 13]. �is comprehensive studyis dedicated to the validation of numerical and analyticalmethods and has recently become an AIAA benchmark casefor fan broadband noise. �e present work focuses on theonly Large-Eddy Simulation (LES) of this con�guration at themoment, in combination with acoustic analogies for noise

Large Eddy Simulation of a Scale-model Turbofan for Fan Noise Source Diagnostic — 2/11
prediction to investigate the rotor/stator interaction mecha-nism. �is is the continuation of the preliminary work pre-sented by Leonard et al. with converged �ow and acousticstatistics [14]. In the la�er, the streamwise turbulent lengthscale was extracted from the LES results and used in Han-son’s model to predict the far-�eld noise. �is study providesan in-depth analysis of the instantaneous aerodynamic fea-tures of this turbofan con�guration and the comparison oftwo acoustic analogies for noise propagation. �e primefocus has been on the noise generated by the fan/OGV pres-sure �uctuations and its link with the impingement of thepassing turbulent rotor wakes. A precise description of thestate of turbulence reaching the stator vanes leading edge istherefore mandatory, which strongly justi�ed the LES. �eNASA experiment is summarized in the next section. �ecomplete numerical model and parameters are then provided.Finally both aerodynamic and acoustic results from the LESare shown.
1. EXPERIMENTAL SET-UPAs part of the NASA advanced Subsonic Technology NoiseReduction Program, several experiments [11, 13, 15, 12, 16]have been carried out on the Source Diagnostic Test rig pre-sented in Fig. 1(a) involving di�erent geometries and countsof the rotor blades and stator outlet vanes [15]. �e con�gu-ration studied here is the baseline con�guration designed byGeneral Electric Aircra� Engines which is composed of 22rotor blades (R4) and 54 radial stator vanes (Fig. 1(b)). �is1/5th scale model fan stage is representative of the secondarystream of a modern High Bypass-Ratio turbofan engine. Notethat the experimental set-up does not involve a core �ow.
(a) turbofan with nacelle (b) baseline 54 radial guidevanes stator
Figure 1. Source Diagnostic Test test rig at NASA GlennLow Speed Wind Tunnel.
�e fan stage has been tested in take-o� and approachconditions, but only the approach condition that has the mostextensive experimental data set has been simulated numeri-cally. Free-stream Mach number of 0.10 is imposed, to achieveacoustic �ight e�ect and to provide far-�eld acoustic datarepresentative of real take-o� and approach conditions [13].�e rotational speed is 7808 rpm corresponding to 61.7% ofthe rotor design speed.
�e overall test program had many phases, including de-tailed �ow �eld diagnostic measurements using laser Dopplerand hot-wire anemometry [12, 16] and acoustic power mea-surements [13].
2. NUMERICAL PARAMETERS
2.1 Computational DomainTo decrease the computational costs of the simulations, onlya periodic portion of the fan stage is simulated. Since therotor-stator interface condition used for the LES simulationrequires to have domains of the same angular extent in therotor and stator parts, the number of outlet guide vaneshas been modi�ed from 54 to 55 allowing a 2π/11 angularperiodicity in both domains. �is geometrical transforma-tion has been performed adjusting the vane aspect ratiosto maintain the same solidity and stay as close as possibleto the experimental operating point (see Tab. 1). Using theOPTIBRUI platform for the analytical prediction of axial fannoise [17, 14], it was veri�ed that similar broadband noiselevels should be expected as similar ranges of cut-on modesare found for both con�gurations. �e computational domainshown in Fig. 2 not only contains the fan stage but also thenacelle and outside �ow. �is avoids de�ning an inlet con-dition inside of the turbofan which may a�ect the acousticpropagation in the nacelle and allows the �ow to establishitself from the free �ow and the fan rotational speed likein the experimental wind tunnel. Downstream the exitingjet and the mixing layer will also be accounted for in thesimulation which also prevents from modifying the acoustictransmission at the end of the nacelle.
unsteady pressureextraction surfaces
stator vanes
rotor blades
Detailedview
Figure 2. Isometric view of the computational domain.
�e domain is divided in two parts: the stator domain iscomposed of the outside region and the vane row, while therotor domain is limited to the rotor row and the rotor wakedevelopment region. �e interfaces between the two partsare shown by the orange surfaces in Fig. 2.

Large Eddy Simulation of a Scale-model Turbofan for Fan Noise Source Diagnostic — 3/11
2.2 Unstructured Mesh�e unstructured mesh used in the present study for bothRANS and LES simulations is shown along a blade-to-bladeview at mid-channel height in Fig. 3. �e spatial discretizationaround the blades and in the wakes of the blades has been aprime focus : 8 layers of prisms have been imposed on theblades and vane skin in order to have a good discretizationof the near-wall region. �e tip region is discretized with 8layers of prisms and an average of 7 tetrahedral elements toreach the casing (about 15 overall cells).
interface
wake refinement
prismatic layers
(a) Rotor and stator full blade-to-blade view.
(b) Rotor leading edge. (c) Rotor trailing edge.
(d) Stator leading edge. (e) Stator trailing edge.
Figure 3. Grid in a blade-to-blade cut at mid-channelheight.
�e cell size in the rotor wake is progressively increaseduntil reaching the rotor-stator interface where a constantmesh size of 1.5 mm is used. Upstream of the rotor bladesthe mesh is uniform and coarsen up to a mesh size of 3.5 mmat the entrance of the nacelle. For the outside domain, thenacelle nearby region and the mixing layers are re�ned. How-ever, the grid is still relatively coarse compared to the inside,the goal being to obtain the mean e�ect of the mixing layerand not necessary to resolve the turbulent structures pre-cisely. �e resulting mesh is composed of 75 million cells (15million nodes) of which over 95% are used to discretize theinside domain. �e domain cut-o� frequency is estimatedto be about 10 kHz at the inlet interface (upstream of therotor) and 20 kHz 1 stator chord downstream of the stator.�e minimum cut-o� frequency at the blade skin (used forfar-�eld propagation) is about 35 kHz and 30 kHz for therotor and stator respectively.
(a) (b) (c) (d)
Figure 4. Dimensionless wall-normal distance y+ of the�rst cell at the wall computed from an average LES.(a) Rotor pressure side. (b) Rotor suction side. (c) Statorpressure side. (d) Stator suction side.
2.3 Reynolds Averaged Navier-Stokes Simu-lation
A RANS simulation has been �rst achieved using the ANSYSCFX v15.0 solver to initialize the LES. �e same unstructuredmesh as the one used in the LES is used to avoid interpolationerrors. A mixing plane condition is used for the rotor-statorinterface: only azimuthally averaged �uxes are exchanged.�e results presented in this paper were obtained using ak−ω SST turbulence model with an automatic near-wall treat-ment that switches from wall-functions to a low-Reynoldsnear wall formulation as the mesh is re�ned. A�er a goodinitial decay of all residuals for the L2 norm some oscillationsare observed which prevent further convergence. �ey arecaused by a leading-edge recirculation bubble that yields alarge oscillating �ow separation close to the tip of rotor blade(see Fig. 11 in Leonard et al. [14]). However, the oscillationswere visible only locally and the simulation reached a steadystate in the rest of the domain.
Large Eddy Simulation�e TurboAVBP code developed by CERFACS and IFPEN [18]has been used for the compressible LES. Two instances ofthe massively parallel LES solver AVBP are run simultane-ously: one for the rotor domain and one for stator. �ey arecoupled by the parallel code coupler OpenPALM [19] whichinterpolates and exchanges the residuals at each iterationover overlapping grids [20].
�e numerical scheme for the present LES is an explicitLax-Wendro� second order scheme both in space and time.�e time step for the simulation has been set to approximately2.5×10−5 ms to have 14,000 iterations per blade passage. �esub-grid scale model used is the Wall-Adapting Local Eddy-viscosity model (WALE) that provides the proper turbulencedecay toward the walls. As for the turbine cases [9], a log-lawmodel (which switches to a linear model for y+ < 11.445)is applied on all walls to be consistent with the above y+
values and to ensure a physical friction on the walls. �e
Large Eddy Simulation of a Scale-model Turbofan for Fan Noise Source Diagnostic — 4/11
5.4%
start statistics
0 20 40 60 80 100 0 20 40 60 80 100 0 20 40 60 80 100
pres
sure
pres
sure
pres
sure
time (ms) time (ms) time (ms)
1.7%
4.4 rotations 9 rotations
2.3%
(a) Upstream of the rotor
5.4%
start statistics
0 20 40 60 80 100 0 20 40 60 80 100 0 20 40 60 80 100
pres
sure
pres
sure
pres
sure
time (ms) time (ms) time (ms)
1.7%
4.4 rotations 9 rotations
2.3%
(b) Interstage
5.4%
start statistics
0 20 40 60 80 100 0 20 40 60 80 100 0 20 40 60 80 100
pres
sure
pres
sure
pres
sure
time (ms) time (ms) time (ms)
1.7%
4.4 rotations 9 rotations
2.3%
(c) Downstream of the stator
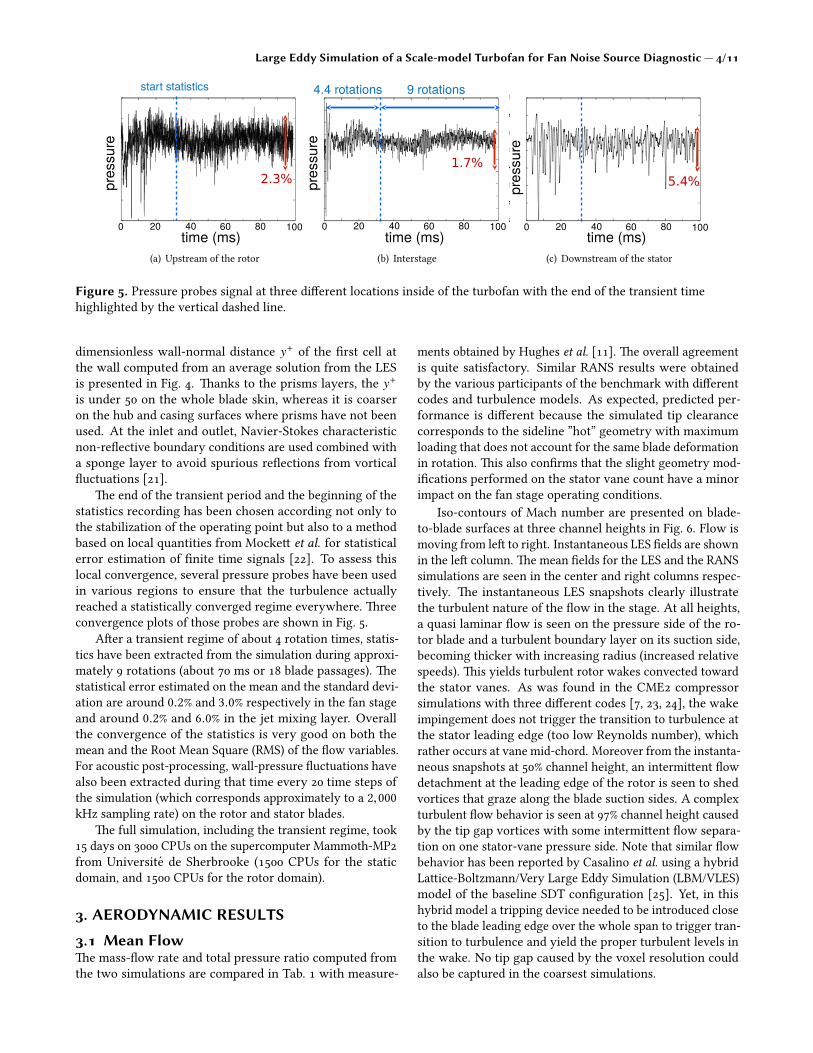
Figure 5. Pressure probes signal at three di�erent locations inside of the turbofan with the end of the transient timehighlighted by the vertical dashed line.
dimensionless wall-normal distance y+ of the �rst cell atthe wall computed from an average solution from the LESis presented in Fig. 4. �anks to the prisms layers, the y+
is under 50 on the whole blade skin, whereas it is coarseron the hub and casing surfaces where prisms have not beenused. At the inlet and outlet, Navier-Stokes characteristicnon-re�ective boundary conditions are used combined witha sponge layer to avoid spurious re�ections from vortical�uctuations [21].
�e end of the transient period and the beginning of thestatistics recording has been chosen according not only tothe stabilization of the operating point but also to a methodbased on local quantities from Mocke� et al. for statisticalerror estimation of �nite time signals [22]. To assess thislocal convergence, several pressure probes have been usedin various regions to ensure that the turbulence actuallyreached a statistically converged regime everywhere. �reeconvergence plots of those probes are shown in Fig. 5.
A�er a transient regime of about 4 rotation times, statis-tics have been extracted from the simulation during approxi-mately 9 rotations (about 70 ms or 18 blade passages). �estatistical error estimated on the mean and the standard devi-ation are around 0.2% and 3.0% respectively in the fan stageand around 0.2% and 6.0% in the jet mixing layer. Overallthe convergence of the statistics is very good on both themean and the Root Mean Square (RMS) of the �ow variables.For acoustic post-processing, wall-pressure �uctuations havealso been extracted during that time every 20 time steps ofthe simulation (which corresponds approximately to a 2,000kHz sampling rate) on the rotor and stator blades.
�e full simulation, including the transient regime, took15 days on 3000 CPUs on the supercomputer Mammoth-MP2from Universite de Sherbrooke (1500 CPUs for the staticdomain, and 1500 CPUs for the rotor domain).
3. AERODYNAMIC RESULTS
3.1 Mean Flow�e mass-�ow rate and total pressure ratio computed fromthe two simulations are compared in Tab. 1 with measure-
ments obtained by Hughes et al. [11]. �e overall agreementis quite satisfactory. Similar RANS results were obtainedby the various participants of the benchmark with di�erentcodes and turbulence models. As expected, predicted per-formance is di�erent because the simulated tip clearancecorresponds to the sideline ”hot” geometry with maximumloading that does not account for the same blade deformationin rotation. �is also con�rms that the slight geometry mod-i�cations performed on the stator vane count have a minorimpact on the fan stage operating conditions.
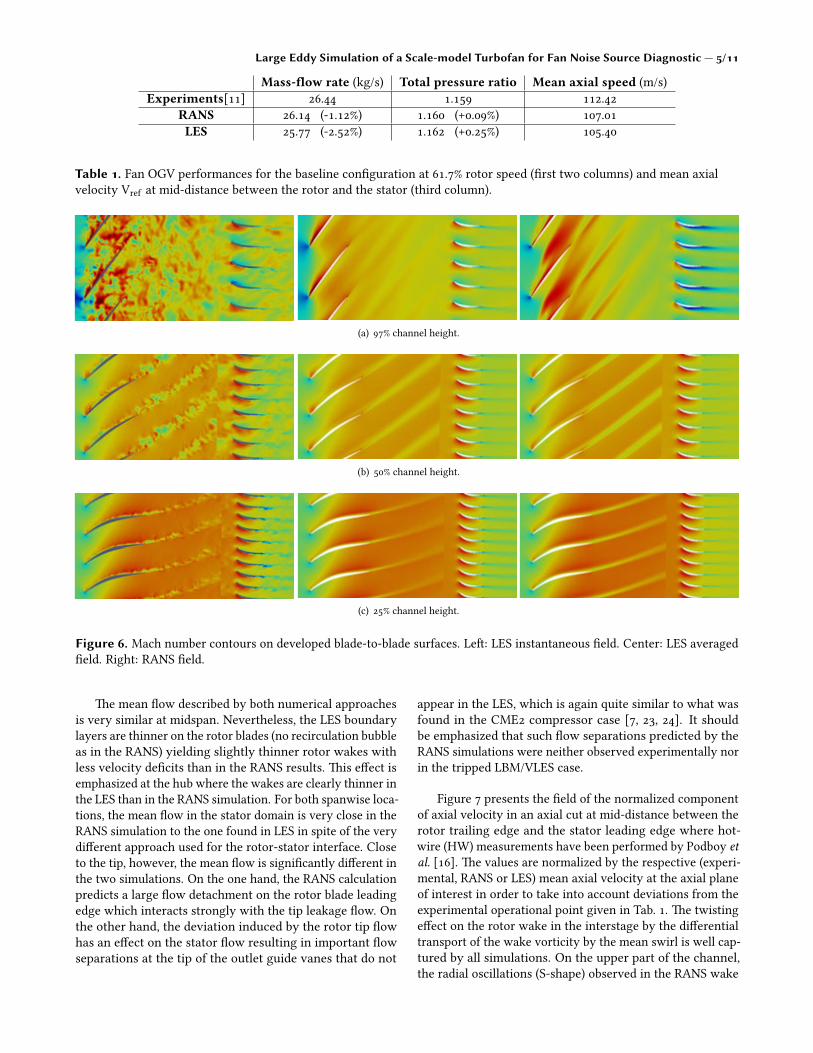
Iso-contours of Mach number are presented on blade-to-blade surfaces at three channel heights in Fig. 6. Flow ismoving from le� to right. Instantaneous LES �elds are shownin the le� column. �e mean �elds for the LES and the RANSsimulations are seen in the center and right columns respec-tively. �e instantaneous LES snapshots clearly illustratethe turbulent nature of the �ow in the stage. At all heights,a quasi laminar �ow is seen on the pressure side of the ro-tor blade and a turbulent boundary layer on its suction side,becoming thicker with increasing radius (increased relativespeeds). �is yields turbulent rotor wakes convected towardthe stator vanes. As was found in the CME2 compressorsimulations with three di�erent codes [7, 23, 24], the wakeimpingement does not trigger the transition to turbulence atthe stator leading edge (too low Reynolds number), whichrather occurs at vane mid-chord. Moreover from the instanta-neous snapshots at 50% channel height, an intermi�ent �owdetachment at the leading edge of the rotor is seen to shedvortices that graze along the blade suction sides. A complexturbulent �ow behavior is seen at 97% channel height causedby the tip gap vortices with some intermi�ent �ow separa-tion on one stator-vane pressure side. Note that similar �owbehavior has been reported by Casalino et al. using a hybridLa�ice-Boltzmann/Very Large Eddy Simulation (LBM/VLES)model of the baseline SDT con�guration [25]. Yet, in thishybrid model a tripping device needed to be introduced closeto the blade leading edge over the whole span to trigger tran-sition to turbulence and yield the proper turbulent levels inthe wake. No tip gap caused by the voxel resolution couldalso be captured in the coarsest simulations.
Large Eddy Simulation of a Scale-model Turbofan for Fan Noise Source Diagnostic — 5/11
Mass-�ow rate (kg/s) Total pressure ratio Mean axial speed (m/s)Experiments[11] 26.44 1.159 112.42
RANS 26.14 (-1.12%) 1.160 (+0.09%) 107.01LES 25.77 (-2.52%) 1.162 (+0.25%) 105.40
Table 1. Fan OGV performances for the baseline con�guration at 61.7% rotor speed (�rst two columns) and mean axialvelocity Vref at mid-distance between the rotor and the stator (third column).
(a) 97% channel height.
(b) 50% channel height.
(c) 25% channel height.
Figure 6. Mach number contours on developed blade-to-blade surfaces. Le�: LES instantaneous �eld. Center: LES averaged�eld. Right: RANS �eld.
�e mean �ow described by both numerical approachesis very similar at midspan. Nevertheless, the LES boundarylayers are thinner on the rotor blades (no recirculation bubbleas in the RANS) yielding slightly thinner rotor wakes withless velocity de�cits than in the RANS results. �is e�ect isemphasized at the hub where the wakes are clearly thinner inthe LES than in the RANS simulation. For both spanwise loca-tions, the mean �ow in the stator domain is very close in theRANS simulation to the one found in LES in spite of the verydi�erent approach used for the rotor-stator interface. Closeto the tip, however, the mean �ow is signi�cantly di�erent inthe two simulations. On the one hand, the RANS calculationpredicts a large �ow detachment on the rotor blade leadingedge which interacts strongly with the tip leakage �ow. Onthe other hand, the deviation induced by the rotor tip �owhas an e�ect on the stator �ow resulting in important �owseparations at the tip of the outlet guide vanes that do not
appear in the LES, which is again quite similar to what wasfound in the CME2 compressor case [7, 23, 24]. It shouldbe emphasized that such �ow separations predicted by theRANS simulations were neither observed experimentally norin the tripped LBM/VLES case.
Figure 7 presents the �eld of the normalized componentof axial velocity in an axial cut at mid-distance between therotor trailing edge and the stator leading edge where hot-wire (HW) measurements have been performed by Podboy etal. [16]. �e values are normalized by the respective (experi-mental, RANS or LES) mean axial velocity at the axial planeof interest in order to take into account deviations from theexperimental operational point given in Tab. 1. �e twistinge�ect on the rotor wake in the interstage by the di�erentialtransport of the wake vorticity by the mean swirl is well cap-tured by all simulations. On the upper part of the channel,the radial oscillations (S-shape) observed in the RANS wake

Large Eddy Simulation of a Scale-model Turbofan for Fan Noise Source Diagnostic — 6/11
(a) hot-wire (b) RANS (c) LES
Figure 7. Normalized axial mean velocity �ow �elds on an axial plane at mid-distance between rotor trailing edge and statorleading edge.
(a) Hot wire: axial (b) Hot wire: radial (c) Hot wire: tangential
(d) LES: axial (e) LES: radial (f) LES: tangential
Figure 8. �ree RMS components of the velocity on an axial plane at mid-distance between rotor trailing edge and statorleading edge. Top: hot-wire measurements, bo�om: LES.
pro�le (seen in all benchmark RANS simulations) are the con-sequence of the tip �ow detachment from the leading-edgeand is not present in the LES. Both in the LES and RANS thetop 10% of the channel are strongly a�ected by the tip leakage�ow and strong axial velocity de�cit are identi�ed caused bythe resulting �ow blockage. �is is hardly seen in the HWmeasurements, which may still suggest an insu�cient meshresolution in the tip clearance or in the casing boundarylayer. Yet as mentioned above, the di�erent geometry usedin the simulation does not take into account the same bladedeformation in rotation and thus, the gap is di�erent than inthe experiments. Finally the LES normalized axial velocityoutside the wake agrees well with experiments, even thoughthe wake de�cit is under-predicted.
�e unsteady nature of the LES also allows to obtainstatistics of the resolved turbulent velocity �uctuations: the
three RMS components of the velocity are presented in Fig. 8along with the experimental results. �e turbulence pa�ernobtained by LES, for both the wakes and the tip secondary�ow, shows a good agreement with the experiments. In fact,not only the turbulence intensity is accurately reproduced butalso the distribution on the three components is very similarall across the channel height with hardly any turbulence nearthe hub and transition to turbulence at mid-span.
Moreover in the wake, the three components have similarlevels in most of the channel height, the tangential compo-nent being the lowest of the three. Close to the casing, thetip clearance �ows cause a noticeable decrease of the radial�uctuations in favor of the axial and tangential componentsas already shown by Leonard et al. (Fig. 14 in [14]). Similarresults have also been reported by Casalino et al. with aLBM/VLES approach (Fig. 7 in [25]). Overall, the turbulence

Large Eddy Simulation of a Scale-model Turbofan for Fan Noise Source Diagnostic — 7/11
seems to be mostly homogeneous in the wake which hasbeen also highlighted in another turbofan stage studied byBonneau et al. [26] with a ZDES approach.
3.2 Unsteady Flow and Noise SourcesOne advantage of LES is to give access to detailed informa-tion on the turbulence development and can help understandits in�uence on the noise sources of the turbofan operatingat approach condition. �e turbulent structures are iden-ti�ed using an iso-surface of Q-criterion computed in therotor reference frame in Fig. 9. Q stands for the second in-variant of the velocity-gradient tensor. Each blade side isshown from its leading edge. As already mentioned for the
(a) pressure side
(b) suction side
Figure 9. Q criterion iso-surfaces in the rotor coloured bytemperature (leading edge view).
instantaneous Mach number contours, while the boundarylayer on the rotor-blade suction side is turbulent startingfrom the leading edge, the favorable pressure gradient on thepressure side limits the development of the turbulence (quasilaminar along the whole blade span): the boundary layer isinitially laminar and some turbulent spots can be localizedby the appearance of vertical vortex structures on the upperpart of the blade only. On 30% of the blade span close to
the hub, hardly any turbulent structures are visible on thepressure side revealing that the boundary layer stays in aquasi laminar state. �e temperature contours coloring theiso-Q further stress that high �ow shearing and skin frictiontypical of turbulent �ows only occur on the upper part ofboth sides of the rotor blades. �is yields a very thin wakeand low velocity de�cit in the lower part of the channel asseen in Fig. 7. �e laminar to turbulent boundary layer transi-tion cannot be captured by the RANS approach as it assumesthe boundary layer to be turbulent right from the leadingedge. �is early boundary layer development yields largerwake width in the lower part of the channel in Fig. 7. �etip leakage generates large coherent structures that interactwith the pressure side provoking the large velocity de�cit inthe upper part of the channel.
Dynamic Mode Decompositions (DMD) has been per-formed on the pressure signals on the rotor blade skin in therotating reference frame [27]. �is signal processing methodallows to detect and extract a set of dominant modes in agiven complex �ow [10]. Figure 10(a) shows the mode asso-ciated with the relative vane passing frequency (VPF). Notethat the rotor blade is again seen from its leading edge. Inthe lower part of the blade pressure side where the boundarylayer is laminar, a periodic wave going upstream can be seen,representing the acoustic pressure wave generated by wakeinteraction on the stator vanes traveling upstream. On thesuction side a similar pa�ern can be guessed but it is hiddenin the hydrodynamic �uctuations and turbulent vortices.
Further evidence of the above �ow and acoustic featuresis provided by the wall-pressure power spectral densities(PSD) presented in Fig. 10(b). �ese PSD are computed fromthe pressure signals of two probes in both the laminar (15%of blade span) and turbulent parts (85% of blade span) ofthe pressure side of the rotor blade. On the one hand, thespectrum of the probe located in the laminar region has muchlower levels with an early and quick roll-o� at mid-frequency.It also presents a hump around the stator passing frequency.On the other hand, in the turbulent region the spectrum isbroadband with no particular tonal frequency. �is acoustictone is again masked by the turbulent pressure �uctuations.
4. NOISE PREDICTIONS FROMLES SIMULA-TIONS�e unsteady pressure recorded on the stator vane skin hasbeen used for far-�eld noise prediction with two di�erentanalogies, the Ffowcs Williams & Hawkings’ (FWH) analogyin free �eld, and the extension of Goldstein’s analogy toannular ducts [28]. �e FWH analogy allows to directlypropagate the stator wall-pressure �uctuations to the far-�eldwithout any duct re�ections in order to then compute theacoustic power. Indeed from the resulting acoustic pressurep′(x, t) a surface integration over an upstream half-sphereS− and a downstream half-sphere S+ is performed to evaluatethe intake and exhaust power:
S±pp (ω) =∫S−∪S+
limT→+∞
π
TE
(| p′ (ω) |2
ρ0c0
)dS, (1)

Large Eddy Simulation of a Scale-model Turbofan for Fan Noise Source Diagnostic — 8/11
pressure side suction sideaxial chord
wave traveling
upstream
pressure200
-200
(a) Relative VPF extracted via the DMD on the skin pressure.
10−2
10−1
10+0
10+1
10+2
10+3 10+4
pow
ersp
ectr
alden
sity
frequency (Hz)
85% blade height15% blade heightRelative VPF
(b) Power spectral density of the pressure signals of two probes at midchord at two di�erent heights.
Figure 10. DMD analysis on the rotor-blade skin where therelative BPF refers to the the relative vane-passingfrequency for an observer embedded on a moving blade.
where E represents the expected value (from probability the-ory) computed from a Welch periodogram. In this work, onlythe loading noise has been considered as only the pressure�uctuations on the stator vanes are considered. �e formu-lation used in the in-house code SherFWH is reproducedhere for completeness. �e far-�eld acoustic pressure at anobserver location x reads
p′(x, t) =1
4πc0
∫f =0
[Lr
r (1 − Mr )2
]
τ
dS
+14π
∫f =0
[Lr − LM
r2(1 − Mr )2
]
τ
dS
+1
4πc0
∫f =0
Lr
(r Mr + c0
(Mr − M2
))r2(1 − Mr )3
τdS,
(2)
where
Lr = Li ri , Lr = Li ri , LM = Li Mi , Mr = Mi ri , (3)
and dots on quantities denote time derivative with respectto the source time τ. Li is the loading term and Mi is theMach number of the surface f = 0 (here the vane surface),r =| x − y | where y is the source position, ri = (xi − yi )/rand c0 is the speed of sound in quiescent medium and tthe time at the observer. Moreover, the subscript i denoteseach coordinate direction and the bracket [...]τ refers to theevaluation at the retarded time τ.
In Goldstein’s analogy extended to annular ducts, theacoustic power S±pp (ω) at the angular frequency ω upstream(−) and downstream (+) is computed according to the ex-pression (5a) from [29]:
S±pp (ω) =∑m∈Z
∑µ∈N
F±m, µ limT→+∞
π
TE
(|P±m, µ (ω) |2
), (4)
where m and µ are the azimuthal and radial orders of anacoustic duct mode respectively. �e mode amplitude F±m, µlinks the �uid impedance ρ0c0 with Γm, µ , the squared normof the duct eigenfunction Em, µ as
F±m, µ (ω) =Γm, µ
ρ0c0G±m, µ (ω) , (5)
with
G±m, µ (ω) =κm, µ (ω)k0(ω)
|k0 (ω) − k±m, µ (ω) Mxd |2 , (6)
where κm, µ (ω) is the cut-o� wavenumber, k0(ω) the acousticwavenumber, k±m, µ (ω) the axial wavenumber of the ductmode (m, µ) in the duct reference frame, and Mxd the ductaxial Mach number. �e la�er are de�ned as
κm, µ (ω) = k20 (ω) − β2xd χm, µ , k0(ω) =ω
c0,
k±m, µ (ω) =−k0(ω)Mxd ∓ κm, µ
β2xd, Mxd =
Uxd
c0,
(7)
where the compressibility factor β2xd =√1 − Mxd , Uxd is
the axial mean velocity component and χm, µ is the eigen-value of the mode (m, µ). In Eq. (4), the pressure amplitudeP±m, µ of the duct mode (m, µ) can be derived from Eq. (9)from [29] as
P±m, µ (ω) = −"
⋃j S j, I
pw, j (xI0,ω)2i κm, µ (ω) Γm, µ
dS j,xI0
· ∇I0(Em, µ (r0) e−imθI0 e−ik
±m, µ (ω)x0
),
(8)
where the Fourier transform of the pressure jump ∆P(xI0,ω)has been replaced by the Fourier transform of the elemen-tary force f j (xI0, t0) = pw, j (xI0, t0) dS j,xI0 applied to thesurface element of the blade j and the superscript ∗ (conju-gate) has been dropped from the duct eigenfunction Em, µ
as it is a real function. In Eq. (8), the subscript I represents

Large Eddy Simulation of a Scale-model Turbofan for Fan Noise Source Diagnostic — 9/11
the reference coordinate system RI , the coordinate vectorxI0 = (rI0, θI0, x I0) constitutes the coordinates of the cell-centers on the surface elements.
Both analogies can be used following two di�erent ap-proaches. �e �rst one is obtained by computing the acousticpower S±pp (ω) from Eq. (1) or Eq. (4) for FWH and Goldstein’sanalogy respectively) independently for each blade, and thendoing a summation over all of them. �is calculation doesnot take into account any blade-to-blade correlation as thephase is lost when computing the norm in Eqs. (1) and (4).�e second approach takes into account blade-to-blade corre-lations. For the FWH free-�eld analogy, the acoustic powerS±pp (ω) in Eq. (1) is directly computed from the pressure�uctuations p′ from Eq. (2) from all the computed blades.Similarly, for Goldstein’s analogy, it consists in computingthe pressure amplitude P±m, µ from Eq. (8) for all the blades inthe computational domain and then calculating the norm ofthe expected value. Last, the pressure amplitudes are scaledby the ratio of total vane count and computed vane number.�e phase shi� of the vanes that are not directly computedis not yet taken into account in this work.
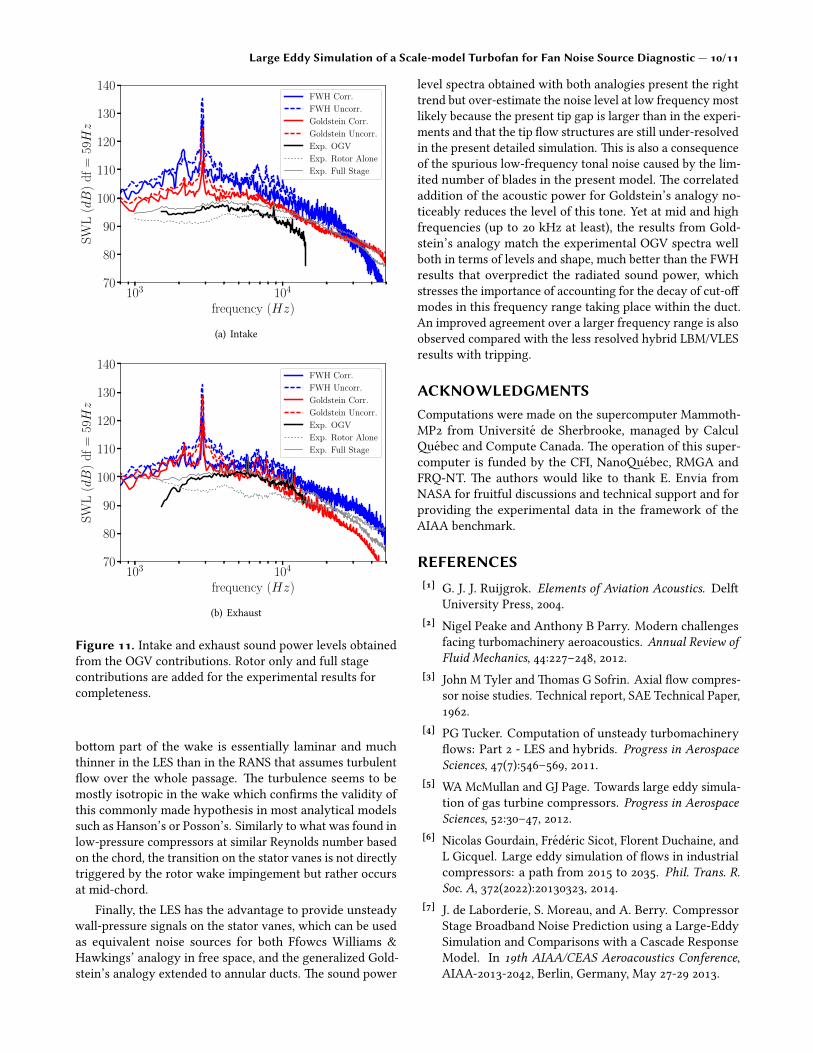
�e results from the FWH analogy (noted as FWH Un-corr. and FWH Corr. for the uncorrelated and correlatedsummation respectively) and for Goldstein’s in-duct analogy(noted as Goldstein Uncorr. and Goldstein Corr.) are com-pared with the measurements [13] in Figs. 11(a) and 11(b).In the experiments, sound power is measured upstream bymeans of an acoustic screen to hide the downstream contribu-tions. �en this contribution is subtracted from the acousticpower measured without the screen to get the exhaust infor-mation. �e mock-up was also run without the stator rowto measure the contribution from the fan only. �e la�eris then subtracted from the acoustic power measured withthe fan-OGV con�guration to isolate the OGV contribution.Unfortunately, the experimental rotor-alone broadband noiselevels eventually overtake the fan-OGV noise levels at somefrequencies. �is is potentially caused by the strong swirling�ow at the nacelle exit interacting with the pylon.
�e numerical predictions from sources on the stator withboth analogies provide globally a good agreement with theexperiments both in terms of levels and shape. �e largestdi�erences in levels (up to 10 dB higher than the fan-OGVmeasurements) are seen at low frequencies. �is highlightsthat additional noise mechanisms may be present in the sim-ulation. Leonard et al. [14] already showed that the rotor-alone predictions were overpredicted because of too largecoherent structures present in the tip gap region (under-resolved region in the LES). Such structures typically yieldlow-frequency humps observed in low-speed fans [30], whichcould correspond to the hump above 2 kHz in Figs. 11(a)and 11(b). Moreover, the di�erences with experiments arehigher toward the intake since the re�ections on the rotorblades are not taken into account. �is e�ect was shownanalytically for the present con�guration by Posson andMoreau [31] and numerically by Casalino et al. [25].
�e results obtained with Goldstein’s analogy extended
to annular ducts are closer to the experimental data overall,especially toward the exhaust demonstrating the limitation ofusing a free-�eld acoustic propagation for this con�guration.�e nacelle plays a crucial �ltering role on the wave propa-gation: di�erent duct-modes with distinct energy levels arecut-o� yielding the sharper spectral decay at high frequenciesseen both experimentally and numerically compared to thefree-�eld case. According to the number of blades and vanes,the BPF and its �rst harmonics should be cut-o�. However,the peak at 2863 Hz which corresponds to the BPF is visiblewith both approaches. �is is expected because only 5 vaneshave been simulated and the Tyler & Sofrin rules [3] onlyapply for a full (axisymmetric) con�guration. Nonetheless,the peak is reduced by 10 dB in the second approach whenthe correlation of the 5 vanes is taken into account. �isspurious peak also contributes to the above low-frequencyover-prediction which shows the very strong sensitivity ofthe destructive interference in tone cut-o� conditions. Fi-nally the current agreement with experiments at the exhaustis similar to what Casalino et al. obtained with the hybridLBM/VLES approach (Fig. 12 in [25]), where the LES yields abe�er high-frequency decay because of the higher resolutionof the vane noise sources.
5. CONCLUSIONS�e Large Eddy Simulation of the scale-model simpli�edNASA SDT turbofan has been successfully achieved for the�rst time at approach condition for the reference stator-vanecase. �is simulation has been performed on the completenacelle and fan-OGV experimental set-up with a slightlymodi�ed vane count to reduce the computational domainin the azimuthal direction. �is simulation was initializedfrom a preliminary steady RANS simulation of the same set-up using a k-ω SST turbulence model. �is con�gurationis of particular interest since it provides a set of detailedexperimental data not only for aerodynamics but also foracoustics. It is then a good test case to evaluate the abilityof LES to reproduce the turbulent �ow in a fan stage butalso to test di�erent acoustic models for noise emission andpropagation.
Both RANS and LES results have shown a good overallagreement with experiments on the mean aerodynamic �owproperties. However, the RANS simulation presents a leading-edge recirculation bubble at the tip of the rotor blade yieldinga downstream S-shape rotor wake, which is not observed inthe LES that only presents some intermi�ent vortex sheddinggrazing on the suction side. Similarly some �ow separationis observed at the tip of the stator vanes in the RANS results,which is neither found in the experiments nor in the LES.Noticeably the LES transitions to turbulence on the rotor-blade suction side close to the leading edge because of thesharp local acceleration, which could not be obtained in lessresolved hybrid LBM/VLES results without tripping. �ecomparison of turbulent velocity �uctuations with hot-wiremeasurements has shown that the LES also gives an accuraterepresentation of turbulence in the wake. Noticeably, the
Large Eddy Simulation of a Scale-model Turbofan for Fan Noise Source Diagnostic — 10/11
103 104
frequency (Hz)
70
80
90
100
110
120
130
140S
WL
(dB
)d
f=
59Hz
FWH Corr.
FWH Uncorr.
Goldstein Corr.
Goldstein Uncorr.
Exp. OGV
Exp. Rotor Alone
Exp. Full Stage
(a) Intake
103 104
frequency (Hz)
70
80
90
100
110
120
130
140
SW
L(dB
)d
f=
59Hz
FWH Corr.
FWH Uncorr.
Goldstein Corr.
Goldstein Uncorr.
Exp. OGV
Exp. Rotor Alone
Exp. Full Stage
(b) Exhaust
Figure 11. Intake and exhaust sound power levels obtainedfrom the OGV contributions. Rotor only and full stagecontributions are added for the experimental results forcompleteness.
bo�om part of the wake is essentially laminar and muchthinner in the LES than in the RANS that assumes turbulent�ow over the whole passage. �e turbulence seems to bemostly isotropic in the wake which con�rms the validity ofthis commonly made hypothesis in most analytical modelssuch as Hanson’s or Posson’s. Similarly to what was found inlow-pressure compressors at similar Reynolds number basedon the chord, the transition on the stator vanes is not directlytriggered by the rotor wake impingement but rather occursat mid-chord.
Finally, the LES has the advantage to provide unsteadywall-pressure signals on the stator vanes, which can be usedas equivalent noise sources for both Ffowcs Williams &Hawkings’ analogy in free space, and the generalized Gold-stein’s analogy extended to annular ducts. �e sound power
level spectra obtained with both analogies present the righttrend but over-estimate the noise level at low frequency mostlikely because the present tip gap is larger than in the experi-ments and that the tip �ow structures are still under-resolvedin the present detailed simulation. �is is also a consequenceof the spurious low-frequency tonal noise caused by the lim-ited number of blades in the present model. �e correlatedaddition of the acoustic power for Goldstein’s analogy no-ticeably reduces the level of this tone. Yet at mid and highfrequencies (up to 20 kHz at least), the results from Gold-stein’s analogy match the experimental OGV spectra wellboth in terms of levels and shape, much be�er than the FWHresults that overpredict the radiated sound power, whichstresses the importance of accounting for the decay of cut-o�modes in this frequency range taking place within the duct.An improved agreement over a larger frequency range is alsoobserved compared with the less resolved hybrid LBM/VLESresults with tripping.
ACKNOWLEDGMENTSComputations were made on the supercomputer Mammoth-MP2 from Universite de Sherbrooke, managed by Calcul�ebec and Compute Canada. �e operation of this super-computer is funded by the CFI, Nano�ebec, RMGA andFRQ-NT. �e authors would like to thank E. Envia fromNASA for fruitful discussions and technical support and forproviding the experimental data in the framework of theAIAA benchmark.
REFERENCES[1] G. J. J. Ruijgrok. Elements of Aviation Acoustics. Del�
University Press, 2004.[2] Nigel Peake and Anthony B Parry. Modern challenges
facing turbomachinery aeroacoustics. Annual Review ofFluid Mechanics, 44:227–248, 2012.
[3] John M Tyler and �omas G Sofrin. Axial �ow compres-sor noise studies. Technical report, SAE Technical Paper,1962.
[4] PG Tucker. Computation of unsteady turbomachinery�ows: Part 2 - LES and hybrids. Progress in AerospaceSciences, 47(7):546–569, 2011.
[5] WA McMullan and GJ Page. Towards large eddy simula-tion of gas turbine compressors. Progress in AerospaceSciences, 52:30–47, 2012.
[6] Nicolas Gourdain, Frederic Sicot, Florent Duchaine, andL Gicquel. Large eddy simulation of �ows in industrialcompressors: a path from 2015 to 2035. Phil. Trans. R.Soc. A, 372(2022):20130323, 2014.
[7] J. de Laborderie, S. Moreau, and A. Berry. CompressorStage Broadband Noise Prediction using a Large-EddySimulation and Comparisons with a Cascade ResponseModel. In 19th AIAA/CEAS Aeroacoustics Conference,AIAA-2013-2042, Berlin, Germany, May 27-29 2013.

Large Eddy Simulation of a Scale-model Turbofan for Fan Noise Source Diagnostic — 11/11
[8] Nicolas Gourdain. Prediction of the unsteady turbulent�ow in an axial compressor stage. part 1: Comparisonof unsteady rans and les with experiments. Computers& Fluids, 106:119–129, 2015.
[9] D. Papadogiannis, F. Duchaine, L. Gicquel, G. Wang, andS. Moreau. E�ects of Subgrid Scale Modeling on the De-terministic and Stochastic Turbulent Energetic Distribu-tion in Large-Eddy Simulations of a High-Pressure Tur-bine Stage. Journal of Turbomachinery, 138(9):091005–091005, 2016.
[10] G. Wang, M. Sanjose, S.e Moreau, D. Papadogiannis,F. Duchaine, and L. Gicquel. Noise mechanisms in a tran-sonic high-pressure turbine stage. International Journalof Aeroacoustics, 15(1-2):144–161, 2016.
[11] C. Hughes, R. Jeracki, R. Woodward, and C. Miller. FanNoise Source Diagnostic Test - Rotor Alone Aerody-namic Performance Results. In 8th AIAA/CEAS Aeroa-coustics Conference & Exhibit, AIAA-2002-2426, Breck-enridge, CO, USA, June 2002. AIAA papers.
[12] G. Podboy, M. Krupar, S. Helland, and C. Hughes. Steadyand Unsteady Flow Field Measurements within a NASA22 inch fan model. In 40th AIAA Aerospace SciencesMeeting & Exhibit, AIAA-2002-1033, Reno, NV, USA,January 2002. AIAA papers.
[13] R. Woodward, C. Hughes, R. Jeracki, and C. Miller. FanNoise Source Diagnostic Test - Far-�eld Acoustic Re-sults. In 8th AIAA/CEAS Aeroacoustics Conference &Exhibit, AIAA-2002-2427, Breckenridge, CO, USA, June2002. AIAA papers.
[14] T. Leonard, M. Sanjose, S. Moreau, and F. Duchaine.Large Eddy Simulation of a scale-model turbofan forfan noise source diagnostic. In 22nd AIAA/CEAS Aeroa-coustics Conference, AIAA Paper 2016-3000. AmericanInstitute of Aeronautics and Astronautics, may 2016.
[15] Ed. Envia. Fan Noise Source Diagnostics Test - Vane Un-steady Pressure Results. In 8th AIAA/CEAS AeroacousticsConference & Exhibit, AIAA-2002-2430, Breckenridge,CO, USA, June 2002. AIAA Paper.
[16] G. Podboy, M. Krupar, C. Hughes, and R. Woodward. FanNoise Source Diagnostic Test - LDV Measured Flow FieldResults. In 8th AIAA/CEAS Aeroacoustics Conference &Exhibit, AIAA-2002-2431, Breckenridge, CO, USA, June2002. AIAA Paper.
[17] M. Sanjose, M. Daroukh, W. Magnet, J. De Laborderie,S. Moreau, and A. Mann. Tonal fan noise prediction andvalidation on the ANCF con�guration. Noise ControlEngineering Journal, 63(6), 2015.
[18] T. Schonfeld and M. Rudgyard. Steady and UnsteadyFlow Simulations Using the Hybrid Flow Solver AVBP.AIAA Journal, 37(11):1378–1385, 1999.
[19] F. Duchaine, S. Jaure, D. Poitou, E. �emerais, G. Sta�el-bach, T. Morel, and L. Gicquel. Analysis of high per-formance conjugate heat transfer with the openpalm
coupler. Computational Science & Discovery, 8(1):015003,2015.
[20] G. Wang, F. Duchaine, D. Papadogiannis, I. Duran,S. Moreau, and L. Gicquel. An overset grid method forlarge eddy simulation of turbomachinery stages. Journalof Computational Physics, 274:333–355, 2014.
[21] T. Poinsot and S. Lele. Boundary conditions for directsimulations of compressible viscous �ows. Journal ofComputational Physics, 101(1):104–129, 1992.
[22] C. Mocke�, T. Knacke, and T. �iele. Detection of ini-tial transient and estimation of statistical error in time-resolved turbulent �ow data. In Proceedings of 8th Inter-national ERCOFTAC Symposium on Engineering Turbu-lence Modelling and Measurement, 2010.
[23] G. Wang, S. Moreau, F. Duchaine, N. Gourdain, andL. Y. M. Gicquel. Large eddy simulations of the mt1high-pressure turbine using turboavbp. In Proceedingof 21st Annual Conference of the CFD Society of Canada,Sherbrooke, �ebec, Canada, May 6-9, 2013.
[24] Nicolas Gourdain. Prediction of the unsteady turbulent�ow in an axial compressor stage. part 2: Analysis ofunsteady rans and les data. Computers & Fluids, 106:67–78, 2015.
[25] Damiano Casalino, Andreas Hazir, and Adrien Mann.Turbofan broadband noise prediction using the la�iceboltzmann method. In Proceeding of the 22nd AIAA-CEASAeroacoustics Conference, 2016.
[26] V. Bonneau, C. Polacsek, L. Castillon, J. Marty, andS. Moreau. Turbofan broadband noise predictions usinga 3D ZDES rotor blade approach. In 22nd AIAA/CEASAeroacoustics Conference, AIAA-2016-2950, Lyon, France,May 2016. AIAA Paper.
[27] Peter J Schmid. Dynamic mode decomposition of numer-ical and experimental data. Journal of �uid mechanics,656:5–28, 2010.
[28] Marvin E Goldstein. Aeroacoustics. New York, McGraw-Hill International Book Co., 1976. 305 p., 1, 1976.
[29] H. Posson, S. Moreau, and M. Roger. Broadband noiseprediction of fan outlet guide vane using a cascaderesponse function. Journal of Sound and Vibration,330:6153–6183, 2011.
[30] S. Moreau and M. Sanjose. Sub-harmonic broadbandhumps and tip noise in low-speed ring fans. Journal ofthe Acoustical Society of America, 139(1):118–127, 2016.
[31] H. Posson and S. Moreau. E�ect of Rotor Shielding onFan-Outlet Guide Vanes Broadband Noise Prediction.AIAA Journal, 51(7):1576–1592, June 2013.