Embed Size (px)
Citation preview

Large China Supply Depressing US CBO Exports
Vincent J. Guercio CTC International
2014 Platts Bunker & Residual Fuel Oil Conference June 2014 - Houston
1
I n t r o d u c t i o n Heavy Aromatic Oils - HAO Carbon Black Oils - CBO Carbon Black Feedstock - CBFS CBF
------------------------------------------------ FCC Decant Oils - DO Slurry Cracked Ethylene Tar - ET EBO ECR PFO Coal Tar Oils - CT Anthracene oil (Creosote) - ATO ATO / Soft Pitch Mixture - CBO Mix
KT = Kilotons 2
T o p i c s
Carbon Black Capacity Global CBFS Types China Coal Tar & CBFS China CB & CBFS Exports U.S. CBO Exports Asian CBFS Supply
3

CB Capacity History by Area
China
0
1000
2000
3000
4000
5000
6000
7000
8000
9000
10000
11000
12000
13000
14000
15000
16000
2000 2001 2002 2003 2004 2005 2006 2007 2008 2009 2010 2011 2012 2013
Kilo
tons
USA
NE Asia
4

CB Capacity History by Company
0
1000
2000
3000
4000
5000
6000
7000
8000
9000
10000
11000
12000
13000
14000
15000
16000
2000 2001 2002 2003 2004 2005 2006 2007 2008 2009 2010 2011 2012 2013
Kilo
tons
China Other
Sid Rich
Orion
Black Cat
Birla
CSRC
ROW
Cabot
PCBL
5

China CB Capacity by Company
0
1000
2000
3000
4000
5000
6000
7000
8000
2000 2001 2002 2003 2004 2005 2006 2007 2008 2009 2010 2011 2012 2013
Kilo
tons
China Other
Black Cat
6

2013 Carbon Black Capacity
World(15.7 million TPY)
Balance
Other China
Bridgestone
Black Cat Huadon
g
BoahuaOCI
Sid
Rich
Omsk
Orion
Yaroslavel
Cabot
CSRC
Birla
PCBL
Toka
i
Long
Asia(10.0 million TPY)
OCI
LongxingPCBL
CSRC
Boa
hua
Bridge
ston
e
Orion
Hua
dong
Tokai
Balance
Other China
Birla
Cabot
Black Cat
7

Demand
Northeast Asia
SouthAsia
China
USA
OtherAmericas
Europe
Rest ofWorld
Supply
Northeast Asia
SouthAsia
China
USA
Other Americas
Europe
Rest ofWorld
2012 World CBO (20 million Tons Total)
8

2012(20 million Tons Total)
OtherCoal Tar
3042
Local Decant2500
ChinaCoal Tar
7160
US Decant5240
EthyleneTar
2060
2004(14.4 million Tons Total)
OtherCoal Tar
2355
Local Decant2128
ChinaCoal Tar
1450
US Decant 5735
Ethylene Tar2760
World CBFS Types Coal tar surpassed decant oil in 2011
9

2012 World Coal Tar CBO Use(10,200 KT Total)
India
NortheastAsia JKT
China
Russia/Ukraine
EuropeUnion
10

China - Coal Tar CBFS
Neat Anthracene Oil Soft Pitch + Anthracene Oil
Raw Coal Tar + Anthracene Oil Naphthalene Depleted Coal Tar
11

China Coal Tar Availability & Distillation
High Steel Production Growth 90% via Blast Furnace Iron
Moderate Aluminum Output Anode Pitch Not Driving Distillation Pitch Modification Necessary Soft Pitch Priced Below Coal Tar
Strong Naphthalene Demand CBFS & Naphthalene are Major Products Large ATO & CBO Mix Exports 2012+
12

Regional Tar Product Markets
Binder Wood treat
Chemicals
Binder + CBFS
CBFS + export
Chemicals
Binder + CBFS + NCFS
USA Europe Asia
Pitch 50%
Distillate 30% Naphthalene 10% Wash Oil + 10%
CBFS
Chemicals
13
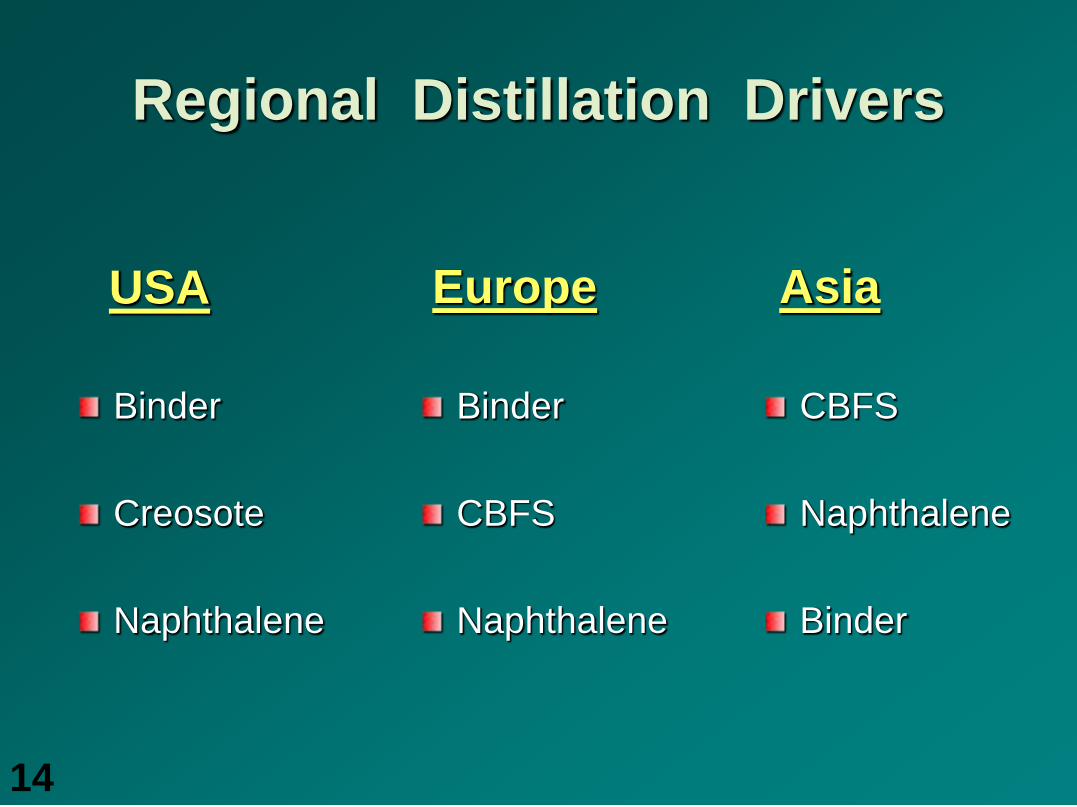
Regional Distillation Drivers
Binder Creosote Naphthalene
Binder CBFS Naphthalene
CBFS Naphthalene Binder
USA Europe Asia
14

China CB Balance History
CB Imports
Domestic Supply
CB Exports
Unused Capacity
0
1000
2000
3000
4000
5000
6000
7000
2000 2001 2002 2003 2004 2005 2006 2007 2008 2009 2010 2011 2012 2013
Kilo
tons
15

China CB Export History
South Asia
North
Asia
EuropeNAmerMid-East
Other
0
100
200
300
400
500
600
700
800
900
1000
2000 2001 2002 2003 2004 2005 2006 2007 2008 2009 2010 2011 2012 2013
Kilo
tons
16

North Asia CB Supply
Traditional CB
China CB
0
200
400
600
800
1000
1200
1400
1600
1800
2000 2001 2002 2003 2004 2005 2006 2007 2008 2009 2010 2011 2012 2013
Kilo
tons
17

South Asia CB Supply
Traditional CB
China CB
0
200
400
600
800
1000
1200
1400
1600
1800
2000 2001 2002 2003 2004 2005 2006 2007 2008 2009 2010 2011 2012 2013
Kilo
tons
18
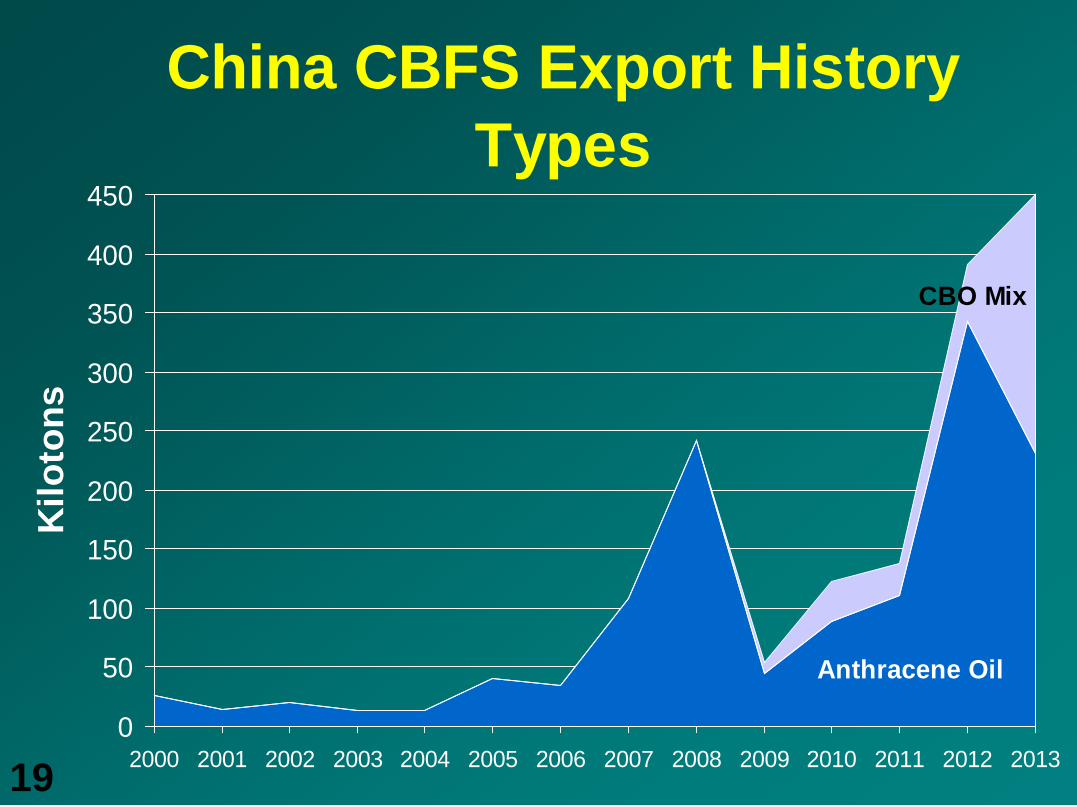
China CBFS Export HistoryTypes
Anthracene Oil
CBO Mix
0
50
100
150
200
250
300
350
400
450
2000 2001 2002 2003 2004 2005 2006 2007 2008 2009 2010 2011 2012 2013
Kilo
tons
19

China CBFS Export HistoryRegions
North Asia
South Asia
0
50
100
150
200
250
300
350
400
450
2000 2001 2002 2003 2004 2005 2006 2007 2008 2009 2010 2011 2012 2013
Kilo
tons
20

CBFS Equivalent to RegionsChina CB + CBFS displacing US CBO
North Asia
South Asia
0
200
400
600
800
1000
1200
1400
1600
2000 2001 2002 2003 2004 2005 2006 2007 2008 2009 2010 2011 2012 2013
Kilo
tons
21
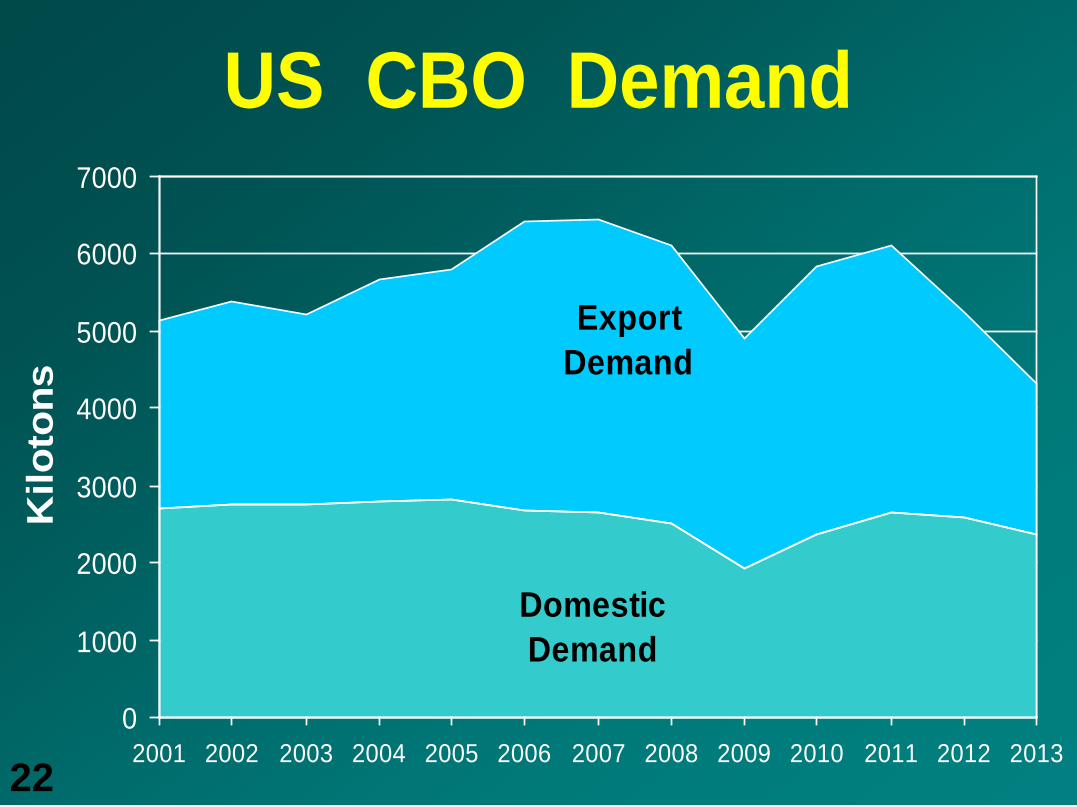
US CBO Demand
Domestic Demand
Export Demand
0
1000
2000
3000
4000
5000
6000
7000
2001 2002 2003 2004 2005 2006 2007 2008 2009 2010 2011 2012 2013
Kilo
tons
22

US CBO Export Destination
South Asia
North Asia
Europe
Americas + Africa
0
500
1000
1500
2000
2500
3000
3500
4000
2001 2002 2003 2004 2005 2006 2007 2008 2009 2010 2011 2012 2013
Kilo
tons
23

US CBO Export Source
Gulf Coast
West CoastGreat Lakes
E Coast
0
500
1000
1500
2000
2500
3000
3500
4000
2001 2002 2003 2004 2005 2006 2007 2008 2009 2010 2011 2012 2013
Kilo
tons
24

Gulf Coast CBO Exports
South Asia
North Asia
Europe
Americas +Africa
0
500
1000
1500
2000
2500
3000
3500
2001 2002 2003 2004 2005 2006 2007 2008 2009 2010 2011 2012 2013
Kilo
tons
25

North Asia CBFS Supply
Domestic Supply
US CBO
China CBFS
0
500
1000
1500
2000
2500
2000 2001 2002 2003 2004 2005 2006 2007 2008 2009 2010 2011 2012 2013
Kilo
tons
26

South Asia CBFS Supply
Domestic Supply
US CBO
China CBFS
0
500
1000
1500
2000
2500
2000 2001 2002 2003 2004 2005 2006 2007 2008 2009 2010 2011 2012 2013
Kilo
tons
27

Thank you!
29