Embed Size (px)
Citation preview

Markets Committee
Large central bank balance sheets and market functioning Report prepared by a Study Group chaired by Lorie Logan (Federal Reserve Bank of New York) and Ulrich Bindseil (European Central Bank)
October 2019

This publication is available on the BIS website (www.bis.org).
© Bank for International Settlements 2019. All rights reserved. Brief excerpts may be reproduced or translated provided the source is stated.
ISBN 978-92-9259-297-4 (online)

Large central bank balance sheets and market functioning iii
Preface
When central banks expanded their balance sheets on an unprecedented scale during the global financial crisis and its aftermath, there was little prior experience with such policies to guide them. In particular, there were significant uncertainties regarding their impact – both positive and negative – on market functioning. Although a key concern of those designing and implementing unconventional policies, these effects on market functioning have received little attention in academic research and other analytical work. This is why the Markets Committee commissioned a study to look deeper into the subject. The ensuing report complements parallel work by the Committee on the Global Financial System on the effectiveness of unconventional monetary policy tools, synthesising the collective experience of central banks over this important period.
A key message of the Markets Committee report is that central banks carefully considered the adverse implications of their unconventional policies on market functioning and made important efforts to mitigate such effects. I believe that summarising the lessons learned from the episode of balance sheet expansion by those who were then “in the trenches” will be useful for future generations of central bankers. Drawing on these lessons will, I hope, minimise any negative impact on market functioning, should there ever again be a need to pursue large-scale balance sheet expansion.
Jacqueline Loh
Chair, Markets Committee Deputy Managing Director, Monetary Authority of Singapore


Large central bank balance sheets and market functioning v
Contents
Executive summary ................................................................................................................................. 1
1. Introduction ....................................................................................................................................... 3
2. Central bank policies and large balance sheets .................................................................. 4
2.1 The evolution of central bank programmes ............................................................... 5
2.2 Lending programmes .......................................................................................................... 6
2.3 Asset purchase programmes ............................................................................................ 7
2.4 How were the programmes funded? The liabilities side of central banks’ balance sheets........................................................................................... 8
2.5 Overall balance sheet impact of policy measures .................................................... 9
3. Financial market functioning ..................................................................................................... 10
3.1 Conceptual issues ............................................................................................................... 10
3.2 Measuring market functioning ...................................................................................... 12
4. Impact of large balance sheets and market functioning ............................................... 14
4.1 Bond markets ........................................................................................................................ 14
4.2 Money markets .................................................................................................................... 22
4.3 International spillovers ...................................................................................................... 29
5. Central bank measures and tools to mitigate side effects of large balance sheets ..................................................................................................................... 33
5.1 Programme design ............................................................................................................. 34
5.2 Securities lending programmes .................................................................................... 39
5.3 Liability management practices and remuneration policies .............................. 43
6. Balance sheet unwinding and market functioning: the experience so far .............. 48
6.1 Unwinding of bank liquidity facilities .......................................................................... 48
6.2 Unwinding of asset purchases ....................................................................................... 48
7. Key lessons for policymakers .................................................................................................... 50
References ................................................................................................................................................ 54
Annex A. Draining liquidity: tools and their usage ................................................................... 59
Annex B. Absorbing operations and support for the money market: the case of China ................................................................................................................ 62
Annex C. Description of tiered remuneration schemes .......................................................... 64
Annex D: Further results from the CGFS/MC survey ............................................................... 65

Large central bank balance sheets and market functioning vi
Annex E: Large central bank balance sheets and bond market functioning – a comprehensive literature review ............................................................................... 75
Annex F: Size and composition of central bank balance sheets since the great financial crisis ........................................................................................................... 80
Members of the study group ........................................................................................................... 85

Large central bank balance sheets and market functioning 1
Executive summary
Central banks expanded their balance sheets on an unprecedented scale in response to the global financial crisis (GFC) and its aftermath. To address financial market dislocations and the limitations of interest rate policy as rates approached their effective lower bound, many central banks introduced special lending programmes, often followed by large-scale asset purchase programmes.
The scale of these programmes has naturally given rise to concerns about their impact on market functioning, prompting central banks to take steps to mitigate potential adverse consequences. This report prepared by a Markets Committee (MC) study group reviews the accumulated experiences and associated policy implications. It examines how the design and execution of balance sheet expansion affected market functioning, in particular, the ability of market participants to adjust positions efficiently, and whether asset prices have promptly and reliably responded to information.
The report adds to the literature by providing a systematic cross-country perspective on the effects on market functioning and related policy options. It draws on a central bank survey, analysis conducted by the study group, and a review of the available academic and policy literature. The report complements a parallel CGFS study, which reviews more broadly the effectiveness of, and lessons from, central banks’ use of unconventional policy tools.
The study group found that central bank balance sheet expansion, especially in early phases, had predominantly positive effects on market functioning. In particular, during periods of heightened illiquidity, emergency lending programmes helped ease severe funding market strains, while purchases of bonds with outsized risk premia tended to improve their underlying liquidity. Negative effects sometimes arose, but rarely tightened financial conditions materially, in part because of mitigating actions taken by policymakers. While adverse effects have often been transitory, they can have an enduring impact when policies are in place for a prolonged period.
Negative effects on market functioning have tended to be associated with elevated asset scarcity, in particular when central bank purchases or securities holdings were particularly large in relation to issuance or outstanding amounts. Scarcity at times has led to deterioration in bond liquidity metrics and increased repo specialness, although these effects were often short-lived. Declines in market making and reduced investor participation were reported in some markets, in particular where policies were in place for an extended period of time. Hence, the consequences for market functioning may not be fully evident until balance sheets normalise.
The expansion of central bank balance sheets produced sharp increases in bank reserves, contributing to a significant decline in interbank reserves trading activity. However, activity in wholesale money markets has remained robust, and central banks have kept a sufficient degree of control over short-term interest rates.
The report documents that central banks were able to avert or attenuate side effects from balance sheet expansion on market functioning by adopting a range of mitigation strategies. These strategies were often embedded in the design of the programmes themselves, such as purchase protocols to exclude securities temporarily in high demand or to cap central bank ownership shares of individual bonds. Transparency and clear communication limited asymmetric information and supported predictability, while maintaining margins of flexibility to allow central

Large central bank balance sheets and market functioning 2
banks to adjust the pace, timing or volume of purchases in response to changes in prevailing market conditions. Finally, central banks adopted measures to alleviate scarcity effects, such as securities lending programmes.
As experience with expiring lending programmes and shrinking balance sheets has been more limited, conclusions regarding the impact on market functioning are more tentative. However, preliminary evidence suggests that steps can be taken to mitigate any negative side effects from the expiry of lending programmes (such as bank fragility), and cutbacks in securities holdings (such as diminished trading and inventory capacity among securities dealers), including by adhering to the general principles of gradualism and predictability.
From the experiences analysed in this report, the study group has distilled a set of lessons and best practices. These lessons can, we hope, help inform central bankers in minimising negative impacts on market functioning should there be a future need to pursue large-scale balance sheet expansions:
• A gradual pace of purchases relative to free float and net issuance can limit non-linear flow effects on asset prices and the associated volatility when short-run supply of assets is inelastic.
• Limiting asset holdings relative to market size, when feasible, can reduce risks of impeding the price discovery process and of the investor base atrophying.
• Well-designed securities lending programmes (SLPs) are important tools to attenuate scarcity effects, including by containing excessive repo specialness and supporting collateral velocity.
• Appropriate transparency and predictability in operations can help minimise uncertainty around the central bank’s purchase policy reaction function, reducing information asymmetries.
• Preserving some margins of operational flexibility to respond to changes in market or liquidity conditions can provide scope to reduce negative market functioning effects without altering the programme’s monetary policy stance.
• Declining interbank trading activity is a natural by-product of central bank balance sheet expansions. When central banks subsequently normalise the size of their balance sheets, they should be prepared to address hysteresis effects that could impact short-term interest rate control.
• Well-designed balance sheet expansion programmes with limited impact on domestic market functioning will also serve to limit cross-border spillovers to market functioning. Careful monitoring of possible international spillovers to market functioning is warranted in order to avoid or contain unintended consequences or spillbacks.
• Programme design features can limit disruptive declines in liquidity resulting from the expiry of non-standard lending operations. These include pricing funding to self-liquidate as conditions normalise and by taking steps to limit maturity cliff effects.
• A predictable and gradual approach to unwinding asset purchases can give market participants more time to prepare for and adjust to increases in supply. This is especially important to the extent that the ecosystem of market participants has changed, or in case crowded trades have emerged (eg owing to a search for yield in an environment of low interest rates).

Large central bank balance sheets and market functioning 3
1. Introduction
In response to the global financial crisis (GFC), and subsequently, many central banks adopted policies that substantially increased the size and altered the composition of their balance sheets. Such policies included special credit operations and large-scale asset purchase programmes. Additionally, balance of payment surpluses and a desire to guard against currency crises led many emerging market economy (EME) central banks to accumulate large amounts of foreign reserves. As a result, over the past decade, many central bank balance sheets grew on an unprecedented scale, and to levels considerably exceeding the minimum size typically determined by bank notes in circulation and other autonomous liabilities.1
Analytical work has often focused on the channels through which central banks’ balance sheet expansions affect policy transmission and financial conditions. An area that has received less attention, but is a key focus of those designing and implementing the policies, is the impact – both positive and negative – of expanded central bank balance sheets on market functioning. For the purposes of this report, good market functioning refers to the ability of market participants to efficiently transact at reasonable cost and for asset prices to respond to relevant incoming information in an appropriate, prompt and reliable manner.
Central banks care about market functioning for several reasons. The smooth functioning of key market segments (such as the bond and money markets) is important to the transmission mechanism of policy changes to the wider economy. Moreover, financial market dysfunction could contribute to a tightening of financial conditions, and thereby possibly weaken some of the intended benefits of central bank balance sheet expansion. Furthermore, the effective functioning of financial markets is an important element of economic efficiency, and hence welfare. An impaired functioning of financial markets can reduce access to – or increase the cost of – the key services provided by financial markets, such as transfer of risk, and distribution of funds between savers and borrowers. Market dysfunction may also reduce the information content of the signals extracted from financial asset prices, and affect the confidence of investors in financial markets.
Against this background, the Markets Committee (MC) established a study group on the implications of the expansion of central bank balance sheets for market functioning and central bank operations. The study group’s work was done in parallel with a study group established by the Committee on the Global Financial System (CGFS) on central banks’ accumulated experience with unconventional monetary policy tools. The aim of the MC study group was to conceptually lay out the channels through which large central bank balance sheets affect market functioning in bond and money markets; to take stock of the measures and facilities introduced by central banks to mitigate such possible side effects; and to distil for policymakers the key lessons learned from central banks operating with large balance sheets. Both bond and money markets are covered by the report. With regard to bond markets, the main focus was the secondary market for government and agency securities, while issues
1 Looking forward, it is likely that, due to changes in banks’ reserves demand related to regulatory
factors and internal liquidity management practices, central banks will face a permanent increase in demand for their liabilities. Thus, under the “new normal”, it is likely that balance sheet sizes in absolute terms will exceed pre-crisis levels by significant amounts, even though they are likely to be smaller than today in relative terms (ie when benchmarked against GDP or currency in circulation).

Large central bank balance sheets and market functioning 4
pertaining to the primary market segment were touched upon only where relevant. For corporate bonds, developments in both primary and secondary market segments were within the scope of the study. Money markets were defined in a relatively broad way, to include secured, unsecured and FX swaps markets, with maturities from overnight up to one year.
The report, which draws heavily on a survey of member central banks conducted jointly by the MC and CGFS study groups, is structured as follows: Section 2 briefly outlines how central bank programmes implemented since 2007 contributed to the expansion and changed composition of central bank balance sheets. Section 3 conceptually defines market functioning, and discusses measurement issues. Section 4 sets out the channels through which expansionary balance sheet policies may affect the functioning of bond and money markets, and assesses how far these effects materialised. Section 5 discusses the measures and tools used by central banks to mitigate the negative effects on market functioning of large central bank balance sheets. Section 6 reviews the evidence to date on how the unwinding of large central bank balance sheets affects market functioning. Finally, Section 7 summarises the key policymaking lessons from the study group’s work.
2. Central bank policies and large balance sheets
This section provides a brief overview of how central bank programmes implemented since 2007 have contributed to the expansion and composition of central bank balance sheets. The overview draws on a survey of central banks conducted jointly by the CGFS and the MC study groups.2
In response to the GFC, and later to the euro area debt crisis, many central banks adopted policies that have substantially affected the size and composition of their balance sheets. Previously, their balance sheets generally reflected, in a passive way, demand for central bank liabilities as well as the framework used to conduct conventional monetary policy. Since then, a number of central banks have come to view their balance sheets as an active tool for crisis management and monetary policy implementation when policy rates are near their effective lower bound.3
Graph II.1 illustrates the major shift in the balance sheet expansion of select advanced economy (AE) central banks that occurred around the GFC. Before the crisis, as shown, central bank balance sheets grew much more in lock-step with currency in circulation (an autonomous factor) as well as with GDP. This changed markedly when asset purchases and unconventional lending operations became widely used from 2008 onwards. The aggregate size of the balance sheets of these central banks more
2 Overall, 23 central banks responded to the survey. For the euro area, responses related to the general
aspects of lending and purchase programmes were provided by the ECB, while national central banks also provided responses on aspects pertaining to local markets. Committee on the Global Financial System (2019) contains details of the survey and a more extensive discussion of the programmes briefly described in this section.
3 Large-scale asset purchases were conducted by the Bank of Japan as early as 2001. That programme, which ended in 2006, was smaller than the post-GFC purchase programmes, and the duration of the purchased securities was generally shorter.

Large central bank balance sheets and market functioning 5
Expansion in central bank balance sheets since the global financial crisis Graph II.1
Q2 2006 = 100
The graph aggregates across the six AE central banks that expanded their balance sheets the most over the period (SNB, BoE, BoJ, Fed, ECB/Eurosystem and Sveriges Riksbank). Weighted averages of euro area, Japan, Sweden, Switzerland, the United Kingdom and the United States, based on GDP and PPP exchange rates.
Sources: National submissions to CGFS/MC survey; study group calculations.
than quadrupled, in stark contrast to more moderate growth in currency in circulation and GDP.4 Annex F shows how assets and liabilities of MC central banks have evolved since the GFC.
2.1 The evolution of central bank programmes
Faced with weakening economic activity and stressed financial markets, central banks initially responded to the GFC with conventional tools, such as reducing short-term interest rates. Soon, however, many central banks enlarged their toolkits with unconventional programmes, often beginning with expanded or new lending programmes as well as some programmes designed to directly support the functioning of stressed market segments (eg commercial paper). This was followed, in a number of cases, by large-scale asset purchase programmes (APPs).
The lending and asset purchase programmes focused on addressing financial market strains, providing policy stimulus – particularly where conventional monetary policy became constrained by effective lower bounds – or a combination of the two. In practice, the main motives for balance sheet expansion evolved over time, in response to changing market and macroeconomic conditions. According to survey responses provided by 23 central banks, almost all of the lending and asset purchase programmes introduced from 2007 to 2009 were undertaken as “measures to address financial market strains”, while a substantial majority of the programmes introduced in 2010 or later were introduced for reasons “unrelated to financial market strains”, reflecting a broad shift toward providing policy stimulus. In addition, a small number of central banks intervened in the foreign exchange market to address capital flow
4 Starting from the early 2000s, a number of central banks in EMEs accumulated large amounts of
foreign reserves on the back of balance of payment surpluses and capital inflows (also, in some cases, because of self-insurance motives following the experience of currency crises). Large central bank balance sheets were thus already a common feature in EMEs before the GFC and the advent of unconventional policies – albeit for different reasons.

Large central bank balance sheets and market functioning 6
pressures, which impacted the size of their balance sheets. The most prominent case is Switzerland, where the central bank intervened to maintain a floor under the EUR/CHF exchange rate between September 2011 and January 2015.
2.2 Lending programmes
In a number of countries, bank funding conditions and money market liquidity began to deteriorate in the second half of 2007. More than half of the 23 central banks surveyed responded to this deterioration in 2007 and 2008 by modifying and expanding existing lending programmes or introducing new programmes (Graph II.2). Over two thirds of the 62 lending programmes introduced between 2007 and 2016 by the surveyed central banks were introduced during the first two years of the survey, in 2007 and 2008.
Most of these early lending programmes focused on alleviating funding market tensions by providing counterparties with access to liquidity, which had become difficult to obtain in stressed funding markets. The availability of central bank credit also supported banks’ access to market funding markets by assuring depositors and investors that banks had adequate liquidity. Central banks used a wide variety of strategies to improve funding conditions, including accepting a wider range of collateral, broadening the set of eligible counterparties, conducting “fixed rate full allotment” credit operations, increasing the frequency of certain operations, and providing funds at longer maturities.5
In contrast, the primary objective of most of the lending programmes introduced in subsequent years was to provide additional monetary stimulus in an environment of very low or negative short-term rates. In particular, the ECB, BoE, and BoJ introduced lending programmes “with additional conditions” beginning in 2010 amid
5 Among many examples, the BoC and the BoE increased the frequency of their term repo operations
in late 2007 and in 2008; the RBA and the SNB began to offer funding at maturities of six months or more in 2008; and the ECB began to gradually increase the maturity of its longer-term refinancing operations in 2008.
Number of programmes introduced each year by policy objective Graph II.2
Purchase programmes Lending programmes
Sources: National submissions to CGFS/MC survey; study group calculations.

Large central bank balance sheets and market functioning 7
concerns that the additional liquidity they were providing was not being passed through to the broader economy. These programmes provided incentives to institutions to extend credit to targeted sectors of the real economy, including by offering lower-cost, higher-volume, and/or longer-maturity loans from the central bank. The later lending programmes often had larger and more persistent effects on the size of central bank balance sheets than earlier lending programmes did, reflecting the later programmes’ longer, often multi-year maturities. In aggregate, however, lending programmes had a smaller impact on the size of central bank balance sheets than the APPs.
2.3 Asset purchase programmes
As with lending programmes, the objectives of APPs evolved over time, and as they did, so did the types of asset purchased. The first APPs were introduced in 2008, a few months after the first lending programmes. By 2016, 30 individual programmes had been launched by six out of the 23 central banks in the survey, with the BoE, the Fed and the Eurosystem implementing eight programmes each, and the BoJ introducing four. Detailed information on the programmes is provided in Tables D.1–D.3 in Annex D.
Most of the early purchase programmes, through 2010, focused on addressing financial market strains. As shown in the left-hand panel of Graph II.3, aggregate purchases under these programmes mainly involved sovereign and agency securities, while the SNB also purchased foreign assets. For example, the Fed’s purchases of agency debt and agency MBS that began in 2008 and 2009 were initially designed to improve market functioning by reducing outsized risk premia, thereby supporting housing markets and financial conditions more broadly.6
Asset purchase programmes introduced after 2010 generally aimed to provide additional monetary policy stimulus to meet policy targets, as short-term interest rates reached their effective lower bound, rather than alleviate financial market strains. For example, beginning in 2011, the BoE introduced three QE programmes to stimulate nominal spending in order to meet its inflation target, while in 2015 the Eurosystem added sovereign bonds to its existing private sector APPs to counter the risks of prolonged low inflation. Most of the latter programmes targeted sovereign/quasi-sovereign assets, but corporate and covered bonds as well as commercial paper were also purchased in some cases.
Overall, across the six central banks in the survey with asset purchases (right-hand panel of Graph II.3), when translated to USD equivalent, sovereign and quasi-sovereign debt accounts for 73% of total asset purchases since 2008. Agency MBS purchased by the Fed accounted for about 14%, while FX accounted for about 5%. Some central banks in the survey also purchased other private assets such as corporate and covered bonds, asset-backed securities (ABS), as well as exchange-traded funds (ETFs) and real estate investment trusts (REITs). However, purchases of these types of asset accounted for only a small fraction of overall balance sheet growth, although they often represented a substantial share of the respective market.
6 By March 2009, once the most severe market stress had abated and after the Fed had begun to
purchase US Treasuries, the primary aim of agency MBS purchases became the provision of monetary stimulus, as the potential for further conventional measures was exhausted. See the discussion in Board of Governors of the Federal Reserve System, “Monetary policy alternatives”, 17–18 March 2009, www.federalreserve.gov/monetarypolicy/files/FOMC20090318bluebook20090313.pdf.

Large central bank balance sheets and market functioning 8
The composition of asset purchase programmes by asset class1 Graph II.3
Net purchased amounts per year across all programmes Net purchased amount by asset type (percent of total in 2008–18)
USD bn
1 Net purchase amounts in each year are calculated as the change in central bank holdings (or exposure) from one year to the next. The average exchange rate each year is used to convert holdings (or exposures) to USD.
Sources: National submissions to CGFS/MC survey; study group calculations.
2.4 How were the programmes funded? The liabilities side of central banks’ balance sheets
Graph II.4 shows the composition of liabilities for select central banks before the GFC (up to Q2 2007), at the peak of the crisis (defined as Q4 2008), and more recently (Q2 2018). The changes in composition are most notable for the central banks that implemented large purchase programmes for domestic assets (BoE, BoJ, ECB/Eurosystem, Fed and Sveriges Riksbank) or intervened in FX and purchased foreign assets (SNB). For these central banks, the substantial increases in bank reserves reduced currency in circulation as a share of liabilities. Changes in the composition of liabilities show a much less consistent pattern for the AE and EME central banks that did not introduce purchase programmes.
As a result of the large increase in reserves, many AE central banks shifted from corridor systems, in which they managed short-term interest rates by adjusting the quantity of reserves, to floor regimes, in which precise control of the quantity of reserves is no longer needed (in both cases, intended changes of the level of short-term rates are implemented via changes in central bank-administered or market operations rates).7 Those new policy implementation regimes have had implications for the functioning of money markets, as discussed in more detail in Section 4, as well as for the expected size of balance sheets in the long run.
7 One central bank that did not switch its operational framework despite balance sheet expansion is
Sveriges Riksbank. Instead, the Riksbank chose to absorb increases in liquidity via daily fine-tuning operations and the issuance of central bank bills. In Graph II.4, this is evident in the relative share of “reserves” (fine-tuning operations) and “central bank-issued debt” (Riksbank-issued certificates) on the liability side.

Large central bank balance sheets and market functioning 9
Even though they did not implement APPs, the balance sheets of some EME central banks also grew over the period due to FX interventions. As shown in Graph II.4, the growth in EME central bank balance sheets due to purchases of foreign assets was accompanied by an increase in the relative share of central bank-issued debt securities (eg Hong Kong SAR) and reverse repos (eg Brazil), aimed at absorbing the liquidity created by the interventions.
2.5 Overall balance sheet impact of policy measures
The increase in balance sheet size over the past decade was most notable for central banks that conducted large-scale purchases of domestic or foreign assets. Balance sheet size as a share of GDP grew between three and six times their pre-crisis averages
Composition of central bank liabilities over time
In per cent of total assets1 Graph II.4
AE central banks that significantly expanded their balance sheets Other AE central banks
EME central banks
1 Pre-crisis is average level from the starting date of data provided by the reporting central bank through Q2 2007 or through end-2007 for central banks reporting data on an annual basis). Peak crisis is Q4 2008 and current is Q2 2018. Within each group, countries are ranked in the order of expansion in the size of the central bank balance sheet since the crisis.
Sources: National submissions to CGFS/MC survey; study group calculations.

Large central bank balance sheets and market functioning 10
Change in size of central bank balance sheet
Pre-crisis average level to peak level Graph II.5
Per cent of GDP Ratio to currency in circulation
Note: Data label (#.# x) indicates peak as a multiple of the pre-crisis average. Pre-crisis average is calculated from the starting date of data provided by the reporting central bank through Q2 2007 (or Q1 2007 for Singapore). The length of the bar indicates the balance sheet expansion (relative to GDP – left axis and relative to currency in circulations – right axis) from pre-crisis average to peak-level, whereas the dots indicate the current level. Starting dates and peak dates vary across respondents. Within each group, countries are sorted in the order of expansion in the size of the central bank balance sheet since the crisis.
Sources: National submissions to CGFS/MC survey; study group calculations.
for the six AE central banks that engaged in large-scale asset purchases (the red bars in Graph II.5). The balance sheets of those central banks currently remain at or near peak levels relative to GDP, with the notable exception of the Fed, which has already begun balance sheet normalisation. In contrast, for most of the other surveyed central banks that did not conduct APPs (eg BoK, CBB, MAS, RBA, RBI), the size of balance sheets relative to GDP changed only modestly compared with pre-crisis levels.
Balance sheet size can also be evaluated relative to currency in circulation (the blue bars in Graph II.5). By this measure, balance sheet growth is somewhat less pronounced, as growth in currency outpaced that of GDP for several central banks, including the Eurosystem and the Fed.8
3. Financial market functioning
3.1 Conceptual issues
Effectively functioning financial markets fulfil two main interrelated roles:
1. Matching: allows participants with diverse trading interests to be brought together efficiently and cost-effectively, so that they can adjust, share and redistribute financial exposures;
8 The current ratio of assets to currency in circulation for Sweden is markedly higher than that for other
AE central banks, reflecting a widespread shift in Sweden from currency towards alternative payment methods (see eg Bech et al (2018)).

Large central bank balance sheets and market functioning 11
2. Price discovery: incorporates all relevant publicly available information in an appropriate, prompt and reliable manner, in turn generating meaningful price signals that, together with other features of financial markets, allow for an efficient allocation of resources.
A well functioning market is one which reliably performs these two roles: it allows timely, efficient market access to participants who wish to trade, obtain funding or invest, and it creates price signals that reflect fundamentals. To do this, such a market needs to be both liquid and resilient.
Adequate market liquidity allows market participants to trade in a timely manner, in reasonable size, and at a price close to the consensus market price. Liquidity naturally varies over time, and it is never provided in unlimited quantity, even in the largest and most efficient markets. Importantly, to incentivise the provision of liquidity sustainably, liquidity should be priced appropriately relative to the risks borne by the liquidity providers.
Market resilience is essential to a well functioning market and implies that market participants can continue trading during periods of heightened financial stress or economic uncertainty, although potentially at less advantageous prices. A resilient market quickly recovers following internal or external shocks, such as a string of unusually large orders in the same direction or after the release of unexpected economic news. Liquidity and resilience are relevant both for bond and money markets; however, the need for resilience in money markets may be even greater because of the potentially systemic impact of impaired access to funding.
Financial market liquidity and resilience can be affected by various factors. For instance, through a reduced free float, a security might become scarce which in turn may impede liquidity and resilience in the market. The presence or possibility of information asymmetry, perhaps because interaction is concentrated between only a few traders and investors, can have a dampening effect on the provision of liquidity. The level of transparency in the market, including whether trade intentions and realised trades are revealed to all participants, and when, is also relevant. The market ecosystem, including the mix of market participants, trading strategies, and participant concentration, especially that of intermediaries, is also important (eg Barth et al (2002)).
Finally, the functioning of funding markets has some important specific issues beyond those mentioned above. This is the case, notably, because of the possibility of multiple equilibrium situations affecting market access by perfectly solvent debtors.9 Even if, initially, only a small number of debtors face difficulties rolling over debt or obtaining additional funding because of a perceived deterioration of their asset quality, the market may fall into a bad equilibrium in which investors rationally withdraw from providing funding due to self-fulfilling doubts regarding counterparty solvency. In this adverse outcome, a default of solvent debtors due to illiquidity can materialise. Well functioning funding markets are thus characterised by (i) a low rollover risk and the seamless provision of additional funding to solvent debtors and (ii) a high resilience to negative news, resulting in a very small probability of a switch away from a stable funding market equilibrium. Experience has
9 Experience has shown that combinations of fire sale risks (especially for opaque and illiquid assets),
inadequate borrower liquidity and loss absorption buffers, and information asymmetries between borrowers and lenders can create the preconditions for multiple equilibrium situations, under which shocks can trigger funding difficulties and even defaults by otherwise solvent debtors.

Large central bank balance sheets and market functioning 12
shown that robust, stable funding markets require a broad and well informed investor base, and debtors and creditors with sufficient solvency and liquidity buffers to allow them to weather periods of uncertainty. Where those conditions are not met, the potential exists for multiple equilibrium situations adversely affecting market access for otherwise solvent debtors
It is important to note that stable funding markets can be undermined not only by a fall in debtor’s asset values, but also by any deterioration in market liquidity.10 Conversely, properly functioning asset markets depend on funding market liquidity, for instance on the ability to monetise securities through repo. Money market and bond market functioning are thus interdependent.
In sum, how well a financial market functions depends on the complex interaction of many factors, and different bond and money markets have come to rely on a variety of solutions to provide liquidity and resilience. The monetary policy framework and the actions of a central bank in a given market can substantially affect how that market functions, either positively or negatively, as analysed in the remainder of this report.
3.2 Measuring market functioning
The measurement of market functioning is a complex task. The methods used for this purpose vary according to market structure and data availability. At one end of the spectrum, a limited number of securities, particularly on-the-run government bonds, may be traded on centralised electronic trading platforms (eg Markets Committee (2016a)). The platforms may publish intraday price, transaction and even order book data, allowing for market liquidity and resilience to be more easily assessed. But this is more the exception than the rule: in most cases, bond and money markets are organised as decentralised over-the-counter (OTC) markets, and data availability is more limited, making an assessment of market functioning more challenging.11
The most broadly used indicators to assess market functioning are price- and quantity-based indicators (also see Tables D.4 and D.5 in Annex D for a summary of central banks’ usage of such measures):
• Price-based indicators are mainly proxies for transaction costs, eg bid-ask spreads.12 Other price-based indicators include, for instance, indices measuring the dispersion of individual dealers’ quotes around a fair market valuation, or volatility measures, with a higher volatility given a certain set of market conditions viewed as an indication of lower market liquidity.
• Volume-based measures can also take various forms. A first indicator of market conditions is often provided by daily trading volume, with a higher trading
10 See Bindseil (2013) for a theoretical treatment of the interlinkages between asset market liquidity,
the central banks’ collateral framework, and the functioning of funding markets.
11 For the same reasons, a comparison of market functioning metrics across countries/markets is challenging. In a number of markets, data availability has improved in recent years. For instance, trade reporting requirements for corporate bonds have been put in place in many advanced economies.
12 There are various extensions of the classic bid-ask spreads including effective spreads and measures derived from high and low prices (eg Corwin and Schultz (2012)). When actual bid-ask spreads are not available, the widely used Roll (1984) measure estimates the transaction costs from only the distribution of trade prices.

Large central bank balance sheets and market functioning 13
volume, all other things equal, generally viewed as an indication of higher market liquidity.13 Other volume-based measures used to describe liquidity, particularly in bond markets, include average ticket size or trading frequency, ie how often a bond is traded in a specific time frame. If available, measures based on order-book data, such as market depth, can provide additional insights into liquidity and resilience.
If the data are available, calculating price-impact measures using both price and volume data can yield very useful indicators of market liquidity and resilience. These measures estimate the price movement caused by a trade of a certain size, with a more liquid market showing a lower price impact.14 It is important to note, however, that sharp adjustments in asset prices and in the price of liquidity do not necessarily indicate market dysfunction. They can also be indicative of a functioning market if they are reflecting shifts in underlying fundamentals.
Liquidity premia for specific securities can also be gleaned from deviations from a modelled yield curve. These capture the compensation an investor requires for holding a position in a less liquid bond. Liquidity premia are particularly relevant for stressed markets, as well as for less liquid securities, such as off-the-run securities.
It is often easier to directly assess the liquidity of bond markets than that of money markets due to data availability. To gauge conditions in key funding markets, it is also instructive to rely instead on various types of interest rate spread or deviations from law-of-one price relationships. This could include, for instance, the pricing in various segments of the repo market (special collateral vs general collateral, interdealer vs triparty repo) or the deviation from covered interest rate parity measured in FX swap markets. Not only can this highlight imbalances between supply and demand, but the emergence of a “basis” might also contain information about the intermediation capacity of key market participants and constraints to arbitrage activity. Finally, an important indicator used to gauge frictions in collateral markets is the frequency and duration of settlement fails.
The considerations above highlight the importance of not relying on any single indicator to measure market functioning. To properly gauge market functioning, a holistic perspective is important, which takes into account the market ecosystem as a whole. Trying to assess market functioning based on quantitative metrics alone may be insufficient, or might even deliver conflicting messages. This is one additional reason why, even when market data are available, an effective assessment of market functioning should also rely on market intelligence acquired through discussions with market participants (Markets Committee (2016b)).15
13 Note, however, that recent experience suggests that, in highly electronified markets (eg spot FX or
on-the-run US Treasuries), periods of illiquidity and market dysfunction can coincide with abnormally high trading volumes. A reason could be algorithmic “hot potatoes” trading as markets search for a new equilibrium price.
14 If detailed trading data are not available, one can still estimate the price impact using the Amihud (2002) measure, which relates absolute returns to trading volumes.
15 Some central banks have also launched surveys to better gauge market functioning. One example is the Bank of Japan’s bond market survey, www.boj.or.jp/en/paym/bond/index.htm/.

Large central bank balance sheets and market functioning 14
4. Impact of large balance sheets and market functioning
This section explores the stock and flow mechanisms through which central bank balance sheet expansion can impact market functioning, including longer-lasting implications for the market ecosystem. It assesses the extent to which these effects materialised, drawing on a range of studies and empirical indicators.16 The section explores impacts on both bond and money market functioning. It concludes with an assessment of how central bank policies have spilled over to market functioning in other currency areas.
The section finds that central bank balance sheet expansion had both positive and negative effects on market functioning. Positive effects were typically evident during periods of heightened illiquidity and elevated bond risk premia. Negative impacts on bond market functioning tended to be an outgrowth of asset scarcity, which central banks were able to partly mitigate through remedial actions, as discussed in Section 5. Balance sheet expansion also led to declines in the trading of reserves, but had limited impact on volumes in other money market segments or on the ability of central banks to control policy rates.
4.1 Bond markets
In survey responses represented in the left-hand panel of Graph IV.1, a majority of central banks reported that lending and APPs led to unchanged or slightly improved bond market functioning. A few central banks, however, reported either deterioration or significant improvement. This dispersion likely reflects that market functioning tended to improve in bond markets with excessively high risk premia, but to deteriorate when bonds became scarce. The right-hand panel shows that central banks reported balance sheet expansion as a relevant driver of bond market functioning, behind regulatory changes and risk aversion. Of note, changes in regulation may in some cases have interacted with central bank policies to generate or amplify market functioning impacts.
Flow effects
Large central bank balance sheets can impact market functioning through both flow and stock effects. Flow effects arise from the presence of a central bank in the market as a price-taker, and impacts market functioning by influencing the cost and incentives for private participants to trade and make markets. APPs can have a positive impact on market functioning by reducing the cost of transacting through the introduction of a large, solvent, committed and persistent buyer, and by increasing trading volumes. The presence of a “backstop” buyer may reduce the risk premium demanded by market-makers to intermediate trades by lowering search
16 This “stock vs flow” distinction extends the one provided in D’Amico and King (2013), and discussed
further in IMF (2015), Christensen and Gillan (2018) and Han and Seneviratne (2018). “Flow effects” refer to the instantaneous response of bond prices or market liquidity to a central bank’s ongoing purchase operations. “Stock effects” refer to the impact that central bank policies have on bond prices or market liquidity by affecting the total amount of bonds or reserves outstanding in the private sector. When these concepts are applied to market functioning, it is not always straightforward to distinguish between stock and flow effects, since the two can be closely related and can, in some cases, interact. For instance, the flow effect of central bank purchases on liquidity may be greater when the stock of existing holdings is larger.

Large central bank balance sheets and market functioning 15
costs, reducing the time any unwanted (long) inventory positions need to be maintained, and facilitating the execution of large block trades (eg Pasquariello et al (2018)). This could make dealers more willing to hold larger inventories and therefore facilitate additional market-making activity.
Central bank purchases can also increase transaction volumes and market depth by inducing greater dealer competition for order flow, particularly in specific bonds being purchased by the central bank. Investors who sell bonds to the central bank may invest the cash they receive in other assets, thereby stimulating portfolio rebalancing and additional trading activity. Any reduction in yields resulting from asset purchases could also incentivise additional primary market activity.
However, there are also circumstances when central bank activity could reduce the incentives to trade and so impede market functioning. These effects can be pronounced when the pace of asset purchases is high relative to typical trading volumes or new bond issuance. In particular, the entrance of the central bank as a large, price-insensitive unidirectional trader might create flows that the market might struggle to absorb. This may be particularly the case if certain market participants prefer – or are required – to hold government bonds for regulatory or other reasons. Additionally, central bank APPs typically have firm quantity targets, making the programme insensitive to overall price, interest rate levels or liquidity conditions, which in turn can potentially distort price signals. Any resulting uncertainty over the level and sensitivity of prices may reduce participants’ willingness to take positions.17 As further discussed below, the transition to yield curve control by the Bank of Japan can be seen as a way to address this issue.
Drivers of bond market functioning Graph IV.1
How market functioning has been affected by central bank lending and APPs
The main drivers for bond market functioning1
Number of responses 1 (not important) to 5 (very important)
1 Average scores based on the responses by central banks that introduced large scale APPs and/or non-standard lending operations.
Source: National submissions to CGFS/MC survey.
17 That said, as discussed in Section 5, purchase mechanisms tend to be designed to be sensitive to
relative pricing and so avoid aggravating market distortions.

Large central bank balance sheets and market functioning 16
Central bank holdings after public purchase programmes As per cent of eligible universe Graph IV.2
Source: National submissions to CGFS/MC survey.
The central bank’s trading behaviour might also result in a perception of information asymmetry between “insiders”, who are direct counterparties of the central bank, and other market participants. This can discourage participation by outside investors, or raise transaction costs as outsiders price in their perceived disadvantage. Avoidance of information asymmetry issues was a central feature in the design of many central bank purchase programmes (see Section 5). Finally, portfolio rebalancing as a result of risk absorption by the central bank may leave other investors vulnerable to new and less understood risks.
Stock effects
Stock effects are those attributable to the central bank’s accumulated bond portfolio rather than to the regular execution of purchases. These affect market functioning primarily by influencing the amount of risk held by the market and the scarcity of bonds, and by engendering persistent changes to the market ecosystem.
Scarcity
Asset purchases reduce the quantity of bonds held in private hands – the “free float” – as well as the share held by price-elastic or price-sensitive investors. These two trends can generate scarcity effects, particularly when purchases exceed new supply (IMF (2015); Schlepper et al (2018); Pelizzon et al (2017)). This could increase search costs in matching investors and reduce trading volumes (Ferdinandusse et al (2017); Kandrac (2018)). Moreover, a reduction in the quantity of a bond available for trading by private investors might deter market participation, leading to a thinner market and lower liquidity (Bolton and von Thadden (1998)). These developments in bond market liquidity are intimately related to simultaneous developments in repo markets, discussed in more detail in the next section.
Scarcity effects are likely to increase significantly and non-linearly as the proportion of bonds held by the central bank reaches certain thresholds. Graph IV.2 shows the holdings of government bonds as a proportion of total bonds in issue for the euro area, Japan and the United States. It should be noted, however, that the inflection point where the free float becomes problematic from a market functioning perspective depends on the proportion of bonds held by price-inelastic investors such as insurance companies, pension or mutual funds, and is therefore not easily established ex ante and can change over time.

Large central bank balance sheets and market functioning 17
Market ecosystem
If non-standard tools are used for a prolonged period, long-run changes in the bond market ecosystem may occur. These changes are slow to develop but they may be even slower to reverse. Lower trading volumes and price volatility, compressed credit spreads and flatter term structures may reduce the attractiveness of investing and dealing in bond markets. Some players may leave the market altogether, resulting in a more concentrated and homogenous set of investors and fewer dealers. Persistent one-directional flows generated by central bank purchases may also lead to an atrophying of market risk distribution capabilities, if intermediaries rely on central banks rather than client networks to adjust their positions. It is possible that any deterioration in the market ecosystem may not become evident until central banks begin to unwind their asset holdings. In this case, as discussed further in Section 6, this could lead to increased volatility and less effective market functioning during normalisation, as a smaller dealer community and investor base may be less able to absorb flows smoothly.
Empirical evidence
The literature has generally found that central banks’ purchases have had positive flow effects on market functioning, particularly in markets with high liquidity premia, including those experiencing periods of stress, and for less liquid securities, such as private sector assets or off-the-run or lower-rated government securities. In general – as emphasised in the survey responses – central banks were mindful in designing their purchase programmes of the potential for disruption from an unduly fast pace of purchases. In a number of cases, their approaches also involved some form of coordination with debt management offices. Hence, there are relatively few examples of significant negative flow effects.
Sterling investment grade non-bank corporate bonds
In basis points Graph IV.3
Bid-ask spreads1 Asset swap spreads less CDS premia2
The vertical lines indicate 19 January 2009 (announcement of the Asset Purchase Facility) and 25 March 2009 (launch of the Corporate Bond Facility).
1 Median; based on 444 investment-grade bonds issued by non-banks. 2 Median; based on individual corporate bond asset swap spreads less their corresponding CDS premia across the non-bank investment-grade market. The maturity of the bonds may not necessarily match the maturity of the corresponding CDS premia, as data are typically only available for five-year CDS.
Sources: UBS Delta; study group calculations.

Large central bank balance sheets and market functioning 18
Liquidity in euro area government bond markets
Average absolute spline spread in basis points Graph IV.4
Nelson-Siegel splines are fitted daily to core (DE, FR, NL, AT, FI) and peripheral (IT, ES, PT) bond markets, and the monthly average absolute spline spread is calculated for bonds in the seven to 12 year area. Higher numbers imply more arbitrage opportunities and may signify lower market liquidity. Date lines refer to the “taking of committees” statement and the first day of purchases.
Source: MTS, ECB calculations.
The Bank of England’s purchases of sterling corporate bonds, which started in 2009, are one illustration of the positive flow impacts in a market experiencing a period of stress. As shown in the left-hand panel of Graph IV.3, bid-ask spreads on sterling corporate bonds fell sharply following the scheme’s introduction. The right-hand panel shows that the difference between corporate bond spreads and CDS premia – a proxy for the liquidity premium – fell more quickly for bonds eligible for the scheme. Hancock and Passmore (2011) find similar results for the Federal Reserve’s purchases of agency mortgage-backed securities (MBS) during the height of the financial crisis. Using empirical pricing models to decompose MBS yields, they find evidence that the component of the yield considered to be due to market dysfunction fell by about 70 basis points in the first six months after purchases.
Similarly, for the Securities Market Programme (SMP) in the euro area, De Pooter et al (2018) find that between May 2010 and September 2012 the liquidity premium for peripheral sovereign bonds from stressed countries (Portugal, Ireland, Italy and Spain), estimated using the bond-CDS basis, was reduced by the bond purchases. Graph IV.4 below shows a fitting error-based liquidity measure for euro area core (DE, FR, AT, FI, NL) and peripheral (IT, ES, PT) government bond markets. This measure suggests that the spread between periphery and core market liquidity narrowed most ahead of the start of the Public Sector Purchase Programme (PSPP), when expectations of the policy were building amongst market participants.
In contrast, there is some evidence of adverse effects on market functioning when the share of central bank holdings were particularly high. The balance sheet programmes of the BoJ – which holds the largest share of government bonds relative to amounts outstanding – appears to have negatively impacted government bond liquidity metrics, including trading volumes. But it is challenging to isolate the effects of balance sheet programmes from those of other unconventional policies.
Sakiyama and Kobayashi (2018) find that a range of liquidity indicators for the cash Japanese Government Bond (JGB) market, including market depth and bid-ask

Large central bank balance sheets and market functioning 19
spreads for 10-year dealer-to-client transactions, deteriorated in early 2016 (left-hand and centre panels of Graph IV.5). Similar trends are observed for the inter-dealer market and JGB futures market. While the elevated level of the Bank of Japan’s bond holdings may have played a role in the deterioration of liquidity metrics, the introduction of negative interest rates and associated market volatility in January 2016 appeared to be a bigger factor. In fact, many of the liquidity indicators have since returned to more normal levels, despite the continued growth of the BoJ’s balance sheet.18 Aggregate measures can mask differences at the individual bond level: indeed, using security-level data, Han and Seneviratne (2018) find adverse scarcity effects on bid-ask spreads. These effects became more pronounced when the share of holdings exceeded certain thresholds, suggesting non-linearity of stock effects on liquidity.
One indicator that has not improved since 2016 is JGB trading volume, which has remained subdued, reflecting a decline in activity of domestic investors (right-hand panel of Graph IV.5). This has resulted in some days when there are no recorded trades, even in benchmark JGBs. Trading in futures has remained continuous, though. It is unclear if the fall in cash bond turnover is a natural reflection of the lower free float, or an indicator of a more malign deterioration in market functioning.
Liquidity indicators for Japan Graph IV.5
Dealer-to-customer market depth1 Bid-ask spreads2 Monthly transaction volume3
Basis points JPY cents JPY trn
1 Best-worst quote spreads of dealer-to-client transaction in the JGB cash market. Calculated by averaging the spreads between the best and worst quotes offered by dealers against each client request. Transactions with spreads wider than 10 bp are excluded from the calculation. Latest data are as of end-February 2019. 2 Bid-ask spread of dealer-to-client transactions in the 10-year JGB market. Quotations through Trade web as of 3:00 pm. The range indicates the first/third quartile spreads between January 2010 and March 2013. Ten-day backward moving average. Latest data are as of end-February 2019. 3 Gross amount purchased by clients (city banks, regional financial institutions, investors and foreigners). Treasury Discount Bills etc are excluded from the transaction volume. Q1 2019 data are based on January–February.
Sources: Japan Securities Dealers Association; Yensai.com; Refinitiv Eikon.
18 The recent improvement may also partly reflect the subsequent introduction of yield curve control in
September 2016, and the associated reduction in the pace of purchases since then (see Box A).

Large central bank balance sheets and market functioning 20
Box A
Supporting market functioning under Japan’s yield curve control framework
In 2016, the Bank of Japan added a yield curve control (YCC) framework to its quantitative and qualitative easing (QQE) programme, which was otherwise comparable to the large-scale APPs implemented at other central banks. The transition to YCC marks a new evolution in APPs because it made explicit the central bank’s yield impact target, which is only implicit in other APPs. In principle, the Bank of Japan can enforce its yield target through the conduct of fixed price, full allotment auctions, thereby eliminating volatility at the 10-year point of the Japanese government bond curve. However, the BoJ has found that transaction volumes decline at an increasing rate as volatility falls to very low levels. To ensure that private market participants still have an incentive to remain engaged in the market, the Bank of Japan facilitates market volatility by allowing for symmetrical fluctuations around the centre of the distribution (see Section 5).
For German government bonds, there were significant differences in purchases across specific bonds, which led to scarcity effects for some bonds. In its early phase, the PSPP excluded several types of bond: those below one (initially two) and over 30 years of maturity, agency securities, which were eligible but typically too illiquid to purchase, and bonds at yields below the ECB’s deposit facility rate. These exclusions amplified the scarcity effects observed for the remaining bonds. Some market participants viewed the yield-related exclusion as a source of volatility because of the feedback loop between the size of the eligible bond set and the level of yields.
Liquidity conditions in German bunds in the early phase of the PSPP
Market liquidity measures for the bund market; two-sided five-day moving averages Graph IV.6
Relative bid-ask spread1 Order book depth2 Basis points EUR millions
The vertical event lines refer to 9 March 2015 start of PSPP-purchases 3 December 2015, together with the decision to expand the purchase period to at least March 2017, the ECB/Eurosystem included EUR-denominated marketable debt instruments issued by regional and local governments as eligible assets 10 March 2016 expansion of purchases to EUR 80 billion per month starting in April 2016 and announcement of CSPP starting from 8 June 2016.
1 The evolution of the bid ask spread relative to the mid-price since the start of the programme. 2 The order book depth at the best quotes, defined as the sum of volume supplied or asked at the best quotes. 3 Weighted average of the measures for all four maturity buckets (short (0–3.5 years), medium (3.5–7.5 years), long (7.5–12.5 years), and ultra-long-term bonds (>12.5 years)). 4 Accounts for the purchase amount in each bucket and adjusts the average accordingly.
Source: Schlepper et al (2018).

Large central bank balance sheets and market functioning 21
As shown in Schlepper et al (2018), German bund markets witnessed periods of strained liquidity during 2015 and 2016 (Graph IV.6). Although liquidity did initially improve prior to the start of the implementation of asset purchases in Q1 2015, it worsened as scarcity constraints began to appear.19 These developments were closely correlated with the deterioration in metrics of repo market functioning discussed further below. Due to countermeasures taken around the start of 2017 (notably a wider issuer universe, removal of certain purchase restrictions and more accessible securities lending, see Section 5 for details), liquidity improved again in 2017.
In the United States, APPs appeared to have little impact on Treasury market functioning. Even at their peak, Fed holdings were low relative to the overall size of the US Treasury market. Using security-level transaction data, Kandrac and Schlusche (2013) detected no evidence of disruption in US Treasury bid-ask spreads. There was also no obvious trend of deteriorating liquidity according to measures such as market depth and the price impact coefficient (Graph IV.7). In 2008 and early 2009, there was some increase in settlement fails for US Treasuries, which are usually a sign of market dysfunction.20 However, this was primarily related to the low level of interest rates, which made it less costly to fail to deliver a security. The issue was addressed in May 2009 through the introduction of a new settlement fails charge (also see Section 5).
Liquidity indicators for the US Treasury market
21-day moving averages Graph IV.7
Bid-ask spreads Market depth Price impact 32nds USD bn 32nds per USD 100m
1 Liquidity metrics for two-year Treasury note end in November 2018 due to a change in the pricing increment in this security, which limits the comparison with prior data.
Sources: Adrian et al (2017); BrokerTec; Study Group calculations.
19 While the euro area bond market was indeed fairly volatile during the early phase of PSPP, the causal link is
not entirely certain given that the run-up to the programme saw a significant spike in bond supply which may have been insufficiently digested by the market. Such a supply overhang can have procyclical effects (stop-loss selling in rising yield scenarios) that look similar to the implementation of a procyclical purchase programme.
20 Settlement fails reflect market dysfunction as a failure to clear trades, once under way, can be self-fulfilling and inhibit both matching and price discovery.

Large central bank balance sheets and market functioning 22
Cross-sectional analysis is further complicated by differences in the market microstructure (eg different trading protocols or matching mechanisms) employed in different markets, which means that, for instance, bid-offer measures are only available for different subsets of the markets in the US, the euro area and Japan. Many of these effects are difficult to monitor as they relate, for example, to behavioural and staffing decisions at private firms.
4.2 Money markets
In survey responses in the left-hand panel of Graph IV.8, central banks reported that balance sheet expansion tended to negatively impact functioning in the unsecured money market. Views were more mixed for the secured segment, with a majority of central banks reporting either slight improvement or unchanged conditions.
At the same time, most central banks highlighted that many other factors influenced money market functioning in parallel (right-hand panel). Nonetheless, balance sheet expansion operations, together with increased risk aversion and changes in regulation, were amongst the most important factors explaining developments in money market functioning.
Flow and stock effects
For money markets, flow and stock effects were somewhat conflated, in that early in the crisis large amounts of liquidity were injected quickly through large-scale lending programmes. Asset purchases often added additional reserves on a more gradual basis, but typically in a context in which reserves had already become relatively abundant, and central banks had modified their approaches to controlling short-term rates.
Drivers of money market functioning Graph IV.8
How market functioning has been affected by central bank lending and APPs
What the main drivers are for money market functioning1
Number of responses 1 (not important) to 5 (very important)
1 Average scores based on the responses by central banks that introduced large-scale APPs and/or non-standard lending operations.
Source: National submissions to CGFS/MC survey.

Large central bank balance sheets and market functioning 23
US three-month LIBOR-OIS spread during the height of the global financial crisis In basis point Graph IV.9
Source: Bloomberg.
The increased supply of reserves due to crisis-era large-scale lending and purchase programmes helped ease funding conditions, with positive effects on money market functioning and more broadly. During the GFC, uncertainty and risk aversion in money markets spiked, impairing the redistribution of central bank reserves and substantially heightening banks’ demand for reserves. Central banks met this increased demand by introducing new lending programmes, including at longer maturities and/or more favourable terms than previously; by broadening the list of eligible collateral; and/or by conducting asset purchases to revive markets. The provision of central bank liquidity strengthened the confidence of investors and depositors, helping banks’ regain funding access, and also improving functioning in other markets, including by supporting market-making and arbitrage activity.
Over the course of 2007 and 2008, the Fed, like many other central banks, introduced a range of facilities aimed at easing liquidity strains. The Term Auction Facility (TAF) auctioned discount window credit to depository institutions, the Primary Dealer Credit Facility (PDCF) offered funding to primary dealers, and the Commercial Paper Funding Facility (CPFF) provided a liquidity backstop to issuers of commercial paper. These policies helped to improve market conditions, as evidenced by declines in Libor-OIS spreads shortly after the programmes were introduced (Graph IV.9). The FOMC also authorised dollar liquidity swap lines to provide liquidity in US dollars to overseas markets, which prompted a notable narrowing in the FX swap basis (also see Box B, CGFS (2019)).
Some central banks also introduced longer-term funding operations aimed at meeting banks’ demand for term funding. In some cases, these policies targeted specific transmission channels by making the cost or availability of funding conditional on certain types of bank lending (eg the BoE’s “Funding for Lending” scheme or the Eurosystem’s targeted longer-term refinancing operations). When used for a prolonged period of time, these operations can “crowd out” private term funding activity and lead to lasting market ecosystem effects.
While liquidity injections tend to ease funding conditions, the stock effects of large balance sheets on unsecured money market trading volumes tend to be negative. Bank incentives to trade are reduced, although other participants may have greater incentives, the scarcity of collateral intensifies, and persistent effects on the market ecosystem may materialise.
Large central bank balance sheets and market functioning 24
Incentives to trade
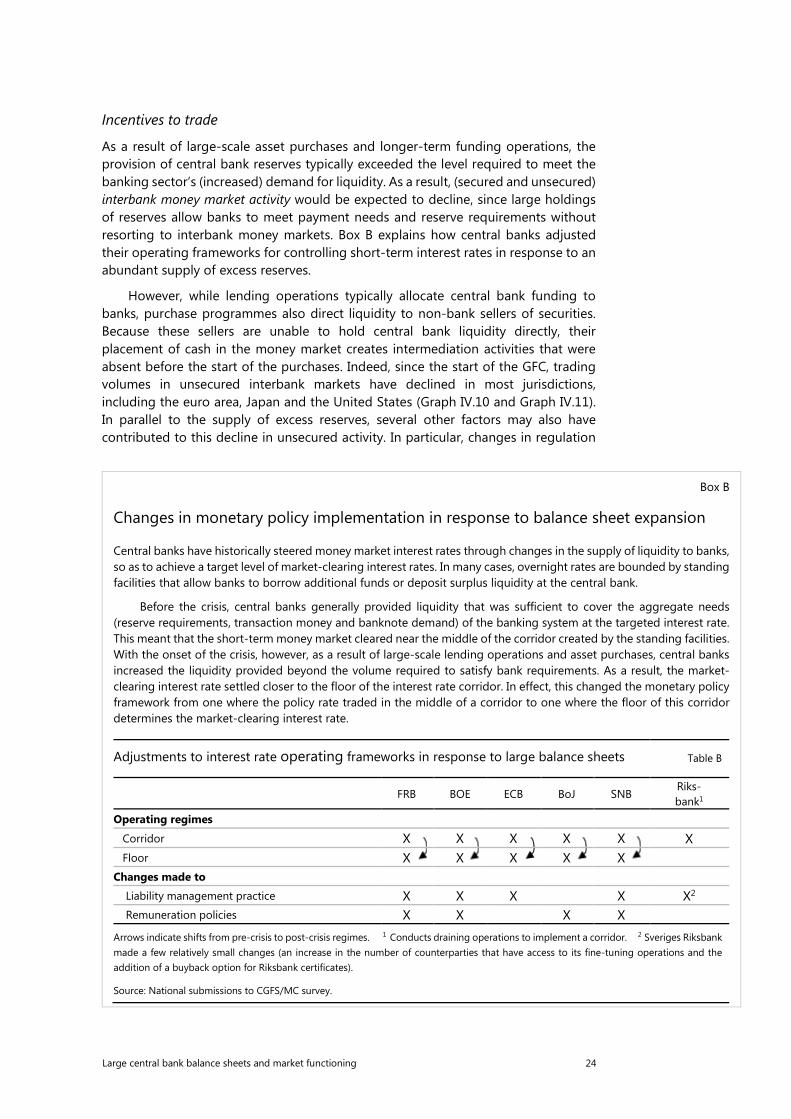
As a result of large-scale asset purchases and longer-term funding operations, the provision of central bank reserves typically exceeded the level required to meet the banking sector’s (increased) demand for liquidity. As a result, (secured and unsecured) interbank money market activity would be expected to decline, since large holdings of reserves allow banks to meet payment needs and reserve requirements without resorting to interbank money markets. Box B explains how central banks adjusted their operating frameworks for controlling short-term interest rates in response to an abundant supply of excess reserves.
However, while lending operations typically allocate central bank funding to banks, purchase programmes also direct liquidity to non-bank sellers of securities. Because these sellers are unable to hold central bank liquidity directly, their placement of cash in the money market creates intermediation activities that were absent before the start of the purchases. Indeed, since the start of the GFC, trading volumes in unsecured interbank markets have declined in most jurisdictions, including the euro area, Japan and the United States (Graph IV.10 and Graph IV.11). In parallel to the supply of excess reserves, several other factors may also have contributed to this decline in unsecured activity. In particular, changes in regulation
Box B
Changes in monetary policy implementation in response to balance sheet expansion
Central banks have historically steered money market interest rates through changes in the supply of liquidity to banks, so as to achieve a target level of market-clearing interest rates. In many cases, overnight rates are bounded by standing facilities that allow banks to borrow additional funds or deposit surplus liquidity at the central bank.
Before the crisis, central banks generally provided liquidity that was sufficient to cover the aggregate needs (reserve requirements, transaction money and banknote demand) of the banking system at the targeted interest rate. This meant that the short-term money market cleared near the middle of the corridor created by the standing facilities. With the onset of the crisis, however, as a result of large-scale lending operations and asset purchases, central banks increased the liquidity provided beyond the volume required to satisfy bank requirements. As a result, the market-clearing interest rate settled closer to the floor of the interest rate corridor. In effect, this changed the monetary policy framework from one where the policy rate traded in the middle of a corridor to one where the floor of this corridor determines the market-clearing interest rate.
Adjustments to interest rate operating frameworks in response to large balance sheets Table B
FRB BOE ECB BoJ SNB Riks- bank1
Operating regimes Corridor X X X X X X Floor X X X X X Changes made to Liability management practice X X X X X2 Remuneration policies X X X X Arrows indicate shifts from pre-crisis to post-crisis regimes. 1 Conducts draining operations to implement a corridor. 2 Sveriges Riksbank made a few relatively small changes (an increase in the number of counterparties that have access to its fine-tuning operations and the addition of a buyback option for Riksbank certificates).
Source: National submissions to CGFS/MC survey.

Large central bank balance sheets and market functioning 25
Excess reserves and unsecured interbank money market volumes Graph IV.10
Federal Reserve Eurosystem Bank of Japan USD bn USD bn EUR bn EUR bn JPY 100 trn
Source: National data.
and increased risk aversion have disincentivised short-term funding and induced a broader shift from unsecured to secured markets.
As in the case of unsecured interbank trading, the increase in excess reserves has led to a reduction of interbank repo transactions backed by General Collateral (GC). The reduced need for short-term funding implied that banks have fewer incentives to conduct this type of repo transaction, which are frequently used for cash management purposes. The right-hand panel of Graph IV.11 shows that the GC segment of euro repo markets saw a pronounced decline in activity as excess liquidity rose, whereas the repo market for specific collateral held up more robustly.21
Relation between money market activity and excess liquidity Graph IV.11
United States Euro area – unsecured markets Euro area – secured markets
Source: National submissions to CGFS/MC survey.
21 As illustrated in the right-hand panel of Graph IV.11 for the euro area, transaction volumes behind
“Repo Funds EU” (blue dots), a repo rate which is predominantly based on non-general collateral, has held up robustly in the environment of excess liquidity. By contrast, GC repo volumes (red dots) have exhibited a similar downward trend as their (unsecured) EONIA volumes (centre panel), as the demand for cash has declined due to the abundant supply of reserve balances. This illustrates that different segments of money markets have not responded to the excess liquidity uniformly.
0
20
40
60
80
100
120
140
0 1000 2000 3000
EFFR
vol
ume
(USD
bn)
Excess reserves (USD bn)
0
10
20
30
40
50
60
70
-500 0 500 1000 1500 2000
EON
IA v
olum
e (E
UR
bn)
Excess reserves (EUR bn)
0
5
10
15
20
25
0
50
100
150
200
250
300
-500 0 500 1000 1500 2000
EUR
bn
EUR
bn
Excess reserves (EUR bn)
Repo Funds EU (lhs) GC Pooling ECB (rhs)

Large central bank balance sheets and market functioning 26
A contraction in interbank activity resulting from an increase in excess reserves does not necessarily pose a major issue for market functioning across other money market segments. As discussed below, activity in other unsecured (non-interbank) segments of short-term wholesale funding markets, such as the market for deposits from non-banks and for short-term paper, has remained more robust. Reduced interbank activity has also not posed a major problem for the implementation of monetary policy, as central banks have still been able to effectively influence short-term market interest rates (see also Potter (2017a)).
Asset purchases may also impact non-interbank money markets, such as short-term paper, wholesale deposit and repo markets. In many jurisdictions, non-bank investors, such as money market mutual funds, non-financial institutions, security dealers and hedge funds, are important participants in money markets. Non-bank investors with excess liquidity that do not have access to central bank facilities (or only on less favourable terms) tend to deposit cash in short-term money markets by lending money to institutions that can deposit cash at the central bank.
By purchasing assets (indirectly) from non-bank investors, APPs generally increase the amount of liquidity held by non-banks investors. In turn, this increases the need for them to place cash with banks in the secured or unsecured market. Consistent with this, volumes in non-interbank money market segments have remained relatively robust, supported to some extent by increased participation of non-bank investors (illustrated for the euro area, Japan and the United Kingdom in Graph IV.12).
At the same time, the provision of excess reserves reduces banks’ incentives for short-term borrowing from non-banks. When the injection of reserves leads to an increase in the size of banks’ balance sheets, constraints that relate to the size of
Money market activity by participant type Graph IV.12
Source of cash lending against General Collateral in Japan1
Source of unsecured borrowing in the euro area2
Source of unsecured borrowing in the United Kingdom2
JPY trn Per cent of total Per cent of total
1 Lending by reporting market participants. 2 Borrowing by reporting institutions from bank and non-bank institutions.
Sources: Bank of Japan; European Central Bank; MMLC Sterling Money Market Survey; Bank of England calculations.

Large central bank balance sheets and market functioning 27
balance sheet such as the leverage ratio regulations will be affected. Box C provides more detail on the impact of regulatory drivers on market functioning. Overall, the shifts in supply and demand in non-interbank money markets are expected to reduce the rate at which banks are willing to remunerate non-bank deposits or repos.
Box C
Regulatory drivers, large central bank balance sheets and market functioning
Understanding the impact of expanding central bank balance sheets on market functioning is complicated by the parallel phase-in of tighter financial sector regulation and reforms, including the adoption of Basel III. The interaction of these two factors has potentially contributed to some market functioning impacts, including the period-end spikes in money market rates and the decline in overnight unsecured lending volumes.
Quarter-end volatility spikes in some money market rates (Graph C) can be attributed to a combination of (i) the impact of the leverage ratio on balance sheet capacity; (ii) the impact of central bank balance sheet expansion on non-bank demand for short-term investments; and (iii) differences in how the leverage ratio is measured across jurisdictions, ie daily averages vs period-end snapshots.
The leverage ratio has reduced dealers’ repo capacity, at least during the period in which banks adjusted their business models to the new regulatory environment. At the same time, APPs contributed to a significant increase in commercial bank deposits held by non-bank wholesale financial institutions, especially since these firms have either no access or less attractive access to central bank liability instruments, such as remunerated deposits or reverse repo. Against this backdrop, additional supply constraints have emerged at period-ends, since dealers that are measured on a snapshot basis are less willing to dedicate repo balance sheets to cash investors. The result of these dynamics, including the pullback of supply, has been quarter- and year-end spikes in money market rates (eg CGFS (2017); BCBS (2019)). Recent quarter-ends have been smoother, which may suggest that rather than regulation as such, it is the change in business models, and the time required to adjust to this change, that may have caused these tensions. It is also possible that the new capital regime has changed the costs of lending overnight in the overnight unsecured market, amplifying the impact of increases in excess liquidity on overnight unsecured volumes (BCBS (2019)).
European repo market developments Graph C
RepoFunds rates1 and excess liquidity in the euro area RONIA rates and reserves in the United Kingdom Per cent EUR bn Per cent GBP bn
1 RepoFunds rates are based on effective O/N, T/N, S/N transactions against respective sovereign collateral on the BrokerTec and MTS platforms (predominantly non-GC collateral).
Sources: Bank of England; Bloomberg.
The leverage ratio and Liquidity Coverage Ratio are perhaps the most important regulations impacting market dynamics and functioning; other examples include the Net Stable Funding Ratio, the G-SIB surcharge, and in the United States, money market mutual fund reform.

Large central bank balance sheets and market functioning 28
In some jurisdictions asset purchases have amplified the effect of balance sheet constraints, especially at quarter- and year-ends. This has generally resulted in a decline in non-interbank unsecured and repo rates to well below the reserve remuneration rate, with significant downwards spikes at quarter- and year-ends (see also Graph IV.C). Moreover, in certain jurisdictions, restrictions on the quantity in which investors were able to access repo markets have been reported, with banks unwilling to accept additional cash regardless of the price (CGFS (2018)).
While increased repo specialness can be a policy-consistent flow effect of APPs (D’Amico (2018)), extreme degrees of specialness can result in market malfunctions by distorting price signals (Cœuré (2017)). Central banks therefore closely monitor developments in repo markets (CGFS (2018)). The scarcity effect in repo markets is particularly pronounced when the holdings of the central bank as a percentage of outstanding volumes reach elevated levels. Similar to bond market scarcity, scarcity effects in repo markets can to some extent be mitigated through central banks’ securities lending programmes (see Section 5).
Several studies demonstrate that central bank asset purchases have been associated with collateral scarcity effects. Brand et al (2019) show that the Eurosystem’s APP accelerated the shift from cash- to securities driven transactions in the euro repo market. Moreover, both Corradin and Maddaloni (2017) and Arrata et al (2017) provide evidence that the Eurosystem’s asset purchases have increased specialness. D’Amico et al (2018) find evidence of a scarcity premium in US SC repo markets. Finally, BoJ analysis shows that an increase in the share of BoJ’s JGB holdings has contributed to a widening of the GC-SC spread (see Section 5 for further details).
The German bund market provides perhaps the clearest example of when bond scarcity amplified by asset purchases has impacted repo market functioning. The share of special trades in the German repo market increased from around 5% before the introduction of the PSPP to more than 50% in the second half of 2016 (left-hand panel of Graph IV.13). Moreover, the GC-SC spread increased substantially
Indicators of European bond specialness Graph IV.13
European specialness spreads1 Share of special volume for Germany2 Basis point Per cent
1 The specialness is defined as the difference between the general collateral rate and the special rate. 2 10-day moving average.
Sources: BrokerTec; MTS repo.

Large central bank balance sheets and market functioning 29
(right-hand panel of Graph IV.13). When the Securities Lending Programme was made more accessible in late 2016, the proportion of German bonds trading special decreased again, to less than 5% in the second half of 2018 (see Section 5).
Market ecosystem
Reduced money market activity could impact the market ecosystem, especially if it persists for a prolonged period of time. For instance, the market infrastructure and knowledge required for markets to operate may be depleted. This could be in the form of fewer market-makers, lack of investment in IT and other infrastructures, or reduced staff expertise/experience. In some jurisdictions the number of active operators has declined significantly. For example, data from the Italian eMID platform indicate that the number of active operators in the unsecured money market declined from more than 100 pre-GFC, to fewer than 20 in 2018.
This sort of hysteresis could result in market malfunctioning when large central bank balance sheets are eventually unwound. For instance, it could make it more difficult for reserves to be redistributed effectively between market participants. Moreover, a smaller dealer community and investor base could make it more difficult for banks to regain access to short-term money markets. However, the extent and persistence of such effects is difficult to predict. Moreover, these effects could be eased if central banks unwind their policies in a gradual and predictable manner, giving market participants longer to adjust in response.22
4.3 International spillovers
Spillovers in international bond markets
Large-scale domestic asset purchases, especially those by central banks in major currency areas, can create spillovers to international bond markets, operating via a search for yield by global investors. The ensuing capital flows can give rise to two types of spillover that can be distinguished conceptually: (i) price (or volatility) spillovers, and (ii) market functioning spillovers. While there is considerable evidence of price and volatility spillovers, generally akin to those seen with traditional monetary policy tools, there is little evidence of persistent and broad-based market functioning spillovers associated with large balance sheets.
Bond markets in EMEs might be particularly vulnerable to spillovers. Since the advent of quantitative easing in advanced economies, foreign participation in EME sovereign bond markets has substantially increased as the asset class attracted greater interest by global investors (Graph IV.14 left-hand panel). One implication of the search for yield behaviour by global investors is price spillovers through co-movement of term premia between AE and EME bonds (Adrian et al (2013)).23
While price spillovers in the bond markets of the recipient countries are well established, (eg Curcuru et al (2018); Kearns et al (2018)), the impact of capital flows on market functioning has received less attention in the literature. Conceptually, buying pressure by foreign investors might even be conducive to liquidity conditions
22 Changes in the operational procedures of the central bank (eg a shift from a corridor to a floor
system) may also diminish the impact of hysteresis effects.
23 See Committee on the Global Financial System (2019) for further discussion on international price spillovers.

Large central bank balance sheets and market functioning 30
in EMEs and improve overall market functioning, as long as it is met with matching supply in EME bonds. Indeed, between the start of QE policies in advanced economies and the “taper tantrum” in 2013, liquidity conditions in local currency EM government bond yields remained rather benign. Indicative of orderly market functioning, volatility in EM bond markets remained subdued and even dropped to a level similar to that of AE bonds (Graph IV.14, right-hand panel).
Adverse effects on market functioning can arise if central bank policies in advanced economies lead investors to engage in crowded positioning (especially by investors with little previous experience in the asset class). Crowding may impair market functioning through an increased likelihood of fire sales if investors all rush to the exit at the same time. The taper tantrum in 2013 (Feroli et al (2014)), when EME bonds were subject to synchronised selling pressure, serves as a prominent example. One-sidedness impaired the matching function of markets, leading to outsized increases in bond volatilities in EMEs. The evidence to date suggests, however, that such market functioning spillovers were neither persistent nor broad-based, but were specific short-lived episodes.
Spillovers in international money markets
In the aftermath of the GFC, a significant and sustained “cross-currency basis” has emerged in international money market, suggesting that the cost to obtain dollar funding or hedge FX risks through the FX swap market has often been significantly higher than that through other channels. Especially over the period from mid-2014 onwards, the expansion of central bank balance sheets outside the United States, combined with the introduction of negative rates, resulted in a divergence of balance
International bond market spillovers Graph IV.14
Cumulative net flows into EME bond mutual funds
Term premium on 10-year bonds in the US and small open economies
Volatility of 10-year local currency government bond yields3
Percentage of GDP USD bn Per cent Percentage points
The solid vertical line indicates the date of the taper tantrum. 1 Weighted average of AU, CA, CH, DK, EA, GB, JP, NO, SE and US based on GDP and PPP exchange rates. 2 Small open economies comprise AU, CA, CL, CZ, HK, HU, ID, IL, KR, MY, NZ, NO, PH, PL, SG, ZA, SE and TR. Calculations were based on the Adrian et al (2013) model. 3 Simple cross-jurisdiction average of rolling 20-day standard deviation of daily changes in bond yields. The shaded area represents the period between LSAP1 and taper tantrum.
Sources: Kolasa and Wesolowski (2018); Federal Reserve Bank of New York; Bloomberg; EPFR; national data; BIS calculations.

Large central bank balance sheets and market functioning 31
sheet policies across major central banks. This in turn has encouraged non-US investors to increase demand for US dollar-denominated securities, lifting their funding and hedging needs for US dollars. The persistent widening in the cross-currency basis since mid-2014 reflects that the rising demand through this channel has only been partially matched by a simultaneous increase in supply (which faced constraints eg due to US money market mutual fund reform as well as regulatory factors). Imbalances are more pronounced around key regulatory reporting dates such as quarter-ends and especially year-ends. Despite the increased volatility in the costs of obtaining US dollar funding, market access for banks has reportedly not been an issue.
Dislocations in international money markets and large balance sheets
Money markets in different currency areas are connected via the FX swap market, as market participants routinely rely on FX swaps to manage their liquidity needs in different currencies, hedge exposures and make arbitrage profits. Market participants seek to take advantage of differences in funding conditions and investment opportunities in different currencies. This gives rise to the basic “law of one price” condition in international money markets and the no-arbitrage condition known as covered interest parity (CIP) that largely prevailed pre-GFC. According to the law-of-one-price condition, borrowing costs in similar funding vehicles should be equal across currencies: the direct borrowing costs in currency A should be the same as the implied funding costs of raising currency A via FX swaps. The latter costs are given by the price of raising funds in currency A and converting them into currency B while hedging the currency risk.
Commonly used measures indicate that the law-of-one-price condition in international money markets has been persistently violated post-crisis (see Graph IV.15 depicting the three-month cross-currency basis for OIS rates, defined here as the difference between the FX-swap implied three -month USD rate and the direct three-month USD rate). This indicates that raising US dollars via FX swaps has thus been significantly more costly than by tapping US money markets directly.24
Pricing dislocations during the heights of the GFC and the European sovereign debt crisis – periods which saw the breakdown of “no arbitrage relationships” across many asset classes – may not be surprising. In such episodes, factors such as increased counterparty risks, lack of market access, and the higher value of holding on to liquidity, can lead to a widening of the basis. However, Du et al (2018) among others document that the basis has also been quite large during the much calmer period from mid-2014 onwards. Various explanations have been put forth in the recent literature to explain the phenomenon, including dealers’ balance sheet costs, funding cost heterogeneity in US dollar markets and various other limits to arbitrage.
24 The US dollar has a special role in the global financial system as the world’s primary invoicing,
funding, investment and settlement currency (see eg Gopinath and Stein (2018); Eren and Malamud (2018)). The US dollar money market is by far the largest and most vibrant in the world and globally oriented non-US banks tap this market as the access to deposit funding in USD might be limited (due to lack of local presence and for tax purposes, for instance). However, these global banks have ample access to deposit funding (and potentially central bank funding) in their home currency. Their enduring demand for USD in the forms of customer demand and USD assets can be funded by either directly raising US dollars or swapping local currency funding into USD. When money market funding becomes difficult to obtain, global banks resort to the FX swap market to fill the gap.

Large central bank balance sheets and market functioning 32
Three-month cross-currency basis for OIS rates1 In basis points Graph IV.15
1 Difference between FX swap implied USD rate (foreign currency OIS rate swapped into US dollars) and USD OIS rate.
Sources: Bloomberg; Thomson Reuters; BIS calculations.
At the same time, the recent literature generally agrees that divergent policy stances, reflecting both central bank balance sheet policies and policy rates, have been a major driver of the demand pressure for US dollars in FX swaps and hence of the cross-currency basis. Borio et al (2016) emphasise the search for yield by investors located in QE currency areas such as Japan, where the central bank has continued with QE policies at a time when the balance sheet of the Federal Reserve was no longer expanding. This in turn has given rise to greater demand to invest in US dollar assets on a hedged basis. Du et al (2018) provide evidence that the cross-currency basis responds to monetary policy announcements. Rime et al (2018) show that term funding liquidity premia evolve differently across currency areas as balance sheet policies of major central banks diverge.25 While funding liquidity premia have been compressed, eg for the euro and the yen on the back of continued central bank easing, they have remained more elevated for the US dollar, especially after the end of QE.
Implications for market functioning
Divergence in balance sheet policies could give rise to greater scope for imbalances in the FX swap market to obtain US dollars for funding or hedging purposes and may result in predictable patterns regarding who is on each side of the market (see eg Aldasoro et al (2018) for related evidence from the US dollar repo market). One-sided demand, coupled with constraints to intermediation capacity, can drive a persistent cross-currency basis, which becomes even more relevant at regulatory reporting dates (such as quarter- or year-ends), as depicted in Graph IV.16. Overall, this may reduce the robustness of the market for USD funding and hedging for certain types of market participant. While it is seen by some as a degree of market fragility and inefficiency, others place more emphasis on liquidity and other types of risk now
25 Kohler and Müller (2019) arrive at a similar conclusion by showing that CIP holds more firmly for cross-
currency repos (CCY) than for standard (almost credit-risk free) reference rates. Cross-currency repo rates allow an FX swap to be fully replicated because the CCY repo investor can use the same collateral received in a lending transaction to borrow funds in another currency on a truly riskless basis. Due to this feature, CCY repo rate differentials (unlike other commonly used money market rates) take account of relative funding liquidity premia across currencies.

Large central bank balance sheets and market functioning 33
being priced (unlike the situation pre-crisis). Given the higher costs and reduced appetite for arbitrage trades, the new normal may hence feature wider arbitrage bands in international money markets, relative to pre-crisis norms.
The jury is hence still out on whether developments in the cross-currency basis reflect true market dysfunctions. Alternatively, the “basis” may simply be a new barometer for dollar funding conditions in the post-crisis era (Debelle (2018)). In the absence of quantitative US dollar funding shortages that might lead to asset fire sales, market developments in recent years suggest that these deviations have had limited repercussions from a financial stability viewpoint. Moreover, provision of US dollar liquidity governed via central bank swap line agreements serves as an effective backstop should true market dysfunctions arise.
One-week cross-currency basis for LIBOR rates1
In basis points Graph IV.16
EUR/USD JPY/USD CHF/USD
Note: The vertical lines depict key policy announcements in the three currency areas that led to a significant expansion of the central bank balance sheet. ECB/Eurosystem’s PSPP (22 January 2015); BoJ’s QQE (4 April 2013); SNB’s CHF/EUR floor regime (6 September 2011).
1 Difference between FX swap-implied USD rate (foreign currency LIBOR rate swapped into US dollars) and USD LIBOR rate.
Sources: Bloomberg; Thomson Reuters; BIS calculations.
5. Central bank measures and tools to mitigate side effects of large balance sheets
The side effects of large central bank balance sheets on market functioning have taken various forms (as described in Section 4), and the mitigation strategies adopted by central banks show a corresponding diversity. In some instances, mitigation measures were already in place, most often because they were features of pre-existing facilities or programmes. In other instances, mitigation measures were initiated when central banks became aware of potential areas of concern.26
26 This section draws heavily on a survey of member central banks conducted jointly by the CGFS and the MC
study groups.

Large central bank balance sheets and market functioning 34
Mitigation measures have usually been (i) incorporated into the design of the balance sheet expansion programmes themselves; (ii) instituted as separate facilities or programmes designed to alleviate scarcity issues; or (iii) evolved as a by-product of liability management strategies. The choices made in each of these areas interact with each other in the search for workable configurations. Central banks have chosen different types of configuration, reflecting differences such as starting conditions and the characteristics of local asset markets.
5.1 Programme design
Programmes can be designed and parameters calibrated to mitigate the possible adverse effects of their implementation on market functioning. These arrangements can be principles-based, as in the case of the ECB’s market neutrality doctrine, or constructed on a bespoke, market-specific basis.27 Mitigation measures that are incorporated into programmes can be categorised into (i) purchase protocols; (ii) programme transparency; and (iii) implementation flexibility.
Purchase protocols
Purchase protocols can address market dysfunction that arises specifically from flow effects by reducing uncertainty around the method, size and timing of purchases. For example, central banks used existing auctions or bilateral trading arrangements in the initial stages of their programmes, rather than introducing new ones, to ensure that market participants did not have to deal with new operational arrangements while facing a new monetary policy programme. This also reduced the risk of systems failures that could have overshadowed the start of asset purchases.28 Central banks also calibrated purchase volumes to the size and turnover of markets, and ensured that counterparties were able to accommodate flows by expanding their list of eligible counterparties where needed. Purchase protocols were also used to temporarily exclude securities in high demand, such as those that are recently issued, or trading special or cheapest-to-deliver. In some cases, they were constructed to align purchasing arrangements to specific market features, such as in the case of the Fed’s agency MBS purchases, where purchase targets were matched to expected origination patterns.
To address scarcity issues, purchase protocols typically aimed to limit the share of a market that the central bank accumulated. This was to avoid market dominance and facilitate the continuation of price formation between private actors.29 This was usually achieved by placing caps on central bank holdings of individual securities. Such
27 The market neutrality concept is broader than the construction of a market-neutral portfolio – each asset is
held in equal proportion to its outstanding amount – which would be unrealistic in policy programmes with finite duration. Given that not every asset is equally accessible, such portfolios are rarely achievable in practice. Another issue about market neutrality is that, strictly speaking, central bank balance sheet expansion is not market-neutral as it is designed to lower longer-dated rates and term premia, making financial conditions more accommodative than they otherwise would be. Therefore, the objective of market neutrality may be considered as preserving market functioning outside the area of direct policy targets (amount of purchased assets and/or specific policy rates).
28 There are also cases where central banks initially outsourced purchase operations to private portfolio managers when purchasing a class of assets for the first time (and subsequently brought execution in house once acquainted with the new asset class).
29 Such private sector price formation is informative to the central bank as it provides information about the expectations of these private actors.

Large central bank balance sheets and market functioning 35
limits were typically set quite high: for example, limits for the Fed and BoE were set at 70%, and the BoJ has no formal limit.30 On the other hand, in the case of the euro area PSPP, limits were set at 25% or 33%, also in order to ensure that the central bank did not have a deciding vote in the event of a debt restructuring (Table V.1).31
The question of the appropriate level for issue and issuer limits, and which assets to include or exclude, is specific to the market and the goals of the programme in question. The calibration of limits needs to weigh the impact of the limit on market functioning against the need to ensure sufficient capacity to implement the monetary policy goal, maintain flexibility around programme implementation and minimise information transmission to market participants (see below).
Lending programme protocols
The design of lending programmes can also reduce undesired impacts on market functioning. Cliff effects – which involve a contraction in lending or a tightening in financial conditions that occurs when a significant volume of concessional lending by central banks falls due – can be avoided by spacing out the maturities of such funding.
Transparency
Programmes that are designed and implemented transparently result in (i) greater certainty for market participants around the central bank’s “purchase reaction function”, and (ii) reduced information asymmetries (whether real or
Asset purchase programme issue – specific limits
Issue limit (%) Table V.1
ECB Bank of England
PSPP 25-33 Gilts 70
CSPP 70 Corporate bonds Not disclosed
CBPP3 70
ABSPP 70
Federal Reserve Bank of Japan
LSAP 1 701 JGBs No formal limit
LSAP 2 701 CP 252
LSAP 3 701 Corporate bonds 252
MBS No formal limit 1 This upper limit can be reached only gradually. The Fed’s Treasury holdings of an individual security were allowed to rise above the 35% threshold in modest increments at each auction with a maximum of 70%. 2 The outstanding amount of a single issuer’s CP and corporate bonds purchased by the BoJ shall not exceed JPY 100 billion per class of instrument. In addition, if the outstanding amount of a single issuer’s CP or corporate bonds purchased by the Bank at the time of purchase exceeds 25% of the total amount of CP or corporate bonds issued by the particular issuer, in principle, three business days prior to the auction, such CP and corporate bonds shall be excluded from the list of CP and corporate bonds to be purchased.
30 Although, the BoJ has no formal limit, issues to be purchased under JGB purchase operations are
selected with an eye towards avoiding excessive distortion of the supply-demand balance for any single issue. In addition, overall market conditions are taken into account.
31 The Eurosystem’s PSPP also imposed issuer limits, on top of issue limits, as PSPP holdings interacted with those established through earlier, unrelated purchase programmes and investment portfolios.

Large central bank balance sheets and market functioning 36
perceived) between market participants, which limits the accrual of information rents to so-called insiders. Reducing uncertainty and information asymmetry can limit the impact of the programme on market liquidity and volatility, and reduce the risk that the central bank pays inefficient prices in its operations.
In some specific circumstances, transparency can, however, contribute to market dysfunction; for example, transparency can sometimes fragment an asset market or allow sophisticated participants to corner or manipulate a market, particularly in smaller and/or less liquid markets. Under such circumstances, central banks limited transparency in a targeted way to prevent such negative effects.
Minimising uncertainty
To minimise uncertainty, programmes ideally need to be designed and implemented in a simple and transparent way, and be communicated appropriately through methods that make the information broadly available, simultaneously to all (as for any monetary policy decision). Table V.2 presents an overview of programme transparency of APPs in different currency areas.
Such transparency has ex ante and ex post dimensions. Ex ante transparency includes publishing details such as operational calendars, security types, maturities and purchase amounts in advance. For programmes where auctions were the primary method of purchase, such ex ante transparency was relatively high. In contrast, central
Programme transparency in asset purchase programmes Table V.2
Proportion (%) of public programmes
US ECB JP GB SE MX
Ex ante
Operational calendars published in advance? Always Partially Partially Always Always Always
Is any other information provided in advance? Partially Partially Always Always Always Always
Ex post
Are operational results published? Always Partially Always Always Always Always
Are central bank holdings published? Always Partially Always Always Always Always
Proportion (%) of private programmes
US ECB JP GB
Ex ante
Operational calendars published in advance? Partially Never Partially Always
Is any other information provided in advance? Partially Partially Always Always
Ex post
Are operational results published? Always Partially Always Partially
Are central bank holdings published? Always Partially Always Partially
Note: Tables show the percentage of central bank programmes that had the specific transparency feature (eg for all US public APPs, operational calendars were published in advance). Reinvestment and FX programmes are excluded from calculations.
Source: National submissions to CGFS/MC survey.

Large central bank balance sheets and market functioning 37
banks that primarily conducted purchases bilaterally or through syndication generally provided much less information before transacting. This reduces the likelihood that market participants will front-run central bank purchases. It also increases central bank flexibility, as the central bank was able to alter purchase plans at short notice without unwanted signalling to the market.
Ex post transparency at the transaction level typically centres around the auction results, such as the publication of the total amount of offers received, offers accepted and pricing details. Ex post transparency also relates to disclosures around the central bank’s security holdings. The Fed, BoJ and BoE provided significant details about their government bond portfolio, publishing holding amounts on a single security level as frequently as daily. Sometimes, such transparency was mandated by lawmakers; in the United States, the Dodd-Frank Act requires that detailed data on individual transactions must be published with a two-year lag. On the other hand, the Eurosystem only publishes a list of the securities it holds, while holdings are only disclosed at more aggregate levels. This also reflects the Eurosystem’s relatively low purchase limits, which, combined with relatively high purchase targets, imply that transparency about securities holdings could allow participants to infer future purchases, particularly when such limits are close to binding. Therefore, full transparency could lead to market fragmentation and the risk of market players engaging in market-moving positions.
Minimising information asymmetry
Market participants that transact directly with the central bank will often attempt to infer information content in central bank disclosures (whether such information exists or not). Programme designs have thus sought to minimise information leakage to counterparties (or the perceptions that such leakages exist) by acting in a transparent manner, and ensuring that no private information is passed to counterparties via their interaction with the central bank. Market participants that transact directly with the central bank will often attempt to infer information content in central bank disclosures (whether such information exists or not). Programme designs have thus sought to minimise information leakage to counterparties (or the perceptions that such leakages exist) by acting transparently, and ensuring that no private information is passed to counterparties via their interaction with the central bank. Some central banks have also mitigated such concerns by expanding their list of counterparties (which also addresses concerns about the ability of the existing counterparties to deliver the volumes required from a monetary policy perspective).
Flexibility of implementation
In the context of this report, flexibility of implementation refers to adjustments made to purchase operations to reduce negative market functioning effects (as discussed in Section 4), without altering the policy stance expressed by the programme.
Flexibility typically involves varying the pace, timing or volume of purchases in response to changes in prevailing market conditions. Where auctions are the primary method of purchasing securities, this can involve adjusting the selection of securities to be auctioned, or the timing of operations. Where bilateral purchases are used, the timing, amount and selection of securities can be adjusted more readily. In the case of both auctions or bilateral purchases, purchases can be delayed if they are not desirable at prevailing market prices due to, for example, market volatility from an unexpected shock. Purchase volumes can also be adjusted for seasonal fluctuations

Large central bank balance sheets and market functioning 38
in market liquidity. See Box D for an example of a central bank responding to market developments.
Flexibility needs to be carefully calibrated and communicated so as not to send unintended signals regarding the stance of monetary policy expressed through the programme. Exercising operational discretion over time can lead to drift between programme targets and actual portfolios, reducing future flexibility and generating informational content as limits become binding at a later stage in the programme. Excessive flexibility can also damage market confidence in the commitment of the central bank to its stated monetary policy objectives.32 To avoid this, market participants should have an approximate ex ante understanding of the central bank’s operational reaction function so that the exercise of flexibility is not perceived as a monetary policy signal.
Careful ex ante programme design can reduce the need for operational discretion. For example, in the United States, pre-trade transparency of operational timing and targets was communicated as part of a plan based upon careful calibration of the market’s capacity to absorb purchase operations. At the same time, these were adjusted on an exceptional basis if conditions changed.
Flexibility can also be incorporated into the design of the programme itself. For example, in the case of Japan and its framework of yield curve control (YCC), the BoJ allows yields to fluctuate around its YCC target level (see Section 4, Box A). This restores some level of market volatility, creating an incentive for private market participants to remain engaged in the market.
Box D
Flexibility around settlement with the central bank
In 2010 the Federal Reserve conducted a “coupon swap” operation when a sudden decline in the supply of 5.5% MBS it had purchased impeded timely settlement. The standard practice when easing MBS market settlement pressure is to engage in “dollar rolls”, which delay settlement with the expectation that imbalances in the supply of purchased securities will ease over time. In this case, the approach did not work because, shortly after the central bank contracted to purchase 5.5% MBS, new origination declined sharply as mortgage borrowers locked in more favourable mortgage rates. Instead, the Federal Reserve conducted its first MBS “coupon swap” operation, where it sold 5.5% MBS and purchased 4.5% MBS.
The “coupon swap” operation successfully remedied the market imbalance by eliminating demand to deliver the 5.5% MBS securities to the central bank while still meeting its monetary policy mandate by purchasing the targeted amount of 4.5% MBS. This case shows a central bank’s flexible response to unexpected shifts in market conditions may be an important remedy for market congestion due to large-scale purchases.
In addition, the central bank adapted future MBS purchase operations. The initial purchase strategy targeted purchases of MBS in line with the outstanding stock of MBS, guided by commonly referenced market indices. The approach was adjusted when LSAP1 was increased in size in March 2009 to take into account supply and demand conditions. In 2011, purchases were eventually adjusted to target new-production TBA securities, which tend to be the most liquid and readily available for purchase.
Federal Reserve Bank of New York (2010).
32 For instance, if a central bank chooses to allocate an auction at the full target size even when some
of the accepted prices are significantly above prevailing market levels, it sends a signal that the volume target dominates market interest rate concerns. Cutting the auction size instead so that only reasonable offers are accepted may conversely signal that the interest rate channel dominates.

Large central bank balance sheets and market functioning 39
5.2 Securities lending programmes
Securities lending programmes (SLPs) are a potent and flexible mitigation tool that can be deployed to alleviate scarcity issues for specific securities or across whole markets. SLPs can also ease shortages and support the functioning of related repo markets, which in turn can reduce settlement fails and facilitate the functioning of the cash market and other related markets (such as derivatives markets). Box E discusses the importance of securities lending facilities in alleviating scarcity issues in German bunds and JGBs. Table V.3 presents an overview of SLPs in different jurisdictions and their key properties.
SLPs also capture incremental income for the central bank and are thus both profitable for the central bank and supportive of market functioning (and thus welfare-enhancing). SLPs were in place in a number of jurisdictions before the financial crisis, but were significantly expanded during and after 2008. Of the 10 central banks surveyed that conducted APPs, six added facilities during or after 2008.
The design and specifications of SLPs varied across jurisdictions (Table V.3). Some used an auction framework for pricing and allocating securities, while others adopted a bilateral approach. Some were designed to provide emergency funding, but most were designed to alleviate scarcity of specific securities. Borrowing periods ranged from overnight up to six months. Eligible collateral was generally a mix of government
A summary of securities lending programmes Table V.3
AU CA CH Euro area GB JP MX US
ECB BE DE ES FR IT NL Conduct of UMP
× × √ √ √ √ √ √ √ √ √ √ √ √
Total no of programmes
2 1 2 2 4 3 2 2 5 1 1 1 1 3
No of programmes introduced in 2008 or later
0 0 0 2 4 3 2 2 5 1 1 0 1 2
Purchase method for in-house execution1
B/L AUCT B/L … B/L B/L B/L AUCT & B/L
B/L B/L B/L(a) AUC
T B/L
AUCT
Tenor range of programmes (no of days)2
Open O/N O/N ~180
O/N ~90
O/N ~30
O/N ~30
O/N ~90
O/N ~60
O/N 7
7 ~90
O/N~ 1-week
O/N3 O/N ~60
O/N ~28
Occurrence of programme limits
√ √ √ √ √ √ √ √ √ √ √ √ √ √
1 AUCT=Auction; B/L=Bilateral. 2 Range across programmes. 3 As a practical rule, the counterparty will be permitted to request an auction of the same issue for the next several days (up to 50 business days for JGBs and five business days for T-Bills); (a) The UK Debt Management Office (DMO) approaches the Bank daily. The Bank lends to the DMO, which then on-lends to the market through normal repo operations. Source: National submissions to CGFS/MC survey.

Large central bank balance sheets and market functioning 40
securities and/or cash. Cash collateral, unlike securities collateral, has the effect of offsetting the liquidity effect of securities purchases, but limits frameworks ensured that the liquidity drainage was minimal.33
33 For example, to limit the liquidity-draining impact of cash collateral, the ECB applied a cap of
EUR 50 billion (later raised to EUR 75 billion).
Box E
Asset scarcity in the bund and JGB market and the role of securities lending programmes
Since 2016, “specialness” in the euro area and the Japanese repo markets has increased, fuelling market functioning concerns. One driver of this specialness is the reduced free float of available bonds due to the Eurosystem’s and the BoJ’s large-scale APPs.
The bund market has been particularly affected by these scarcity effects because of its small net issuance, relatively small amounts outstanding and its benchmark status as a risk-free security (AAA-rated) in the euro area (see Section 4). To mitigate this scarcity effect, the Eurosystem made bonds available for lending in 2015, and the Bundesbank introduced a bilateral securities lending facility in September 2016. Since December 2016, the Eurosystem central banks have also accepted cash as collateral for securities lending. Cash collateral has become the preferred option among Bundesbank counterparties (Graph E1, left-hand panel). This is because the Bundesbank only accepts scarce AAA-rated bonds as collateral, whereas cash (in the form of excess reserves) is relatively abundant.
Internal Bundesbank analysis has identified a positive relationship between specialness and demand for securities lending. A decline in the repo rate of 1 bp leads to an increase in demand for securities lending of the corresponding bund on average by EUR 85–90 million. A separate study by Jank and Moench (2018) finds both immediate and persistent effects (up to 25 days into the future) of PSPP purchases on repo market specialness, and evidence that the scarcity effect is larger for bonds where large amounts are held by inelastic investors such as insurance companies, pension funds and mutual funds.
Evolution of the Bundesbank’s bilateral lending activities Graph E1
Demand for the Bundesbank’s bilateral lending facility Concentration of bilateral lending activities across bunds Amount lent; EURm % of bunds held by Bundesbank
Sources: BrokerTec; Bundesbank.
Studies have also found that the introduction of cash collateral further reduced the scarcity effect on repo specialness, and that the effect was more pronounced in securities where the accumulation of stock by the PSPP was high. Separate analysis showed that quarter-end tensions associated with cheapest-to-deliver bonds were also alleviated by the securities lending facility.
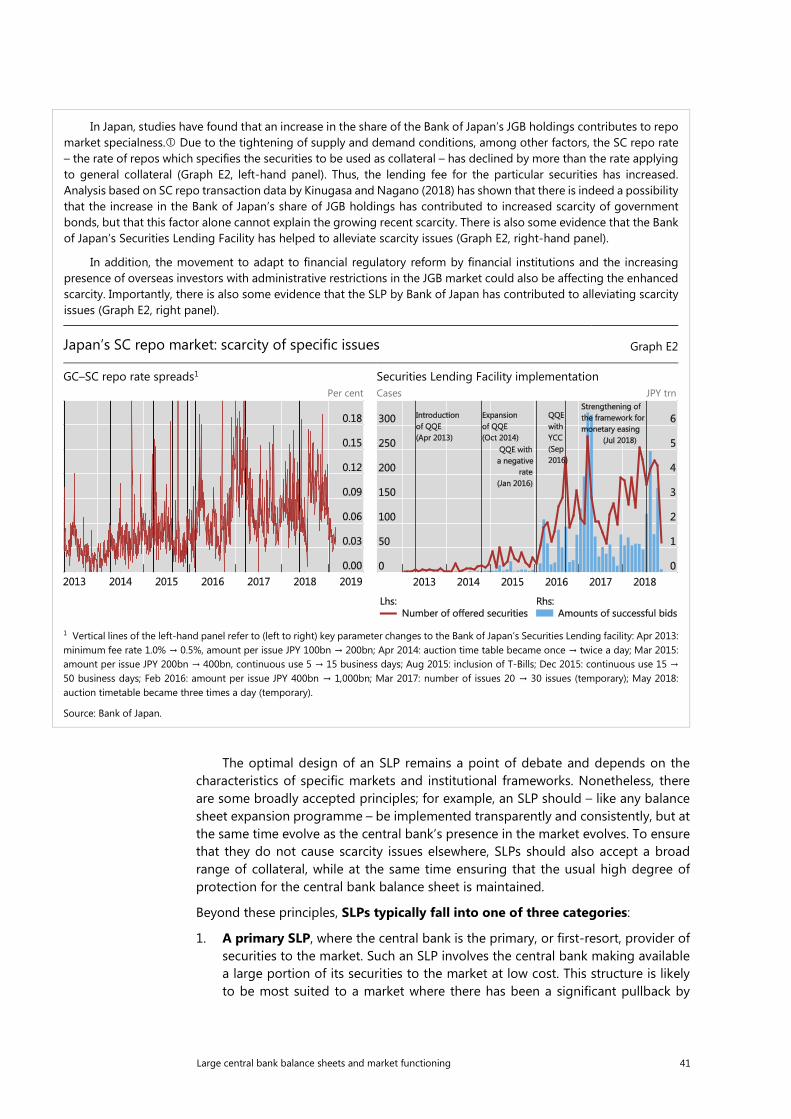
Large central bank balance sheets and market functioning 41
In Japan, studies have found that an increase in the share of the Bank of Japan’s JGB holdings contributes to repo market specialness. Due to the tightening of supply and demand conditions, among other factors, the SC repo rate – the rate of repos which specifies the securities to be used as collateral – has declined by more than the rate applying to general collateral (Graph E2, left-hand panel). Thus, the lending fee for the particular securities has increased. Analysis based on SC repo transaction data by Kinugasa and Nagano (2018) has shown that there is indeed a possibility that the increase in the Bank of Japan’s share of JGB holdings has contributed to increased scarcity of government bonds, but that this factor alone cannot explain the growing recent scarcity. There is also some evidence that the Bank of Japan’s Securities Lending Facility has helped to alleviate scarcity issues (Graph E2, right-hand panel).
In addition, the movement to adapt to financial regulatory reform by financial institutions and the increasing presence of overseas investors with administrative restrictions in the JGB market could also be affecting the enhanced scarcity. Importantly, there is also some evidence that the SLP by Bank of Japan has contributed to alleviating scarcity issues (Graph E2, right panel).
Japan’s SC repo market: scarcity of specific issues Graph E2
GC–SC repo rate spreads1 Securities Lending Facility implementation Per cent Cases JPY trn
1 Vertical lines of the left-hand panel refer to (left to right) key parameter changes to the Bank of Japan’s Securities Lending facility: Apr 2013: minimum fee rate 1.0% → 0.5%, amount per issue JPY 100bn → 200bn; Apr 2014: auction time table became once → twice a day; Mar 2015: amount per issue JPY 200bn → 400bn, continuous use 5 → 15 business days; Aug 2015: inclusion of T-Bills; Dec 2015: continuous use 15 → 50 business days; Feb 2016: amount per issue JPY 400bn → 1,000bn; Mar 2017: number of issues 20 → 30 issues (temporary); May 2018: auction timetable became three times a day (temporary).
Source: Bank of Japan.
The optimal design of an SLP remains a point of debate and depends on the characteristics of specific markets and institutional frameworks. Nonetheless, there are some broadly accepted principles; for example, an SLP should – like any balance sheet expansion programme – be implemented transparently and consistently, but at the same time evolve as the central bank’s presence in the market evolves. To ensure that they do not cause scarcity issues elsewhere, SLPs should also accept a broad range of collateral, while at the same time ensuring that the usual high degree of protection for the central bank balance sheet is maintained.
Beyond these principles, SLPs typically fall into one of three categories:
1. A primary SLP, where the central bank is the primary, or first-resort, provider of securities to the market. Such an SLP involves the central bank making available a large portion of its securities to the market at low cost. This structure is likely to be most suited to a market where there has been a significant pullback by

Large central bank balance sheets and market functioning 42
private lenders of securities, and/or where the central bank has accumulated a dominant share of a security or a market;
2. A secondary SLP, where the pricing and supply of a central bank’s securities are not particularly restrictive, but other features of the programme work to encourage a market-based solution to address collateral scarcity. These features can include opening the central bank facility only after the most liquid part of the collateral trading day has concluded; short borrowing terms (eg overnight only); caps on the supply of securities and allocation limits per dealer;34 and a competitive auction pricing mechanism for each ISIN to ensure the unique clearing price is found for each security and that individual borrowers cannot rely on this as a backstop; and
3. A backstop, or last-resort SLP, where the programme reservation price is set at a high level to limit use during normal market conditions so as to avoid the central bank substituting for markets, but not at a price so high that the facility is not used in exigent circumstances. Such a programme design is more likely to be appropriate in circumstances where the programme is designed to be temporary and self-liquidating.
These three categories could be compared with three theoretical benchmark cases. First, one could imagine designing an SLP so as to be profit-maximising, subject to the central bank’s risk appetite. Such a framework would benefit from a clear single objective and would maximise distributions to the government.
A second benchmark case involves aiming at a pricing approach similar to that of the average institutional SLP provider. This could also be seen as market-neutral in the sense that lending conditions would tend to remain unchanged relative to the case that the securities would have remained with, and would have been lent out by, institutional investors instead of having been absorbed by a central bank APP. This benchmark would likely lead to lower fees than profit maximisation because of the particular market power of a central bank owning an APP portfolio.
A third theoretical benchmark would be to specify the programmes with the aim of restoring the hypothetical market conditions (eg collateral scarcity indicators) that would have prevailed in the case that no APP had been undertaken. This would reflect the idea that the effects of APPs on market functioning should be kept to a minimum. However, the feasibility of this approach suffers from the fact that various other factors are also like to have changed the market’s functioning since the launch of an APP, such as revised regulation and risk management practices. In sum, it is challenging to define any single objective benchmark for specifying an SLP in the context of a large APP, implying the need to take into account different approaches in a pragmatic way. More analysis in this field appears warranted.
In a low/negative yield environment, an incentive can arise for market participants not to cure failed trades, implying that market participants in such a case are not stimulated to make use of securities lending facilities. In such an environment fails charges can be a helpful remedy (see Box F).
34 For example, in case of the Fed, no single dealer can borrow more than 25% of an issue, and across
all dealers SOMA can lend 90% of its holdings.

Large central bank balance sheets and market functioning 43
5.3 Liability management practices and remuneration policies
The expansion of central bank balance sheets has had implications for the way central banks manage their liabilities. Central banks have done this in a variety of ways, depending on their overall operational framework and policy intentions. Most liability management measures have focused more on improving monetary control within a chosen operational framework (corridor or floor), rather than on mitigating the effects on money market trading arising from larger central bank balance sheets. Nonetheless, the liability management practices of central banks have often proved consequential for money market functioning and evolution.
Box F
Fails charges – the US experience
Prolonged or chronic settlement fails reflect serious market dysfunction. Such dysfunction, once under way, can be self-fulfilling, as beneficial owners withdraw from lending securities, which in turn increases the rate of settlement fails. Malfunctioning of collateral markets can spread to the bond market (see Garbade et al (2010)). In addition, settlement fails can disguise other market issues, such as counterparty stress or rising counterparty default risk.
The US experience shows that a central bank securities lending programme can be enhanced by a fails charge regime. The US Treasury market suffered a notable increase in the fails rate when interest rates reached the zero lower bound in 2008 (Graph F, left-hand panel). This phenomenon reflects the US market convention that a seller who fails to deliver is denied receipt of the trade proceeds until the settlement fail is cured. This means the seller who fails to deliver incurs a fail cost equivalent to the time value of money for the duration of the settlement fail. Thus, a policy rate of zero provides no economic incentive to cure a fail (and a negative policy rate would provide an economic incentive to delay settlement indefinitely).
A fails charge of 300 bp was implemented in 2009 to counteract this unintended consequence. The fails charge re-established a market pricing mechanism for timely delivery in the collateral market. This keeps securities lenders active in the market and eliminates the adverse impact of zero interest rates on fail rates.
Settlement fails and the impact of fails charges in the United States In billions of US dollars Graph F
Daily Treasury fails to deliver into DTCC1 Primary dealer gross settlement fails2
1 The vertical lines indicate the date of TMPG fails charge implementation (left, 12 November 2008), fails charge implementation (middle, 1 May 2009) and Treasury issuing LPR and TMPG fails charge floor (right, 12 April 2018). 2 Monthly average of total fails to deliver and receive.
Sources: DTCC; Federal Reserve Bank of New York.

Large central bank balance sheets and market functioning 44
Absorbing excess liquidity
To restore a balanced or scarce liquidity position after expanding their balance sheets, central banks maintaining corridor regimes have often introduced operations designed to absorb excess reserves to prevent downward pressure on overnight interbank money market rates (see Table V.4, and Annex A for a detailed description of the reserves draining operations conducted by a number of central banks).
In principle, draining reserves supports interbank market functioning by reducing reserves supply, thereby encouraging banks to trade them with each other to meet payment needs and fulfil reserves targets. In addition, draining operations may involve the exchange of reserves for Treasury securities, central bank bills or other tradable instruments, which in turn, increases the supply of high-quality collateral, supports repo market activity and reduces market fragmentation. Finally, in countries with less established financial markets, reverse repo operations by the central bank can help to establish the infrastructure for private sector repo transactions.
Nonetheless, most central banks reported that liquidity-absorbing operations did not materially improve money market functioning. In unsecured markets, there has been a common trend of reduced interbank activity, whether or not central banks employed draining operations. This most likely reflects an increase in the regulatory cost of interbank borrowing.
In secured markets, the evidence is more mixed. In the United Kingdom, changes in the quantity of bills outstanding did not correlate with an increase in repo market turnover.35 On the other hand, in Sweden central bank securities are now held by a broader range of counterparties (beyond direct participants in the central bank’s operations). These instruments have substituted for Swedish government T-bills and bonds, where the stock has been declining due to the Riksbank’s purchases, helping to alleviate a shortage of safe assets. At the same time, by providing an alternative risk-free instrument for non-banks, it may have reduced trading between banks and non-banks. In Switzerland, turnover in the secured market started to increase as the amount of SNB bills outstanding rose.
For some emerging market economies, draining operations – related to sterilising the build-up of FX reserves – have helped to promote and establish some domestic financial markets. In Brazil, for example, central bank open market operations have contributed to the repo market becoming the main source of funding and liquidity management for banks and an important short-term financial instrument for mutual funds seeking to manage their cash flows. Similarly, in China, the instruments used by the PBC to drain excessive liquidity, including repurchase agreements and central bank bills, played a role in promoting the development of the money market and bond market, as well as in liberalising interest rates (Annex B).
35 The limited impact may reflect the modest size of outstanding bills/certificates relative to the overall
stock of eligible collateral. In the United Kingdom, at its peak, the amount of Bank bills outstanding averaged approximately £69 billion during January 2009, compared with government bonds outstanding of approximately £340 billion. Moreover, market intelligence suggested that banks’ motivation for purchasing these instruments – particularly during the financial crisis – was often simply to exchange surplus reserves for an alternative liquid asset. To the extent that they were intending to maintain or build their liquid asset buffers at that time, this means they would have been unlikely to reverse that position by using bills to obtain funding from the secured market.

Large central bank balance sheets and market functioning 45
Floor systems
As noted above, a number of central banks eventually elected not to (fully) drain reserves, effectively adopting floor systems (see Box B in Section 4). Under a floor system, interest rates are controlled by setting the rate of remuneration on reserves. Transacted volumes and volatility of the spread between overnight market interest rates and the policy rate have declined under floor systems.36
To strengthen interest rate floors, a number of central banks expanded the set of counterparties that have access to the liability side of their balance sheet (Table V.4). The most significant example was the introduction of the overnight reverse repo facility (O/N RRP) by the Federal Reserve, which established a new risk-free investment option for a wide range of lenders in short-term funding markets, such as money market mutual funds (MMF) and government-sponsored enterprises.
The Federal Reserve’s O/N RRP has helped ensure that money market rates remain above the lower end of the target range. It has also helped to reduce (although not eliminate) the volatility in money market rates witnessed over quarter-ends, when demand for short-term funding fluctuates (reflecting the desire of financial institutions to trim the size of their balance sheets to reduce capital and other regulatory charges) (Graph V.1). Finally, the O/N RRP tempered the impact of substantial changes in money market structure throughout 2015 and 2016, which were prompted by the implementation of MMF reform.37
At the same time, some have raised the possibility that such an O/N RRP facility could increase the risk of flight-to-quality flows to the central bank during a period of financial stress, which could further impede matching and price discovery in money markets. To date, this risk has not been borne out in practice during periods of heightened volatility.
Counterparty access to remunerated deposits and reverse repos Table V.4
Remunerated deposits Reverse repos
Counterparties US EA1 JP GB US EA JP GB Depository institutions X X X X X X Primary dealers and brokers X X X X X CCPs/Designated financial market utilities
X X X2
GSEs X MMFs and tanshi companies X X Foreign official X 1 The Eurosystem has non-monetary policy deposit facilities, for instance, where central banks act as fiscal agents of their governments. 2 Counterparties have been added in the crisis or post-crisis period.
Source: National submissions to CGFS/MC survey.
36 For example, the volumes and volatility of unsecured money market interest rates appeared to fall
after the adoption of floor systems in the euro area, the United Kingdom and the United States.
37 As a result of the MMF reform, prime and tax-exempt MMF assets declined by more than $1 trillion. The vast majority of the outflows were reallocated to government funds. The O/N RRP facility absorbed government money market mutual funds’ increased demand for safe investments: O/N RRP take-up shifted from prime and tax-exempt to government MMFs and use of the facility increased in the months leading up to the October 2016 implementation date and remained relatively elevated through 2017.

Large central bank balance sheets and market functioning 46
Nevertheless, the Fed has taken steps to mitigate this risk by setting an overall size limit, in combination with the spread between the IOER rate and the O/N RRP rate, to prevent a very large O/N RRP take-up and an expansion of the Federal Reserve’s role in financial intermediation. For example, the FOMC placed a cap on the O/N RRP at its September 2014 meeting to mitigate disintermediation concerns.
Reserve remuneration tiering
Central banks in some countries have also introduced tiered remuneration schemes, whereby a portion of reserve balances are remunerated at a different (higher) level in order to mitigate the impact on money market functioning from the growth in reserves. Annex C provides an overview of the details of tiered remuneration systems. In Switzerland and Japan, the central banks have exempted a portion of excess reserves from accruing negative interest. This was primarily motivated by a desire to reduce the cost to the banking sector of holding excess reserves while still allowing for a strong pass through to money markets (Jobst and Lin (2016)).
As a welcome side effect, tiering systems can support interbank money market activity by introducing an additional motivation for trading reserves. In particular, banks with holdings above the negative interest rate exemption threshold have an incentive to lend their excess reserves to other banks, at a rate that is higher than the marginal remuneration offered by the central bank. In other words, banks seek to optimise reserve holdings. Accordingly, the larger the difference between the marginal and average rate, the greater is the incentive to trade excess reserves.
Take-up in the Fed’s reverse repo facility and US money market developments Graph V.1
Reverse repo amounts outstanding by counterparty type1
Overnight money market rates2
USD bn Per cent
1 Figures include overnight and term operations. Money market mutual fund categorisations through 14 October 2016 reflect staff estimates. 2 Figures for the Tri-Party General Collateral Rate (TGCR) reflect the TGCR for 3 April 2018, through 31 December 2018, and modelled preproduction TGCR values for 2 January 2015, through 2 April 2018.
Source: Federal Reserve Bank of New York.

Large central bank balance sheets and market functioning 47
Increase in money market activity in Switzerland and Japan after introduction of tiered remuneration schemes Graph V.2
Money markets in Switzerland and Japan Exemption threshold trading in CHF repo market JPY trn CHF bn CHF bn
1 Filled exemption thresholds via CHF repo transactions (all maturities, without AHV, Confederation).
Sources: SIX Repo Ltd; national data.
There is evidence that overnight interbank market trading activity increased following the introduction of a tiering system in Japan and Switzerland (Graph V.2). In Switzerland, repo market activity was subdued in the period preceding the introduction of a tiered scheme, with daily average trading volumes of around CHF 1.5 billion. In the negative interest rate period, when the tiering system was introduced, daily trading volumes increased significantly to an average of CHF 4.9 billion, even though the amount of excess reserves increased further (Fuhrer (2018)).38 Most of the rise in turnover occurred in the overnight repo, rather than the unsecured money market segment (Moser (2016)).
In Japan, money market activity also rose after the introduction of a tiered remuneration mechanism. After a few months, banks adjusted to the new market conditions and unsecured daily average turnover increased from less than JPY 3.0 trillion in 2015 to around JPY 4.5 trillion.39 In contrast to the Swiss experience, most of the reallocation of reserves in overnight markets is taking place mainly via unsecured instruments.
38 Shortly after the introduction of the tiering regime, the exemption thresholds were not yet fully
exploited. However, over time the market started to redistribute reserves and the use of the individual exemption thresholds increased (from 88% in January 2015 to 98% at the end of 2018). See Bech and Malkhozov (2016).
39 Directly after the introduction of negative rates and tiered remuneration, turnover in the Japanese unsecured O/N call market remained subdued and the increase was observed only three months later, once the banks had adjusted their IT systems and internal procedures to cater for negative interest rates.

Large central bank balance sheets and market functioning 48
6. Balance sheet unwinding and market functioning: the experience so far
Central banks’ experiences with balance sheet reductions and any associated impact on market functioning can help to inform policymakers in the development of future balance sheet expansion programmes. A review of experience with balance sheet reductions – including the expiry of lending programmes and the unwinding of asset purchases – has so far revealed few negative impacts on market functioning. Design features in several lending programmes have proved helpful in averting potentially disruptive declines in liquidity as programmes expire. Only a few central banks have undertaken asset purchase unwinds, and so conclusions regarding their effects are necessarily tentative.40 That said, preliminary evidence suggests that adopting a predictable and gradual approach to balance sheet normalisation has helped the Federal Reserve so far avoid material or enduring market functioning issues in bond and money markets.
6.1 Unwinding of bank liquidity facilities
Although the expiry of crisis-era lending programmes led to large declines in the size of some central bank balance sheets, in most instances, the withdrawal of liquidity has been orderly, with minimal impact on market functioning. Programme design features and other steps have helped limit funding and liquidity disruptions. Several central banks, for example, priced programmes to self-liquidate as funding conditions normalised. Other central banks have also employed backstop pricing, including the Bank of Canada for its term purchase and resale agreement operations, and Sveriges Riksbank for its crisis-era loan facilities.
Central banks have taken other steps to minimise negative market functioning impacts. To avoid a potentially disruptive congestion of issuance at the end of its Special Liquidity Scheme, the Bank of England encouraged banks to raise private funding well ahead of the programme’s expiry (CGFS (2017)). In the euro area, early repayments of the ECB’s three-year longer-term refinancing operations (LTROs) led to a large and rapid decline in excess reserves, fuelling money market volatility. As a result, the ECB designed its second targeted longer-term refinancing operations (TLTRO II) to limit “cliff effects” at maturity by spreading operations over time and altering prepayment incentives.41
6.2 Unwinding of asset purchases
Experience with asset purchase unwinding is sparser, although there are a few notable instances, including the Bank of Japan’s 2006 unwinding of the QE programme that started in 2001 and the Federal Reserve’s ongoing balance sheet normalisation. Policymakers in both cases sought to mitigate uncertainty regarding the policy reaction function and timing and size of redemptions. Moreover, the Federal Reserve has aimed to limit the pace of unwinding. A gradual pace can limit bond market
40 Berentsen et al (2018) show how different exit strategies need to be evaluated against the
background of money market activity and other criteria (welfare, inflation, taxes and interest payments to financial intermediaries).
41 “Cliff effects” refers to the concentration of prepayments and maturities over a short time frame.

Large central bank balance sheets and market functioning 49
disruptions, especially if the market ecosystem has changed or atrophied. It can also avert money market volatility as reserve levels decline, especially when the distribution of reserves is uneven across institutions.
In the BoJ’s experience, two factors have helped to facilitate an orderly unwinding. First, the BoJ limited the transfer of risk to the private sector by pursuing a passive runoff of bills and short-dated asset backed commercial paper, rather than maturities or sales of longer-dated bonds and equities. Second, the BoJ communicated clearly and well ahead of policy changes, giving ample time for markets to prepare. During the execution of QE, policymakers enumerated clear conditions for the exit so that market participants were comfortable with the BoJ’s reaction function, and as the unwinding approached, the BoJ offered increasingly frequent assessments of economic conditions (Yamaoka and Sayed (2010)).
The Federal Reserve’s balance sheet normalisation to date has had little sustained impact on liquidity and market functioning. In the US Treasury market, price sensitivity metrics, market depth, and measures of liquidity premia – have been roughly unchanged or modestly improved since normalisation was signalled. (Graph VI.1). Measures of specialness and settlement fails have declined more measurably, although largely as a result of increased US Treasury issuance. In the agency MBS market, bid-ask spreads, price impacts, and trading volumes are either little changed or slightly improved (Graph VI.1). Finally, declines in reserves have had limited sustained impact on money market functioning; the Federal Reserve has maintained control of the effective fed funds rate, while rates across money markets have generally exhibited strong co-movement (Potter (2018)).
The Federal Reserve’s approach to unwinding its asset purchases has been guided by two principles: predictability in the timing and magnitude of central bank operations and gradualism in the pace of net flows (Potter (2017b)). Predictability aims to reduce sources of uncertainty and thus improve market participants’ ability to plan for increases in supply. The principle echoes the US Treasury’s “regular and predictable” approach to issuance, which has been credited with reducing liquidity
Select US Treasury and agency MBS liquidity indicators Graph VI.1
US Treasury Liquidity Index (Cubic spline error)1 Agency MBS price impact (Amihud measure)2 Illiquidity ratio3
1 Based on its intraday relative value curve fitter, using Treasury notes and bonds of maturity of one year or greater. 2 20-day moving average. dealer-to-dealer sales and dealer-to-customer purchases and sales across agencies. 30- and 15-year TBA securities, 2–7% coupons.3 Multiplied by 1012.
Sources: Bloomberg; FINRA; TRACE; FRBNY calculations.

Large central bank balance sheets and market functioning 50
premia.42 Predictability has been supported by both programme design features and clear communication. The reinvestment caps are an example of the former as they reduce uncertainty about agency MBS principal repayments – even if a large decline in long-term interest rates were to cause agency MBS prepayments to accelerate, pay-downs in excess of the cap would be reinvested.43
Clear and transparent communication can limit, if not fully avert, surprises and confusion, while communicating well ahead of changes can give market participants more time to prepare for them. The Federal Reserve drew some lessons from the 2013 taper tantrum, when some market participants appeared to be surprised by, or prone to misinterpret, Fed communication (Fischer (2017)). Following that episode, the New York Fed’s Open Market Desk broadened participation in its surveys of policy expectations, while the FOMC took a deliberate approach toward telegraphing its policy normalisation principles and plans. As part of this communication, the FOMC clarified that the balance sheet would shrink in a passive manner, leaving the short-term interest rate as the active policy instrument, in order to reduce potential confusion about the roles of the policy tools.
Gradualism has been supported by both “reinvestment caps”, which slow the pace of runoff, as well as earlier decisions to taper asset purchases and reinvest with a view to smoothing transitions. More recently, the FOMC also took steps to slow the pace of reserve declines in order to ensure a smooth transition to an efficient long-run level of reserves consistent with a floor system. In March 2019, the Committee signalled it would reduce the cap on monthly Treasury redemptions in May and conclude the reduction of its aggregate securities holdings at the end of September; in July, the Committee brought the end of the unwind forward to August. Nonetheless, tightening money market conditions in September 2019, which were addressed through open market operations, illustrated the importance of maintaining margins of operational flexibility to address unexpected changes in market functioning.44
7. Key lessons for policymakers
Large-scale asset purchases and non-standard lending operations can affect financial market functioning in both positive and negative ways and through several channels. Effects are often positive and intended, especially when the measures take place in the context of impaired market conditions and address an impaired transmission mechanism. Moreover, it is important to distinguish effects that are unintended but still a “natural” consequence of the programmes – eg lower turnover as purchases reduce free float – from negative effects that could be avoided or attenuated by introducing mitigating measures such as securities lending programmes.
An overarching message of this report is that central banks gave due consideration to market functioning and managed to avoid serious harm to it as they
42 See US Department of the Treasury (2015).
43 Principal maturities have been reinvested only to the extent that they exceeded gradually increasing thresholds.
44 See Board of Governors of the Federal Reserve System, “Balance Sheet Normalization Principles and Plans”, Federal Reserve Press Release, 20 March 2019, www.federalreserve.gov/newsevents/pressreleases/files/monetary20190320c1.pdf.

Large central bank balance sheets and market functioning 51
undertook balance sheet expansions on an unprecedented scale. In designing their policies, central banks recognised the role of markets for matching, price discovery and funding and hence generally sought to avoid unnecessarily substituting for private markets and impairing market processes. Indeed, the unintended side-effects of central bank balance sheet expansion have rarely tightened financial conditions in a material or persistent way that might have weakened monetary policy effectiveness.
Market dysfunction issues that emerged during the phase-in of large-scale balance sheet expansion were mostly transitory but, in some cases, were more enduring. Central banks were able to address these issues by (i) carefully designing programme parameters; (ii) adopting transparency and clear communication to limit asymmetric information and support predictability; (iii) establishing mitigation measures, such as securities lending programmes; and (iv) maintaining flexibility in programme implementation without altering the policy content. A key lesson based on central banks’ experience is that taking possible side effects and market functioning considerations into account when designing and implementing the policies, is beneficial for enhancing the effectiveness of balance sheet policies.
One caveat is worth highlighting: central bank balance sheets have expanded amid the implementation of Basel III banking regulations and post-crisis changes in risk management practices. The interaction of these factors makes it challenging to isolate the effects of large central bank balance sheets on market functioning, and disentangling the impact of these three factors on market functioning is beyond the scope of the report.
The following are the key conclusions and lessons of the report for policymakers:
1. A gradual pace of purchases relative to free float and net issuance can limit non-linear flow effects on asset prices and the associated volatility when the short-run supply of assets is inelastic.
2. Limiting asset holdings relative to market size, when feasible, can reduce the risks of impeding the price discovery process and causing the investor base to atrophy. Because both the free float and net issuance of a security or asset is ever-changing and difficult to ascertain ex ante, flexibility in programme implementation may be necessary to mitigate these effects.
3. Securities lending programmes are important tools for mitigating scarcity-related price distortions in repo and bond markets. Because APPs reduce the free float of the purchased bonds, market participants’ ability to repurchase or borrow securities and thus to hold sufficient securities to settle trades can become impaired. Well designed SLPs can attenuate these scarcity effects, including by containing excessive specialness of specific bonds and by supporting a sufficient velocity of collateral in the financial system. The optimal securities lending approach of a central bank is likely to depend on the nature and severity of the scarcity effects and the features of local markets. The approach can take three main forms: “primary” (lending all bonds at a very low cost); “secondary” (lending specific securities through a competitive bidding process after the most liquid part of the trading session); or “backstop” (lending as a last resort to avoid substituting for private markets). More research on the optimal design of securities lending facilities seems warranted. Somewhat relatedly, charges for settlement fails can ease negative programme effects on market functioning in the case that asset scarcity and low interest rates would otherwise make

Large central bank balance sheets and market functioning 52
settlement fails more likely. A fails charge regime can counteract these unintended consequences by increasing the cost of a fail.
4. Appropriate transparency and predictability in operations can help reduce uncertainty around the central bank’s purchase policy reaction function, reducing information asymmetries and avoiding information rents accruing to insiders. Moreover, programme information should be communicated in ways that make it broadly and simultaneously available (as for any monetary policy decision). Of note, the optimal degree of central bank transparency needs to take account of the market context the central bank operates in; in limited cases, “too much” transparency can contribute to market dysfunction by inciting market segmentation or manipulation.
5. Preserving some margins of operational flexibility to respond to changes in market or liquidity conditions can provide scope to reduce negative market functioning effects without altering the programme’s monetary policy stance.
6. Declining interbank trading activity is a natural by-product of central bank balance sheet expansion, but may have lasting ecosystem effects. Excess liquidity – as well as new liquidity regulations and business model changes – has eroded unsecured interbank trading. However, markets in wholesale deposits (from non-banks) and short-term paper have not evidenced similar declines. In spite of declining interbank volumes, central bank control over short-term rates has remained generally resilient, as many central banks have adjusted their operational frameworks by shifting to floor systems. Some have also expanded the set of counterparties in certain operations beyond banks to include money market mutual funds, for instance. Not only has this expansion helped strengthen their control over short-term interest rates but, at times, it has also had beneficial effects for market functioning. Other central banks have introduced reserve tiering systems with differentiated remuneration, which has prompted an increase in interbank trading volumes, at least temporarily. Of note, declines in interbank activity might still have negative implications in the medium to long term, including through hysteresis (eg the erosion of market infrastructures and know-how), market substitution by central banks, and/or weaker market discipline, with possible implications for financial stability. For the future ability to mitigate the unintended side effects of policy measures on financial markets, a careful monitoring of these effects is important. This particularly applies to the period when balance sheets and the amount of excess reserves eventually normalise (eg should central banks move back to corridor systems). For effective monitoring, it is crucial for central banks to have granular data that capture financial transactions (in various market segments) and the various dimensions of market functioning, together with the capacity to analyse these data, whether or not the institutions are operating in a corridor or floor system.
7. International market functioning spillovers from balance sheet expansion generally appear to have been benign, but nonetheless merit ongoing monitoring to avoid or contain unintended consequences. Bond purchase programmes have at times produced price and volatility spillovers to other countries’ bond markets, but these generally have been akin to the spillovers associated with traditional monetary policy tools. Some market functioning spillovers have also been observed in bond markets, both positive and negative, although, in practice, such effects have been neither persistent nor broad-based. In money markets, experience suggests that the dollar funding costs in FX swap

Large central bank balance sheets and market functioning 53
markets, and associated cross-currency basis spreads, merit monitoring as they could potentially indicate more widespread dysfunction in international money markets. For example, during the acute phases of the GFC and the euro area crisis, the elevated costs of obtaining dollar funding through FX swaps was reflective of broader funding market disruptions. Central bank lending programmes and liquidity swap lines eased adverse market functioning spillovers and helped to contain the basis. In contrast, the persistent cross-currency basis observed in recent years reflects divergent monetary policy stances coupled with more limited arbitrage capacity post-crisis, rather than any underlying market dysfunction.
8. Programme design features can limit disruptive declines in liquidity resulting from the expiry of non-standard lending operations. For example, central banks can price lending operations to self-liquidate as funding conditions normalise. A gradual cessation of facility use will then occur in parallel to an increased access to market funding, keeping maturity cliff effects to a minimum.
9. A predictable and gradual approach to unwinding asset purchases can give market participants longer to prepare for and adjust to increases in supply. This is especially important to the extent that the ecosystem of market participants has changed. Indeed, APPs run the risk of breeding market ecosystem hysteresis, which can erode market infrastructure and expertise as well as the investor base and market-making capacity. These changes can make it more difficult for the market to absorb flows once central bank balance sheets are stabilised or reduced. The impact of hysteresis effects is difficult to predict as markets tend to adapt quickly to changing circumstances. Nonetheless, central banks should pursue, to the extent feasible, a predictable and gradual unwinding of balance sheet policies, which could include moderating the change in pace of central bank flows by, inter alia, tapering, reinvesting to smooth transitions, and employing graduated caps to limit passive runoff. Predictability – with the aim of keeping to a minimum unexpected changes in net central bank flows – is best achieved through clear, transparent communication.
Moreover, crowded positions may require careful monitoring and preparedness on the part of the central bank. Absorption of duration risk by central banks may crowd investors into positions that are less well understood and beyond their natural habitat. It can support both domestic flows (eg into credit risky portfolios) or cross-border flows (eg into emerging market assets), and lead to asset mispricing. Ultimately, it could heighten vulnerabilities to market instability and malfunctioning when market sentiment shifts or a central bank unwinding is signalled. The central bank should therefore monitor the build-up of crowded trades and keep to a minimum sudden, unexpected policy changes that could lead to strong reversals, and be prepared to address the associated volatility as necessary.
These principles will help to ensure that the unintended consequences of policy implementation on market functioning undermine neither the efficiency of the financial system, nor the effectiveness of monetary policy measures. The above principles appear sufficiently general and can be expected to apply again should a future need arise to conduct non-standard, large-scale central bank programmes. While the effects of large balance sheets on market functioning will remain highly dependent on circumstances, well designed mitigation measures can help soften the impact of unconventional monetary policy measures on market functioning.

Large central bank balance sheets and market functioning 54
References
Adrian, T, R Crump and E Moench (2013): “Pricing the term structure with linear regressions”, Journal of Financial Economics, vol 110, issue 1, October, pp 110–38.
Adrian, T., M Fleming, O Shachar and E Vogt (2017): “Market liquidity after the financial crisis”, Annual Review of Financial Economics, vol 9, pp 43–3.
Aldasoro, I, T Ehlers and E Eren (2018): “Business models and dollar funding of global banks”, BIS Working Papers, no 708, March.
Amihud, Y (2002): “Illiquidity and stock returns: cross-section and time series effects”, Journal of Financial Markets, vol 5, pp 31–56.
Arrata, W, B Nguyen, I Rahmouni-Rousseau and M Vari (2017): “Eurosystem's asset purchases and money market rates”, Bank of France, working paper, November.
Bank for International Settlements (2016): Foreign exchange turnover in April 2016, Triennial Central Bank Survey, September.
Barth, M, E Remolona and P Wooldridge (2002): “Changes in market functioning and central bank policy: an overview of the issues”, BIS Working Papers, no 120, October.
Basel Committee on Banking Supervision (2018): Revisions to leverage ratio disclosure requirements, consultative document, December.
Bech, M, U Faruqui, F Ougaard and C Picillo (2018): “Payments are a-changin’ but cash still rules”, BIS Quarterly Review, March.
Bech, M and A Malkhozov (2016): “How have central banks implemented negative policy rates?”, BIS Quarterly Review, March.
Berentsen, A, S Kraenzlin and B Müller (2018): “Exit strategies for monetary policy”, Journal of Monetary Economics, vol 99 (C), pp 20–40.
Bindseil, U (2013): “Central bank collateral, asset fire sales, regulation and liquidity“, ECB Working Paper, no 1610, November.
Board of Governors of the Federal Reserve System (2009): Monetary policy alternatives, Washington DC, 17–18 March.
——— (2019): Minutes of the Federal Open Market Committee, Washington DC, 29–30 January.
Boermans, M and V Keshkov (2018): “The impact of the ECB asset purchases on the European bond market structure: granular evidence on ownership concentration”, DNB Working Papers, no 590, April.
Bolton, P and E von Thadden (1998): “Blocks, liquidity, and corporate control”, Journal of Finance, vol 53, no 1, pp 1–25.
Boneva, L, D Elliott, I Kaminska, O Linton, N McLaren and B Morley (2019): “The impact of QE on liquidity evidence from the UK corporate bond purchase scheme”, Bank of England, Staff Working Papers, 782, April.
Borio, C, R McCauley, P McGuire and V Sushko (2016): “Covered interest parity lost: understanding the cross-currency basis”, BIS Quarterly Review, September.

Large central bank balance sheets and market functioning 55
Brand, C, L Ferrante and A Hubert (2019): “From cash- to securities-driven euro area repo markets: the role of financial stress and safe asset scarcity”, ECB Working Paper, no 2232, January.
Christensen, J and J Gillan (2018): “Does quantitative easing affect market liquidity?”, Federal Reserve Bank of San Francisco Working Paper, no 2013–26, September.
Cœuré, B (2017): “Asset purchases, financial regulation and repo market activity”, speech at the ERCC General Meeting on “The repo market: market conditions and operational challenges”, European Central Bank.
Committee on the Global Financial System (2017a): “Designing frameworks for central bank liquidity assistance: addressing new challenges”, CGFS Papers, no 58, April.
——— (2017b): “Repo market functioning”, CGFS Papers, no 59, April.
——— (2019): “Unconventional monetary policy tools: a cross-country analysis”, CGFS Papers, no 63, October.
Corradin, S and A Maddaloni (2017): “The importance of being special: repo markets during the crisis”, ECB Working Paper, no 2065, May.
Corwin, S and P Schultz (2012): “A simple way to estimate bid-ask spreads from daily high and low prices”, Journal of Finance, vol 67, no 2, pp 719–60.
Curcuru, S, S Kamin, C Li and M Rodriguez (2018): “International spillovers of monetary policy: Conventional policy vs quantitative easing”, International Finance Discussion Papers, no 1234, August.
D’Amico, S, R Fan and Y Kitsul (2018): “The scarcity value of Treasury collateral: Repo-market effects of security-specific supply and demand factors”, Journal of Financial and Quantitative Analysis, vol 53, no 5, pp 2103–29.
D’Amico, S and T King (2013): “Flow and stock effects of large-scale Treasury purchases: evidence on the importance of local supply”, Journal of Financial Economics, vol 108, no 2, pp 425–48.
Debelle, G (2017): “How I learned to stop worrying and love the basis”, dinner address at the BIS Symposium: CIP-RIP?, Basel, 22 May.
De Pooter, M, R Martin and S Pruitt (2018): “The liquidity effects of official bond market intervention”, Journal of Financial and Quantitative Analysis, vol 53, no 1, pp 243–68.
Du, W, A Tepper and A Verdelhan (2018): “Deviations from covered interest rate parity”, The Journal of Finance, vol 73, no 3, pp 918–57.
Federal Reserve Bank of New York (2011): Domestic open market operations during 2010, Report prepared for the Federal Open Market Committee by the Markets Group, March.
——— (2017): Statement regarding reinvestment in Treasury securities and agency mortgage-backed securities, 20 September.
Ferdinandusse, M, M Freier and A Ristiniemi (2017): “Quantitative easing and the price-liquidity trade-off”, Sveriges Riksbank Working Paper, no 335, February.
Feroli, M, A Kashyap, K Schoenholtz and H S Shin (2014): “Market tantrums and monetary policy”, US Monetary Policy Forum.

Large central bank balance sheets and market functioning 56
Fischer, S (2017): “Monetary policy expectations and surprises”, remarks at the School of International and Public Affairs, Columbia University, New York City, 17 April.
Fuhrer, L (2018): “Liquidity in the repo market”, Journal of International Money and Finance, vol 84(C), pp 1–22.
Garbade, K, F Keane, L Logan, A Stokes and J Wolgemuth (2010): “The introduction of the TMPG fails charge for US Treasury securities”, Economic Policy Review, FRBNY, vol 16, no 2, p 55.
Gopinath, G and J Stein (2018): “Banking trade, and the making of a dominant currency”, Harvard and NBER, March.
Greenwood, R, S Hanson and J Stein (2016): “The Federal Reserve’s balance sheet as a financial-stability tool”, Harvard and NBER, September.
Han, F and D Seneviratne (2018): “Scarcity effects of quantitative easing on market liquidity: evidence from the Japanese government bond market”, IMF Working Paper, no 18/96.
Hancock, D and W Passmore (2011): “Did the Federal Reserve’s MBS purchases program lower mortgage rates?”, Journal of Monetary Economics, vol 58, no 5, pp 498–514.
Hattori, T (2018): “Noise as a liquidity measure in the Japanese market: evidence from quantitative and qualitative easing by the Bank of Japan”, Working Paper, no 18/96, May.
International Monetary Fund (2015): “Vulnerabilities, legacies, and policy challenges – Risks rotating to emerging markets”, Global Financial Stability Report, October.
Iwatsubo, K and T Taishi (2018): “Quantitative easing and liquidity in the Japanese government bond market”, International Review of Finance, vol 18, no 3, pp 463–75.
Jank, S and E Moench (2018): “The impact of Eurosystem bond purchases on the repo Market”, Bundesbank Research Brief, 21st edition, September.
Jobst A, and H Lin (2016): “Negative interest rate policy (NIRP): implications for monetary transmission and bank profitability in the euro area”, IMF Working Paper, August.
Kandrac, J (2018): “The costs of quantitative easing: liquidity and market functioning effects of Federal Reserve MBS purchases”, International Journal of Central Banking, vol 14, no 5, pp 259–304, December.
Kandrac, J and B Schlusche (2013): “Flow effects of large-scale asset purchases”, Economics Letters, vol 121, no 2, pp 330–5, November.
Kearns, J, A Schrimpf and D Xia (2018): “Explaining monetary spillovers: the matrix reloaded”, BIS Working Papers, no 757, November.
Kinugasa, S and T Nagano (2017): “SC repo market kara mita JGBs no kishosei (scarcity)”, Bank of Japan Working Paper, June. Published version is only available in Japanese.
Kohler, D and B Müller (2019): “Covered interest rate parity, relative funding liquidity and cross-currency repos”, no 2019-5, SNB Working Papers, May.
Kolasa, M and G Wesolowski (2018): “International spillovers of quantitative easing”, ECB Working Paper, no 2172, July.

Large central bank balance sheets and market functioning 57
Kurosaki, T, Y Kumano, K Okabe and T Nagano (2015): ”Liquidity in JGB markets: an evaluation from transaction data”, Bank of Japan Working Paper, May.
Makabe, A, S Tamaki and K Hirayama (2005): 300 years of bond and interest rate history, Toyo Keizai.
Malamud, S and E Eren (2018): “Dominant currency debt”, Swiss Finance Institute Research Paper, no 18-55, August.
Markets Committee (2016a): “Electronic trading in fixed income markets”, Markets Committee Papers, no 7, January.
——— (2016b): “Market intelligence gathering at central banks”, Markets Committee Papers, no 8, December.
Moser, D (2016): “Implementation of monetary policy in turbulent times”, speech delivered at the Monetary Market Event, Swiss National Bank, Zurich, 31 March.
Pasquariello, P, J Roush, and C Vega (2018): “Government intervention and strategic trading in the US Treasury market”, Journal of Financial and Quantitative Analysis, September.
Pastor, L and R Stambaugh, (2003): “Liquidity risk and expected stock returns”, Journal of Political Economy, vol 111, pp 642–85.
Pelizzon, L, M Subrahmanyam, R Tomio and J Uno (2018): “Scarcity and spotlight effects on term structure: quantitative easing in Japan”, IMES Discussion Papers, 2018-E-14, Bank of Japan, September.
Potter, S (2017a): ”Gradual and predictable – reducing the size of the Federal Reserve's balance sheet”, remarks at the SUERF – The European Money and Finance Forum Conference “Globalisation Dynamics – EU and US Perspectives”, New York City, 11 October.
——— (2017b): “Money markets at a crossroads: policy implementation at a time of structural change”, remarks at the Master of Applied Economics Distinguished Speaker Series, University of California, Los Angeles.
——— (2018): “US Monetary policy normalisation is proceeding smoothly”, remarks at the China Finance 40 Forum – Euro 50 Group, CIGI Roundtable, Bank of France, Paris, 26 October.
Rime, D, A Schrimpf and O Syrstad (2017): “Segmented money markets and covered interest parity arbitrage”, BIS Working Papers, no 651, July.
Roll, R (1984): “A simple implicit measure of the effective bid-ask spread in an efficient market”, Journal of Finance, vol 39, no 4, pp 1127–39.
Sakiyama, T and S Kobayashi (2018): “Liquidity in the JGB cash market: an evaluation from detailed transaction data”, Bank of Japan Working Paper, March.
Schlepper, K, H Hofer, R Riordan and A Schrimpf (2018): “The market microstructure of central bank bond purchases”, Journal of Financial and Quantitative Analysis, forthcoming.
Schultz, P (2001): “Corporate bond trading costs: a peek behind the curtain”, Journal of Finance, vol 56, pp 677–98.
Singh, M (2013): “Collateral and monetary policy”, IMF Working Papers, no 13-186, August.

Large central bank balance sheets and market functioning 58
Steeley, J (2015): “The side effects of quantitative easing: evidence from the UK bond market”, Journal of International Money and Finance, vol 51, pp 303–36.
US Department of the Treasury (2015): The meaning and implications of “Regular and Predictable” (R&P) as a tenet of debt management, August.
Yamaoka, H and M Sayed (2010): “Managing the exit: lessons from Japan’s reversal of unconventional monetary policy”, IMF Working Papers, WP/10/114, May.

Large central bank balance sheets and market functioning 59
Annex A. Draining liquidity: tools and their usage
Tools available to drain liquidity
The set of instruments available to central banks to drain liquidity includes:
• Treasury securities: Treasury securities (usually bills) can be sold from an existing portfolio on the asset side or be newly issued by the Treasury to support liquidity absorption in a dedicated programme (as in the Supplementary Financing Programme in the United States). A close coordination between the central bank and the Treasury (Office of Debt Management) is hence needed to use this instrument. T-bills are a common tool for liquidity absorption, in particular in emerging market economies. T-bills have the advantage of being regarded as virtually free from credit risk and of serving as underlying assets for repo, futures and option markets. Often they also serve as a benchmark in pricing for other financial assets. Like other marketable instruments, Treasury securities are accessible to banks and non-banks.
• Issuance of central bank securities: central bank bills can also be used to drain liquidity in a surplus liquidity environment. As the instrument is traded in the markets, it is also accessible to non-banks, even in jurisdictions where monetary policy operations are conducted vis-à-vis banks only. It can be argued that these central bank bills also increase the supply of risk-free assets to the market, which can promote financial stability (Greenwood et al (2018)); on the other hand, crowding out of domestic sovereign debt or other HLQLA assets could also materialise if the supply of central bank securities is increased on a large scale.
• Term deposits: term deposits can also be used to adjust the structural liquidity position. Contrary to the issuance of central bank securities, term deposits are not tradable in the markets. The central bank offers counterparties to place their cash for a determined time period and interest rate, in turn absorbing liquidity.
• Reverse repos: reverse repos can be used both to adjust the structural liquidity position and to increase the control over short-term rates in a floor system, like that applied by the Federal Reserve to the O/N-RRP facility. This also has the effect of increasing the amount of tradable HQLA in the market. This requires that the central bank holds a sufficient amount of assets.
• Reserve requirements: reserve requirements also allow liquidity to be absorbed; one drawback is that, while the reserve coefficient can be set by the central bank, the reserve base is exogenously determined by the relevant monetary financial institutions (MFI) liabilities. This implies that it is more difficult to fine-tune the amount absorbed by reserve requirements.
Central banks’ experience in using liquidity-absorbing tools
Before the crisis, the majority of central banks in larger economies used a corridor system to steer interest rates (see Section 4). Of the central banks that introduced balance sheet expanding measures, around half either moved to a new framework for controlling short-term interest rates (Fed, ECB, BoJ, BoE, SNB) or made adjustments to their existing framework (SE). These tended to be the large, advanced economy central banks that experienced the biggest increase in the size of their balance sheets.

Large central bank balance sheets and market functioning 60
The others (AU, CA, MX and NZ) indicated that the expansion of their balance sheets did not result in any changes to their operational framework.
Even central banks that did eventually move to a floor system (US, EA, JP, GB, CH) often made adjustments to existing frameworks first. Given that the instruments used varied across central banks and over time, there are a variety of experiences with which to assess the potential impact of these changes on money market functioning.
In the United States, the Federal Reserve initially used the sale of Treasury securities to absorb liquidity. However, the Federal Reserve System Open Market Account (SOMA) eventually (September 2008) ran short of unencumbered Treasury securities to sell on the asset side. The Federal Reserve, together with the US Treasury, then set up a new programme – the Supplementary Financing Programme (SFP) – which consisted of a series of Treasury bill auctions, separate from the Treasury’s regular borrowing programme, with the proceeds kept in an account at the Federal Reserve Bank of New York. In late 2008, the Federal Reserve moved to a floor system and introduced interest on required and excess reserves (IOER), to establish a floor under the level of the federal funds rate. Finally, in 2013 the overnight reverse repo facility (O/N RRP) was introduced to strengthen the floor on overnight interest rates by broadening access to non-bank counterparties.
In the United Kingdom, as well as allowing existing reserve supplying repo operations to unwind, the Bank of England used central bank one-week bills to keep control of short-term interest rates (and continued to use a “reserves averaging” corridor system) during the initial stages of the financial crisis. This was done through weekly fixed rate auctions, at the Bank Rate. From December 2008 onwards, the central bank bills were eligible collateral for gilt repo transactions. Reserves averaging was suspended when QE was launched in March 2009, with all reserves remunerated at the Bank Rate in a floor system. Initially the Bank of England continued to supply reserves in long-term repos and drain reserves using central bank bills (weekly variable rate auctions, max bid Bank Rate plus 10 basis points). Some of the term funding schemes run by the Bank of England were also designed so as not to result in additional injections of reserves. For example the Special Liquidity Scheme (SLS) and Funding for Lending Scheme (FLS) lent nine-month Treasury bills (sourced from the UK Debt Management Office) rather than reserves.
The Eurosystem used fixed-term deposits (ie fine-tuning operations) to keep short-term interest rates close to the main policy rate both during the first phase of the crisis and to absorb the liquidity effect of the Securities Markets Programme (SMP) from 2010 to 2014. In the latter case, one-week operations were conducted as variable rate tenders with a pre-announced offered amount and a maximum bid rate equal to the fixed rate of the main refinancing operations. Contrary to the Federal Reserve and the Bank of England, the Eurosystem did not use marketable assets to sterilise excess liquidity. However, the fixed-term deposits were eligible as collateral for the Eurosystem refinancing operations.
Excess liquidity provided by the Swiss National Bank (SNB) in 2008 was absorbed via both SNB bills (different maturities, from one week up to 12 months) and cash draining repo transactions. Whereas repo transactions were focused on steering interest rates, the main purpose of SNB bill issues was to absorb liquidity. The first SNB bills auction was held on 22 October 2008. Maximum outstanding amounts of SNB bills reached CHF 120 billion in 2011. At this stage, around 81% of reserves were absorbed via SNB bills. SNB bills can be used as collateral in money market repo transactions. In addition, SNB introduced a tiering system when negative interest

Large central bank balance sheets and market functioning 61
rates came into effect in January 2015, exempting part of the excess reserves from attracting the negative interest rate. In the case of Sweden, the Riksbank is one of the few central banks which has continued to drain liquidity throughout its asset purchase operations, rather than reverting to a floor system. Every week, it offers banks the opportunity to buy one-week central bank certificates at the policy rate. If reserves are only partially drained, then daily fine-tuning operations allow the remaining reserves to be placed overnight (at the policy rate less 10 basis points).
In Japan, when lowering its interest rates below zero in 2016, the Bank of Japan exempted part of excess reserves from accruing negative interest, introducing a tiering system.
As well as these examples for advanced economies, there are also similar experiences from emerging market economies – typically related to sterilisation of foreign exchange intervention and building of foreign exchange reserves.
In China, the People’s Bank of China (PBC) has absorbed liquidity by issuing PBC central bank bills, in addition to conducting repo transactions and hiking the required reserve ratio (RRR). This has allowed the PBC to sterilise most of the impact of the increase in its foreign reserves. Issuance by the central bank was suspended in 2013, due to the reversal of foreign exchange inflows.
In the case of the Central Bank of Brazil (CBB), issuance of Treasury bills (placed in the CBB securities portfolio) was necessary in order to sterilise the liquidity impact of the accumulation of international reserves. This monetary sterilisation was implemented through reverse repos. In 2008, given the scale of sterilisation required, it was necessary to approve new legislation that guaranteed the issuance of Treasury bills directly to the CBB securities portfolio, by the National Treasury, if at any time this portfolio dropped below a defined limit.
In the case of the Bank of Mexico, Treasury bills and floating rate notes were used to sterilise the liquidity impact of the accumulation of international reserves, particularly during 2010–11. More recently, however, the need to absorb liquidity has diminished. Treasury bills are therefore rarely used now, while the size of the FRN auctions has decreased. Treasury bills and FRNs are issued only for monetary regulation purposes; they are separate from those used by the Ministry of Finance for public finance purposes. The proceeds of these auctions are kept in a separate account at the Bank of Mexico and can only be used to repay these instruments at maturity and to pay their coupons.
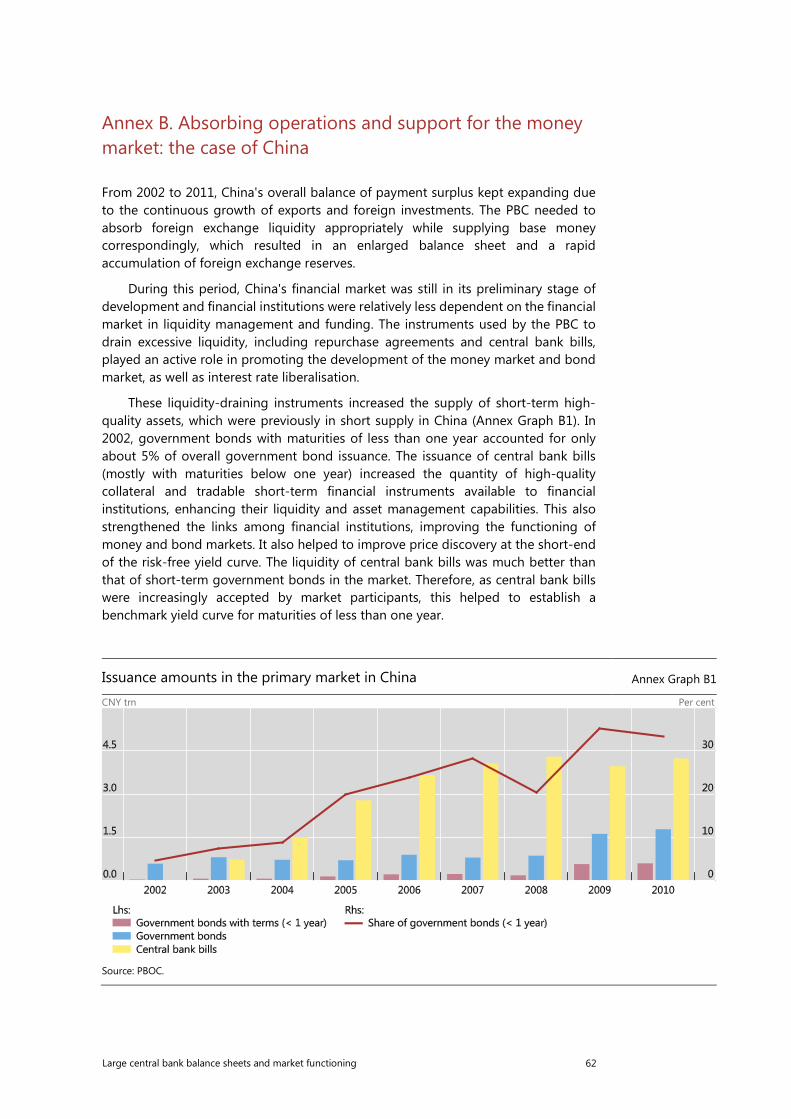
Large central bank balance sheets and market functioning 62
Annex B. Absorbing operations and support for the money market: the case of China
From 2002 to 2011, China's overall balance of payment surplus kept expanding due to the continuous growth of exports and foreign investments. The PBC needed to absorb foreign exchange liquidity appropriately while supplying base money correspondingly, which resulted in an enlarged balance sheet and a rapid accumulation of foreign exchange reserves.
During this period, China's financial market was still in its preliminary stage of development and financial institutions were relatively less dependent on the financial market in liquidity management and funding. The instruments used by the PBC to drain excessive liquidity, including repurchase agreements and central bank bills, played an active role in promoting the development of the money market and bond market, as well as interest rate liberalisation.
These liquidity-draining instruments increased the supply of short-term high-quality assets, which were previously in short supply in China (Annex Graph B1). In 2002, government bonds with maturities of less than one year accounted for only about 5% of overall government bond issuance. The issuance of central bank bills (mostly with maturities below one year) increased the quantity of high-quality collateral and tradable short-term financial instruments available to financial institutions, enhancing their liquidity and asset management capabilities. This also strengthened the links among financial institutions, improving the functioning of money and bond markets. It also helped to improve price discovery at the short-end of the risk-free yield curve. The liquidity of central bank bills was much better than that of short-term government bonds in the market. Therefore, as central bank bills were increasingly accepted by market participants, this helped to establish a benchmark yield curve for maturities of less than one year.
Issuance amounts in the primary market in China Annex Graph B1
CNY trn Per cent
Source: PBOC.

Large central bank balance sheets and market functioning 63
These policies also helped the broader development of the Chinese money market (Annex Graph B2). Previously, commercial banks had typically managed their liquidity through traditional measures, such as deposit and loan plans. The repurchase agreement transactions between the PBC and financial institutions helped them become more familiar with money market instruments. This has likely contributed to the rapid increase in transaction volumes in secured money markets.
Development of the Chinese money market Annex Graph B2
Repo market developments Transaction amounts in the secondary market CNY trn CNY trn
Source: PBOC.

Large central bank balance sheets and market functioning 64
Annex C. Description of tiered remuneration schemes
This following list briefly outlines tiered remuneration systems (including those of central banks that did not move policy rates into negative territory):
• In Denmark, the exemption threshold is implemented by a global limit to reserves that can be held in current accounts (currently remunerated at 0%), which breaks down into individual limits for banks. If the global limit is exceeded, all reserves held in the current accounts above the individual limits are converted into certificates of deposits (currently remunerated at –0.65%).
• In Norway, the central bank maintains a “quota system” for managing liquidity in the banking system where each bank is assigned a quota for their deposits with Norges Bank remunerated at the key policy rate (currently at 0.75%). Deposits in excess of the quota are remunerated at the reserve rate, eg 1 percentage point lower than the key policy rate (currently at –0.25%).
• In Switzerland, individual exemption thresholds for domestic banks are calculated as a multiplication of their reserve requirement from the time preceding the introduction of tiered regime, catering also for changes in the cash holdings. The SNB does not charge banks with negative interest rates on their cash deposits below specified thresholds, while reserves in excess are remunerated at the policy rate (currently at –0.75%).
• In Japan, the central bank introduced a three-tiered reserve deposit system where a negative interest rate (determined by the key policy rate, currently at –0.1%) is imposed on marginal excess reserves. Individual exemption thresholds for the first and the second tier, remunerated at 0.1% and 0% respectively, are calculated based on balances held by each bank in the benchmark period from January 2015 to December 2015 (tier 1) and the macro add-on derived from the reserve requirement and the amount of central bank’s lending programmes (tier 2).

Large central bank balance sheets and market functioning 65
Annex D: Further results from the CGFS/MC survey
Number of lending programmes launched each year by category Annex Graph D1
Sources: National submissions to CGFS/MC survey; study group calculations.
Purchase exclusion on eligible securities Annex Graph D2
Purchase exclusion on public assets Purchase exclusion on private assets
Source: National submissions to CGFS/MC survey.
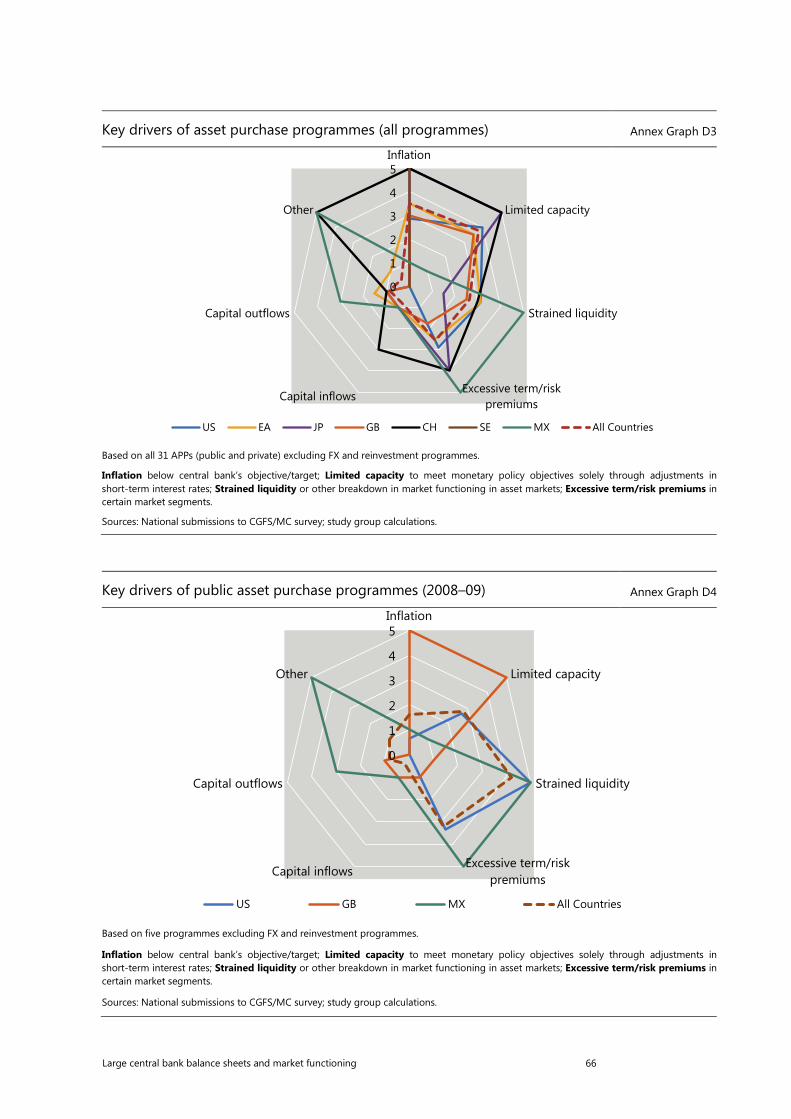
Large central bank balance sheets and market functioning 66
Key drivers of asset purchase programmes (all programmes) Annex Graph D3
Based on all 31 APPs (public and private) excluding FX and reinvestment programmes.
Inflation below central bank’s objective/target; Limited capacity to meet monetary policy objectives solely through adjustments in short-term interest rates; Strained liquidity or other breakdown in market functioning in asset markets; Excessive term/risk premiums in certain market segments.
Sources: National submissions to CGFS/MC survey; study group calculations.
Key drivers of public asset purchase programmes (2008–09) Annex Graph D4
Based on five programmes excluding FX and reinvestment programmes.
Inflation below central bank’s objective/target; Limited capacity to meet monetary policy objectives solely through adjustments in short-term interest rates; Strained liquidity or other breakdown in market functioning in asset markets; Excessive term/risk premiums in certain market segments.
Sources: National submissions to CGFS/MC survey; study group calculations.
0
1
2
3
4
5Inflation
Limited capacity
Strained liquidity
Excessive term/riskpremiums
Capital inflows
Capital outflows
Other
US EA JP GB CH SE MX All Countries
0
1
2
3
4
5Inflation
Limited capacity
Strained liquidity
Excessive term/riskpremiums
Capital inflows
Capital outflows
Other
US GB MX All Countries

Large central bank balance sheets and market functioning 67
Key drivers of public asset purchase programmes (2010 onwards) Annex Graph D5
Based on 13 programmes excluding FX and reinvestment programmes.
Inflation below central bank’s objective/target; Limited capacity to meet monetary policy objectives solely through adjustments in short-term interest rates; Strained liquidity or other breakdown in market functioning in asset markets; Excessive term/risk premiums in certain market segments.
Sources: National submissions to CGFS/MC survey; study group calculations.
Key drivers of private asset purchase programmes (2008–09) Annex Graph D6
Based on five programmes excluding FX and reinvestment programmes.
Inflation below central bank’s objective/target; Limited capacity to meet monetary policy objectives solely through adjustments in short-term interest rates; Strained liquidity or other breakdown in market functioning in asset markets; Excessive term/risk premiums in certain market segments.
Sources: National submissions to CGFS/MC survey; study group calculations.
0
1
2
3
4
5Inflation
Limited capacity
Strained liquidity
Excessive term/riskpremiums
Capital inflows
Capital outflows
Other
US EA JP GB SE All Countries
0
1
2
3
4
5Inflation
Limited capacity
Strained liquidity
Excessive term/riskpremiums
Capital inflows
Capital outflows
Other
US EA GB CH All Countries

Large central bank balance sheets and market functioning 68
Key drivers of private asset purchase programmes (2010 onwards) Annex Graph D7
Based on 10 programmes excluding FX and reinvestment programmes.
Inflation below central bank’s objective/target; Limited capacity to meet monetary policy objectives solely through adjustments in short-term interest rates; Strained liquidity or other breakdown in market functioning in asset markets; Excessive term/risk premiums in certain market segments.
Sources: National submissions to CGFS/MC survey; study group calculations.
CB securities holdings before and after public purchase programmes
In per cent Annex Graph D8
As share of eligible universe As share of balance sheet
All reinvestment and FX programmes were excluded from calculations.
Sources: National submissions to CGFS/MC survey; study group calculations.
0
1
2
3
4
5Inflation
Limited capacity
Strained liquidity
Excessive term/riskpremiums
Capital inflows
Capital outflows
Other
US EA JP GB All Countries

Large central bank balance sheets and market functioning 69
Guidelines for asset purchase programmes1 Annex Graph D9
Public assets2 Private assets3
1 All reinvestment and FX programmes were excluded from calculations. 2 Based on 19 programmes from US, EA, JP, GB, SE, MX. 3 Based on 16 programmes from US, EA, JP, GB, CH.
Sources: National submissions to CGFS/MC survey; study group calculations.
Summary of asset purchase programmes Annex Table D1
US
ECB / Eurosystem
JP GB CH SE MX
Start date of initial programme
12.05.2008 02.07.2009 19.03.2001 13.02.2009 12.03.2009 12.02.2015 08.10.2008
No of programmes
8 8 4 8 2 1 5
Programme types
Agency discount notes;
LSAP1 (x3); LSAP2; MEP; LSAP3 (x2)
CBPP1; SMP; CBPP2; CBPP3; ABSPP; PSPP;
CSP; OMT
QE; CME; QQE; QQE
with YC
APF (x3); QE1; QE2;
QE3; QE4 (x2)
FX intervention;
bond purchases
QE
FX intervention;
purchases IPAB
Are programmes still ongoing?
N Y Y N Y Y N
Purchased asset classes
Sovereign and public agency debt; agency
MBS
Sovereign, public agency
and other public sector debt; covered
bonds, ABS/MBS, corporate
bonds
Sovereign debt;
commercial paper,
ABS/MBS, corporate
bonds, ETF, REITs
Sovereign debt,
commercial paper,
corporate bonds
FX; covered bonds,
corporate bonds
Sovereign debt
Public agency debt; FX
Individual programme size as % GDP*
0.10–10% 0.17–18% 26–87% – 112% 7.60% 0.20–1.14%
Average purchase duration of individual programmes (years)*
0.25–9 4.3–7.6 7–12 – – 7 –
Sources: National submissions to CGFS/MC central bank survey.

Large central bank balance sheets and market functioning 70
Overview of asset purchase programmes Annex Table D2
Central Bank Programme name
Announcement date
Start date End date
Euro
pean
Cen
tral
Ban
k /
Euro
syst
em
CBPP1 - Covered Bond Purchase Programme 1 07.05.2009 02.07.2009 30.06.2010 SMP – Securities Markets Programme 10.05.2010 10.05.2010 06.09.2012 CBPP2 - Covered Bond Purchase Programme 2 06.10.2011 01.11.2011 31.10.2012 CBPP3 - Covered Bond Purchase Programme 3 04.09.2014 20.10.2014 Present ABSPP – Asset Backed Securities Purchase Programme 04.09.2014 21.11.2014 Present PSPP – Public Sector Purchase Programme 22.01.2015 09.03.2015 Present CSPP – Corporate Sector Purchase Programme 10.03.2016 08.06.2016 Present OMT – Outright Monetary Transactions 02.08.2012 Present
Bank
of J
apan
Quantitative Monetary Easing (QE) (from 19 March 2001 to 9 March 2006)
19.03.2001 19.03.2001 09.03.2006
Comprehensive Monetary Easing (from 5 October 2010 to 4 April 2013)
05.10.2010 05.10.2010 04.04.2013
Quantitative and Qualitative Monetary Easing (QQE) (from 4 April 2013 (up to now))
04.04.2013 04.04.2013 Present
Quantitative and Qualitative Monetary Easing with Yield Curve Control (QQE with YCC) (from 21 September 2016 (up to now))
21.09.2016 21.09.2016 Present
Bank
of M
exic
o Foreign exchange interventions (Extraordinary USD sale auctions) 08.10.2008 08.10.2008 23.10.2008 Foreign exchange interventions (Minimum price USD sale auctions) 09.10.2008 09.10.2008 09.04.2010
Foreign exchange interventions (direct spot USD sales) 04.02.2009 04.02.2009 27.02.2009
Foreign exchange interventions (USD sale auctions) 05.03.2009 09.03.2009 30.09.2009
Purchase of IPAB (deposit insurance public agency) securities 30.10.2008 04.11.2008 18.11.2008
Sver
iges
Ri
ksba
nk
QE programme 12.02.2015 26.02.2015 Present
Swis
s N
atio
nal
Bank
FX interventions 12.03.2009 12.03.2009 Present
Bond purchases 12.03.2009 12.03.2009 31.09.2009
Bank
of E
ngla
nd APF1 - Commercial Paper 19.01.2009 13.02.2009 15.11.2011
APF2 - Corporate Bonds 19.01.2009 25.03.2009 29.11.2012 QE1 - Gilts 05.03.2009 11.03.2009 28.01.2010 APF3 - Secured Commercial Paper 30.07.2009 30.11.2010 Present QE2 - Gilts 06.10.2011 10.10.2011 03.05.2012
QE3 - Gilts 05.07.2012 12.07.2012 01.11.2012 QE4 - Gilts 04.08.2016 08.08.2016 01.02.2017 QE4- Corporate Bonds 04.08.2016 27.09.2016 27.04.2017
Boar
d of
Gov
erno
rs o
f th
e Fe
dera
l Re
serv
e Sy
stem
Agency Discount Notes 19.09.2008 19.09.2008 26.09.2008
LSAP1 + LSAP1 expansion - Agency MBS
Initial programme: 25.11.2008 Expansion: 18.03.2009
05.01.2009 31.03.2010
LSAP1 + LSAP1 expansion - Agency Debt
Initial programme: 25.11.2008 Expansion: 18.03.2009
05.12.2008 24.03.2010
LSAP1 expansion - Treasuries 18.03.2009 25.03.2009 29.10.2009
LSAP2 3.11.2010 12.11.2010 30.06.2011 MEP 21.09.2011 03.10.2011 31.12.2012
LSAP3 - Agency MBS 13.09.2012 01.10.2012 29.10.2014 LSAP3 - Treasuries 12.12.2012 03.01.2013 29.10.2014

Large central bank balance sheets and market functioning 71
Overview of lending programmes Annex Table D3
Central Bank Programme name Start date
Rese
rve
Bank
of
Aus
tral
ia
Longer terms and wider collateral rules in (existing) open market operations
08.10.2008
USD Swap facility with the US Federal Reserve 24.09.2008
Bank
of
Cana
da
Term Purchase and Resale Agreement (Term PRA) 12.12.2007
Term PRA (amended) 21.04.2009
Term PRA for private sector money market instruments
14.10.2008
Term PRA for private sector instruments 23.02.2009
Term Loan Facility 12.11.2008
US-dollar (and other currency) swap facility 18.09.2008
Overnight Standing PRA Facility 21.04.2009
Standing Liquidity Facility 31.03.2008
Euro
pean
Cen
tral
Ban
k
Three-year LTRO The two three-year LTRO were settled in December 2011 and February 2012.
TLTRO TLTRO I operations are represented by a series of eight operations conducted at quarterly intervals starting in September 2014.
TLTRO-II
The second series of the TLTRO programme consists of four targeted longer-term refinancing operations (TLTRO II), each with a maximum maturity of four years (and an option for voluntary early repayment two years after take-up), conducted at a quarterly frequency, starting in June 2016.
Fixed rate full allotment
Money market tensions in August 2007 were addressed with a few fixed rate full allotment tenders with overnight maturity. With effect from 15 October 2008, fixed rate full allotment policy was introduced in all refinancing operations for the different maturities.
Bank
of J
apan
18 September 2008: Introduction of US dollar funds-supplying operations against pooled collateral
18.09.2008
14 October 2008: Introduction of measures to improve liquidity in the JGB repo market
14.10.2008
14 October 2008: Introduction of measures to facilitate corporate financing in the market
14.10.2008
19 December 2008: Introduction of the special funds-supplying operations to facilitate corporate financing
19.12.2008
15 June 2010: Introduction of the fund-provisioning measure to support strengthening the foundations for economic growth
15.06.2010
21 December 2011: Introduction of the funds-supplying operations against pooled collateral for the four currencies other than the US dollar
21.12.2011
20 December 2012: Establishment of the loan support programme
20.12.2012

Large central bank balance sheets and market functioning 72
Overview of lending programmes (continued) Annex Table D3
Central Bank Programme name Start date
Bank
of
Kore
a
Purchase of long-term and non-regular RPs and reduction of regular RP sales
18.09.2008
Outright purchase of government bonds and Interim redemption of MSBs
23.10.2008
Expansion of eligible collateral and counterparts 27.10.2008
Aggregate credit ceiling loans 23.10.2008
Interest on reserves 03.12.2008
Foreign currency liquidity provision 02.12.2008
Bond market stabilisation fund 24.11.2008
Bank recapitalisation fund 26.03.2009
Banc
o de
M
éxic
o Long-term USD credit auction 21.04.2009
Interest rate swap auctions 14.11.2008
Additional liquidity facility 13.10.2008
Swis
s N
atio
nal B
ank
As part of the swap arrangement with all major central banks, the SNB has conducted US dollar repo auctions since December 2007.
17.12.2007
The SNB introduced a fixed rate full allotment policy as of 29 October 2008 onwards. The goal was to allocate liquidity to foreign banks that were seeking CHF more directly.
29.10.2008
The SNB also announced jointly with the ECB and, subsequently, with the Narodowy Bank Polski and the Magyar Nemzeti Bank, to indirectly distribute Swiss franc funds via EUR CHF swaps with these central banks.
20.10.2008 (ECB), 17.11.2008 (Narodowy Bank Polski), 02.02.2009 (Magyar Nemzeti Bank)
The SNB reduced the spread for the liquidity shortage financing facility (discount window) from 200 to 50 bp above market rates in 2008.
1.01.2009
It conducted long-term repos starting in March 2009.
Mid-March 2009/end-April 2009 (daily repos with maturity of up to one year and interest rate of 0.05%) and June 2009/November 2009 (repos every two weeks with a maturity of three months)
With the aim of dampening the appreciation pressure on the CHF, the SNB provided the market with ample liquidity in summer 2011 using FX swaps.
10.08.2011

Large central bank balance sheets and market functioning 73
Overview of lending programmes (continued) Annex Table D3
Bank
of
Engl
and
Special Liquidity Scheme (SLS) 21.04.2008
Funding for Lending Scheme (FLS) 01.08.2012
Term Funding Scheme (TFS) 19.09.2016
Boar
d of
Gov
erno
rs o
f th
e Fe
dera
l Res
erve
Sys
tem
Primary Credit (modified) 17.08.2007
Term Auction Facility (new) 12.12.2007
Central bank dollar liquidity swaps (new) 12.12.2007
Central bank foreign exchange liquidity swaps (new) 06.04.2009
Primary Dealer Credit Facility (new) 17.03.2008
Term Securities Lending Facility (new) 11.03.2008
Asset-Backed Commercial Paper Money Market Mutual Fund Liquidity Facility (new)
19.09.2008
Commercial Paper Funding Facility (new) 07.10.2008
Term Asset-Backed Securities Lending Facility (new) 25.11.2008
Term Securities Lending Facilities Options Programme (new)
30.07.2008
Sources: National submissions to CGFS/MC survey.

Large central bank balance sheets and market functioning 74
Central banks’ usage of quantity indicators to monitor market functioning Annex Table D4
Gov’t bonds 44% 50% 50% 56% 69% 88%
Other bonds 31% 19% 38% 38% 44% 75%
Sources: National submissions to CGFS/MC survey.
Central banks’ usage of price indicators to monitor market functioning Annex Table D5
Gov’t bonds 50% 56% 56% 56% 69% 69% 81% 88%
Other bonds
19% 31% 19% 38% 13% 69% 38% 63%
Sources: National submissions to CGFS/MC survey.

Large central bank balance sheets and market functioning 75
Annex E: Large central bank balance sheets and bond market functioning – a comprehensive literature review
This annex comprehensively reviews the empirical literature investigating the impact of central bank balance sheet expansion on the functioning of bond markets. Table E.1 at the end of this annex provides a synthesis of the empirical findings in the literature. The following list briefly summarises some key findings of the empirical studies:
• Schlepper et al (2018) use transaction-level data to assess the impact of Bundesbank purchases within the PSPP on bund market functioning. They find that aggregated bid–ask spreads rose over the sample period, but dropped on purchase days for purchased bonds. The latter result may suggest that predictable large trades can enhance liquidity conditions by allowing dealers to compete for order flow. The authors also show that order book depth falls for bonds that are purchased with the impact “more stable and not driven by bond-specific effects” compared with that on bid-ask spreads. This could arise due to the scarcity effects induced by the purchases, depleting dealers’ inventory positions. Moreover, they show that the price impact of Bundesbank asset purchases is greater on days when the market for a particular bond is illiquid pointing to supply constraints for quoting dealers.
• De Pooter et al (2018) estimate the effects of asset purchases within the Securities Market Programme (SMP) carried out by the ECB between May 2010 and September 2012 on sovereign bond liquidity premia. The liquidity premium for Portugal, Ireland, Italy and Spain is estimated using the CDS-bond basis. The authors provide evidence that the SMP reduced the liquidity premia of the purchased sovereign bonds, indicating an improvement in market liquidity.
• Boermans and Keshkov (2018) examine the impact of the PSPP on the ownership concentration of sovereign bond markets. Using detailed security-by-security holdings data, they find that, during the actual implementation phase of the PSPP, the asset purchases increased the ownership concentration of the PSPP-eligible sovereign bonds, potentially due to asymmetric portfolio rebalancing. The authors argue that QE had market-distortionary effects, underlining the growing concerns for bond scarcity, market liquidity dry-ups and price spikes in the European sovereign bond market.
• Steeley (2015) uses security-level bond data to assess the potential side effects of QE on the UK gilt market. He finds that QE had “mostly favourable” side effects for the operational and price efficiency of the gilt market; any unfavourable effects appeared to have been temporary. QE resulted in a substantial and statistically significant drop in the cost of trading gilts, with the median bid-ask spread dropping to one-half its level prior to QE1; this level has been sustained since this time, and did not increase in the period between QE1 and QE2.
• Kurosaki et al (2015) analyse liquidly conditions in the JGB cash, futures and repo market, focusing on the period following the expansion of QQE at the end of October 2014. The authors use high-frequency transaction-level data to evaluate the impact on several liquidity metrics. They find that, while traditional measures of market liquidity suggest that liquidity in the JGB futures market has not declined significantly, measures of market depth and resilience indicate that the functioning of the JGB cash and futures market has been declining.

Large central bank balance sheets and market functioning 76
• Pelizzon et al (2018) assess the impact of the BoJ’s QE programmes on liquidity in the JGB market using daily observations of nominal coupon JGBs. The authors find that, between 2011 and 2016, BoJ demand led to an improvement in liquidity as measured by bid-ask spreads, but that liquidity subsequently deteriorated over time due to the shrinkage in the available supply of bonds.
• Sakiyama and Kobayashi (2018) use transaction data from inter-dealer transactions in the JGB market to examine four market liquidity indicators: volume, tightness, depth and resiliency. The authors find that liquidity indicators for inter-dealer transactions in the JGB cash market worsened considerably at the beginning of 2016, but this could reflect the introduction of negative interest rate policy rather than asset purchases. They find liquidity conditions have gradually improved since the fall of 2016.
• Iwatsubo and Taishi (2016) study how the BoJ’s purchasing policy changes affected market liquidity using intraday quote and transaction data for the JGB bonds and futures markets. They provide evidence that, since the start of QQE in April 2013, three specific policy changes, namely an increased purchasing frequency; a decrease in the purchase amount per transaction; and reduced variability in the purchase amounts had a positive impact on JGB market liquidity, as captured by the decrease in quote spreads and Amihud’s illiquidity measure.
• Han and Seneviratne (2018) use security-level data from the JGB market to assess the impact of the BoJ purchases of JGBs on bid-ask spreads. The authors find strong evidence of adverse scarcity effects on market liquidity. Moreover, they also find evidence that such scarcity effects become more pronounced when the share of the BoJ’s holdings exceeds certain thresholds, suggesting that whether flow effects are positive or negative for market functioning may depend on the stock of central bank holdings. Using data from the BoJ’s Securities Lending Facility, they show that it reduced the impact of scarcity effects of the BoJ’s purchases on JGB market liquidity.
• Hattori (2018) analyses the liquidity conditions in the JGB market using the smoothness of the yield curve as a proxy for market liquidity. The author shows that the QQE policy led to a temporary increase in the liquidity premium. The rise is especially pronounced following the announcement by the BoJ. Over a longer time period, however, he finds that the liquidity premium has continued to decrease, even after QQE ended. The author also shows that the BoJ’s Securities Lending Facility has partially improved the liquidity condition by reducing about 8% of the illiquidity premium.
• Kandrac et al (2013) examine security-level transaction data to assess the flow effects that occur at the time (and as a result) of asset purchase transactions on liquidity of Treasuries. The authors detect no evidence of liquidity disruptions in the Treasuries market as a result of Fed purchases, no evidence for systematic liquidity flow effects in any of the large-scale APPs, and that the result holds even as the Fed’s ownership of individual securities increased.
• Kandrac (2014) gauges the impact of Fed purchases of MBS on liquidity in the MBS market. He finds that Fed purchases of MBS negatively affected volumes, trade sizes and implied financing rates in dollar roll transactions, particularly in the months after the commencement of a new purchase programme. The effects were modest in magnitude, short-lived, or both. He also shows that bid-ask spreads were insensitive to Federal Reserve purchases, although there is evidence of a brief widening in spreads as a result of purchases that occurred

Large central bank balance sheets and market functioning 77
early on in the QE3 programme. Kandrac also finds evidence of crowding out caused by the Fed purchases, consistent with portfolio balancing effects that cause investors to move into similar securities in response to Fed purchases.
• Kandrac and Schlusche (2013) find that purchases of nominal Treasury securities as part of QE have no discernible effect on the bid-ask spreads of the traded securities. The authors show that this result persists even if the Federal Reserve holds sizeable amounts of the purchased securities, or if purchases are large relative to the amount of the security outstanding.
• Christensen and Gillan (2018) provide evidence that purchases of TIPS during QE2 did not impair market functioning, and may have improved liquidity in the market. For the duration of the programme, they find the liquidity premium measure for TIPS to have averaged about 10 basis points lower than expected. However, such liquidity effects appear to be limited to the targeted securities.
• Boneva et al (2019) study the impact of the BoE’s Corporate Bond Purchase Scheme (CBPS) on the liquidity of sterling corporate bonds using a data set combining transaction-level data from the secondary corporate bond market with proprietary offer-level data from the CBPS auctions. The authors find that the CBPS purchases improved the liquidity of purchased bonds in the week following the purchase. The reduction in trading costs and price impact are consistent with the flow channel stating that predictable demand from the CBPS made dealers more willing to hold market-making inventory. However, the liquidity effect is short-lived and there is no evidence that the liquidity of purchased bonds changed systematically over the course of the programme relative to non-purchased bonds.
Empirical evidence in related markets
There is also evidence for the impact of large central bank balance sheet expansion from related markets, most notably repo. For example, individual equity and bond lines exhibit an increase in trading volumes around the time of their inclusion or exclusion in major stock and bond indexes. Some studies also look at scarcity issues prevalent in the repo market due to a reduced free float of bonds. Large-scale asset purchases may also lead to certain sovereign bonds becoming scarce on the repo market. The reasoning is that, if the bonds are purchased primarily from investors who are also active on the repo market, the supply of acquired bonds on the repo market may fall.45 The empirical evidence mainly supports the existence of scarcity effects due to central banking purchases.
Some takeaways of individual studies are provided below:
• Arrata et al (2017) explore the interlinkages between the Eurosystem PSPP and the repo market between January 2015 and May 2017. They show that the PSPP contributes to depressing repo rates, in particular prior to January 2017. This is happening through two channels: first, by increasing the scarcity of the bonds purchased and second, by increasing the amount of excess liquidity.
45 If the central bank does not make the bonds available for lending. If it does make them available for
lending, the availability in the repo market may actually increase. Perhaps the more accurate channel is the fact that with less free float a market-maker needs more time to get hold of a bond.

Large central bank balance sheets and market functioning 78
• Jank and Mönch (2018) study the extent to which purchases of German Bunds within the PSPP have affected the repo market. They show that a bond’s specialness spread rises significantly in response to the bond purchase. However, they provide evidence that the introduction of the cash lending facility in December 2016 dampens these scarcity effects.
• Corradin and Maddaloni (2017) analyse how shocks to supply and demand in the cash market in the course of the Eurosystem’s SMP affected the specialness of Italian sovereign bonds in the repo market. The authors find evidence that SMP purchases led to a higher specialness through a reduced free float of available assets, resulting from the auction cycle and the amounts that were in the portfolios of buy-to-hold investors. The impact on specialness is sizeable and persistent for around two weeks. One consequence of the purchases was that short-selling traders had to pay a net premium to close their positions and therefore may have more often decided to fail on their delivery. Fail-to-deliver transactions were indeed more likely for bonds that were bought under the programme.
• D’Amico et al (2018) estimate scarcity effects in the repo rates of all outstanding US Treasury securities by analysing security-specific demand and supply factors based on security-level data. The authors provide evidence for a significant scarcity premium depending on the security's characteristics, with the larger effects concentrated in on-the-run and shorter-term securities. This scarcity effect persists over several months, passes through to Treasury cash market prices, and explains a significant portion of the flow effects of the APPs.
• The CGFS paper (2017) on repo market functioning has analysed the relative importance of different drivers of repo market changes. The findings highlight a significant variation in the functioning and structure of international repo markets since the global financial crisis. On one hand, the broad-based central bank asset purchases have reduced incentives for firms to conduct repo transactions to meet reserves targets, easing pressures on repo markets. On the other hand, they may have led to greater scarcity of collateral, and intensified pressures on intermediaries’ balance sheets by increasing their holdings of cash.
• Singh (2013) argues that, when collateral use drops, financial intermediation slows, with effects similar to the drying up of interbank markets; velocity of collateral has been adversely impacted due to central bank actions in recent years and this has limited the re-use rate of collateral and the scope for it to be pledged in financial markets.
• International Monetary Fund (2015), Global Financial Stability Report, October issue, Washington, DC, examines the factors that influence the level of market liquidity and those that affect its resilience, and finds that cyclical factors, including monetary policy, play an important role. In particular, it conceptually outlined the channels through which market liquidity and resilience is affected by central banks’ large-scale purchases of securities under unconventional monetary policy.

Large central bank balance sheets and market functioning 79
Literature review: overview of market functioning impact across jurisdictions Annex Table E1
Market Type Flow channel
effects (pos+/neg-)
Scarcity effects Market
ecosystem channel effects
US Nominal
Treasuries Gov’t No effect
US MBS Agency Ambiguous US US TIPS TIPS + JP JGBs Gov’t – –
EA Non-core Europe
Gov’t bonds Gov’t +
NL Dutch gov’t
Bonds Gov’t –
DE Bunds Gov’t Ambiguous – GB Gilts Gov’t +
GB UK corporate
bonds Private + +
US Repo market Gov’t as
Collateral – –
EA Repo market Gov’t as collateral
–
DE Repo market Gov’t as collateral
–
IT Repo market Gov’t as collateral
–
Source: Study group classification based on review of the empirical literature cited above.

Large central bank balance sheets and market functioning 80
Annex F: Size and composition of central bank balance sheets since the GFC
Central bank balance sheets In billions of national currency Annex Graph F1
Federal Reserve — Assets Federal Reserve — Liabilities
Eurosystem — Assets Eurosystem — Liabilities
Bank of Japan — Assets (100 bn) Bank of Japan — Liabilities (100 bn)
Source: National data.

Large central bank balance sheets and market functioning 81
Central bank balance sheets In billions of national currency Annex Graph F2
Bank of England — Assets Bank of England — Liabilities
Swiss National Bank — Assets Swiss National Bank — Liabilities
Sveriges Riksbank — Assets Sveriges Riksbank — Liabilities
Source: National data.

Large central bank balance sheets and market functioning 82
Central bank balance sheets
In billions of national currency Annex Graph F3
Reserve Bank of Australia — Assets Reserve Bank of Australia — Liabilities
Bank of Canada — Assets Bank of Canada — Liabilities
Hong Kong Monetary Authority — Assets Hong Kong Monetary Authority — Liabilities
Source: National data.

Large central bank balance sheets and market functioning 83
Central bank balance sheets
In billions of national currency Annex Graph F4
Reserve Bank of India — Assets Reserve Bank of India — Liabilities
Bank of Korea — Assets (trn) Bank of Korea — Liabilities (trn)
Monetary Authority of Singapore — Assets Monetary Authority of Singapore — Liabilities
Source: National data.

Large central bank balance sheets and market functioning 84
Central bank balance sheets
In billions of national currency Annex Graph F5
Central Bank of Brazil — Assets Central Bank of Brazil — Liabilities
Bank of Mexico — Assets Bank of Mexico — Liabilities
Source: National data.

Restricted
Large central bank balance sheets and market functioning 85
Members of the study group
Co-Chair, Federal Reserve Bank of New York Co-Chair, European Central Bank
Lorie Logan Ulrich Bindseil
Reserve Bank of Australia Christian Vallence
National Bank of Belgium Christoph Machiels
Central Bank of Brazil Joao H Freitas Simao Juan Pablo Painceira Paschoa
Bank of Canada Kaetlynd McRae Matthieu Truno
People’s Bank of China Dong Yiwei
European Central Bank Alexander Düring Iwona Durka
Bank of France William Arrata Vincent Grossmann-Wirth
Deutsche Bundesbank Kathi Schlepper Felix Mohing
Hong Kong Monetary Authority John Zhu
Reserve Bank of India Rakesh Tripathy
Bank of Italy Stefano Iacobelli Gaetano Marseglia
Bank of Japan Shun Kobayashi
Bank of Korea Jaehyun Yoo Chanjun Park
Bank of Mexico Gerardo Molina Mayte Rico Fernández
Netherlands Bank Jorien Freriks
Monetary Authority of Singapore Jovine Loy Jiang Yan Pang
Bank of Spain Adrian van Rixtel
Sveriges Riksbank David Kjellberg
Swiss National Bank Matthias Juettner
Bank of England Nick McLaren Aakash Mankodi
Board of Governors of the Federal Reserve System Alain Chaboud
Federal Reserve Bank of New York Linsey Molloy Frank Keane
Bank for International Settlements Andreas Schrimpf (Secretary) Egemen Eren
Workstreams were led by Shun Kobayashi (bond markets) and Nick McLaren (money markets). Deborah Leonard (FRBNY) acted as survey coordinator in initial project stages. Other important contributions were made by Monika Znidar, Irene Katsalirou, Riccardo Costantini (all ECB); James Engelhof, Seth Searls, Samuel Zief (all FRBNY), Josh Fernandes (BoC) and Roman Santos (BdE). Taejin Park (BIS) provided excellent research support.