Embed Size (px)
Citation preview
9 March, 2018Lara Iriarte CMT
Lara’s Weekly S&P500 + GOLD + USOIL Elliott Wave & Technical Analysis
Lara’s Weekly 9 March, 2018
S&P 500
GOLD
US OIL
About
Disclaimer
Contents
2
3
15
26
35
35
Lara’s Weekly 9 March, 2018
More upwards movement to 2,754 – 2,758 was expected for Friday’s session. Price moved higher, but the target was inadequate.
Summary: Expect upwards movement to overall continue next week. The target is either 2,869 or 3,006 for the short term.
If price makes a new all time high with a bullish signal from On Balance Volume and the AD line, or reasonable support from volume, then it is possible that the pullback was over on the 9th of February and the bull market has resumed. But if weakness in upwards movement is seen, then it may be a B wave and doomed to full retracement.
For now have some reasonable confidence in upwards movement next week with a bullish signal from On Balance Volume, VIX, and the AD line.
The biggest picture, Grand Super Cycle analysis, is here.
Last historic analysis with monthly charts is here. Video is here.
An alternate idea at the monthly chart level is given here at the end of this analysis.
An historic example of a cycle degree fifth wave is given at the end of the analysis here.
S&P 500
3
Always practice good risk management. Always trade with stops and invest only 1-5% of equity on any one trade.
Lara’s Weekly 9 March, 2018
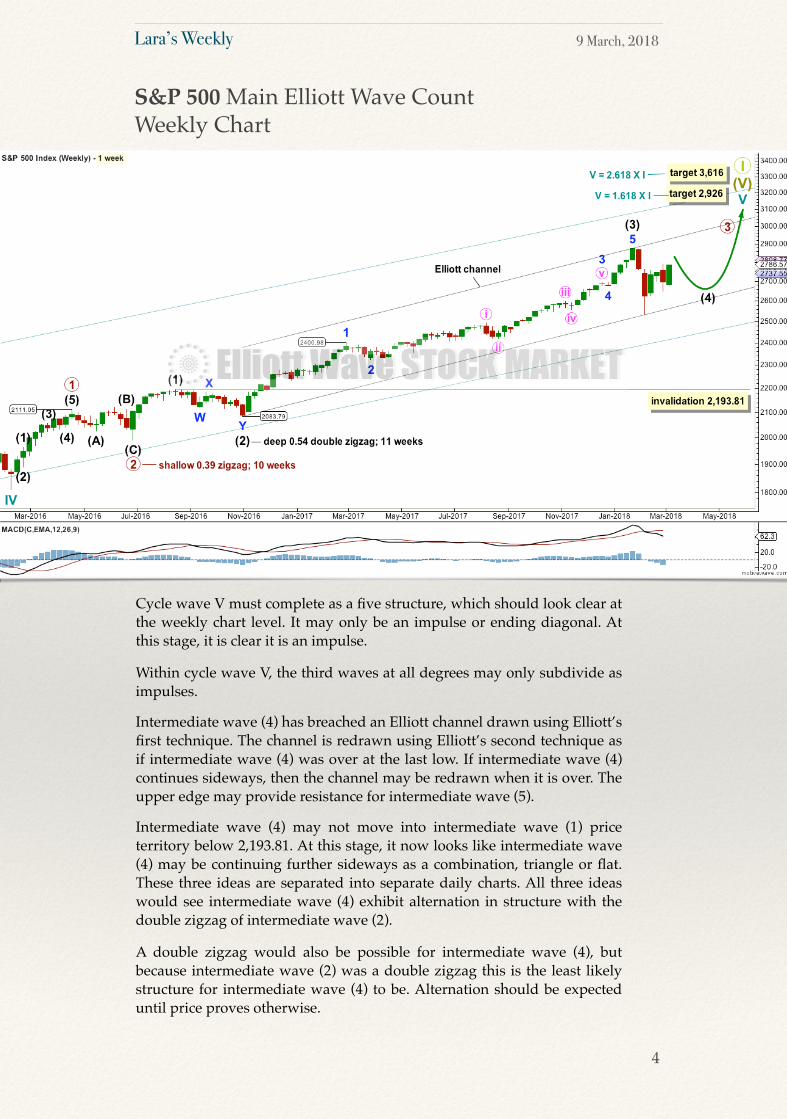
Cycle wave V must complete as a five structure, which should look clear at the weekly chart level. It may only be an impulse or ending diagonal. At this stage, it is clear it is an impulse.
Within cycle wave V, the third waves at all degrees may only subdivide as impulses.
Intermediate wave (4) has breached an Elliott channel drawn using Elliott’s first technique. The channel is redrawn using Elliott’s second technique as if intermediate wave (4) was over at the last low. If intermediate wave (4) continues sideways, then the channel may be redrawn when it is over. The upper edge may provide resistance for intermediate wave (5).
Intermediate wave (4) may not move into intermediate wave (1) price territory below 2,193.81. At this stage, it now looks like intermediate wave (4) may be continuing further sideways as a combination, triangle or flat. These three ideas are separated into separate daily charts. All three ideas would see intermediate wave (4) exhibit alternation in structure with the double zigzag of intermediate wave (2).
A double zigzag would also be possible for intermediate wave (4), but because intermediate wave (2) was a double zigzag this is the least likely structure for intermediate wave (4) to be. Alternation should be expected until price proves otherwise.
S&P 500 Main Elliott Wave CountWeekly Chart
4
Lara’s Weekly 9 March, 2018
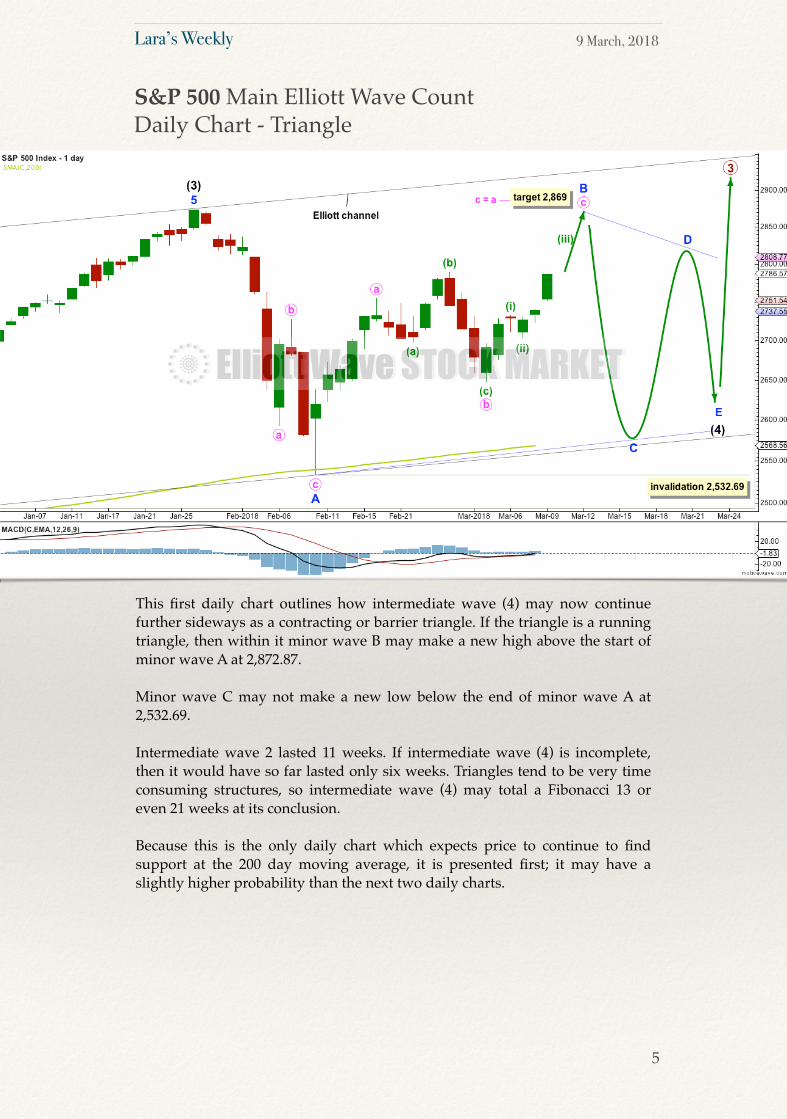
This first daily chart outlines how intermediate wave (4) may now continue further sideways as a contracting or barrier triangle. If the triangle is a running triangle, then within it minor wave B may make a new high above the start of minor wave A at 2,872.87.
Minor wave C may not make a new low below the end of minor wave A at 2,532.69.
Intermediate wave 2 lasted 11 weeks. If intermediate wave (4) is incomplete, then it would have so far lasted only six weeks. Triangles tend to be very time consuming structures, so intermediate wave (4) may total a Fibonacci 13 or even 21 weeks at its conclusion.
Because this is the only daily chart which expects price to continue to find support at the 200 day moving average, it is presented first; it may have a slightly higher probability than the next two daily charts.
S&P 500 Main Elliott Wave CountDaily Chart - Triangle
5
Lara’s Weekly 9 March, 2018
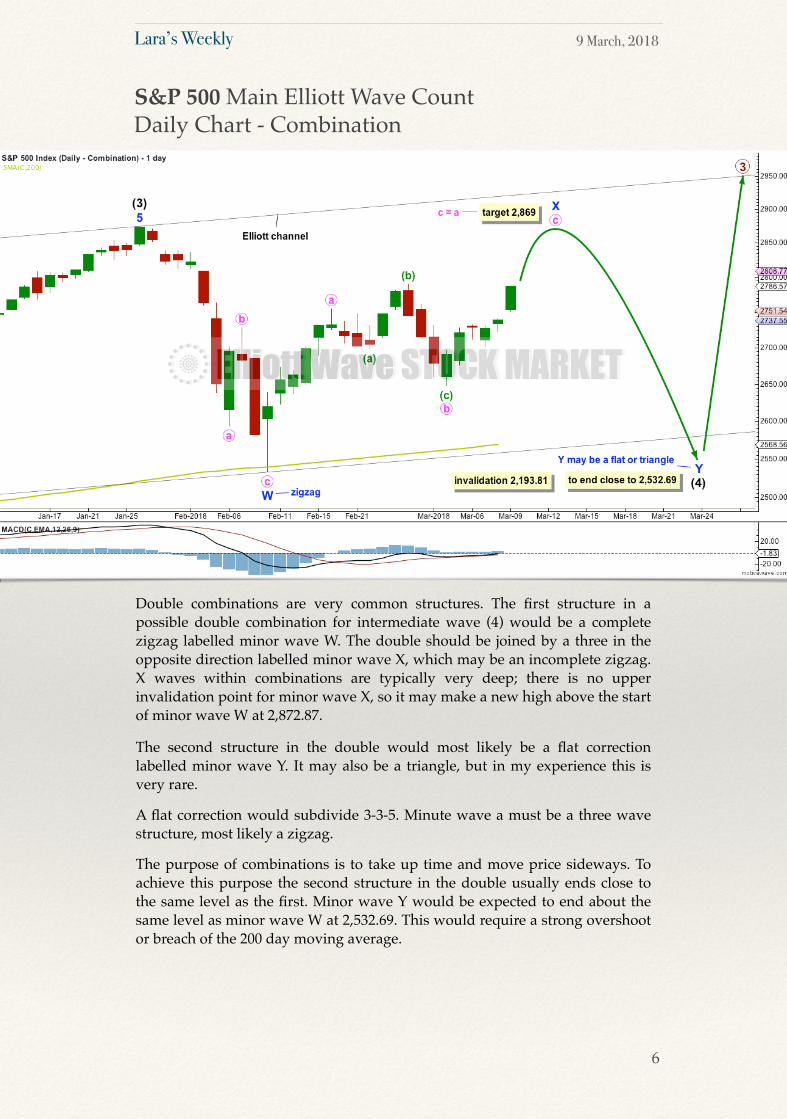
Double combinations are very common structures. The first structure in a possible double combination for intermediate wave (4) would be a complete zigzag labelled minor wave W. The double should be joined by a three in the opposite direction labelled minor wave X, which may be an incomplete zigzag. X waves within combinations are typically very deep; there is no upper invalidation point for minor wave X, so it may make a new high above the start of minor wave W at 2,872.87.
The second structure in the double would most likely be a flat correction labelled minor wave Y. It may also be a triangle, but in my experience this is very rare.
A flat correction would subdivide 3-3-5. Minute wave a must be a three wave structure, most likely a zigzag.
The purpose of combinations is to take up time and move price sideways. To achieve this purpose the second structure in the double usually ends close to the same level as the first. Minor wave Y would be expected to end about the same level as minor wave W at 2,532.69. This would require a strong overshoot or breach of the 200 day moving average.
S&P 500 Main Elliott Wave CountDaily Chart - Combination
6
Lara’s Weekly 9 March, 2018
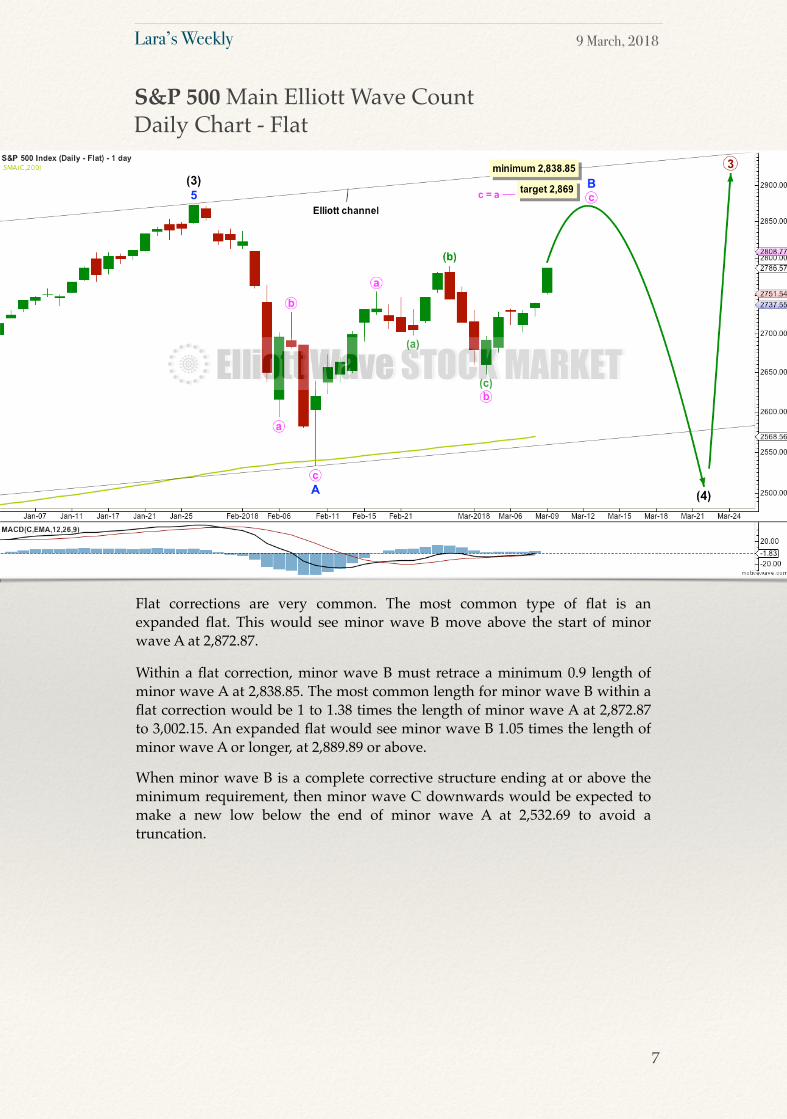
Flat corrections are very common. The most common type of flat is an expanded flat. This would see minor wave B move above the start of minor wave A at 2,872.87.
Within a flat correction, minor wave B must retrace a minimum 0.9 length of minor wave A at 2,838.85. The most common length for minor wave B within a flat correction would be 1 to 1.38 times the length of minor wave A at 2,872.87 to 3,002.15. An expanded flat would see minor wave B 1.05 times the length of minor wave A or longer, at 2,889.89 or above.
When minor wave B is a complete corrective structure ending at or above the minimum requirement, then minor wave C downwards would be expected to make a new low below the end of minor wave A at 2,532.69 to avoid a truncation.
S&P 500 Main Elliott Wave CountDaily Chart - Flat
7
Lara’s Weekly 9 March, 2018
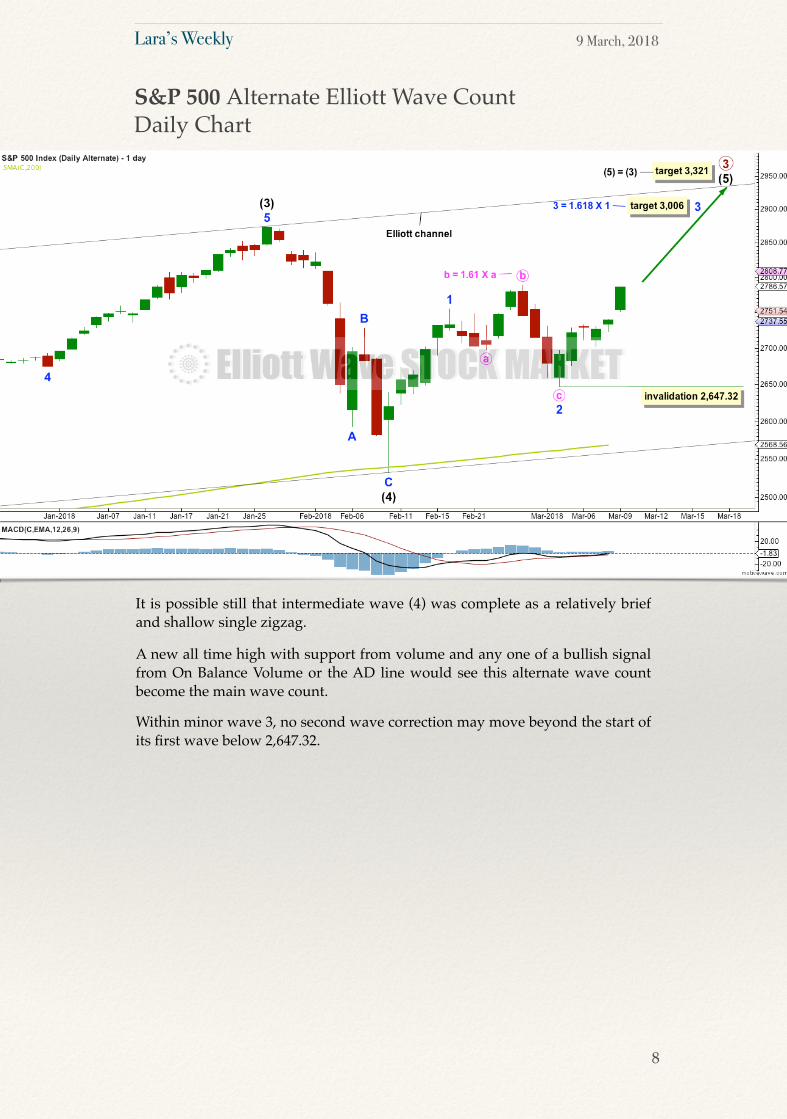
It is possible still that intermediate wave (4) was complete as a relatively brief and shallow single zigzag.
A new all time high with support from volume and any one of a bullish signal from On Balance Volume or the AD line would see this alternate wave count become the main wave count.
Within minor wave 3, no second wave correction may move beyond the start of its first wave below 2,647.32.
S&P 500 Alternate Elliott Wave CountDaily Chart
8
Lara’s Weekly 9 March, 2018
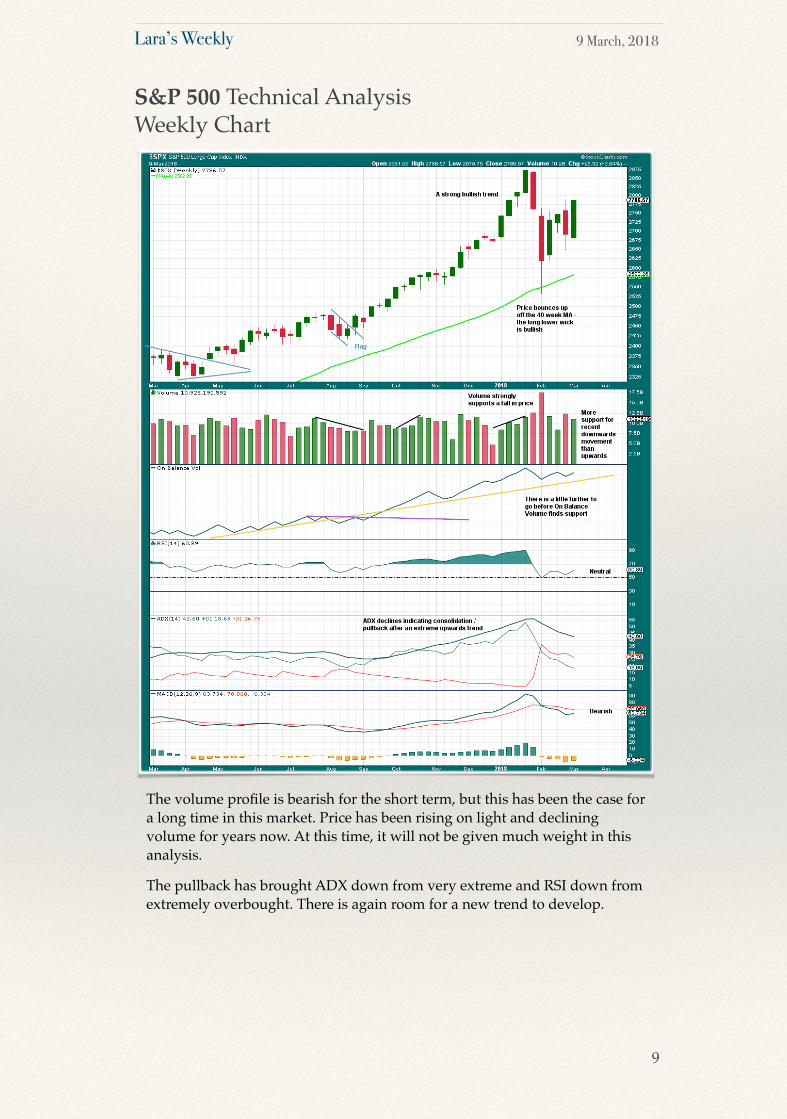
The volume profile is bearish for the short term, but this has been the case for a long time in this market. Price has been rising on light and declining volume for years now. At this time, it will not be given much weight in this analysis.
The pullback has brought ADX down from very extreme and RSI down from extremely overbought. There is again room for a new trend to develop.
S&P 500 Technical AnalysisWeekly Chart
9
Lara’s Weekly 9 March, 2018
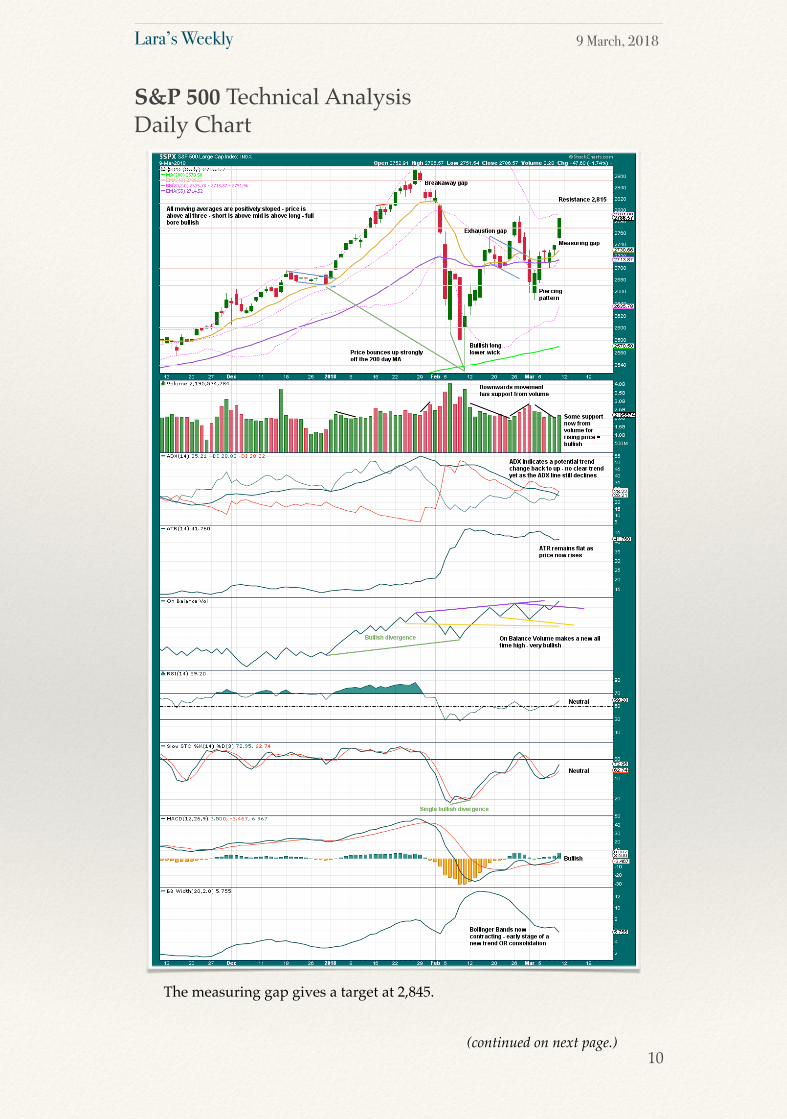
The measuring gap gives a target at 2,845.
S&P 500 Technical AnalysisDaily Chart
10(continued on next page.)
Lara’s Weekly 9 March, 2018
A strong bullish candlestick for Friday with some support from volume, along with a strong bullish signal from On Balance Volume, gives some confidence in expectations of more upwards movement here.
Neither RSI nor Stochastics are yet overbought. There is room for price to rise further.
S&P 500 Technical AnalysisDaily Chart
11
Lara’s Weekly 9 March, 2018
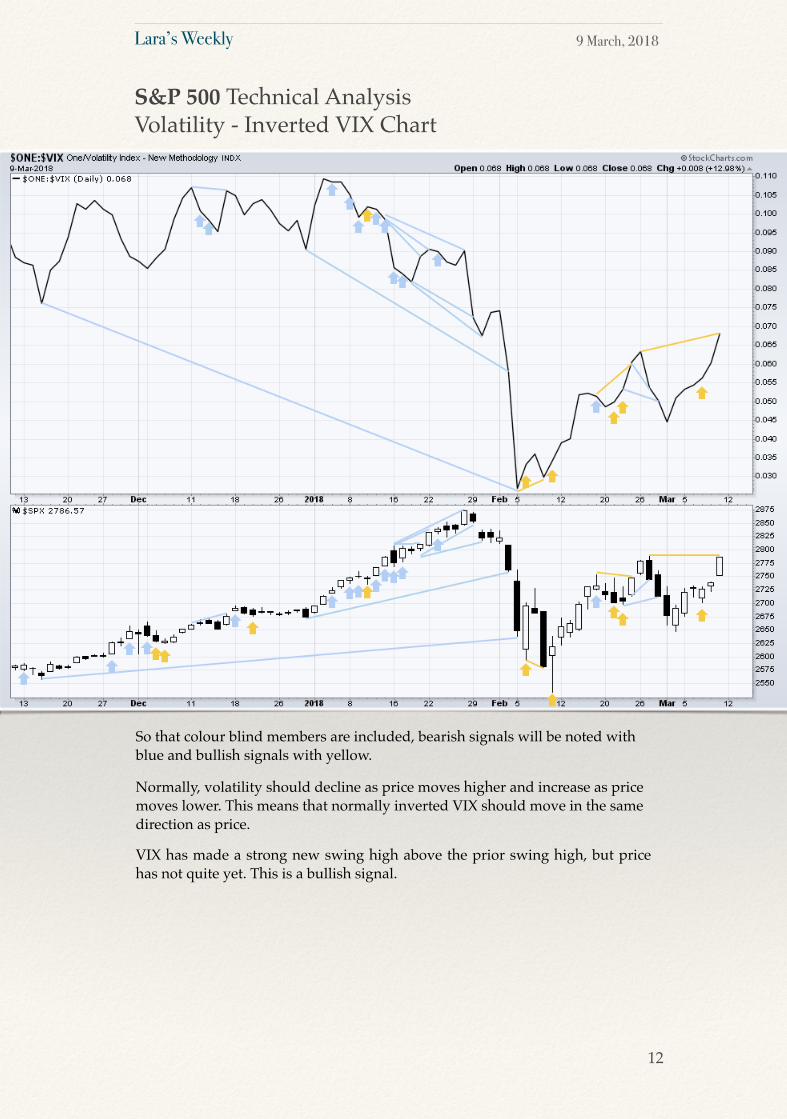
So that colour blind members are included, bearish signals will be noted with blue and bullish signals with yellow.
Normally, volatility should decline as price moves higher and increase as price moves lower. This means that normally inverted VIX should move in the same direction as price.
VIX has made a strong new swing high above the prior swing high, but price has not quite yet. This is a bullish signal.
S&P 500 Technical AnalysisVolatility - Inverted VIX Chart
12
Lara’s Weekly 9 March, 2018
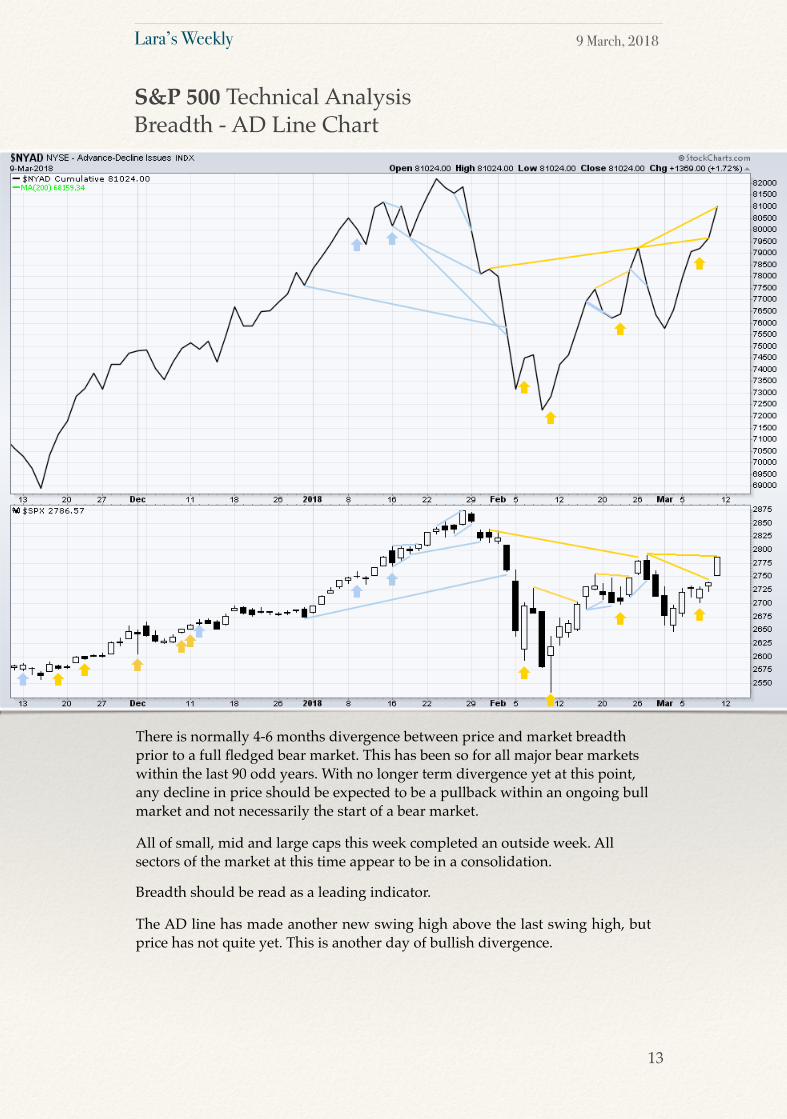
There is normally 4-6 months divergence between price and market breadth prior to a full fledged bear market. This has been so for all major bear markets within the last 90 odd years. With no longer term divergence yet at this point, any decline in price should be expected to be a pullback within an ongoing bull market and not necessarily the start of a bear market.
All of small, mid and large caps this week completed an outside week. All sectors of the market at this time appear to be in a consolidation.
Breadth should be read as a leading indicator.
The AD line has made another new swing high above the last swing high, but price has not quite yet. This is another day of bullish divergence.
S&P 500 Technical AnalysisBreadth - AD Line Chart
13
Lara’s Weekly 9 March, 2018
All indices have made new all time highs as recently as seven weeks ago, confirming the ongoing bull market.
The following lows need to be exceeded for Dow Theory to confirm the end of the bull market and a change to a bear market:
DJIA: 17,883.56.
DJT: 7,039.41.
S&P500: 2,083.79.
Nasdaq: 5,034.41.
Charts showing each prior major swing low used for Dow Theory are here.
S&P 500 Dow Theory
14
Lara’s Weekly 9 March, 2018
A little more downwards movement to a target at 1,318 – 1,317 was expected before a reversal. Price moved lower and reversed 2.84 below the small target zone.
Summary: Expect overall upwards movement next week. The target is at 1,391, but this may be too high.
Grand SuperCycle analysis is here.
Last in-depth historic analysis with monthly and several weekly charts is here, video is here.
There are multiple wave counts at this time at the weekly and monthly chart levels. In order to make this analysis manageable and accessible only two will be published on a daily basis, one bullish and one bearish. This does not mean the other possibilities may not be correct, only that publication of them all each day is too much to digest. At this stage, they do not diverge from the two possibilities below.
GOLD
15
Always practice good risk management. Always trade with stops and invest only 1-5% of equity on any one trade.
Lara’s Weekly 9 March, 2018
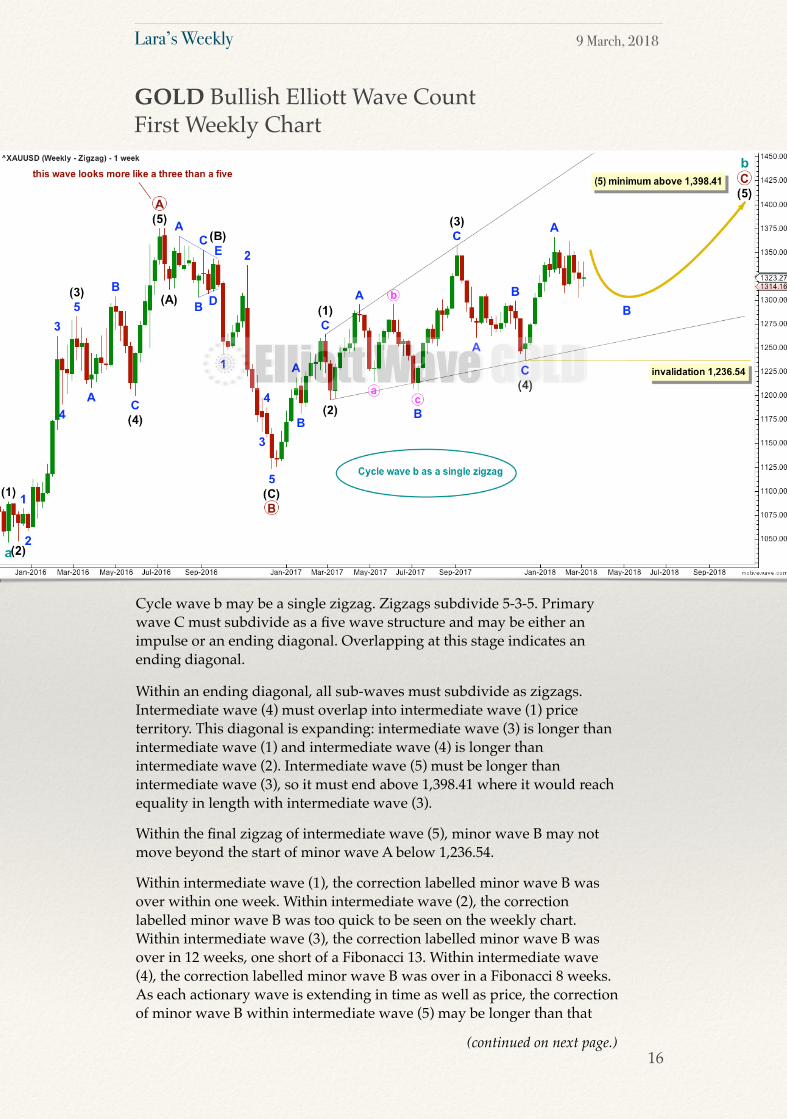
Cycle wave b may be a single zigzag. Zigzags subdivide 5-3-5. Primary wave C must subdivide as a five wave structure and may be either an impulse or an ending diagonal. Overlapping at this stage indicates an ending diagonal.
Within an ending diagonal, all sub-waves must subdivide as zigzags. Intermediate wave (4) must overlap into intermediate wave (1) price territory. This diagonal is expanding: intermediate wave (3) is longer than intermediate wave (1) and intermediate wave (4) is longer than intermediate wave (2). Intermediate wave (5) must be longer than intermediate wave (3), so it must end above 1,398.41 where it would reach equality in length with intermediate wave (3).
Within the final zigzag of intermediate wave (5), minor wave B may not move beyond the start of minor wave A below 1,236.54.
Within intermediate wave (1), the correction labelled minor wave B was over within one week. Within intermediate wave (2), the correction labelled minor wave B was too quick to be seen on the weekly chart. Within intermediate wave (3), the correction labelled minor wave B was over in 12 weeks, one short of a Fibonacci 13. Within intermediate wave (4), the correction labelled minor wave B was over in a Fibonacci 8 weeks. As each actionary wave is extending in time as well as price, the correction of minor wave B within intermediate wave (5) may be longer than that
GOLD Bullish Elliott Wave CountFirst Weekly Chart
16(continued on next page.)
Lara’s Weekly 9 March, 2018
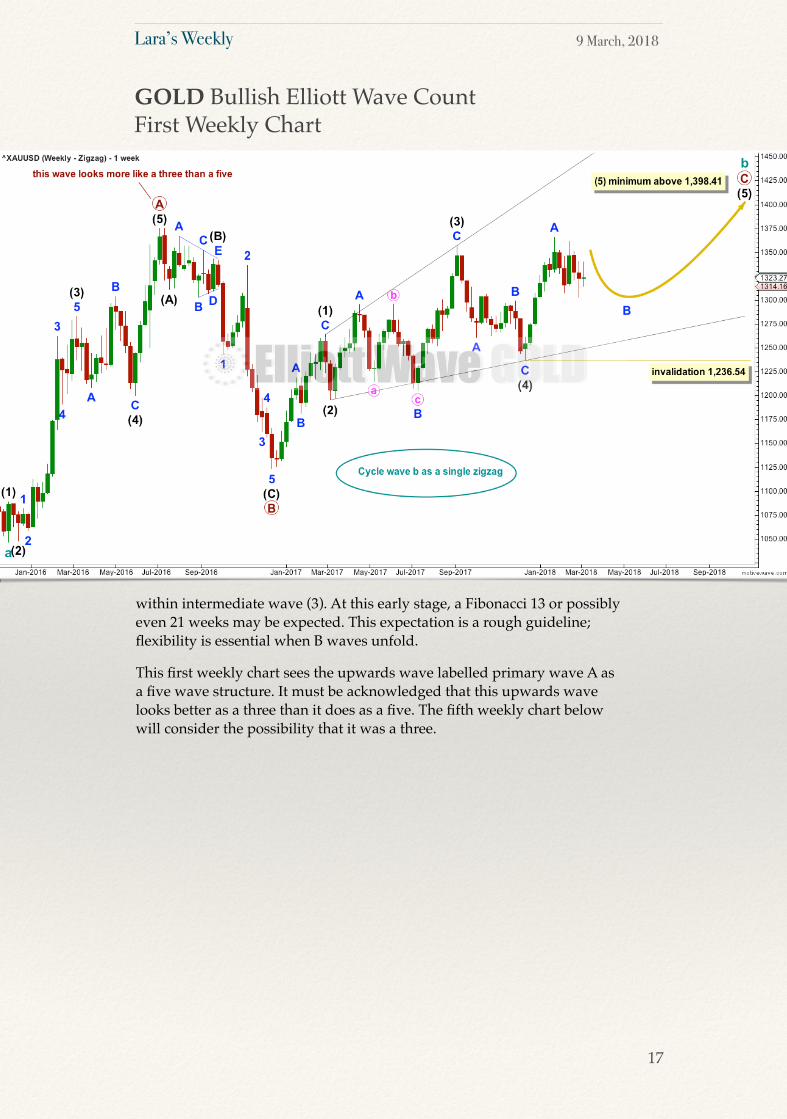
within intermediate wave (3). At this early stage, a Fibonacci 13 or possibly even 21 weeks may be expected. This expectation is a rough guideline; flexibility is essential when B waves unfold.
This first weekly chart sees the upwards wave labelled primary wave A as a five wave structure. It must be acknowledged that this upwards wave looks better as a three than it does as a five. The fifth weekly chart below will consider the possibility that it was a three.
GOLD Bullish Elliott Wave CountFirst Weekly Chart
17
Lara’s Weekly 9 March, 2018
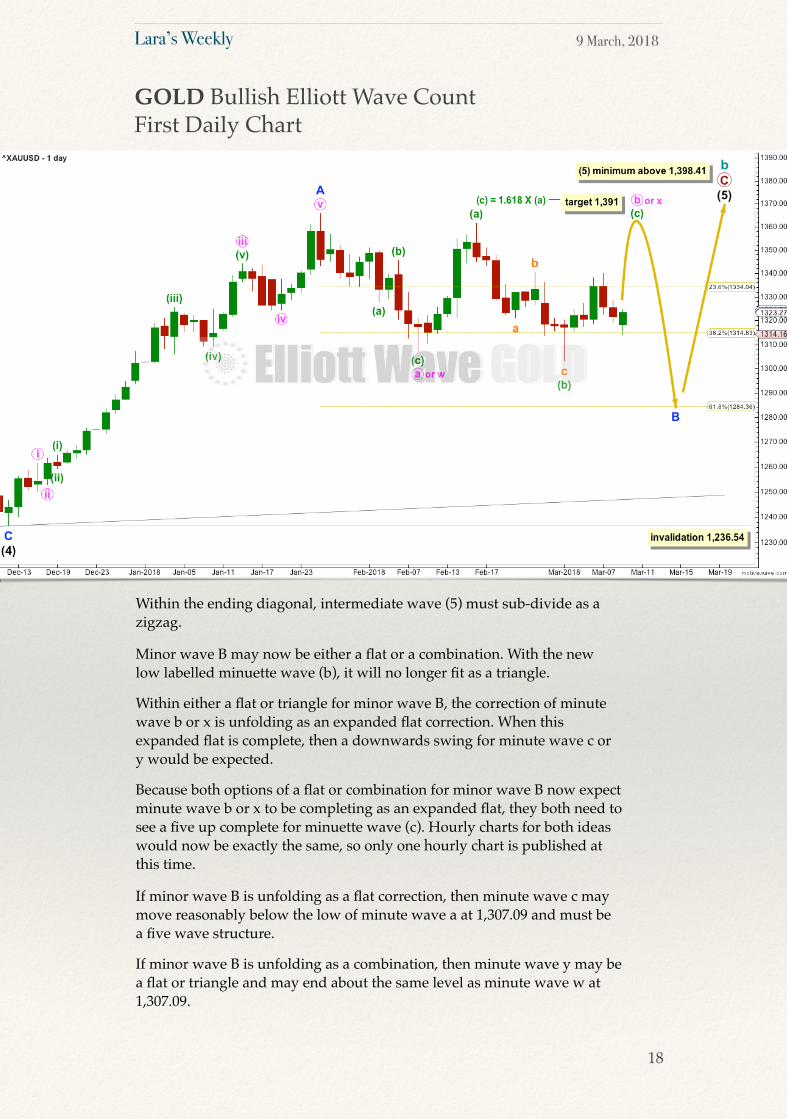
Within the ending diagonal, intermediate wave (5) must sub-divide as a zigzag.
Minor wave B may now be either a flat or a combination. With the new low labelled minuette wave (b), it will no longer fit as a triangle.
Within either a flat or triangle for minor wave B, the correction of minute wave b or x is unfolding as an expanded flat correction. When this expanded flat is complete, then a downwards swing for minute wave c or y would be expected.
Because both options of a flat or combination for minor wave B now expect minute wave b or x to be completing as an expanded flat, they both need to see a five up complete for minuette wave (c). Hourly charts for both ideas would now be exactly the same, so only one hourly chart is published at this time.
If minor wave B is unfolding as a flat correction, then minute wave c may move reasonably below the low of minute wave a at 1,307.09 and must be a five wave structure.
If minor wave B is unfolding as a combination, then minute wave y may be a flat or triangle and may end about the same level as minute wave w at 1,307.09.
GOLD Bullish Elliott Wave CountFirst Daily Chart
18
Lara’s Weekly 9 March, 2018
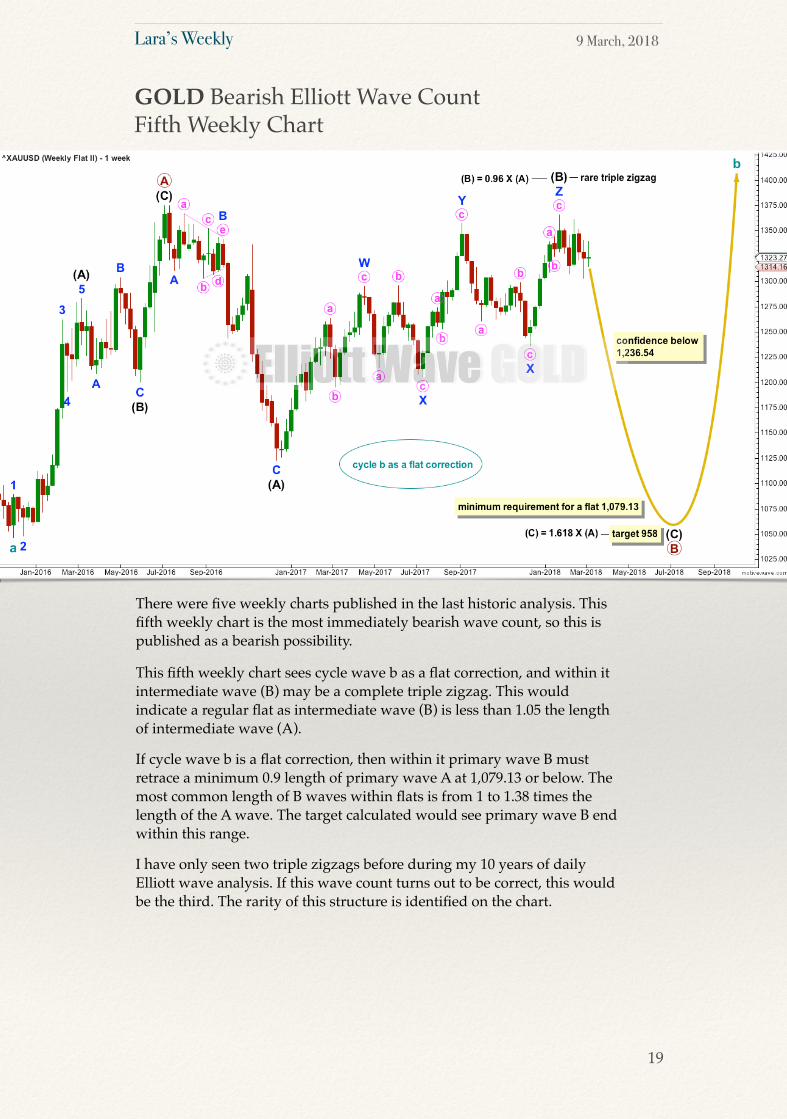
There were five weekly charts published in the last historic analysis. This fifth weekly chart is the most immediately bearish wave count, so this is published as a bearish possibility.
This fifth weekly chart sees cycle wave b as a flat correction, and within it intermediate wave (B) may be a complete triple zigzag. This would indicate a regular flat as intermediate wave (B) is less than 1.05 the length of intermediate wave (A).
If cycle wave b is a flat correction, then within it primary wave B must retrace a minimum 0.9 length of primary wave A at 1,079.13 or below. The most common length of B waves within flats is from 1 to 1.38 times the length of the A wave. The target calculated would see primary wave B end within this range.
I have only seen two triple zigzags before during my 10 years of daily Elliott wave analysis. If this wave count turns out to be correct, this would be the third. The rarity of this structure is identified on the chart.
GOLD Bearish Elliott Wave CountFifth Weekly Chart
19
Lara’s Weekly 9 March, 2018
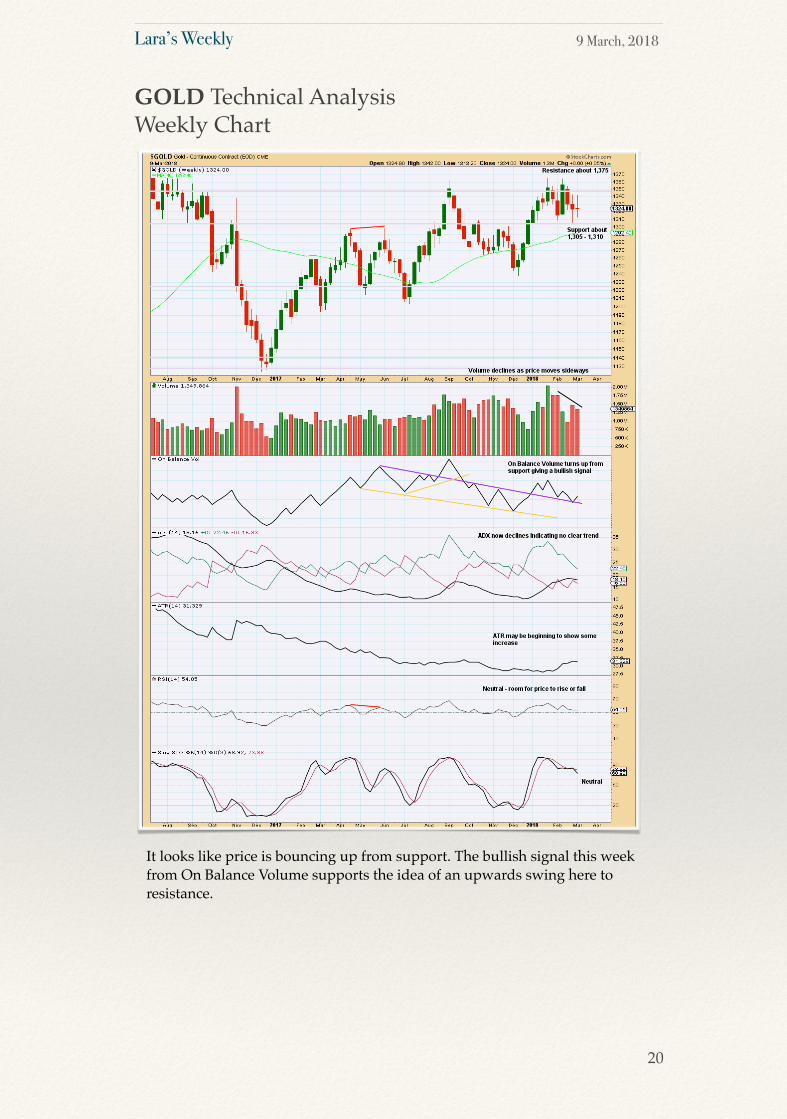
It looks like price is bouncing up from support. The bullish signal this week from On Balance Volume supports the idea of an upwards swing here to resistance.
GOLD Technical AnalysisWeekly Chart
20
Lara’s Weekly 9 March, 2018
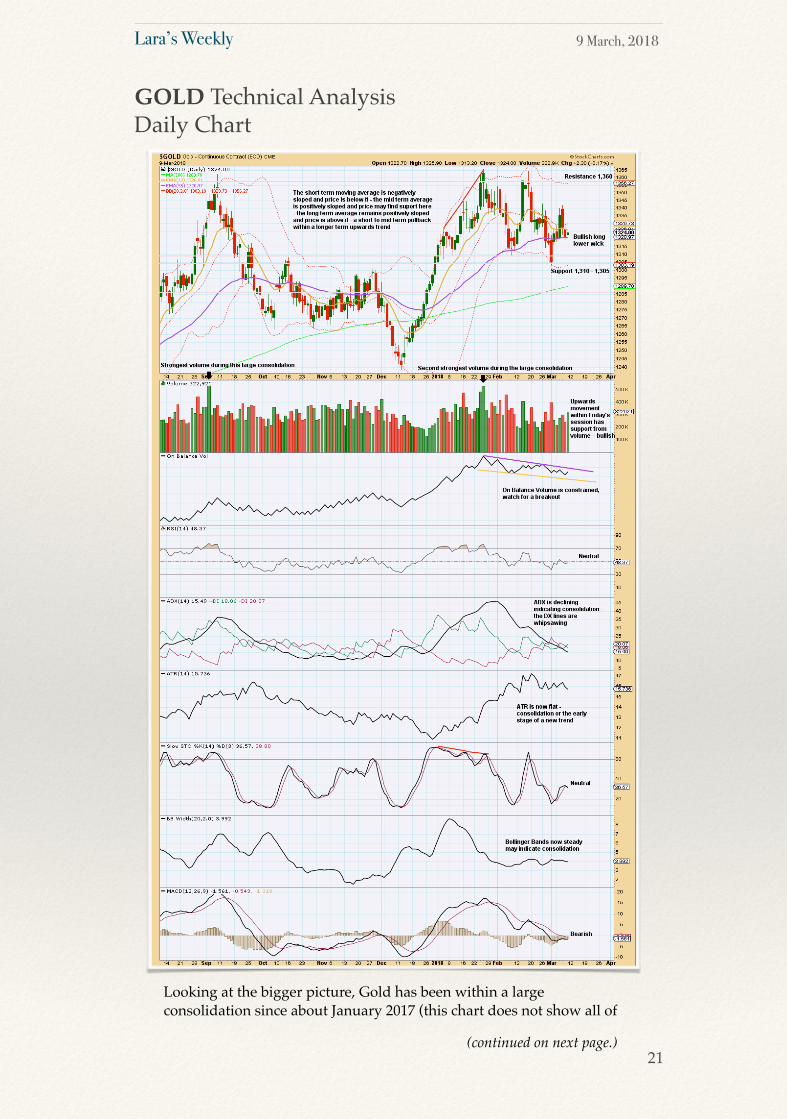
Looking at the bigger picture, Gold has been within a large consolidation since about January 2017 (this chart does not show all of
GOLD Technical AnalysisDaily Chart
21(continued on next page.)
Lara’s Weekly 9 March, 2018
this large consolidation), and during this consolidation it is two upwards days that have strongest volume and an upwards week that has strongest volume. Volume suggests an upwards breakout may be more likely than downwards.
Currently, Gold is within a smaller consolidation that began in early January 2018. This consolidation is delineated by support about 1,310 to 1,305 and resistance (final) about 1,375. It is an upwards day during this smaller consolidation that has strongest volume, suggesting an upwards breakout may be more likely here than downwards.
For the short term, it still looks like price is within a choppy upwards swing from support to resistance. The long lower wick for Friday strongly suggests an upwards day on Monday.
GOLD Technical AnalysisDaily Chart
22
Lara’s Weekly 9 March, 2018
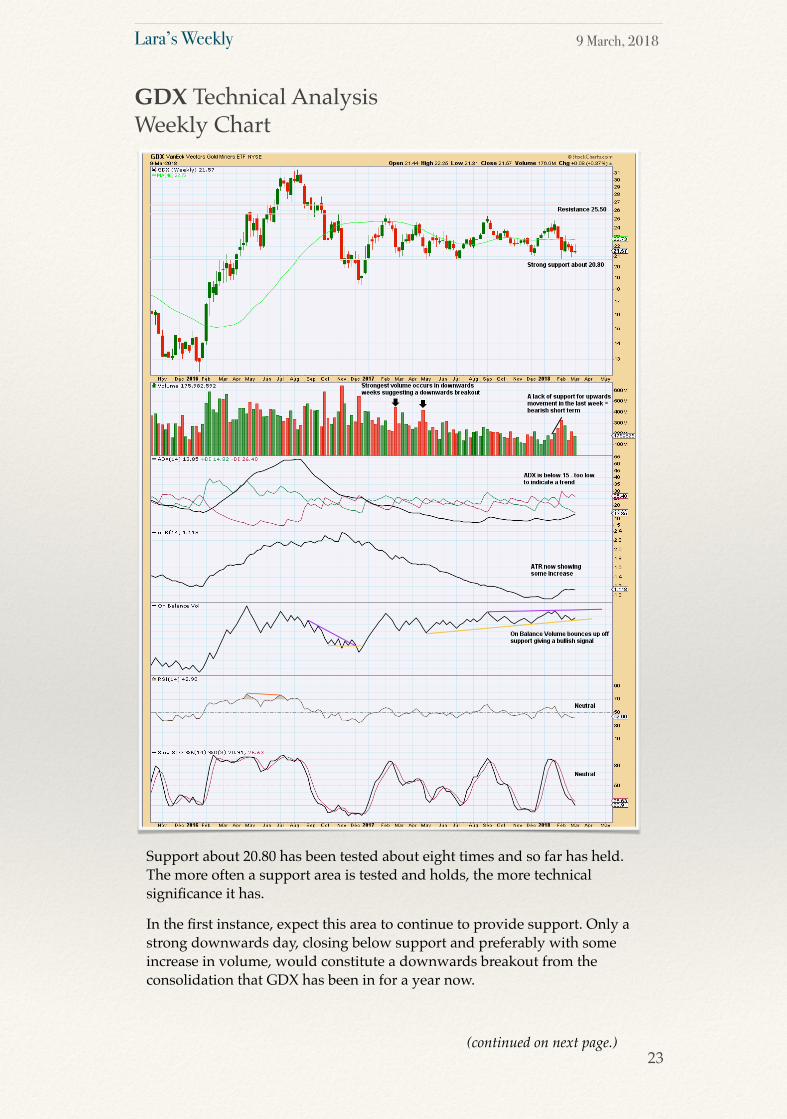
Support about 20.80 has been tested about eight times and so far has held. The more often a support area is tested and holds, the more technical significance it has.
In the first instance, expect this area to continue to provide support. Only a strong downwards day, closing below support and preferably with some increase in volume, would constitute a downwards breakout from the consolidation that GDX has been in for a year now.
GDX Technical AnalysisWeekly Chart
23(continued on next page.)
Lara’s Weekly 9 March, 2018
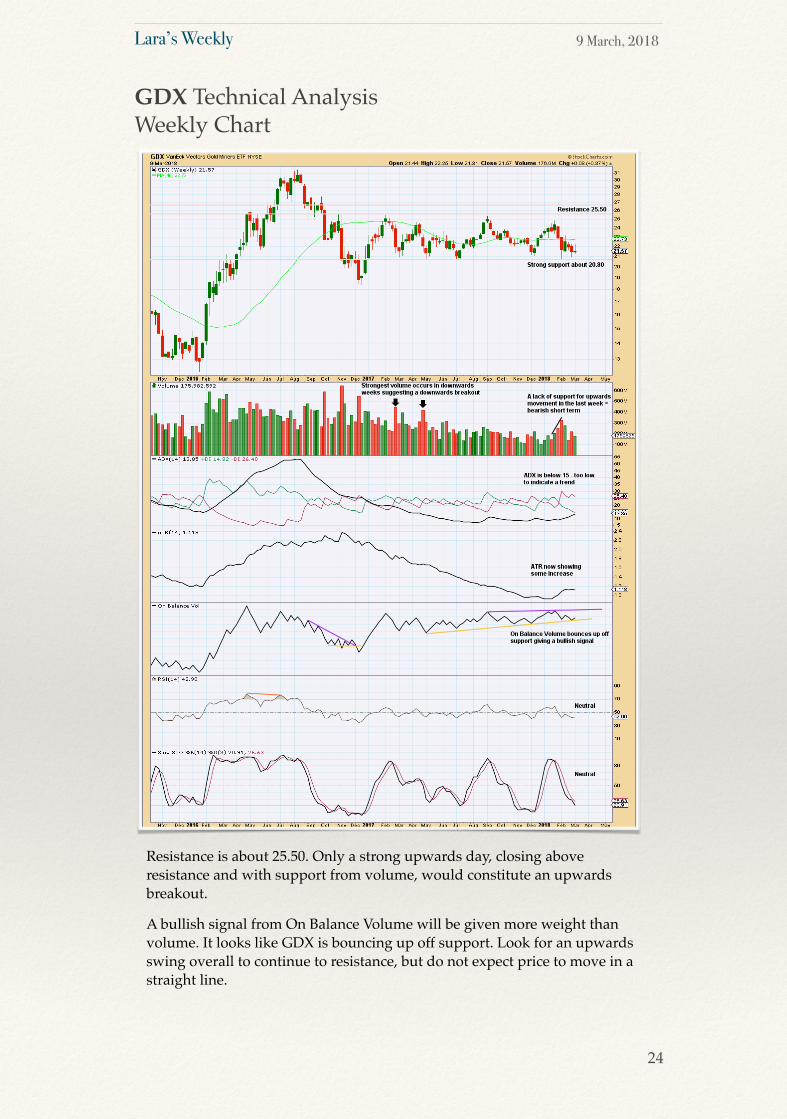
Resistance is about 25.50. Only a strong upwards day, closing above resistance and with support from volume, would constitute an upwards breakout.
A bullish signal from On Balance Volume will be given more weight than volume. It looks like GDX is bouncing up off support. Look for an upwards swing overall to continue to resistance, but do not expect price to move in a straight line.
GDX Technical AnalysisWeekly Chart
24
Lara’s Weekly 9 March, 2018
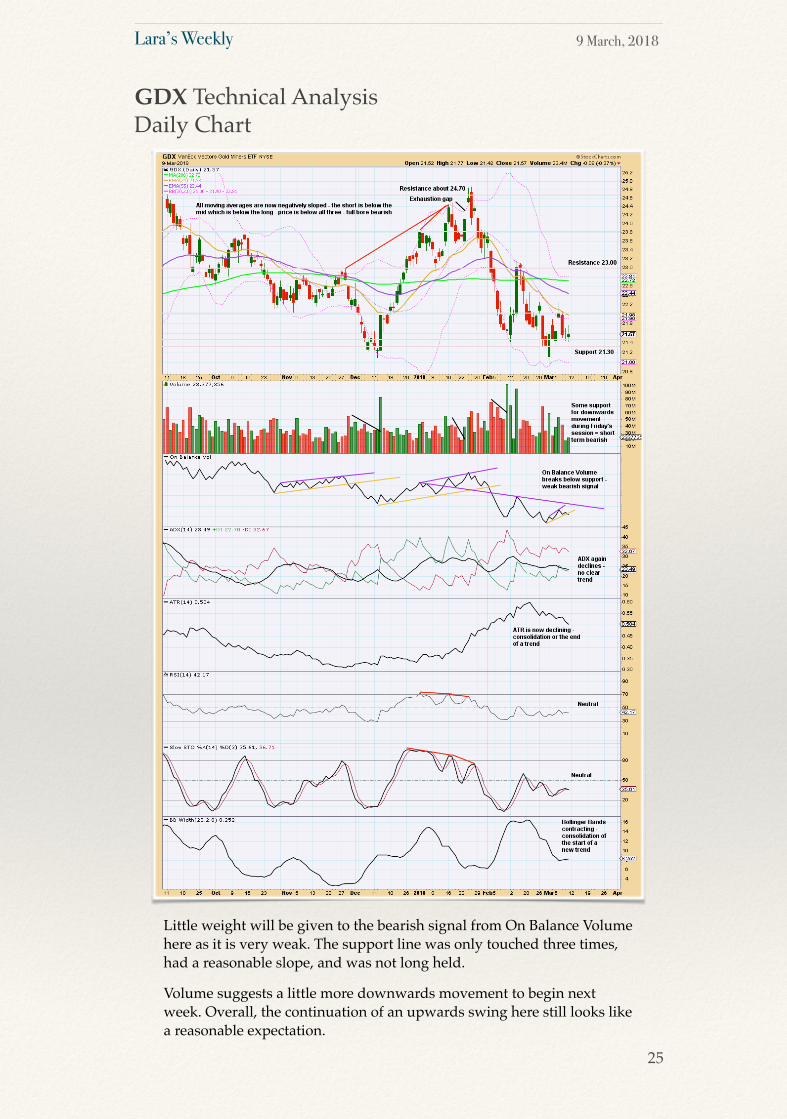
Little weight will be given to the bearish signal from On Balance Volume here as it is very weak. The support line was only touched three times, had a reasonable slope, and was not long held.
Volume suggests a little more downwards movement to begin next week. Overall, the continuation of an upwards swing here still looks like a reasonable expectation.
GDX Technical AnalysisDaily Chart
25
Lara’s Weekly 9 March, 2018
A small bounce was expected before the continuation of a downwards trend. Price has moved slightly lower for the week, but with a very small real body mostly price moved sideways. The outlook remains the same.
Summary: The outlook will remain bearish while price remains below 66.65. A new high above 66.65 at this stage would be very bullish.
In the short term, still look for a small bounce to end a little above 63.28 with a possible target at 65.05, then the continuation of a downwards trend.
US OIL
26
Always practice good risk management. Always trade with stops and invest only 1-5% of equity on any one trade.
Lara’s Weekly 9 March, 2018
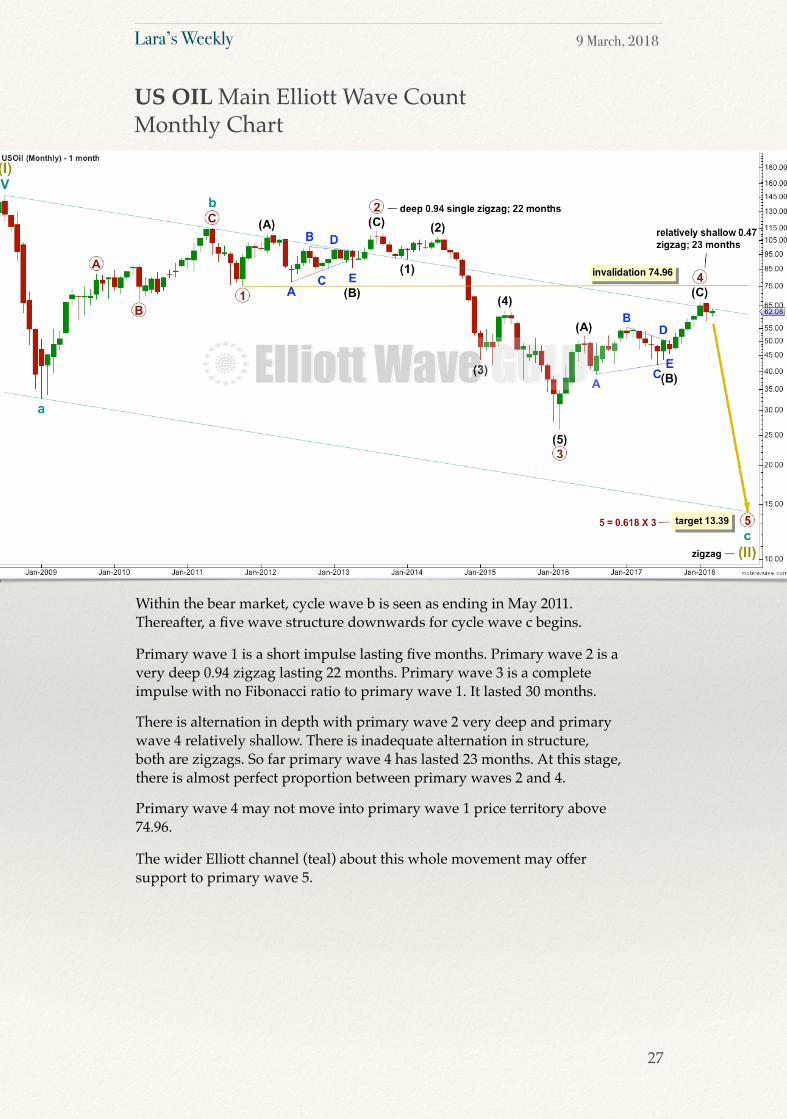
Within the bear market, cycle wave b is seen as ending in May 2011. Thereafter, a five wave structure downwards for cycle wave c begins.
Primary wave 1 is a short impulse lasting five months. Primary wave 2 is a very deep 0.94 zigzag lasting 22 months. Primary wave 3 is a complete impulse with no Fibonacci ratio to primary wave 1. It lasted 30 months.
There is alternation in depth with primary wave 2 very deep and primary wave 4 relatively shallow. There is inadequate alternation in structure, both are zigzags. So far primary wave 4 has lasted 23 months. At this stage, there is almost perfect proportion between primary waves 2 and 4.
Primary wave 4 may not move into primary wave 1 price territory above 74.96.
The wider Elliott channel (teal) about this whole movement may offer support to primary wave 5.
US OIL Main Elliott Wave CountMonthly Chart
27
Lara’s Weekly 9 March, 2018
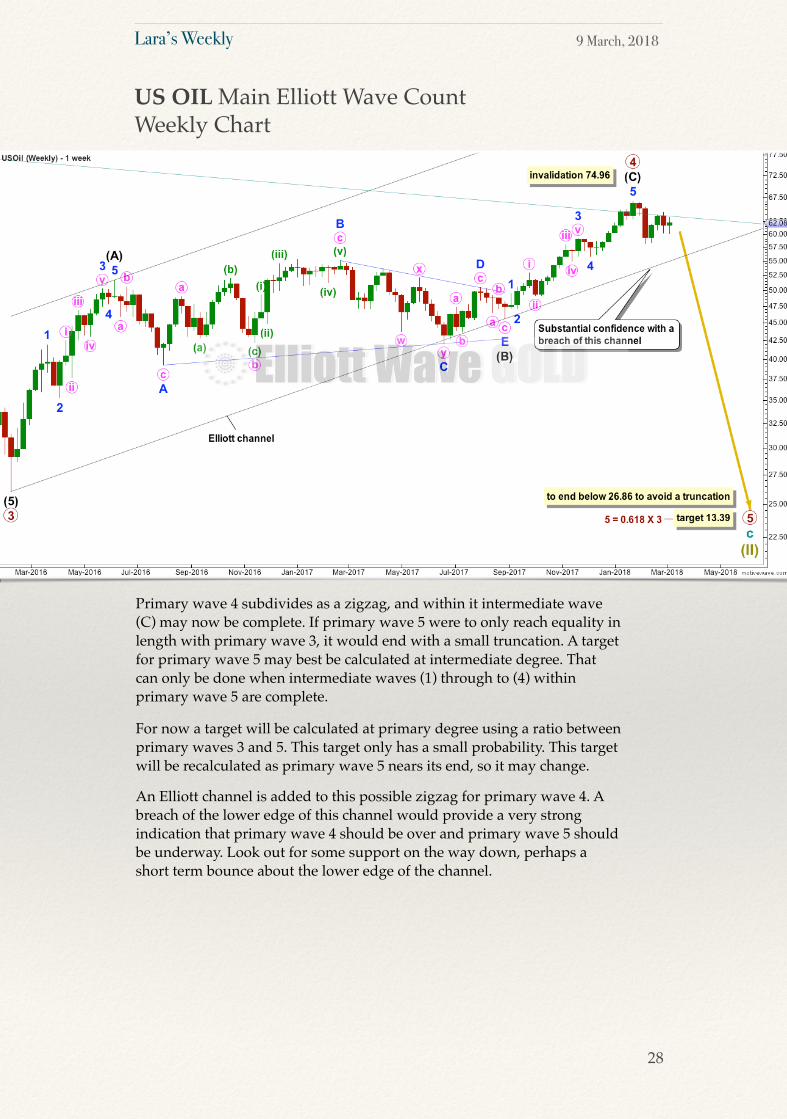
Primary wave 4 subdivides as a zigzag, and within it intermediate wave (C) may now be complete. If primary wave 5 were to only reach equality in length with primary wave 3, it would end with a small truncation. A target for primary wave 5 may best be calculated at intermediate degree. That can only be done when intermediate waves (1) through to (4) within primary wave 5 are complete.
For now a target will be calculated at primary degree using a ratio between primary waves 3 and 5. This target only has a small probability. This target will be recalculated as primary wave 5 nears its end, so it may change.
An Elliott channel is added to this possible zigzag for primary wave 4. A breach of the lower edge of this channel would provide a very strong indication that primary wave 4 should be over and primary wave 5 should be underway. Look out for some support on the way down, perhaps a short term bounce about the lower edge of the channel.
US OIL Main Elliott Wave CountWeekly Chart
28
Lara’s Weekly 9 March, 2018
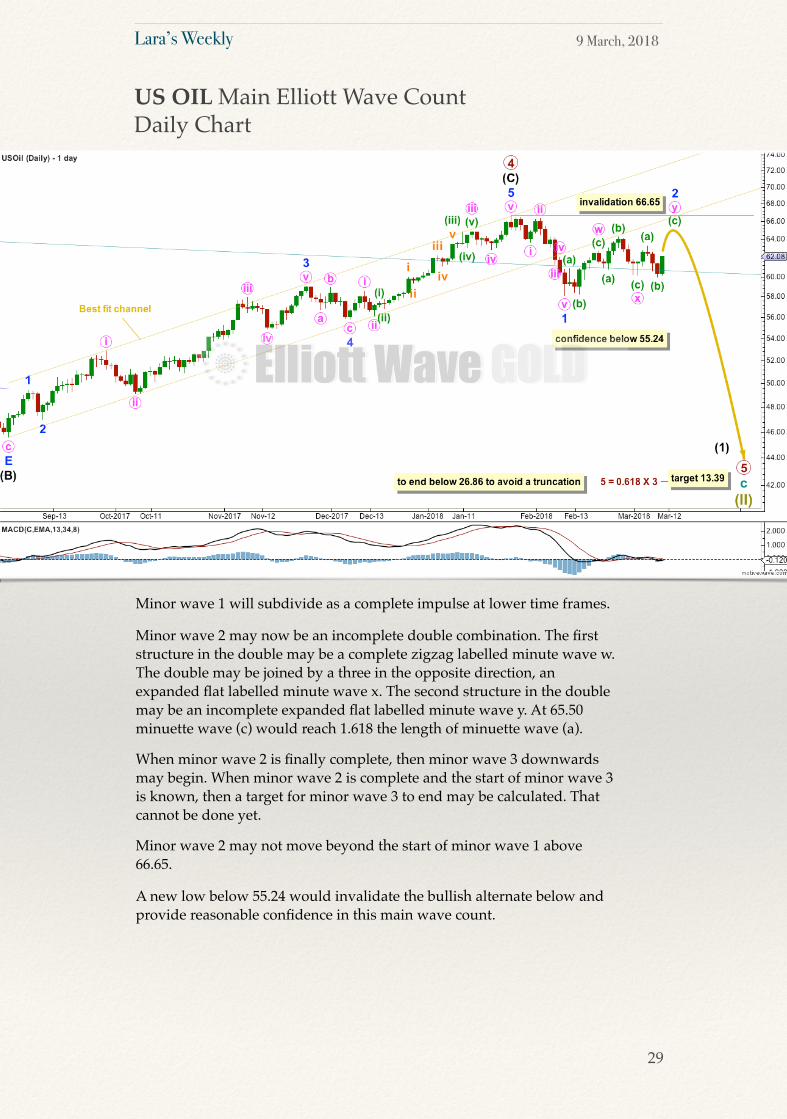
Minor wave 1 will subdivide as a complete impulse at lower time frames.
Minor wave 2 may now be an incomplete double combination. The first structure in the double may be a complete zigzag labelled minute wave w. The double may be joined by a three in the opposite direction, an expanded flat labelled minute wave x. The second structure in the double may be an incomplete expanded flat labelled minute wave y. At 65.50 minuette wave (c) would reach 1.618 the length of minuette wave (a).
When minor wave 2 is finally complete, then minor wave 3 downwards may begin. When minor wave 2 is complete and the start of minor wave 3 is known, then a target for minor wave 3 to end may be calculated. That cannot be done yet.
Minor wave 2 may not move beyond the start of minor wave 1 above 66.65.
A new low below 55.24 would invalidate the bullish alternate below and provide reasonable confidence in this main wave count.
US OIL Main Elliott Wave CountDaily Chart
29
Lara’s Weekly 9 March, 2018
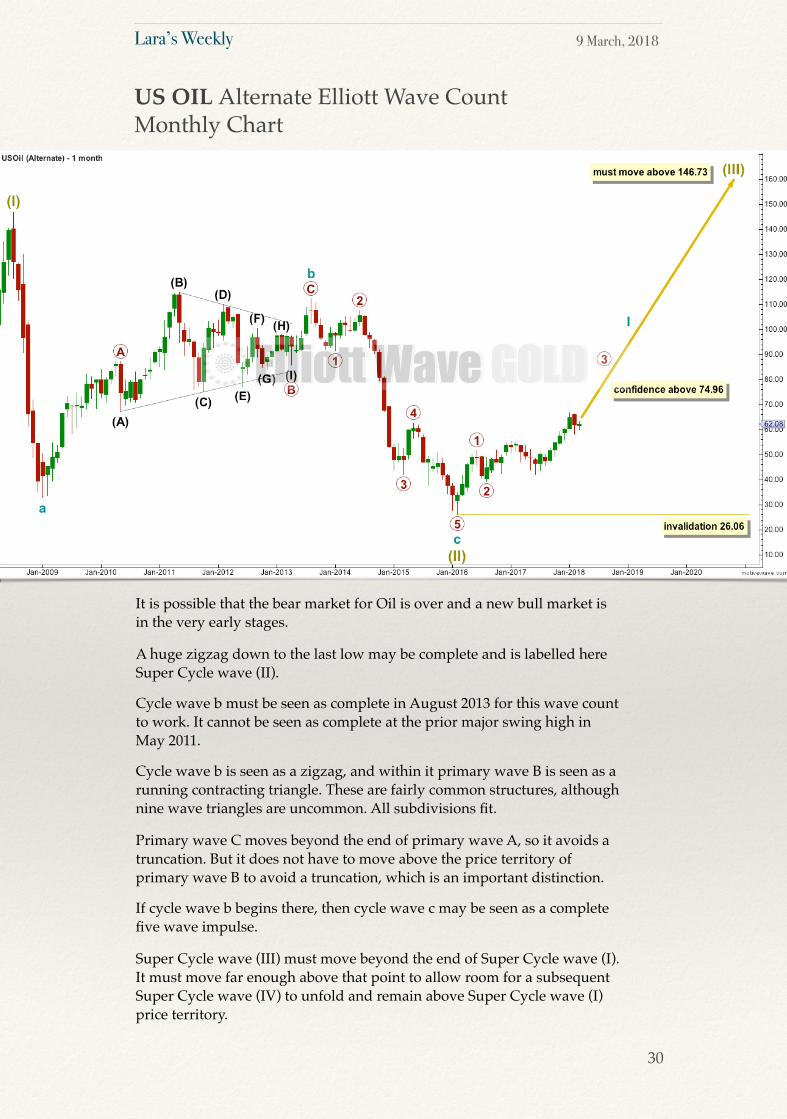
It is possible that the bear market for Oil is over and a new bull market is in the very early stages.
A huge zigzag down to the last low may be complete and is labelled here Super Cycle wave (II).
Cycle wave b must be seen as complete in August 2013 for this wave count to work. It cannot be seen as complete at the prior major swing high in May 2011.
Cycle wave b is seen as a zigzag, and within it primary wave B is seen as a running contracting triangle. These are fairly common structures, although nine wave triangles are uncommon. All subdivisions fit.
Primary wave C moves beyond the end of primary wave A, so it avoids a truncation. But it does not have to move above the price territory of primary wave B to avoid a truncation, which is an important distinction.
If cycle wave b begins there, then cycle wave c may be seen as a complete five wave impulse.
Super Cycle wave (III) must move beyond the end of Super Cycle wave (I). It must move far enough above that point to allow room for a subsequent Super Cycle wave (IV) to unfold and remain above Super Cycle wave (I) price territory.
US OIL Alternate Elliott Wave CountMonthly Chart
30
Lara’s Weekly 9 March, 2018
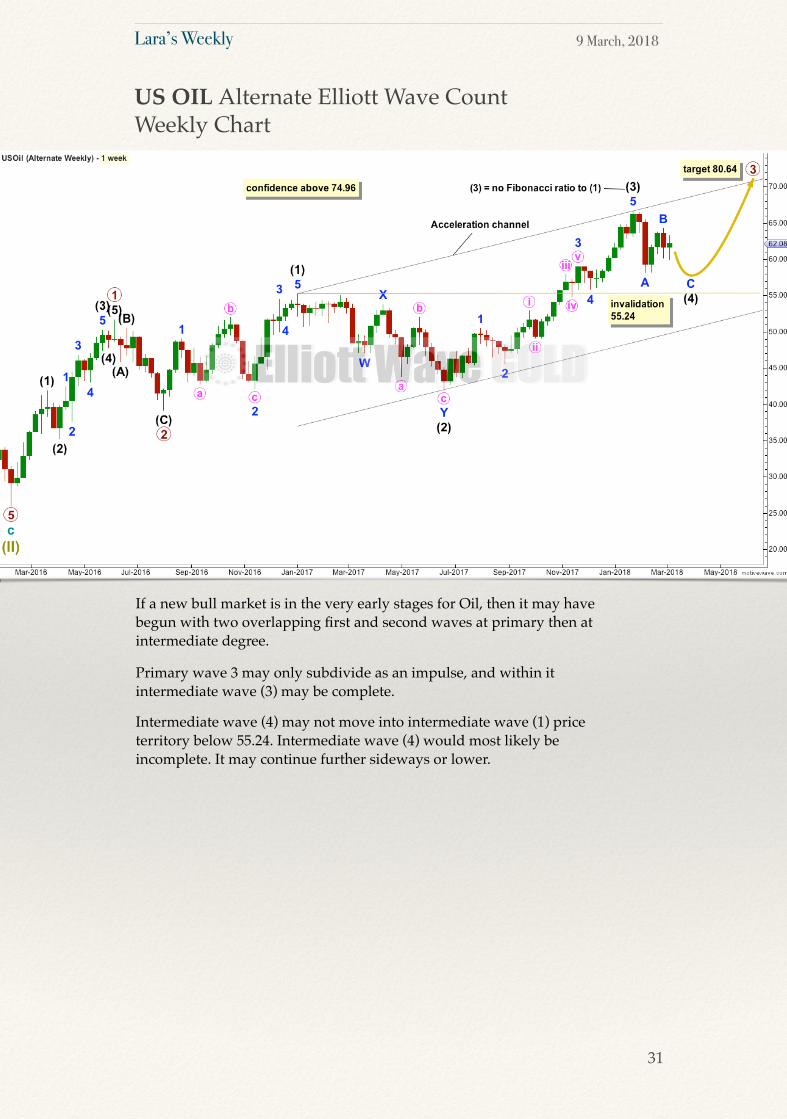
If a new bull market is in the very early stages for Oil, then it may have begun with two overlapping first and second waves at primary then at intermediate degree.
Primary wave 3 may only subdivide as an impulse, and within it intermediate wave (3) may be complete.
Intermediate wave (4) may not move into intermediate wave (1) price territory below 55.24. Intermediate wave (4) would most likely be incomplete. It may continue further sideways or lower.
US OIL Alternate Elliott Wave CountWeekly Chart
31
Lara’s Weekly 9 March, 2018
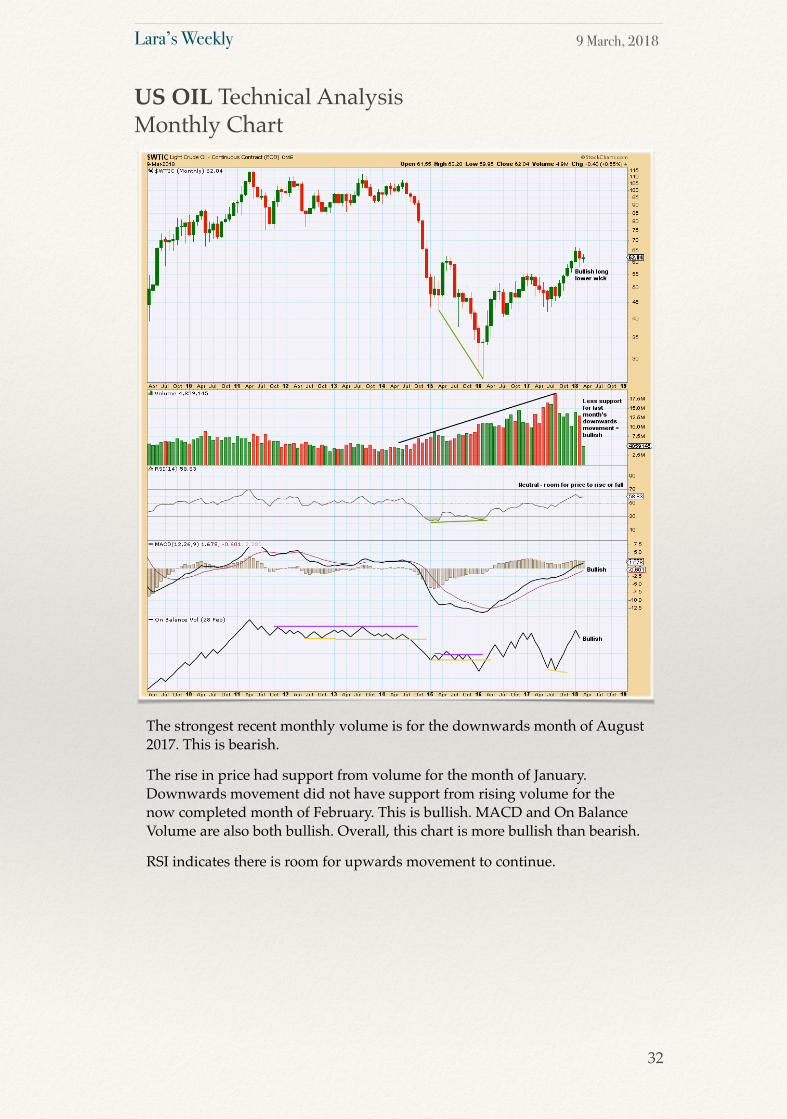
The strongest recent monthly volume is for the downwards month of August 2017. This is bearish.
The rise in price had support from volume for the month of January. Downwards movement did not have support from rising volume for the now completed month of February. This is bullish. MACD and On Balance Volume are also both bullish. Overall, this chart is more bullish than bearish.
RSI indicates there is room for upwards movement to continue.
US OIL Technical AnalysisMonthly Chart
32
Lara’s Weekly 9 March, 2018
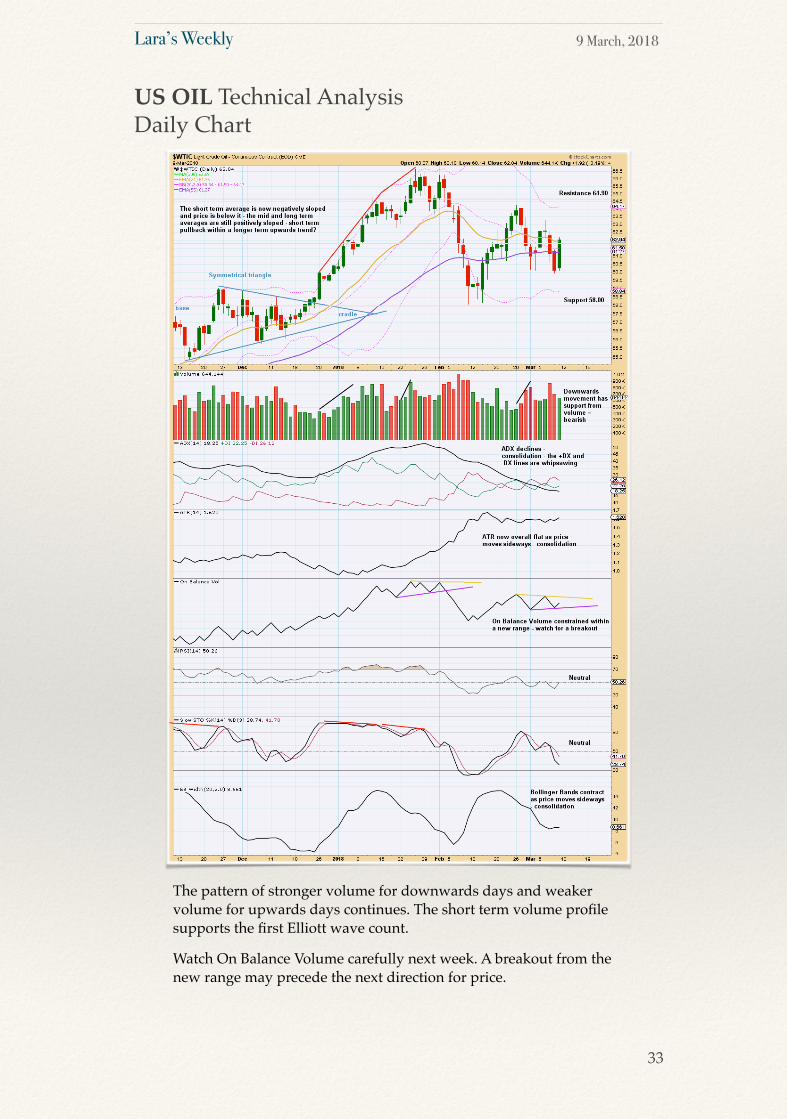
The pattern of stronger volume for downwards days and weaker volume for upwards days continues. The short term volume profile supports the first Elliott wave count.
Watch On Balance Volume carefully next week. A breakout from the new range may precede the next direction for price.
US OIL Technical AnalysisDaily Chart
33
Lara’s Weekly 9 March, 2018
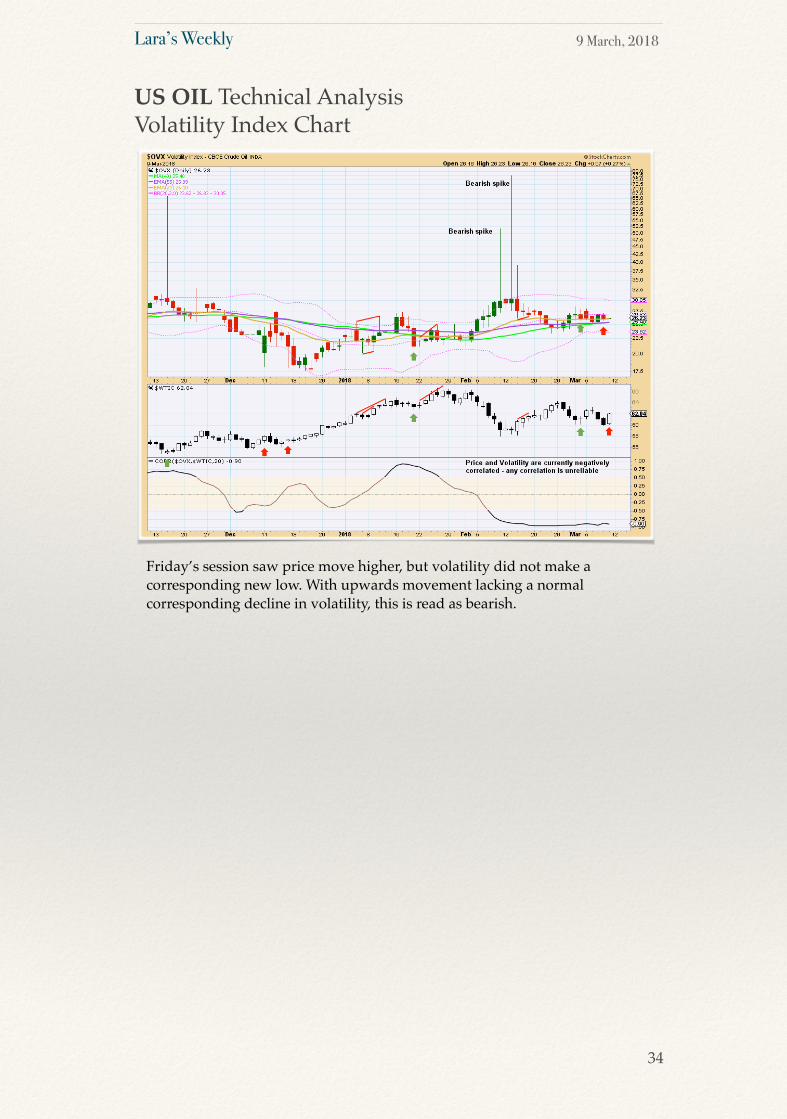
Friday’s session saw price move higher, but volatility did not make a corresponding new low. With upwards movement lacking a normal corresponding decline in volatility, this is read as bearish.
US OIL Technical AnalysisVolatility Index Chart
34
Lara’s Weekly 9 March, 2018
Lara’s Weekly is an end of week Elliott Wave and Technical Analysis of the S&P 500, GOLD, and US OIL that focuses on the mid-to-long-term picture. This analysis service is designed for investors and swing traders.
Lara’s Weekly is at this time available to the general public, but in the near future it will be available by subscription only. I will be offering a once only awesome Grandfather rate to the earliest subscribers when Lara’s Weekly is launched as a paid subscription service. To make sure you don’t miss out and not get the Grandfather rate, be notified here.
Thank you for your support.
Lara Iriarte, CMT
Elliott Wave Gold Elliott wave Stock Market
About
35
DisclaimerLara’s Weekly does not guarantee gains nor is liable for any loss that may result from reliance by any person upon information in Lara’s Weekly report. Past performance is not a guide or guarantee of future performance.
The information contained in Lara’s Weekly may not be published, broadcast, re-written, or otherwise distributed without prior written consent from Lara Iriarte.
© Lara Iriarte
© Lara Iriarte
Lara’s Weekly