Embed Size (px)
Citation preview
UNDCP
IllicitCrop
MonitoringProgramme
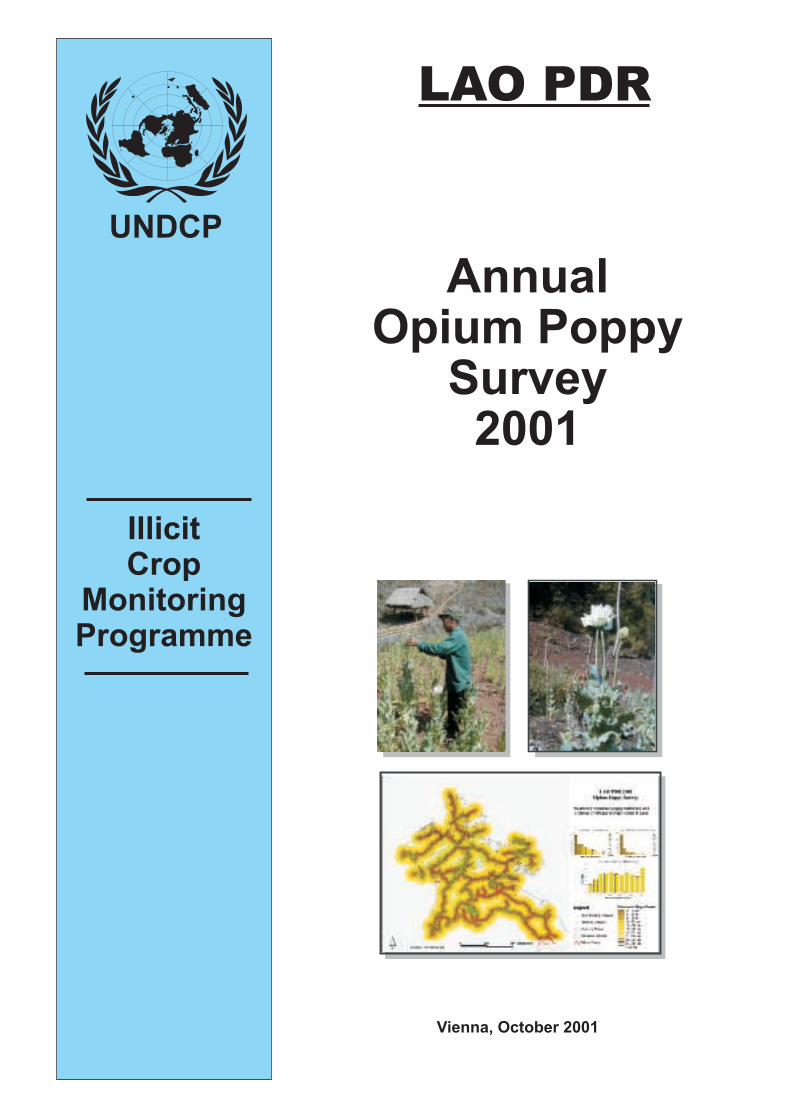
LAO PDR
AnnualOpium Poppy
Survey2001
Vienna, October 2001

Table of Contents
Introduction ...............................................................................................................2
I. Main findings of the 2001 Lao opium survey.....................................................3II. Survey findings ...............................................................................................11III. Spatial patterns in opium poppy growing and non-growing villages in Lao.................................................................................................22IV. Relationship between poppy cultivation and distance of villages to major roads in Laos....................................................................................27
Annexes:Annex 1: The Baseline form............................................................................35Annex 2: Random selection of villages to survey............................................37Annex 3: Questionnaires.................................................................................39Annex 4: Summary baseline data and sample................................................49Annex 5: Estimated district opium poppy cultivation and
district opium production ..................................................................51
Lao Annual Opium Survey 2001 2
Introduction
The Lao Government and UNDCP have jointly implemented national opium surveys in 1992,1996, 1998 and 2001. The surveys provide information on the extent of cultivation of opiumpoppy, the production of opium gum, and the level of opium addiction in the country. Theinformation provided by the surveys constitute an invaluable tool for planning activities totackle the supply and demand sides of the opium problem.
The survey also contributes to UNDCP's Global Illicit Crop Monitoring Programme. Theobjectives of this Programme are to define international core indicators on illicit cropcultivation, to establish methodological standards for data collection and analysis, to increasehost governments' capacity to monitor illicit crops and the impact of control measures on theirterritory, as well as to assist the international community in monitoring the extent andevolution of illicit crops at the global level in the context of the elimination strategy adopted atthe Special Session of the General Assembly in June 1998.
The 2001 survey received the direct support of the Lao Prime Minister Office and the fullcollaboration of the Provincial authorities. Through the newly established ProgrammeFacilitation Unit, the Lao National Commission on Drug Control and Supervision (LCDC)supervised the overall implementation of the survey. The National Statistics Center providedmethodological guidance, tools and staff from survey inception to analysis. Most of thesurveyors came from the Provincial administration. UNDCP provided financial and technicalsupport.
The methodology of the survey in Laos is based on a inventory of all known opium-producingvillages and data collected from a representative sample of these villages. Since 2000, newtechnology instruments have been introduced, such as GPS during the field work andGeographical Information System for mapping the results.
During the 2001 survey, 391 villages were physically surveyed out of the 5,946 villages of the11 provinces of northern Laos. The sample represented 15 % of the villages reported asgrowing opium poppy and 2 % of the villages reported as not growing opium poppy.

Lao Annual Opium Survey 2001 3
I. Main Findings of the 2001 Lao Opium Survey
Cultivation
Nationally, the survey estimated that there were 17,255 hectares of opium poppy undercultivation in the 2000-2001 season. This represented a reduction in total opium poppy areaof 9.5% compared with the 1999 estimate of 19,052 hectares. This confirmed the downwardtrend of opium poppy cultivation in Laos since 1998 when the cultivation of opium poppy wasestimated at 26,800 hectares.
The survey confirmed that opium poppy cultivation mainly took place in the 6 provincestargeted by the Opium Elimination Programme launched in 1998. The cultivation in these 6provinces accounted for 89 % of the total area under cultivation.
Yield and Production
The total potential production was estimated at 134,2 metric tonnes of raw opium,representing a 20% decrease compared to last year. The national average yield wasestimated at 7.8 kg/ha. This figure should be understood as a potential yield. Due to lossesand variations in harvesting efficiency, the actual yield might be lower.
Remark : Based on preliminary results available in June 2001, the national production wasestimated at 117 metric tonnes (national average yield of 6.8 kg/ha). The Lao Governmentused this preliminary estimate for an official planning exercise in July 2001, at a time whenthe final results of the 2001 survey had not yet been established. This explains why resultsfound in documents released by the Lao authorities might differ from those presented in thepresent report.
Opium Addiction
Findings on opium addiction resulted in a total number of opium addicts of 58,173 persons,against 62,895 persons in 1999, which represents a 7.5% decrease.
Opium Prices
At the country level, the farmgate price of opium was estimated at 1,384,971 KIP/kg (or 165USD/kg) for March 2001. The same survey estimated the farmgate price for the previousyear at 1,241, 597 KIP/kg (or 163 USD/kg) for March 2000.

Lao Annual Opium Survey 2001 4

Lao Annual Opium Survey 2001 5
RESULTS OF THE OPIUM SURVEYS IN LAO PDR 1992-2001By Province
Province1992 1996 1998 2000 2001 1992 1996 1998 2000 2001
UdomXay 369 n/a 234 261 233 1,860 2,416 5,597 4,061 3112Huapanh 405 n/a 312 424 417 3,770 3,816 3,450 3,921 2903Phongsaly 406 n/a 513 462 390 2,840 3,558 5,778 3,872 3278Luang Prabang 252 n/a 236 219 194 3,510 3,550 2,786 3,036 2950Luang Namtha 268 n/a 334 221 244 1,730 2,197 3,593 1,514 1687Xieng Khuang 315 n/a 184 180 234 2,880 2,916 2,902 1,376 1426Xayabouri 33 n/a 72 78 104 400 754 1,014 508 729Bokeo 98 n/a 50 46 45 620 785 428 448 427Xaisombun n/a n/a n/a 25 54** n/a n/a n/a 224 521**Bolikhamsay 85 n/a 61 22 25 700 708 617 73 105Vientiane 84* n/a 60* 2 30** 880* 900* 672* 20 117**Country 2,315 2,056 1,940 1,970 19,190 21,600 26,837 19,053 17,255
1992 1996 1998 2000 2001 1992 1996 1998 2000 2001UdomXay 6.6 8.1 4.6 9 7.2 12,300 19,600 25,747 36,536 3,112 Huapanh 6 4.5 4.6 8.6 8.7 22,500 17,300 15,870 33,705 2,903 Phongsaly 6.7 7.7 4.6 8.2 9.7 19,000 27,500 26,580 31,824 3,278 Luang Prabang 6.4 4.8 4.6 11.9 7.1 22,400 17,200 12,816 36,007 2,950 Luang Namtha 6.6 7.7 4.6 8.1 6.2 11,500 16,900 16,526 12,211 1,687 Xieng Khuang 7 5.3 4.6 6 7.8 20,300 15,600 13,350 8,205 1,426 Xayabouri 6.3 9.2 4.6 8 5.0 2500 6900 4,666 4,068 729 Bokeo 7.1 8.5 4.6 6.2 7.4 4400 6700 1969 2761 427 Xaisombun n/a n/a n/a 6.3 7.7 n/a n/a n/a 1400 521** Bolikhamsay 6.9 8.2 4.6 2.9 7.4 4800 5800 2838 213 105 Vientiane 8.0* 8.2* 4.6* 8.7 7.4 7,000* 6,900* 3,091* 167 117** Country 6.6 6.4 4.6 8.7 7.8 126,700 140,400 123,453 167,097 134,253
*Including Xaysombun** Since 2000, the districts of Longxan and Hom, previously in Xaysombou, have been incorporated into Vientiane Province
Yield (kg/ha) Production (kg)
Villages Growing Opium Opium Cultivation in Ha

Lao Annual Opium Survey 2001 6
Lao Annual Opium Survey 2001 7
I. The 2001 National Opium SurveyObjectives
The main objective of the survey was to provide information on the extent of area plantedwith opium poppy and its location. The secondary objectives were to provide informationregarding the yield, from which the production was estimated, the farmgate price of opiumand the addiction rate.
The information provided by the previous surveys and the present one, constitute a uniqueand rich picture of the opium producing region and its people. It is a good basis for planningand monitoring and is used in the selection of the Programme area of the �BalancedApproach to Opium Elimination in Lao PDR�.
Methodology
The 2001 survey, like the previous 4 surveys, was ground based and carried out in a sampleof villages in the 10 northern provinces of Lao PDR and the Xaysomboun Special Region. Asthere is no evidence of poppy cultivation in the southern provinces of the country, theseprovinces are not covered by the opium surveys.
Only a random sample of villages was surveyed. This required as an initial step the buildingof a baseline (or a population) from which the sample was drawn.
The Baseline
The baseline questionnaires were filled in by the district authorities and included basicinformation for every village on the village demography, opium growing status and theestimated number of households growing opium poppy.
The baseline questionnaires were pre-filled with the official codes and village names providedby the National Statistics Centre. The baselines were presented to the district authorities bythe surveyors upon their arrival in the district.
Because the district baseline was the basis for the random sampling, it had to be completedbefore the survey fieldwork could actually proceed.
An example of baseline questionnaire is in Annex 1.
The Random Sample
From the baseline, a random sample of villages was drawn. A table of random numbers wasused for the village selection (see Annex 2).
A total of 391 villages were surveyed, out of the 5,946 villages considered for the survey, i.e.about 6.5% of the villages in northern Laos. A distinction was made between opium growingand non opium growing villages. The number of villages growing and non growing to surveyby district was based on last year results.

Lao Annual Opium Survey 2001 8
The sample broke down as follow:
- 310 villages growing out of 1,909 reported growing by the district authorities (or16,2%)
- 79 villages not growing out of 3,894 reported not growing by the district authorities (or2,0%)
- 2 villages out of 143 for which the district authorities did not know whether or not thesevillages were growing opium poppy.
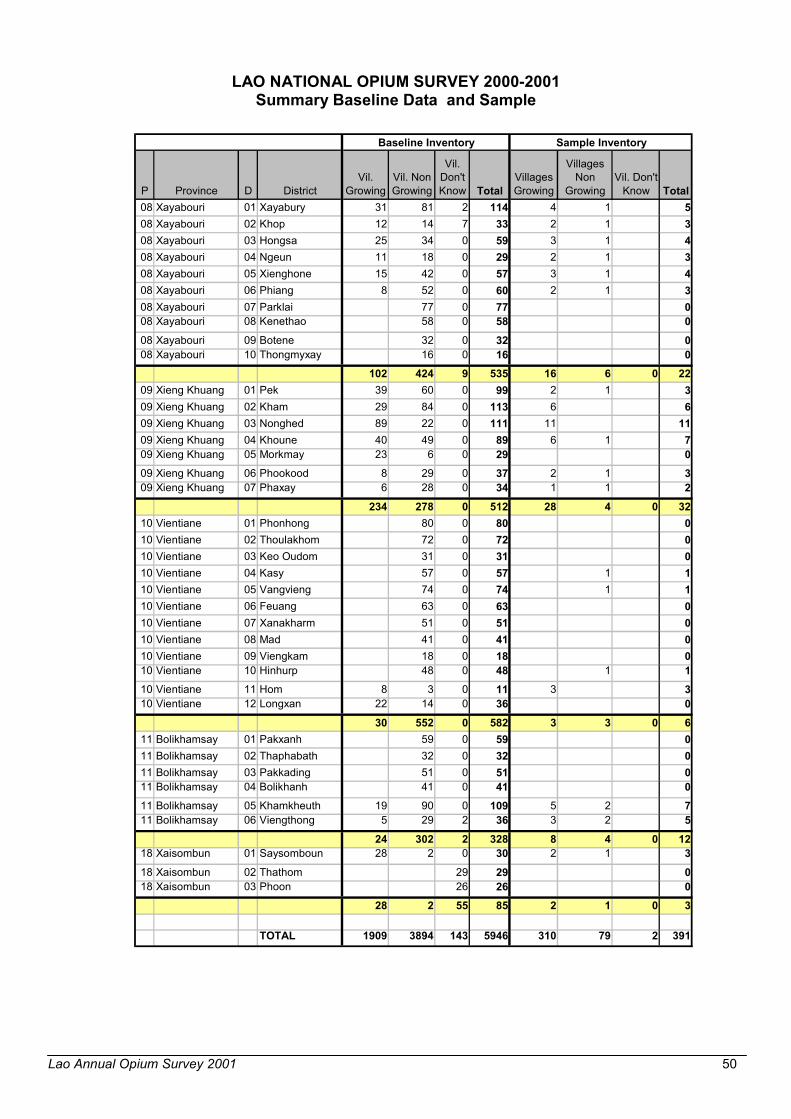
A summary of the number of villages surveyed by district is in Annex 4.
The Interviews and Field Measurement
A ground based approach means that the data were collected by interviews of key informantsand by physical measurement of the opium fields. The interviews followed a questionnaireand were made of 3 parts: the village leader interview, the opium growing farmer interviewand the field measurement. The questionnaires are in Annex 3.
The village leader interview
The main purpose of the village headman interview was to obtain first hand information onthe village demography and the number of households growing opium poppy. Theseinformation were used to cross-check or complement the data provided by the districtauthorities.
Another very important information that was gathered at this stage was the number of opiumaddicts by gender and age.
Other information included the walking time to the opium fields, the opium farmgate price andfor some villages, the geographical co-ordinates were measured with GPS1 instruments.
The opium growing farmers interview
From the village headman�s list of households and by using table of random numbers, arandom sample of farmers growing opium poppy was drawn. Between 6 and 10 poppyfarmers were interviewed in each village.
The main purpose of this interview was to collect data on the number of opium poppy fieldscultivated by farmer and the opium farmgate price.
The field measurement
Once the farmer�s interview was completed, the opium farmer led the surveyors to the opiumfields. A number of data were gathered directly from the surveyor inspection of the field aswell as by additional questions to the farmer regarding the field being surveyed.
The surveyors measured the opium fields, using the same equipment2 and method as for theLao Agricultural Census (98/99). All the fields cultivated by the farmers are measured.
1 Global Positioning System2 Calculators, compasses and measuring tapes rented from the National Statistics Center

Lao Annual Opium Survey 2001 9
When the opium fields were matured, the surveyors also measured the capsule diameter andheight. These data were used for the yield estimate.
Organisation and Staff
The survey was initiated and supervised by the Lao Commission on Drug Control andSupervision (LCDC), through the newly established Programme Facilitation Unit. The surveyimplementation was carried out by the National Statistics Centre in close collaboration withthe provincial and district authorities. UNDCP provided financial support as well as technicalsupport through its Illicit Crop Monitoring Programme (ICMP).
Thirty-five surveyors were recruited from the provincial administration and the NationalStatistics Centre. A one-week training was organized in December at the National StatisticsCentre.
After the training, the surveyors were assigned the districts they had to survey and they wereprovided with the baseline forms, survey forms and equipment.
After introducing the purpose of the survey to the district authorities, the surveyors wereinstructed to fill in the baseline data and to carry out the random sampling of villages tosurvey. The surveyors were accompanied in their field work by 2 district technicians tofacilitate the location of the village and to introduce the survey to the village headmen.
At the village level, the village headman was first interviewed to fill in the first part of thesurvey. This included collecting data on the village population and ethnicity, data on addictionby gender and age, as well as building a list of households cultivating opium.
This list of households cultivating opium poppy was used to draw the random sample ofopium farmers to be interviewed. After the survey, the list is left with the village headman.
After the opium farmer interview, the field measurements took place. All the fields of theinterviewed farmers are measured.
In UNDCP alternative development projects, the survey was conducted by project staff.
Training
In December, a one-week training for the supervisors took place in Vientiane. The trainingcovers interview techniques, description of the survey process, description of thequestionnaires, the use of GPS, the field measurement technique, the capsule measurementtechnique, the random selection of villages and opium farmers. A 1 day field practice tookplace.
In the fields, the surveyors could rely on an �instruction manual� that described all steps ofthe survey, including the interviews, the field measurement and the random samplingmethods.
Survey constraints

Lao Annual Opium Survey 2001 10
The use of GPS was limited to the central level supervisors. Only 2 teams were equippedwith GPS during the survey.
For security reasons, the district of Morkmay in Xieng Kouang Province was not consideredfor the village survey.
Data processing
The database and the data entry programme was designed in MS Access by the Illicit CropsMonitoring Programme and installed on the computers of the National Statistic Centre. 5technicians from the National Statistic Centre did the data entry. The data entry wassupervised and checked by UNDCP technical staff and took one month (total of 5 men-months).
The data analysis was initiated at the National Statistics Centre in collaboration with ICMPand preliminary results were available in June 2000. The database was then sent to UNDCP-Vienna for review and fine-tuning. The preliminary results were confirmed, except for theyield estimate, for which results were amended by ICMP and the Scientific Section.
2001 National Opium SurveyProvinces 11Districts 82Villages 5,946Villages surveyed 391Opium fields for area measurement 2,411Opium fields for yield measurement 591Capsules measured 16,283Surveyors and survey teams 35Field activities started 05/01/01Field activities ended 18/03/01

Lao Annual Opium Survey 2001 11
II. Survey Findings
Provincial Poppy Cultivation
The estimated area cultivated with opium poppy was based on the field measurements madeby the surveyors.
The following steps were used to estimate the area cultivated per province:
1) The village survey data were grouped at the provincial level;2) The provincial household average plot size was calculated;3) The provincial average number of households cultivating poppy was calculated;4) The provincial household average plot size (2) was multiplied by the provincial average
number of households cultivating poppy (3) to obtain the provincial average village poppyarea;
5) The provincial average village poppy area (4) was multiplied by the number of villagesreported cultivating opium poppy by district.
In the districts of Beng, Long, and Nonghed, given the largest sample size, the estimatesobtained by UNDCP project surveys were used instead of the initial national survey findings.
At the country level, the survey estimates that there were 17,255 hectares of poppy undercultivation in the 2000-2001 season. It was the lowest national estimates since 1992 andrepresented a reduction of 1,800 ha compared with the 1999-2000 season (19,052 ha). Itconfirmed the downward trend of opium poppy cultivation in Laos since 1998 when thecultivation of opium poppy reached a peak at 26,800 hectares.
The estimates per province are presented here below:
Area Estimates By Province (ha)
P
VillagesGrowingSurveyed
FieldMeasured
Avg HHArea
AvgVillage
HHGrowing
AvgVillageArea
VillageGrowing
TotalArea*(ha)
02Phongsaly 55 260 0.28 30.54 3.93 390 3,27804Udomxay 53 476 0.50 26.73 13.36 233 3,11206Luang Prabang 50 366 0.52 29.49 15.21 194 2,95007Huapanh 51 445 0.24 28.43 6.96 417 2,90303Luang Namtha 31 278 0.23 29.04 6.62 244 1,68709Xieng Khouang 28 255 0.33 23.71 7.76 234 1,42608Xayabouri 16 190 0.36 24.72 8.81 104 72918Xaisombun 2 23 0.39 24.72 9.56 54 52105Bokeo 13 56 0.38 24.72 9.48 45 42710Vientiane 3 13 0.36 24.72 8.96 30 11711Bolikhamxay 8 49 0.17 24.72 4.19 25 105
310 2,411 1,970 17,255 * including project estimates for the districts of Beng, Long and Nonghed

Lao Annual Opium Survey 2001 12
The decrease compared to the previous estimates is mainly due to a reduction in the averagenumber of households per village that grow opium poppy. At the national level, there is a netdecrease of households growing opium poppy.
The reduction is also partly due to a decrease in the number of village growing opium poppyin the main poppy cultivating provinces, which have the largest average field size. However,at the national level there is an increase in the total number villages growing opium poppy,but this increase is mainly located in the marginal opium producing provinces withtraditionally smaller average field size.
The decrease in the total number of villages, from 6,404 in 2000 to 5,946 in 2001 (or 458villages), is due to the fact that the 1995 census was used to establish the 2000 baselinewhereas the 2000 census was used to establish the 2001 baseline3. There is a general moveat the district level to consider the smallest villages with larger ones, which explains thedecrease in the total number of villages from 1995 to 2000. When looking at the populationestimates, there is an increase by 1.33% in the total number of inhabitants for the 11Northern Provinces (2,322,705 in 2000 to 2,353,552 in 2001).
It should be noted that this year all the baseline data were collected in time and, except forsome population data missing for some villages, completely for every district. This had notbeen the case in the past, and in previous surveys some baseline data had to be estimatedwhen the district data were missing.
P
AvgVillage
HHGrowing
AvgVillage
HHGrowing
NbrVillage
Growing
NbrVillage
Growing Area(ha)
Area(ha)
2000 2001 � 2000 2001 � 2000 2001 �
02Phongsaly 29.10 30.54 1.44 462 390 -72 3,872 3,278 -594
03Luang Namtha 24.30 26.73 2.43 221 244 23 1,514 1,687 173
04Udomxay 30.00 29.49 -0.51 261 233 -28 4,061 3,112 -949
05Bokeo 28.50 28.43 -0.07 46 45 -1 448 427 -21
06Luang Prabang 33.80 29.04 -4.76 219 194 -25 3,036 2,950 -86
07Huapanh 27.80 23.71 -4.09 424 417 -7 3,921 2,903 -1,018
08Xayabouri 28.50 24.72 -3.78 78 104 26 508 729 221
09Xieng Khouang 24.50 24.72 0.22 180 234 54 1,376 1,426 50
10Vientiane 28.50 24.72 -3.78 2 30 28 19 117 98
11Bolikhamxay 28.50 24.72 -3.78 22 25 3 73 105 32
18Xaisombun 28.50 24.72 -3.78 25 54 29 224 521 297 1,940 1,970 30 19,052 17,255 -1,797
The survey confirmed that opium poppy cultivation mainly took place in the 6 provincestargeted by the Opium Elimination Programme. The cultivation in these 6 provincesaccounted for 89 % of the total area under cultivation.
3 The 2000 census was not yet available for the 2000 opium survey.

Lao Annual Opium Survey 2001 13
2001 Poppy Cultivation : Provincial Shares
Xaynaburi4%
Xieng Khouang8%
Luang Namtha10%
Huaphanh17%
Luang Prabang17%
Udomxay18%
Phongsaly19%
Bokeo2%
Xaysombun3%
Vientiane1% Bolikhamxay
1%
The following table shows the estimated area of poppy cultivation for each province for thepresent and past surveys:
Area Estimates Over the Years (in ha)1992 1996 1998 2000 2001
Phongsaly 2,840 3,558 5,778 3,872 3,278UdomXay 1,860 2,416 5,597 4,061 3,112Luang Prabang 3,510 3,550 2,786 3,036 2,950Huapanh 3,770 3,817 3,450 3,921 2,903Luang Namtha 1,730 2,197 3,593 1,514 1,687Xieng Khuang 2,880 2,916 2,902 1,376 1,426Xayabouri 400 754 1,014 508 729Xaisombun n/a n/a n/a 224 521**Bokeo 620 785 428 448 427Vientiane 880* 900* 672* 19 117**Bolikhamsay 700 708 617 73 105
19,190 21,601 26,837 19,052 17,255 * include Xaisombun ** Previously within Xaisombun, the districts of Hom and Longxan are part of Vientiane Province since 2001.

Lao Annual Opium Survey 2001 14
Area Estimates 1992-2001
0
5,000
10,000
15,000
20,000
25,000
30,000
1992 1996 1998 2000 2001
Compared to the 2000 estimates, the most significant decreases were noticed in theprovinces of Huapanh (- 1,018 ha or -26%) and in Udomxay (-949ha or -23%).
The increase for Vientiane Province (from 19 ha to 118 ha) is due to the incorporation of thedistricts of Longxan and Hom, which previously belonged to Xaisombun province.
The most important increase is for the Xaisombun Special Region, for which the cultivationmore than double even though 2 districts have now been incorporated to Vientiane Province.
Provincial Area Estimates over the Years (in ha)
Phon
gsal
y
Udo
mXa
y
Luan
g Pr
aban
g
Hua
panh
Luan
g N
amth
a
Xien
g Kh
uang
Xaya
bour
i
Xais
ombu
n
Boke
o
Vien
tiane
Bolik
ham
say
20011998
19920
1,000
2,000
3,000
4,000
5,000
6,000
2001
2000
1998
1996
1992

Lao Annual Opium Survey 2001 15
District Poppy Cultivation
The estimated area, broken down by district, is in annex 5. The map representing thisinformation is in annex 6.
Out of the 82 districts in the northern provinces, opium poppy cultivation was reported in 64districts. Opium poppy cultivation disappeared in 3 districts: Parklay in Xayabouri Provinceand Kasy and Vangvieng in Vientiane Province.
Poppy cultivation continues to be highly concentrated within a few districts. The top tendistricts account for 38% of the total national area, while 80% of the cultivation takes place inthe top 33 districts.
The top 5 decreases in absolute number compare to last year survey are presented below:
Top 5 District DecreaseProvince District ha for 2001 decrease (ha) %
Huapanh Xamneua 292.41 - 1,020.85 -78%Phongsaly Khua 487.46 - 434.40 -47%Luang Prabang Viengkham 258.53 - 406.99 -61%UdomXay Xay 454.14 - 354.90 -44%Xieng Khuang Nonghed 300.00 - 227.36 -43%
The 5 highest increases in absolute number compare to last year survey are reported below:
Top 5 District IncreaseProvince District ha increase (ha) %
Huapanh Viengthong 424.70 230.48 119%Luang Namtha Namtha 450.35 224.22 99%Xieng Khuang Pek 302.82 211.10 230%Xaisombun Saysomboun 269.93 198.30 277%Luang Namtha Sing 490.09 133.77 38%
Location of Poppy Cultivation
The geographic coordinates of the villages have been provided by the UXO-Lao programmefor 4,967 villages out of 5,946 villages in Northern Laos. This information was combined withthe baseline data received in 2001 from the district authorities regarding the opium growingstatus of the villages. The result is a better understanding of the geographic distribution of thevillages cultivating opium poppy in Northern Laos. That is summarized in the map presentedin annex 7.

Lao Annual Opium Survey 2001 16
The location of villages was also matched against a Digital Elevation Model providing theelevation. The analysis of the elevation and the distribution of poppy growing villages ispresented in annex 8. The conclusion indicates that 80% of the villages that cultivate poppyare situated above 700 meters, while there are only 29% of the villages that do not growopium poppy lying above 700 meters.
Elevation OpiumGrowingVillages
Non-OpiumGrowingVillages
below 700 m 20% 71%above 700 m 80% 29%
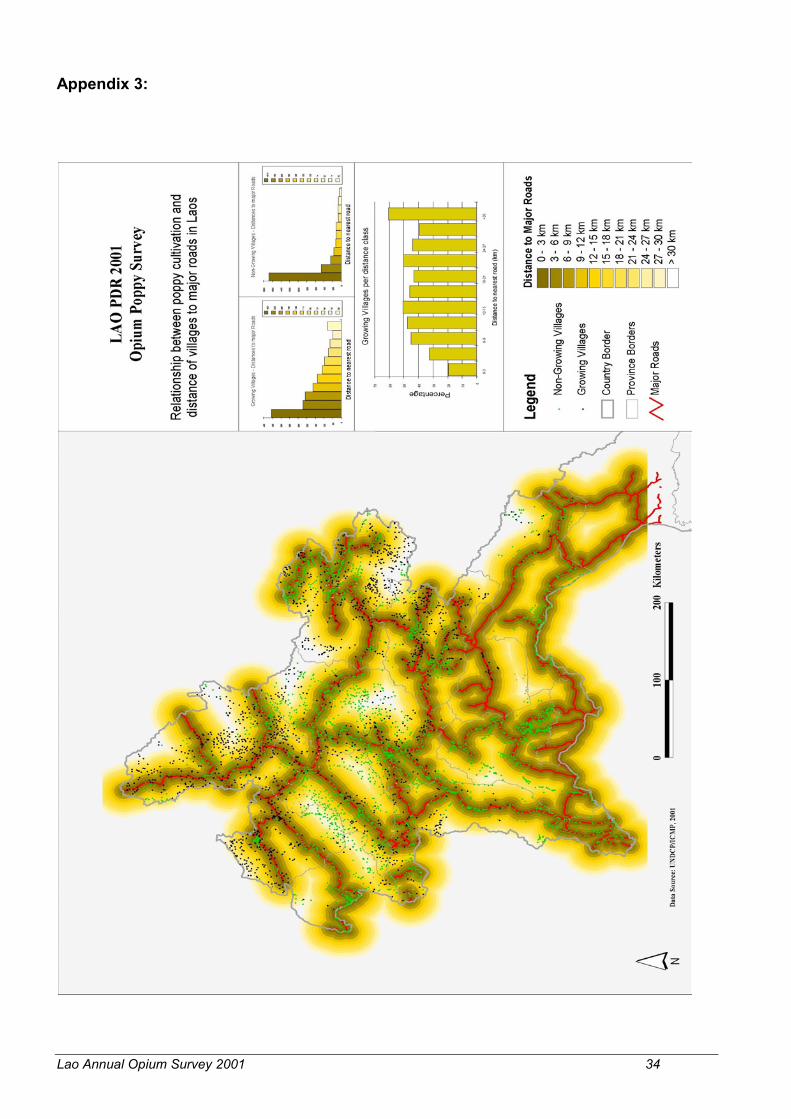
Finally, the analysis of the distribution of the villages around the main roads shows that therate of poppy growing villages against non-poppy growing villages increases when thedistance of the villages to the road increases. More than 60% of the villages that are morethan 30 kilometres away from a road cultivate poppy while more than 80% of the villagesnearer than 3 km to a road do not. This analysis is presented in annex 9.
Yield and Production
Practical field procedures used to collect data (number, and height and diameter of poppycapsules) to estimate opium gum yield are based on the �Guidelines for Yield Assessment ofOpium Gum and Coca Leaf from Brief Field Visits�4 prepared by UNDCP Scientific Sectionand the Illicit Crop Monitoring Programme. These guidelines were the outcome of aConsultative Meeting on Methodologies for Yield Assessment of Illicit Narcotic Crops, held inVienna from 30 October to 3 November 2000, to which Laos sent one participant.
The guidelines provide for practical field procedures and for options to calculate yield fromcapsule volume using different formulae.
Opium gum yield for Laos in 2001 was calculated using a linear correlation between capsulevolume per one square metre (cm3/m2) and oven dry gum yield (kg/ha):
Y= 1.89 + 0.0412*VC
where Y = dry gum weight (kg/ha)VC = projected mature capsule volume per square metre (cm3/m2)
While it may be convenient to use an existing formula, it should be understood that anycorrelation used has to be tested to establish whether it is applicable to the locally obtaineddata. This has not yet been done in Laos but it is expected that such an exercise will beconducted during the next opium season.
During the 2001 opium survey, 591 fields were randomly selected and surveyed. Yieldestimates were calculated at the square metre-plot level, based on the above formula, and atthe field level, the district, province and national levels. Yields at field level are simpleaverages of the figures for individual square-metre plots (five per field). At district, provinceand the national level, yield figures were weighted against surveyed area. If at least 30 fieldswere surveyed in one district, the data from these 30 fields were used to estimate the yieldfor that district. If less than 30 fields were surveyed at the district level, then the provincial
4 ST/NAR/33, United Nations, New York, 2001.

Lao Annual Opium Survey 2001 17
yield estimate was applied. In provinces where less than 30 fields were surveyed, theaverage yield obtained at the national level was used.
The yield applied for every district is presented in annex 5. The district yield was multipliedwith the district area, giving the estimated district production. Summing up all the districtproductions, the total potential opium production for Laos was estimated at around 134 metrictonnes. This production estimate, divided by 17,254ha, the total poppy cultivation area inLaos, resulted in a national average yield figure of 7.8kg/ha.
Based on a preliminary estimate available in June, national production was estimated at 117metric tonnes and the national average yield at 6.8kg/ha. The Lao Government used thispreliminary estimate for an official planning exercise in July, at a time when the final resultshad not yet been established. The Lao Government is still referring to these preliminaryfigures.
The following table shows the estimated opium production for each province for the presentand past surveys:
Production Estimates over the Years (in kilo)Province 1992 1996 1998 2000 2001Phongsaly 19,000 27,500 26,580 31,824 31,747Huapanh 22,500 17,300 15,870 33,705 25,384UdomXay 12,300 19,600 25,747 36,536 22,269Luang Prabang 22,400 17,200 12,816 36,007 20,906Xieng Khuaong 20,300 15,600 13,350 8,205 11,169Luang Namtha 11,500 16,900 16,526 12,211 10,428Xayabouri 2,500 6,900 4,666 4,068 3,688Bokeo 4,400 6,700 1,969 2,761 3,160Bolikhamxai 4,800 5,800 2,838 213 776Xaisombun n/a n/a n/a 1,400 3,854**Vientiane 7,000* 6,900* 3,091* 167 870**
126,700 140,400 123,453 167,097 134,253 * including Xaisombun *Previously in Xaysombun special region, Hom and Langxan
districts are now part of Vientiane Province
Lao Annual Opium Survey 2001 18
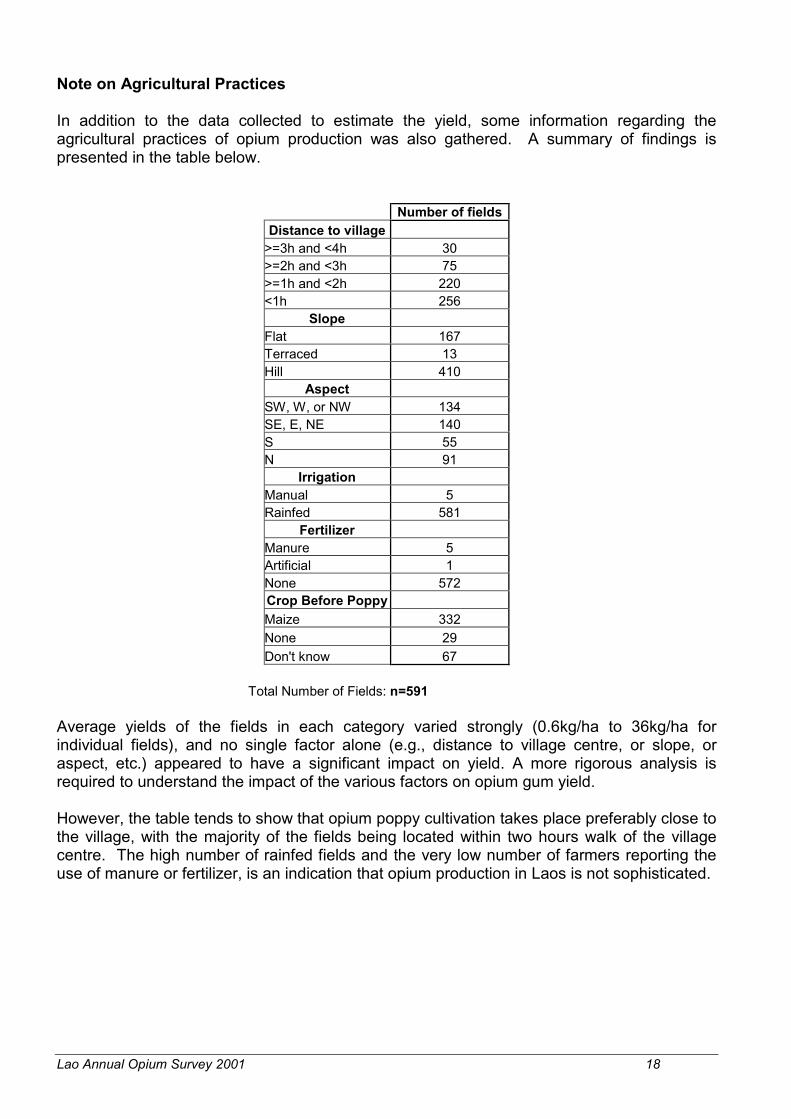
Note on Agricultural Practices
In addition to the data collected to estimate the yield, some information regarding theagricultural practices of opium production was also gathered. A summary of findings ispresented in the table below.
Number of fieldsDistance to village
>=3h and <4h 30>=2h and <3h 75>=1h and <2h 220<1h 256
SlopeFlat 167Terraced 13Hill 410
Aspect SW, W, or NW 134SE, E, NE 140S 55N 91
IrrigationManual 5Rainfed 581
Fertilizer Manure 5Artificial 1None 572Crop Before Poppy Maize 332None 29Don't know 67
Total Number of Fields: n=591
Average yields of the fields in each category varied strongly (0.6kg/ha to 36kg/ha forindividual fields), and no single factor alone (e.g., distance to village centre, or slope, oraspect, etc.) appeared to have a significant impact on yield. A more rigorous analysis isrequired to understand the impact of the various factors on opium gum yield.
However, the table tends to show that opium poppy cultivation takes place preferably close tothe village, with the majority of the fields being located within two hours walk of the villagecentre. The high number of rainfed fields and the very low number of farmers reporting theuse of manure or fertilizer, is an indication that opium production in Laos is not sophisticated.

Lao Annual Opium Survey 2001 19
Opium Prices
The farmgates prices for opium vary by location and time. Typically, the prices are lower justafter the harvest but gradually increase as the opium gets drier and the stock available getsmaller. The farmers don�t sell their opium all at once after the harvest, nor is all of it sold totraders. Most farmers keep part of the harvest for their own consumption or for sale to otherpeople either in the same village or to nearby villages for local consumption.
During the 2001 survey, the village headman provided information on the farmgate pricesfrom March 2000 to February 2001 and the expected price for the 2001 harvest.
1,241,5971,208,9891,236,4381,313,3051,325,042
1,254,367
1,489,2331,392,812
1,455,7201,435,6081,538,933
1,470,6661,384,971
-
200,000
400,000
600,000
800,000
1,000,000
1,200,000
1,400,000
1,600,000
1,800,000
Mar-00 Apr-00 May-00 Jun-00 Jul-00 Aug-00 Sep-00 Oct-00 Nov-00 Dec-00 Jan-01 Feb-01 Mar-01
Month
Kip
/kg
At the country level, there was little change between the average prices of March 2000 at1,241,000 KIP/kg (or 163 USD/kg at March 2000 exchange rate of 7,627 KIP/USD) and ofFebruary 2001 at 1,470,000 KIP/kg (or 178 USD/kg at February 2001 exchange rate of 8,280KIP/USD). The expected price for the 2001 opium harvest was estimated at 1,384,000 KIP/kg(or 165 USD/kg at March 2001 exchange rate of 8,408 KIP/USD).
Addiction
Data on opium addiction, with a breakdown by gender and age, were collected during theinterview of the village headman. The addicts themselves were not interviewed during the2001 survey and no data on their level of consumption were collected.
Although it is possible to provide some estimates on the number of addicts, it should benoted that the opium survey is primarily an agricultural survey and that addiction level wouldbe better estimated through more in-depth sociological surveys.
For the 11 northern provinces, the number of addicts was estimated at 58,173 persons, adecrease of 8% compared to last year.
163 USD/kg165 USD/kg

Lao Annual Opium Survey 2001 20
The table here below present the data at the provincial level:
ID Province Pop Total Addict Addiction Rate06Luang Prabang 377,244 10,020 2.66%10Vientiane* 334,290 9,590 2.87%04UdomXay 229,297 7,894 3.44%07Huapanh 262,668 5,840 2.22%08Xayabouri 316,465 5,412 1.71%03Luang Namtha 126,399 4,935 3.90%09Xieng Khuang 205,820 4,929 2.39%05Bokeo 126,183 3,960 3.14%02Phongsaly 152,821 3,838 2.51%11Bolikhamsay 190,002 1,188 0.63%18Xaisombun 32,362 568 1.76%
2,353,552 58,173 2.47% * Include Hom and Longxan districts
Addiction by gender and age
Out of the 3,347 addicts counted during the survey, 2,686 were men (or 80%) and 661 werewomen (or 20%). The previous surveys indicated comparable ratio.
Also comparable to previous survey, the frequency distribution by age classes, showed thatthe highest number of addicts was to be found among people between 40 and 50 years old,and this for both men and women.
Age Man Woman Total f0-10 0 0 0 0.00%10-20 37 3 40 1.20%20-30 301 62 363 10.85%30-40 601 132 733 21.90%40-50 630 149 779 23.27%50-60 591 163 754 22.53%60-70 382 104 486 14.52%70-80 121 32 153 4.57%80-90 16 14 30 0.90%
90-100 7 2 9 0.27% 2,686 661 3,347

Lao Annual Opium Survey 2001 21
Field Damage
Out of the 2,207 farmers interviewed, only 840 farmers answered whether there had beenany damage to their crop this year. 729 reported some kind of damage, 111 reported nodamage.
The main reasons for damage as stated by the farmers can be grouped as follow:
Number of answers %Dryness 487 67%
Bad weather 25 3%
Pest 130 18%
Other 87 12%
729
Lao Annual Opium Survey 2001 22
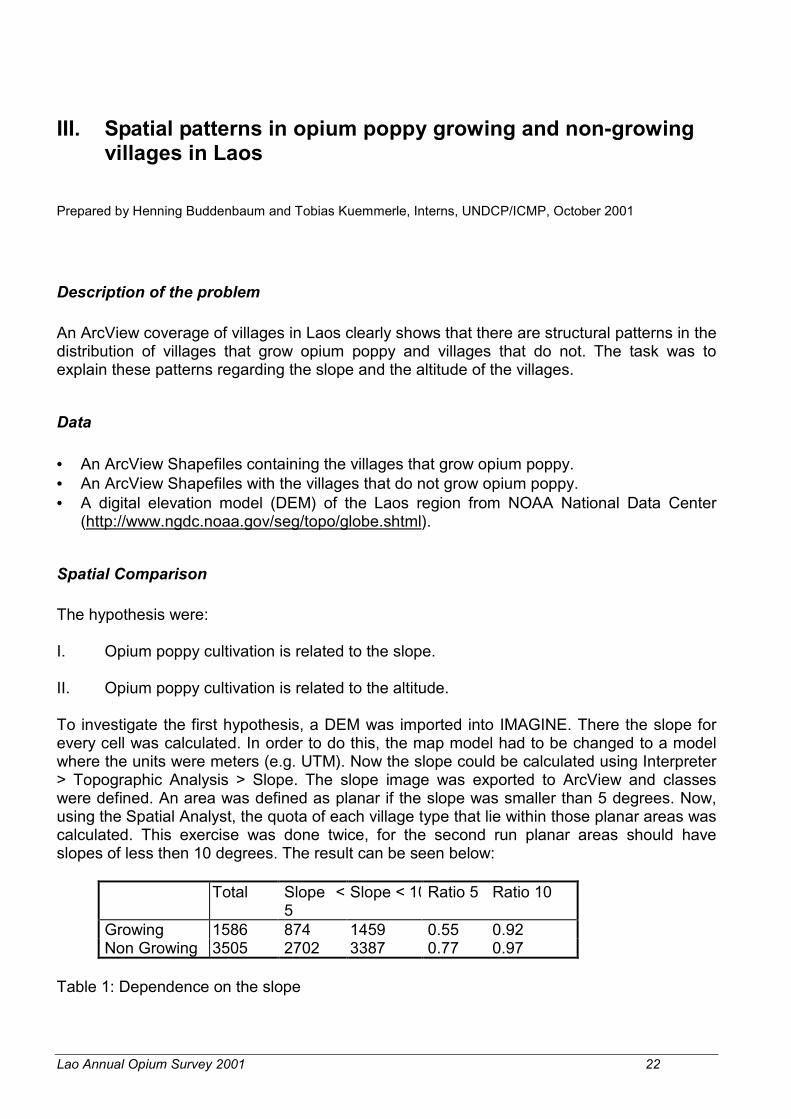
III. Spatial patterns in opium poppy growing and non-growingvillages in Laos
Prepared by Henning Buddenbaum and Tobias Kuemmerle, Interns, UNDCP/ICMP, October 2001
Description of the problem
An ArcView coverage of villages in Laos clearly shows that there are structural patterns in thedistribution of villages that grow opium poppy and villages that do not. The task was toexplain these patterns regarding the slope and the altitude of the villages.
Data
• An ArcView Shapefiles containing the villages that grow opium poppy.• An ArcView Shapefiles with the villages that do not grow opium poppy.• A digital elevation model (DEM) of the Laos region from NOAA National Data Center
(http://www.ngdc.noaa.gov/seg/topo/globe.shtml).
Spatial Comparison
The hypothesis were:
I. Opium poppy cultivation is related to the slope.
II. Opium poppy cultivation is related to the altitude.
To investigate the first hypothesis, a DEM was imported into IMAGINE. There the slope forevery cell was calculated. In order to do this, the map model had to be changed to a modelwhere the units were meters (e.g. UTM). Now the slope could be calculated using Interpreter> Topographic Analysis > Slope. The slope image was exported to ArcView and classeswere defined. An area was defined as planar if the slope was smaller than 5 degrees. Now,using the Spatial Analyst, the quota of each village type that lie within those planar areas wascalculated. This exercise was done twice, for the second run planar areas should haveslopes of less then 10 degrees. The result can be seen below:
Total Slope <5
Slope < 10Ratio 5 Ratio 10
Growing 1586 874 1459 0.55 0.92Non Growing 3505 2702 3387 0.77 0.97
Table 1: Dependence on the slope
Lao Annual Opium Survey 2001 23
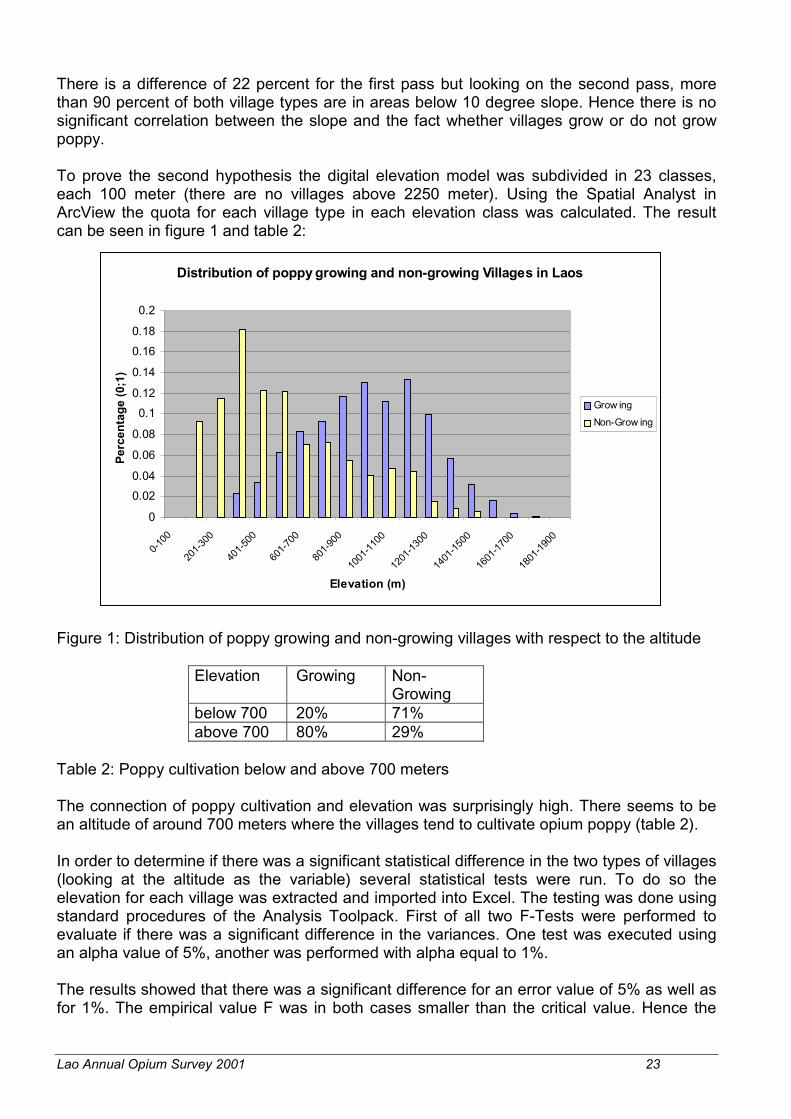
There is a difference of 22 percent for the first pass but looking on the second pass, morethan 90 percent of both village types are in areas below 10 degree slope. Hence there is nosignificant correlation between the slope and the fact whether villages grow or do not growpoppy.
To prove the second hypothesis the digital elevation model was subdivided in 23 classes,each 100 meter (there are no villages above 2250 meter). Using the Spatial Analyst inArcView the quota for each village type in each elevation class was calculated. The resultcan be seen in figure 1 and table 2:
Figure 1: Distribution of poppy growing and non-growing villages with respect to the altitude
Elevation Growing Non-Growing
below 700 20% 71%above 700 80% 29%
Table 2: Poppy cultivation below and above 700 meters
The connection of poppy cultivation and elevation was surprisingly high. There seems to bean altitude of around 700 meters where the villages tend to cultivate opium poppy (table 2).
In order to determine if there was a significant statistical difference in the two types of villages(looking at the altitude as the variable) several statistical tests were run. To do so theelevation for each village was extracted and imported into Excel. The testing was done usingstandard procedures of the Analysis Toolpack. First of all two F-Tests were performed toevaluate if there was a significant difference in the variances. One test was executed usingan alpha value of 5%, another was performed with alpha equal to 1%.
The results showed that there was a significant difference for an error value of 5% as well asfor 1%. The empirical value F was in both cases smaller than the critical value. Hence the
Distribution of poppy growing and non-growing Villages in Laos
0
0.020.04
0.06
0.08
0.10.12
0.14
0.160.18
0.2
0-100
201-3
00
401-5
00
601-7
00
801-9
00
1001
-1100
1201
-1300
1401
-1500
1601
-1700
1801
-1900
Elevation (m)
Perc
enta
ge (0
;1)
Grow ing
Non-Grow ing
Lao Annual Opium Survey 2001 24
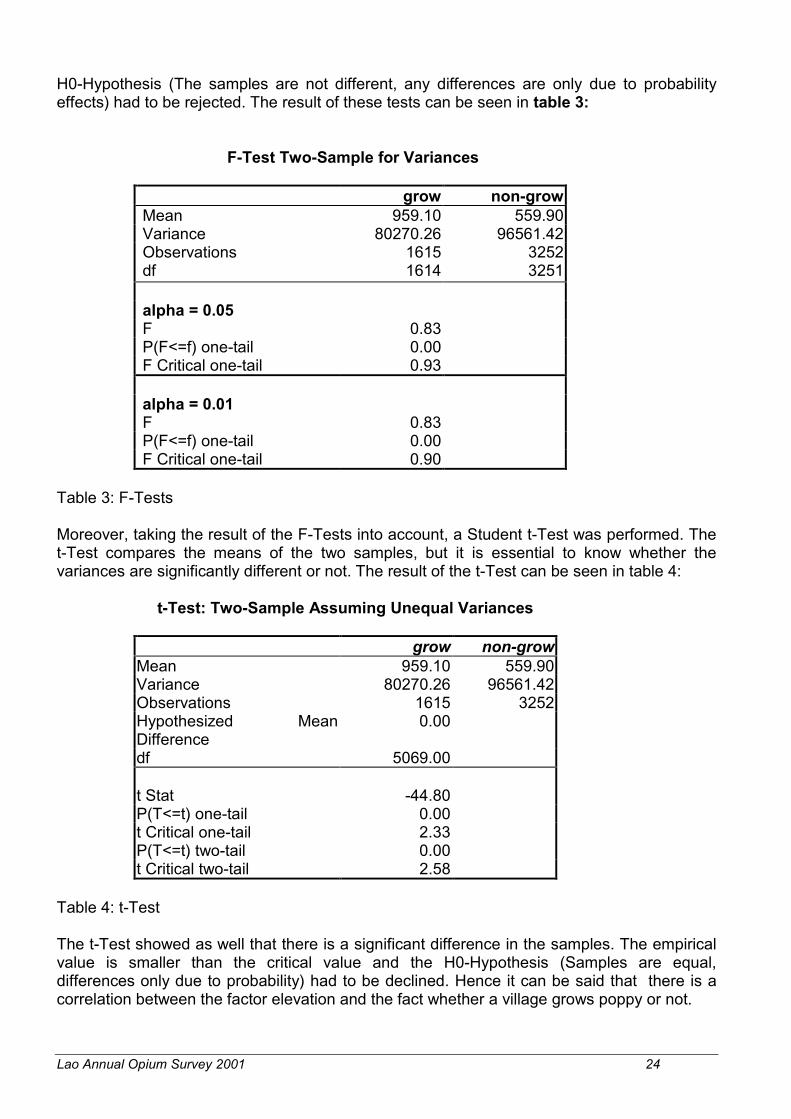
H0-Hypothesis (The samples are not different, any differences are only due to probabilityeffects) had to be rejected. The result of these tests can be seen in table 3:
F-Test Two-Sample for Variances
grow non-growMean 959.10 559.90Variance 80270.26 96561.42Observations 1615 3252df 1614 3251
alpha = 0.05F 0.83P(F<=f) one-tail 0.00F Critical one-tail 0.93
alpha = 0.01F 0.83P(F<=f) one-tail 0.00F Critical one-tail 0.90
Table 3: F-Tests
Moreover, taking the result of the F-Tests into account, a Student t-Test was performed. Thet-Test compares the means of the two samples, but it is essential to know whether thevariances are significantly different or not. The result of the t-Test can be seen in table 4:
t-Test: Two-Sample Assuming Unequal Variances
grow non-growMean 959.10 559.90Variance 80270.26 96561.42Observations 1615 3252Hypothesized MeanDifference
0.00
df 5069.00
t Stat -44.80P(T<=t) one-tail 0.00t Critical one-tail 2.33P(T<=t) two-tail 0.00t Critical two-tail 2.58
Table 4: t-Test
The t-Test showed as well that there is a significant difference in the samples. The empiricalvalue is smaller than the critical value and the H0-Hypothesis (Samples are equal,differences only due to probability) had to be declined. Hence it can be said that there is acorrelation between the factor elevation and the fact whether a village grows poppy or not.

Lao Annual Opium Survey 2001 25
Conclusion
The result to this investigation is that there is no clear relation between the slope and poppycultivation in Laos.
But a statistically significant correlation exists between poppy growing and a village�selevation. 80 % of the villages that cultivate poppy are situated above 700 m while only 29 %of the villages that do not grow opium poppy lie above that height.

Lao Annual Opium Survey 2001 26
Appendix 1:
Elevation classes and percentages of villages within those classes
Classes Growing Ratio Non-Growing Ratio
0 -100101 -200 304 0.0936201 - 300 375 0.1155301 - 400 37 0.0229 592 0.1823401 - 500 55 0.0341 397 0.1223501 - 600 102 0.0632 396 0.1220601 - 700 133 0.0824 230 0.0708701 - 800 150 0.0929 238 0.0733801 - 900 189 0.1171 181 0.0557901 - 1000 211 0.1307 132 0.04071001 - 1100 182 0.1128 154 0.04741101 - 1200 217 0.1338 147 0.04531201 - 1300 160 0.0991 52 0.01601301 - 1400 93 0.0576 28 0.00861401 - 1500 51 0.0316 19 0.00591501 - 1600 27 0.0167 1 0.00031601 - 1700 6 0.0037 1 0.00031701 - 1800 2 0.00121801 - 19001601 - 20002001 - 21002101 - 22002201 - 2300> 2301
1615 1 3252 1

Lao Annual Opium Survey 2001 27
IV. Relationship between poppy cultivation anddistance of villages to major roads in Laos
Prepared by Henning Buddenbaum, intern, UNDCP/ICMP, October 2001
Description of the problem:
A quick look at the distribution of the villages cultivating opium poppy (referred to as �opiumgrowing�) and the villages not cultivating opium poppy (referred to as �non-growing�) seemsto indicate a relation to the road network. Cultivation tends to be in remote areas, away frommajor roads. As the necessary data and GIS tools are available an investigation wasperformed to find if there is indeed a correlation between the fact whether a village iscultivating opium poppy or not and the distance of that village to the nearest major road.
Data:
• An ArcView Shapefile containing the coordinates of villages and whether they do or donot grow poppy according to the 2001 Laos Opium Poppy Survey
• An ArcView Shapefile containing the major roads of Laos
GIS Analysis
The first step in analyzing the correlation between the villages� distance to the major roadsand the fact whether they grow poppy or not was to create of raster map of 1000 rows and1450 columns. Each cell in this map contains the distance to the next major road inside theten northern provinces of Laos where the 2001 opium poppy survey took place.
Eleven classes of distance were created, each three kilometers wide � e.g. the class of up to3 km distance, the class of 3 to 6 km distance and so on until the class of more than 30 kmdistance. An example can be seen in figure 1:
Figure 1: Major Roads (red) with 3 km wide classes of distance (brown to light yellow);growing (black) and non-growing (green) villages

Lao Annual Opium Survey 2001 28
After that the number of growing and non-growing villages in each class was counted and putinto a histogram using ArcView`s Spatial Analyst. In total 4,967 villages were in the data set;1,615 were growing poppy, 3,252 were not and for 100 there was no data.The result is presented in figure 2:
Distance of Villages to Major Roads
0200400600800
10001200140016001800
0 - 3 3 - 6 6 - 9 9 -12 12-15 15-18 18-21 21-24 24-27 27-30 > 30
Distance (km)
Num
ber o
f Vill
ages
GrowingNon-Growing
Figure 2: Histograms of growing and non-growing villages with respect to their distance to aroad
This graph clearly shows that most of the villages are near to a road, whether they growpoppy or not.
A closer examination of the relative histograms of growing and non-growing villages in theirclasses of distance shows that their distribution is different (figures 3 and 4):
Figures 3 and 4: Relative Histograms for the distance classes of growing and non-growing villages
While more than 50 % of the non-growing villages lie less than three kilometers of distanceaway from a road, 75 % of the villages that cultivate opium poppy are farther away from thenearest road.
Distribution of non-growing villages
0
10
20
30
40
50
60
0 - 3 6 - 9 12-15 18-21 24-27 > 30
Distance to nearest road (km)
Perc
enta
ge
Distribution of growing villages
0
5
10
15
20
25
30
0 - 3 6 - 9 12-15 18-21 24-27 > 30
Distance to nearest road (km)
Perc
enta
ge

Lao Annual Opium Survey 2001 29
The correlation between poppy cultivation and distances to roads becomes even clearerwhen considering the percentage of villages cultivating poppy inside a distance class (figure5):
Figure 5: Percentage of villages growing poppy among all villages inside a class of distance
The proportion of growing villages against non-growing villages tends to increase when thedistance to the nearest road increases.
Less than twenty per cent of the villages within three kilometers from a road grow poppy. Thisrate rises to 32.6 % for villages between 3 and 6 km and 45.2 % for villages between 6 and 9km away from a major road. Among the villages that are between 9 and 30 km away from aroad the rate of poppy cultivation is relatively stable around 45 %. The maximum rate ofpoppy cultivation (60.6 %) can be found in villages that are in very remote areas at more than30 kilometers of distance to a major road.
Statistical analysis
To determine the statistical significance standard statistical tests were run using the AnalysisToolpack in Microsoft Excel.
The H0-Hypothesis for both the F-Test and the Student t-Test states that the two samplesare not different and that differences are only due to probability effects. The H1-Hypothesisstates the contrary: there is significant difference in the variance (F-Test) and the mean value(Student t-Test).
To check if there was a significant difference in the variance of the two sets of data an F-Testwas executed, first with an alpha of 5 % and then with an alpha of 1 %.The result can be seen in table 1:
Growing villages per distance class
0
10
20
30
40
50
60
70
0 - 3 3 - 6 6 - 9 9 - 12 12 - 15 15 - 18 18 - 21 21 - 24 24 - 27 27 - 30 > 30
Distance to nearest road (km)
Perc
enta
ge

Lao Annual Opium Survey 2001 30
F-Test Two-Sample forVariances
grow non-growMean 10.99 6.89Variance 81.54 62.99Observations 1615 3252df 1614 3251
alpha = 0.05F 0.77P(F<=f) one-tail 0.00F Critical one-tail 0.93
alpha = 0.01F 0.77P(F<=f) one-tail 0.00F Critical one-tail 0.91
Table 1: F-Tests
Both tests show that there is significant difference in the variances of the two samples.
To compare the means of the two samples, a Student t-Test was performed on the data(table 2):
t-Test: Two-Sample Assuming UnequalVariances
grow non-growMean 10.99 6.89Variance 81.54 62.99Observations 1615 3252Hypothesized Mean Difference 0.00df 2880.00t Stat -15.52P(T<=t) one-tail 0.00t Critical one-tail 2.33P(T<=t) two-tail 0.00t Critical two-tail 2.58
Table 2: t-Test
This test also shows that the samples are significantly different, as the t-Stat value is smallerthan the critical value. So both the F-Test and the Student t-Test confirm that the H0-Hypothesis can be rejected on a confidence level of 99 %.
This means that at the national level there is a significant correlation between poppycultivation and distance to major roads. There percentage of villages growing poppy riseswith distance to the roads.

Lao Annual Opium Survey 2001 31
Local differences in the distribution of villages
A comparison of the spatial patterns of villages in different provinces was made (see map�Distribution of villages by province�), to check if the conclusions made at the national levelwere also valid at the provincial level.Six provinces were examined. They represent 1290 of the 1615 villages cultivating poppy.
In Phongsaly the distribution of villages is similar to the national distribution. 74 % of thevillages far away from a road grow poppy.
The spatial distribution of villages in Louang Namtha does not match the nationaldistribution. As usual the class containing the most villages is the class of villages near aroad. But 60 % of the villages in remote areas do not cultivate poppy while there is poppycultivation all around the province.
In UdomXay poppy cultivation is not restricted to remote areas either. Only 10 % of thevillages farther away form a road than 18 km grow poppy but 48 % of the villages nearer to aroad than 18 km cultivate opium.
Xieng Khuang shows a typical distribution. Most of the villages both growing and non-growing are near the roads, but all the villages farther away than 24 km grow poppy.
Huapanh is a typical province, too: the farther away the nearest road the higher thepercentage of growing villages.
Louang Prabang matches the national distribution. The highest percentage (42 %) of poppygrowing villages can be found in the area of more than 30 km distance to a road.
Conclusion
As a result it can be stated that the probability of poppy growing rises with distance from theroad network. The two samples are significantly different, as shown in the statistical tests.More than 60 % of the villages that are more than 30 kilometers away from a road cultivatepoppy while more than 80 per cent of the villages nearer than 3 km to a road do not.The distribution of road distances is similar in most regions: the rate of poppy cultivation riseswith rising distance to a major road.

Lao Annual Opium Survey 2001 32
Appendix 1:
Distance classes and percentage of growing and non-growing villages within those classes;Percentage of poppy-growing villages among all villages in a class
Distance (km) 0 - 3 3 - 6 6 - 9 9 - 12 12 - 15 15 - 18 18 - 21 21 - 24 24 - 27 27 - 30 > 30 Sum
Growing Total 403 223 209 165 138 111 98 75 65 48 80 1615Pct. 25.0 13.8 12.9 10.2 8.5 6.9 6.1 4.6 4.0 3.0 5.0 100
Non-growing Total 1679 462 253 182 135 130 129 74 82 74 52 3252Pct. 51.6 14.2 7.8 5.6 4.2 4.0 4.0 2.3 2.5 2.3 1.6 100
Percentage ofGrowing Villages 19.4 32.6 45.2 47.6 50.5 46.1 43.2 50.3 44.2 39.3 60.6

Lao Annual Opium Survey 2001 33
Appendix 2:
Provincial distribution of villages within the distance classes and percentage of poppy-growing villages among all villages in a class
Distance (km) 0-3 3-6 6-9 9-12 12-15 15-18 18-21 21-24 24-27 27-30 >30 Sum
PhongsalyGrowing 62 41 47 45 35 35 23 16 19 10 15 348Non-growing 84 33 18 18 11 7 6 2 1 0 5 185Percentage ofGrowing Villages 42.5 55.4 72.3 71.4 76.1 83.3 79.3 88.9 95.0 100.0 75.0
Luang NamthaGrowing 75 32 14 21 13 7 12 15 14 6 0 209Non-growing 66 3 0 1 1 3 9 10 15 27 8 143Percentage ofGrowing Villages 53.2 91.4 100.0 95.5 92.9 70.0 57.1 60.0 48.3 18.2 0.0
UdomxaiGrowing 36 28 25 25 19 14 2 2 1 2 0 154Non-growing 94 33 32 24 28 32 30 15 15 4 1 308Percentage ofGrowing Villages 27.7 45.9 43.9 51.0 40.4 30.4 6.3 11.8 6.3 33.3 0.0
Xieng KhuangGrowing 89 42 29 16 13 8 4 0 2 5 12 220Non-growing 154 44 25 11 9 6 2 3 1 0 0 255Percentage ofGrowing Villages 36.6 48.8 53.7 59.3 59.1 57.1 66.7 0.0 66.7 100.0 100.0
HuapanhGrowing 59 35 43 31 29 28 38 31 17 16 32 359Non-growing 193 90 36 21 15 14 5 5 3 5 10 397Percentage ofGrowing Villages 23.4 28.0 54.4 59.6 65.9 66.7 88.4 86.1 85.0 76.2 76.2
Luang PrabangGrowing 40 32 31 17 14 9 8 4 10 7 14 186Non-growing 322 91 64 57 27 34 45 23 19 24 19 725Percentage ofGrowing Villages 11.0 26.0 32.6 23.0 34.1 20.9 15.1 14.8 34.5 22.6 42.4
Lao Annual Opium Survey 2001 34
Appendix 3:

Lao Annual Opium Survey 2001 35
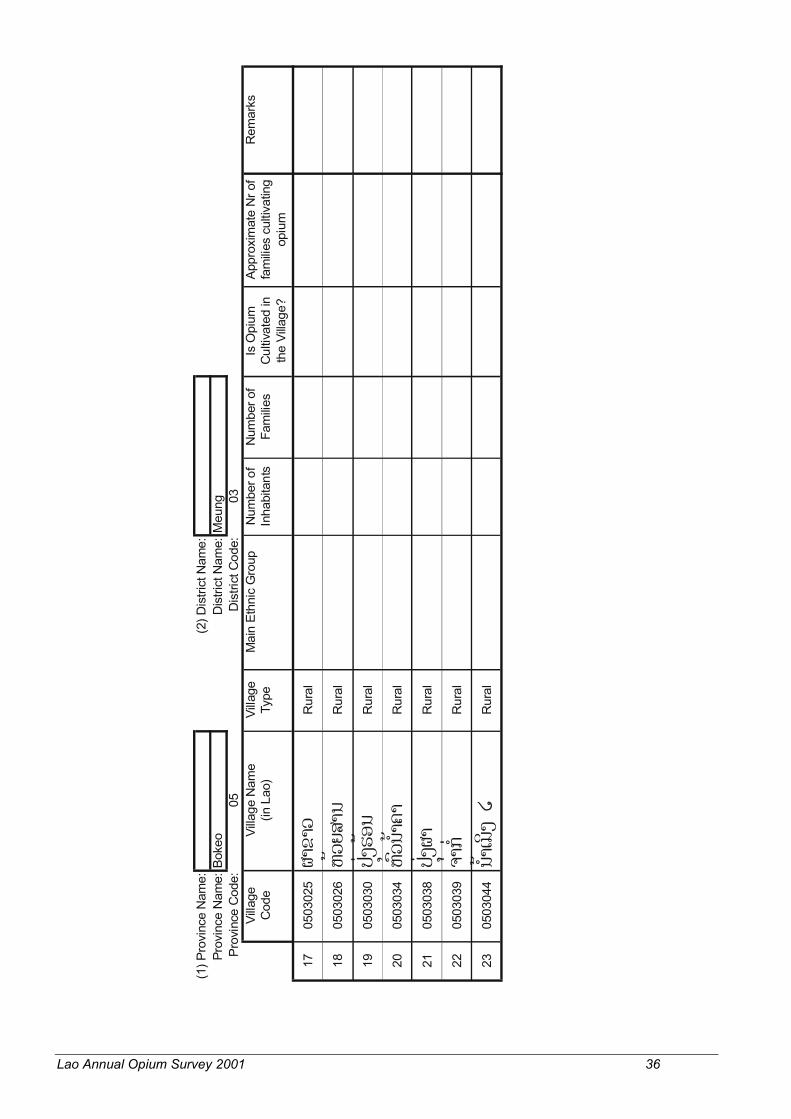
ANNEX 1: Baseline Form
(1) P
rovi
nce
Nam
e:(2
) Dis
trict
Nam
e:To
tal V
illage
s: 2
3Pr
ovin
ce N
ame:
Boke
oD
istri
ct N
ame:
Meu
ngPr
ovin
ce C
ode:
05D
istri
ct C
ode:
03Vi
llage
C
ode
Villa
ge N
ame
(in L
ao)
Villa
ge
Type
Mai
n Et
hnic
Gro
upN
umbe
r of
Inha
bita
nts
Num
ber o
f Fa
milie
sIs
Opi
um
Cul
tivat
ed in
th
e Vi
llage
?
Appr
oxim
ate
Nr o
f fa
milie
s cu
ltiva
ting
opiu
m
Rem
arks
Loum
/The
ung/
Soun
g/?
Num
ber
Num
ber
Yes
/ No
/ ?N
umbe
r / ?
105
0300
1oE
g,u' !
Rur
al
205
0300
23r
olts
;jk'
Rur
al
305
0300
43r
o9tg]
uoR
ural
405
0300
5sh;
pmkf
Rur
al
505
0300
8 -
P'fk
;R
ural
605
0300
9so
vocs
^,R
ural
705
0301
1x5'
9v,c
l'R
ural
805
0301
2r6g]
qkR
ural
905
0301
4rtpk
s];'
Rur
al
1005
0301
5sh;
pdk'
Rur
al
1105
0301
68+c
]R
ural
1205
0301
7zk'k,
Rur
al
1305
0301
89jk
;kR
ural
1405
0301
99v
,c9h'
Rur
al
1505
0302
2fv
o,6o
Rur
al
1605
0302
3zkfe
Rur
al
Lao Annual Opium Survey 2001 36
(1) P
rovi
nce
Nam
e:(2
) Dis
trict
Nam
e:Pr
ovin
ce N
ame:
Boke
oD
istri
ct N
ame:
Meu
ngPr
ovin
ce C
ode:
05D
istri
ct C
ode:
03Vi
llage
C
ode
Villa
ge N
ame
(in L
ao)
Villa
ge
Type
Mai
n Et
hnic
Gro
upN
umbe
r of
Inha
bita
nts
Num
ber o
f Fa
milie
sIs
Opi
um
Cul
tivat
ed in
th
e Vi
llage
?
Appr
oxim
ate
Nr o
f fa
milie
s cu
ltiva
ting
opiu
m
Rem
arks
1705
0302
5zk0k
;R
ural
1805
0302
6sh;
plko
Rur
al
1905
0303
0x5j'
Ihvo
Rur
al
2005
0303
4sq;
oE7k
Rur
al
2105
0303
8x5j'
zkR
ural
2205
0303
99jk
d+R
ural
2305
0304
4oE
g,y' @
Rur
al

Lao Annual Opium Survey 2001 37
ANNEX 2
RA
NDO
M S
ELEC
TIO
N O
F VI
LLA
GES
TO
SU
RVEY
1) N
umbe
r of v
illag
es in
the
dist
rict
From
111
2131
4151
6171
8191
101
111
121
131
141
151
161
171
181
191
To10
2030
4050
6070
8090
100
110
120
130
140
150
160
170
180
190
200
2) S
urve
y vi
llage
num
ber:
57
2515
1748
6424
2858
9237
6942
128
8013
110
315
176
1014
2840
4210
1543
116
103
1817
2076
213
31
119
317
513
3039
3556
6685
5782
7790
6212
772
461
117
158
1620
92
5524
2921
895
100
311
314
026
6425
2014
53
1916
414
5355
2525
7372
4468
8064
3814
746
170
169
29
1912
1532
302
7677
4721
6613
013
010
258
6245
100
918
611
1921
656
8878
108
8630
976
121
5515
695
43
2914
493
1640
1280
8868
2242
9811
179
118
4711
51
42
2733
5813
1783
2560
104
126
9386
119
5486
151
180
615
1420
1822
4252
8623
5739
111
4884
1212
017
261
170
104
3820
248
7082
5510
531
3751
102
985
7851
144
175
2950
418
6334
2767
115
2796
100
4830
156
9912
56
710
430
5721
5770
9493
9113
513
610
216
711
146
136
226
1327
438
646
4210
197
6413
228
312
860
3726
318
1159
5227
3263
642
6799
133
451
3815
912
636
232
1687
4922
1327
9710
68
915
515
78
124
6140
7928
119
128
118
2715
789
1410
644
435
627
7912
785
3616
131
150
100
140
108
162
942
4625
7731
506
7811
626
128
4999
113
3448
1438
7862
8819
1819
67
133
7596
172
116
2541
4171
2990
9615
3413
312
352
8983
7218
940
2737
125
773
2410
710
814
810
66
143
4859
Lao Annual Opium Survey 2001 38
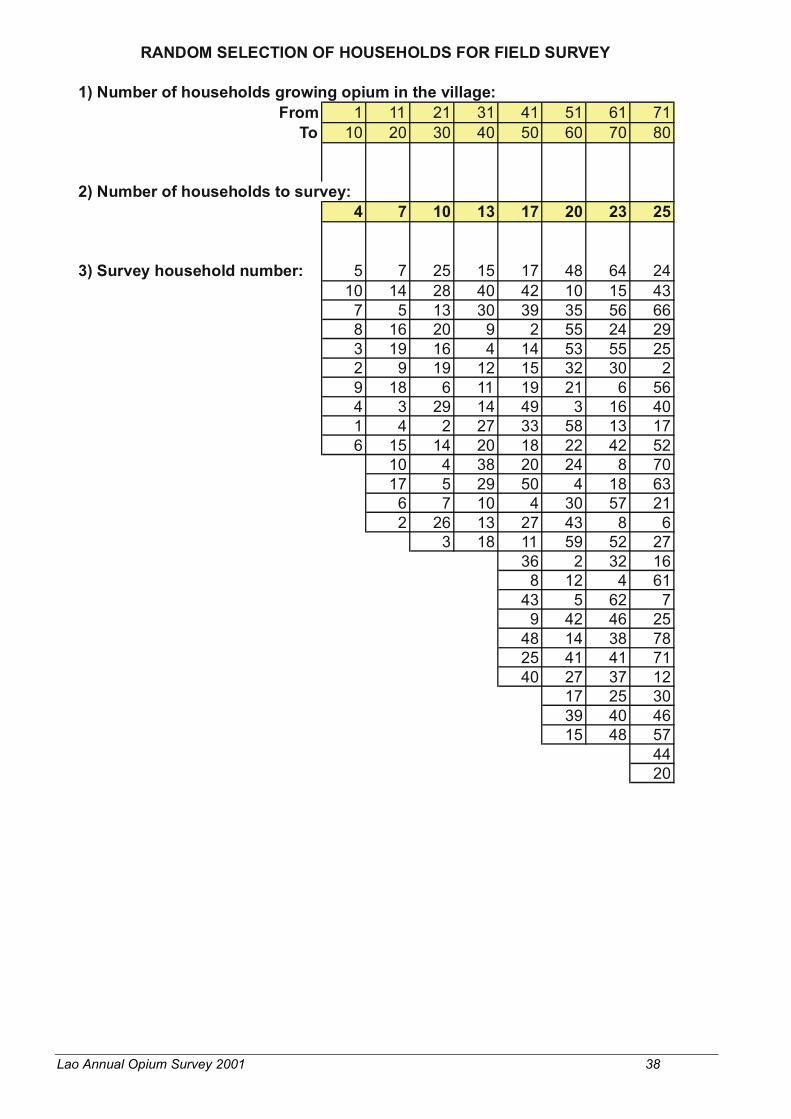
RANDOM SELECTION OF HOUSEHOLDS FOR FIELD SURVEY
1) Number of households growing opium in the village:From 1 11 21 31 41 51 61 71
To 10 20 30 40 50 60 70 80
2) Number of households to survey:4 7 10 13 17 20 23 25
3) Survey household number: 5 7 25 15 17 48 64 2410 14 28 40 42 10 15 43
7 5 13 30 39 35 56 668 16 20 9 2 55 24 293 19 16 4 14 53 55 252 9 19 12 15 32 30 29 18 6 11 19 21 6 564 3 29 14 49 3 16 401 4 2 27 33 58 13 176 15 14 20 18 22 42 52
10 4 38 20 24 8 7017 5 29 50 4 18 63
6 7 10 4 30 57 212 26 13 27 43 8 6
3 18 11 59 52 2736 2 32 16
8 12 4 6143 5 62 7
9 42 46 2548 14 38 7825 41 41 7140 27 37 12
17 25 3039 40 4615 48 57
4420

Lao Annual Opium Survey 2001 39
ANNEX 3LAO NATIONAL OPIUM SURVEY 2000-20001
VILLAGE ADMINISTRATION COMMITTEE
Surveyor Identification1) Surveyor Name:2) Date of interview: / / 2001
Village Identification3) Province: Code:4) District: Code:5) Village: Code:
Village Position6) GPS Number:7) Waypoint:8) Latitude: N9) Longitude: E10) Altitude: mt11) PDOB:
12) Approximate number of kilometers from an access road: kilometer
13) Remark:
From the Village Administration Committee
14) Total inhabitants:15) Total households:
16) What are the main ethnic groups represented in the village?For each ethnic group, indicate the number of households.
Main Ethnic Group EthnicGroup Code
Number ofhouseholds

Lao Annual Opium Survey 2001 40
LAO NATIONAL OPIUM SURVEY 2000-20001VILLAGE ADMINISTRATION COMMITTEE
On opium cultivation in the village:
18) What is the total number of households cultivatingopium:
19) Within the village boundaries, what is the total numberof opium fields cultivated by these households?
20) Within the village boundaries, is there opium fields rented toor occupied by people not living in the village? Yes No
21) If " Yes", approximately how many fields? fields
From the list of households cultivating opium:
18) Total number of households cultivating opium

Lao Annual Opium Survey 2001 41
LAO NATIONAL OPIUM SURVEY 2000-20001VILLAGE ADMINISTRATION COMMITTEE
OPIUM ADDICTION
19) Write down the gender and age of the people in the village who use opium every day:
# Gender Age # Gender Age1. 41.2. 42.3. 43.4. 44.5. 45.6. 46.7. 47.8. 48.9. 49.10. 50.11. 51.12. 52.13. 53.14. 54.15. 55.16. 56.17. 57.18. 58.19. 59.20. 60.21. 61.22. 62.23. 63.24. 64.25. 65.26. 66.27. 67.28. 68.29. 69.30. 70.31. 71.32. 72.33. 73.34. 74.35. 75.36. 76.37. 77.38. 78.39. 79.40. 80.

Lao Annual Opium Survey 2001 42
LAO NATIONAL OPIUM SURVEY 2000-20001VILLAGE ADMINISTRATION COMMITTEE
HOUSEHOLDS CULTIVATING OPIUM POPPY(after completion, this list is to be handed over to the village headman)
Write down a unique name for every household in which at least one member cultivate opiumpoppy (use the head of household� s name + spouse� s name)
HHNumber
Name of household cultivatingopium poppy
HHNumber
Name of household cultivatingopium poppy
01. 41. 02. 42. 03. 43. 04. 44. 05. 45. 06. 46. 07. 47. 08. 48. 09. 49. 10. 50. 11. 51. 12. 52. 13. 53. 14. 54. 15. 55. 16. 56. 17. 57. 18. 58. 19. 59. 20. 60. 21. 61. 22. 62. 23. 63. 24. 64. 25. 65. 26. 66. 27. 67. 28. 68. 29. 69. 30. 70. 31. 71. 32. 72. 33. 73. 34. 74. 35. 75. 36. 76. 37. 77. 38. 78. 39. 79. 40. 80.

Lao Annual Opium Survey 2001 43
Lao National Opium Survey 2000-2001HOUSEHOLD
Surveyor Identification1) Surveyor Name:2) Date of interview: / / 2001
Village Identification3) Province: Code:4) District: Code:5) Village: Code:
Household IdentificationHH
NumberName of household cultivating
opium poppy6)
7) Ethnic Group Code:
8) Remark:
From the Household HeadMembernumber
Name of householdmember
Relationshipto household
head
Number ofopium fields
last year
Number ofopium fields
this year01. Head02.03.04.05.06.07.08.09.10.11.12.13.14.15.
9) Total household member:10) Total opium field last year:11) Total opium fields this year:
Lao Annual Opium Survey 2001 44
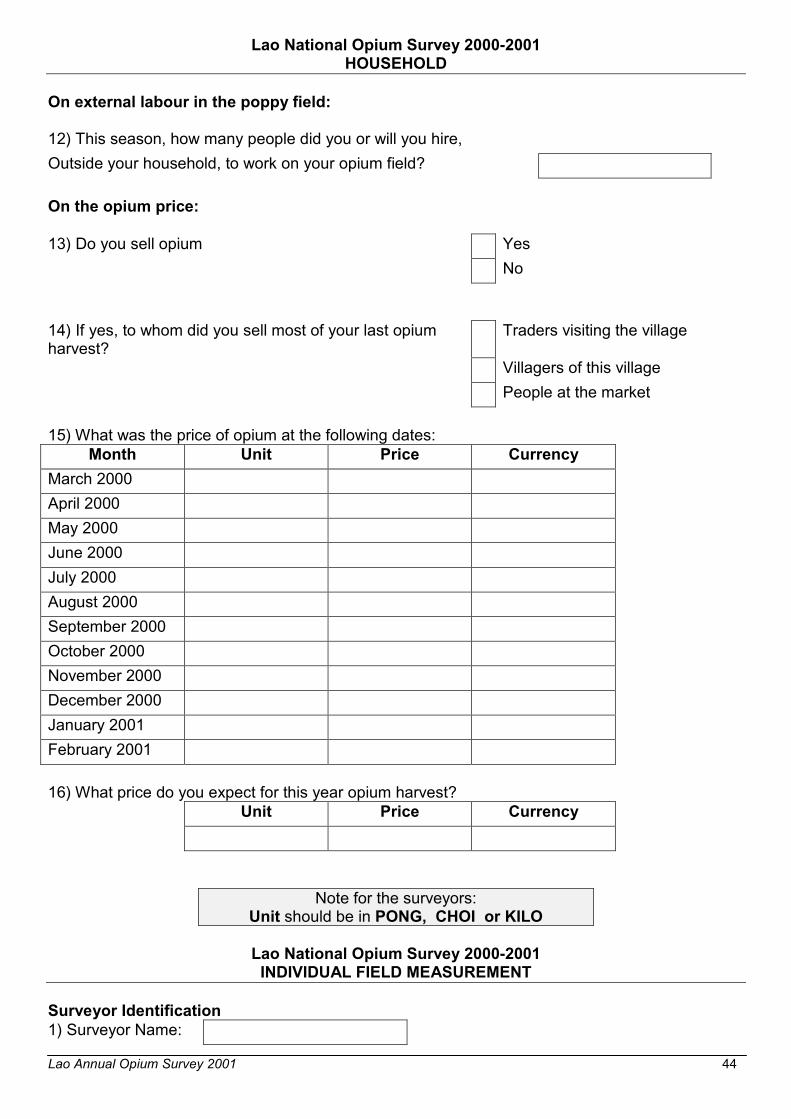
Lao National Opium Survey 2000-2001HOUSEHOLD
On external labour in the poppy field:
12) This season, how many people did you or will you hire,Outside your household, to work on your opium field?
On the opium price:
13) Do you sell opium YesNo
14) If yes, to whom did you sell most of your last opiumharvest?
Traders visiting the village
Villagers of this villagePeople at the market
15) What was the price of opium at the following dates:Month Unit Price Currency
March 2000April 2000May 2000June 2000July 2000August 2000September 2000October 2000November 2000December 2000January 2001February 2001
16) What price do you expect for this year opium harvest?Unit Price Currency
Note for the surveyors:Unit should be in PONG, CHOI or KILO
Lao National Opium Survey 2000-2001INDIVIDUAL FIELD MEASUREMENT
Surveyor Identification1) Surveyor Name:
Lao Annual Opium Survey 2001 45
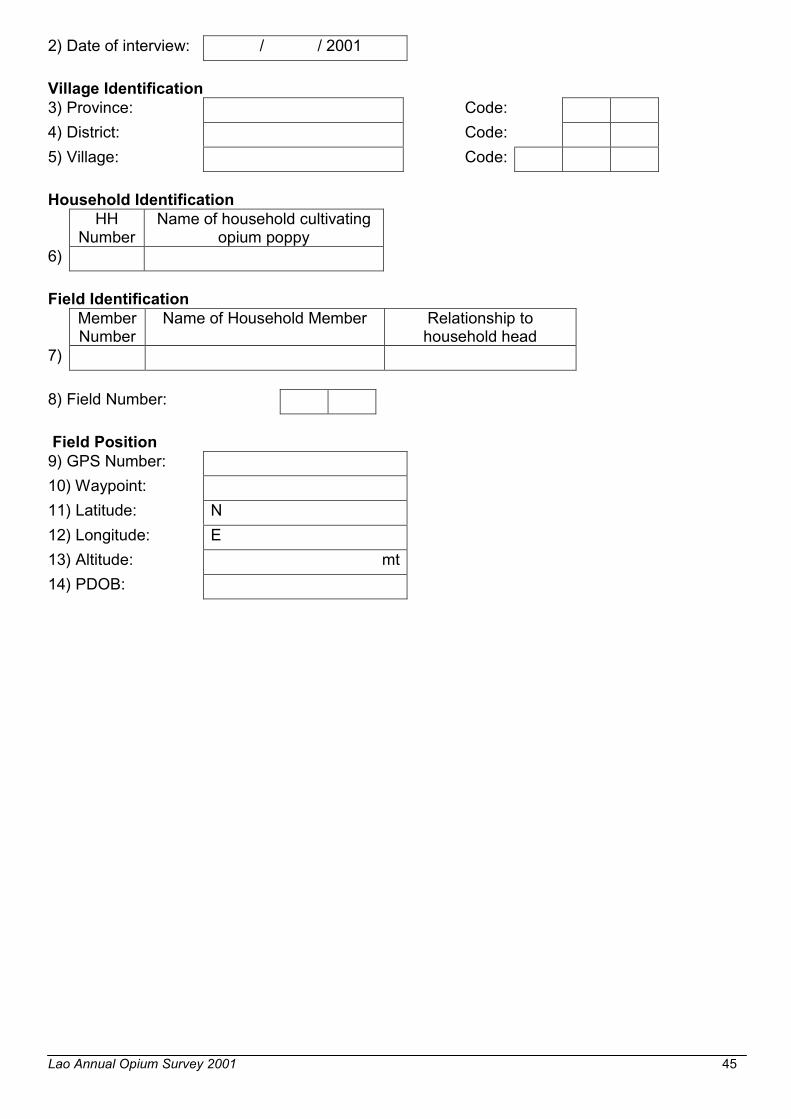
2) Date of interview: / / 2001
Village Identification3) Province: Code:4) District: Code:5) Village: Code:
Household IdentificationHH
NumberName of household cultivating
opium poppy6)
Field IdentificationMemberNumber
Name of Household Member Relationship tohousehold head
7)
8) Field Number:
Field Position9) GPS Number:10) Waypoint:11) Latitude: N12) Longitude: E13) Altitude: mt14) PDOB:

Lao Annual Opium Survey 2001 46
Lao National Opium Survey 2000-2001INDIVIDUAL FIELD MEASUREMENT
Area Measurement
Field Shape
Measurement
Line Bearing Distance Line Bearing Distance1. 11.2. 12.3. 13.4. 14.5. 15.6. 16.7. 17.8. 18.9. 19.10. 20.
15) Error:
16) Area: Ha

Lao Annual Opium Survey 2001 47
Lao National Opium Survey 2000-2001INDIVIDUAL FIELD MEASUREMENT
Capsule Measurement17) Has harvest started on this field? Yes No
For harvesting fields only:
18) Estimate the area where poppy has grown: ha
19) Capsules measurement:Growth Stage Plot 1 Plot 2 Plot 3Flower budsImmature CapsulesLanced CapsulesYielding LancedCapsules
Dmm
Hmm
Dmm
Hmm
Dmm
Hmm
1. 2. 3. 4. 5. 6. 7. 8. 9. 10.
Growth Stage Plot 4 Plot 5Flower budsImmature CapsulesLanced CapsuleYielding LancedCapsules
Dmm
Hmm
Dmm
Hmm
1. 2. 3. 4. 5. 6. 7. 8. 9. 10.
20) If you cannot measure the capsules of this field, indicate the reason:
Lao Annual Opium Survey 2001 48
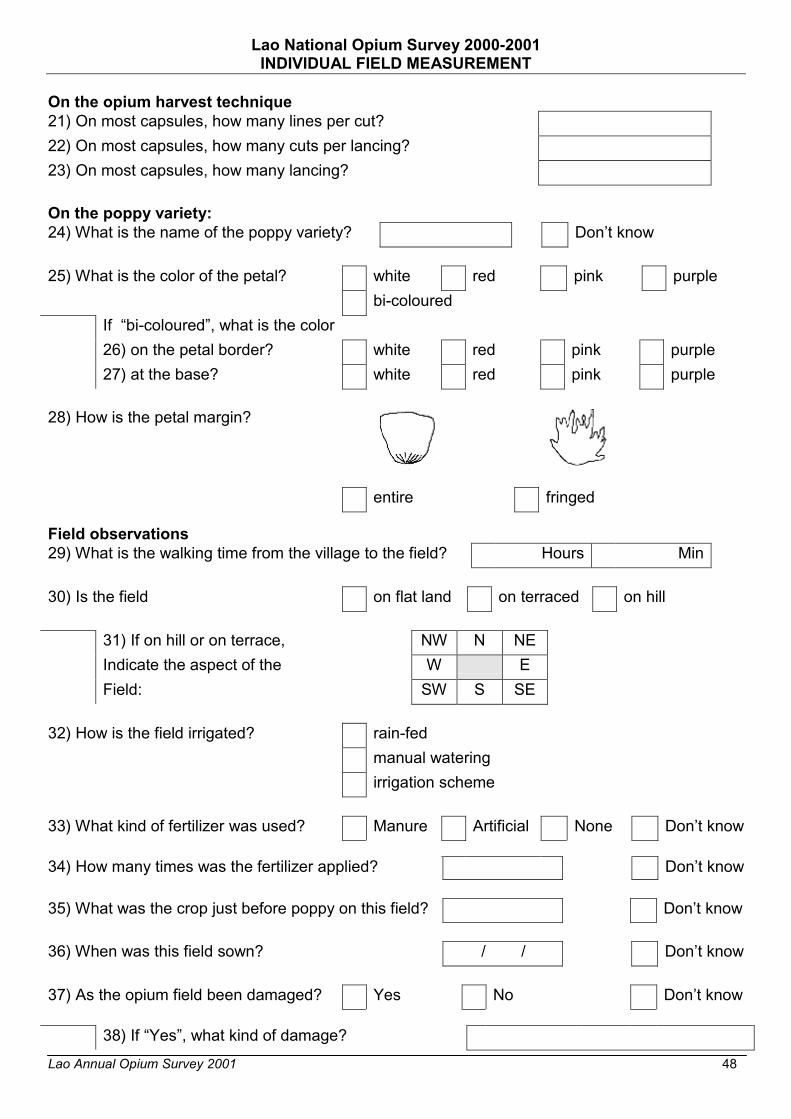
Lao National Opium Survey 2000-2001INDIVIDUAL FIELD MEASUREMENT
On the opium harvest technique21) On most capsules, how many lines per cut?22) On most capsules, how many cuts per lancing?23) On most capsules, how many lancing?
On the poppy variety:24) What is the name of the poppy variety? Don�t know
25) What is the color of the petal? white red pink purplebi-coloured
If �bi-coloured�, what is the color26) on the petal border? white red pink purple27) at the base? white red pink purple
28) How is the petal margin?
entire fringed
Field observations29) What is the walking time from the village to the field? Hours Min
30) Is the field on flat land on terraced on hill
31) If on hill or on terrace, NW N NEIndicate the aspect of the W EField: SW S SE
32) How is the field irrigated? rain-fedmanual wateringirrigation scheme
33) What kind of fertilizer was used? Manure Artificial None Don�t know
34) How many times was the fertilizer applied? Don�t know
35) What was the crop just before poppy on this field? Don�t know
36) When was this field sown? / / Don�t know
37) As the opium field been damaged? Yes No Don�t know
38) If �Yes�, what kind of damage?

Lao Annual Opium Survey 2001 49
ANNEX 4
LAO NATIONAL OPIUM SURVEY 2000-2001Summary Baseline Data and Sample
Baseline Inventory Sample Inventory
P Province D DistrictVil.
GrowingVil. Non Growing
Vil. Don't Know Total
Villages Growing
Villages Non
GrowingVil. Don't
Know Total02 Phongsaly 01 Phongsaly 45 42 0 87 7 2 902 Phongsaly 02 May 51 36 0 87 7 3 1002 Phongsaly 03 Khua 58 61 0 119 10 1 1102 Phongsaly 04 Samphanh 84 5 0 89 10 1 1102 Phongsaly 05 Boon Neua 43 24 0 67 7 1 802 Phongsaly 06 Nhot Ou 72 26 1 99 9 1 1002 Phongsaly 07 Boontai 36 21 0 57 5 1 6
389 215 1 605 55 10 0 6503 Luang Namtha 01 Namtha 68 9 0 77 7 2 903 Luang Namtha 02 Sing 73 28 2 103 8 1 903 Luang Namtha 03 Long 78 13 1 92 8 1 903 Luang Namtha 04 Viengphoukha 17 29 0 46 6 1 703 Luang Namtha 05 Nalae 6 79 0 85 2 2 4
242 158 3 403 31 7 0 3804 UdomXay 01 Xay 28 103 16 147 10 1 2 1304 UdomXay 02 La 36 27 0 63 8 1 904 UdomXay 03 Namor 54 23 19 96 9 2 1104 UdomXay 04 Nga 18 73 4 95 5 2 704 UdomXay 05 Beng 19 55 0 74 5 2 704 UdomXay 06 Hoon 38 129 0 167 9 2 1104 UdomXay 07 Pakbeng 27 51 0 78 7 1 8
220 461 39 720 53 11 2 6605 Bokeo 01 Huoixai 8 123 1 132 2 2 405 Bokeo 02 Tonpheung 4 55 0 59 2 2 405 Bokeo 03 Meung 4 18 0 22 2 1 305 Bokeo 04 Pha Oudom 8 88 0 96 3 2 505 Bokeo 05 Paktha 18 26 3 47 3 1 405 Bokeo 06 Special Region 2 12 0 14 1 1
44 322 4 370 13 8 0 2106 Luang Prabang 01 Luang Prabang 12 110 0 122 1 106 Luang Prabang 02 Xieng Ngeun 16 69 0 85 5 1 606 Luang Prabang 03 Nan 5 59 0 64 1 1 206 Luang Prabang 04 Park Ou 15 53 0 68 2 1 306 Luang Prabang 05 Nambak 20 84 0 104 8 2 1006 Luang Prabang 06 Ngoi 30 86 0 116 8 2 1006 Luang Prabang 07 Pak Xeng 8 78 0 86 4 2 606 Luang Prabang 08 Phonxay 25 47 0 72 4 406 Luang Prabang 09 Chomphet 16 52 2 70 4 1 506 Luang Prabang 10 Viengkham 17 97 0 114 9 2 1106 Luang Prabang 11 Phoukhoune 29 18 0 47 4 1 5
193 753 2 948 50 13 0 6307 Huapanh 01 Xamneua 29 95 27 151 14 1 1507 Huapanh 02 Xiengkhor 22 43 0 65 4 1 507 Huapanh 03 Viengthong 60 23 1 84 4 2 607 Huapanh 04 Viengxay 37 95 0 132 5 2 707 Huapanh 05 Huameuang 84 5 0 89 6 1 707 Huapanh 06 Xamtay 125 58 0 183 10 2 1207 Huapanh 07 Sopbao 20 55 0 75 4 2 607 Huapanh 08 Add 26 53 0 79 4 1 5
403 427 28 858 51 12 0 63
Lao Annual Opium Survey 2001 50
LAO NATIONAL OPIUM SURVEY 2000-2001Summary Baseline Data and Sample
Baseline Inventory Sample Inventory
P Province D DistrictVil.
GrowingVil. Non Growing
Vil. Don't Know Total
Villages Growing
Villages Non
GrowingVil. Don't
Know Total08 Xayabouri 01 Xayabury 31 81 2 114 4 1 508 Xayabouri 02 Khop 12 14 7 33 2 1 308 Xayabouri 03 Hongsa 25 34 0 59 3 1 408 Xayabouri 04 Ngeun 11 18 0 29 2 1 308 Xayabouri 05 Xienghone 15 42 0 57 3 1 408 Xayabouri 06 Phiang 8 52 0 60 2 1 308 Xayabouri 07 Parklai 77 0 77 008 Xayabouri 08 Kenethao 58 0 58 008 Xayabouri 09 Botene 32 0 32 008 Xayabouri 10 Thongmyxay 16 0 16 0
102 424 9 535 16 6 0 2209 Xieng Khuang 01 Pek 39 60 0 99 2 1 309 Xieng Khuang 02 Kham 29 84 0 113 6 609 Xieng Khuang 03 Nonghed 89 22 0 111 11 1109 Xieng Khuang 04 Khoune 40 49 0 89 6 1 709 Xieng Khuang 05 Morkmay 23 6 0 29 009 Xieng Khuang 06 Phookood 8 29 0 37 2 1 309 Xieng Khuang 07 Phaxay 6 28 0 34 1 1 2
234 278 0 512 28 4 0 3210 Vientiane 01 Phonhong 80 0 80 010 Vientiane 02 Thoulakhom 72 0 72 010 Vientiane 03 Keo Oudom 31 0 31 010 Vientiane 04 Kasy 57 0 57 1 110 Vientiane 05 Vangvieng 74 0 74 1 110 Vientiane 06 Feuang 63 0 63 010 Vientiane 07 Xanakharm 51 0 51 010 Vientiane 08 Mad 41 0 41 010 Vientiane 09 Viengkam 18 0 18 010 Vientiane 10 Hinhurp 48 0 48 1 110 Vientiane 11 Hom 8 3 0 11 3 310 Vientiane 12 Longxan 22 14 0 36 0
30 552 0 582 3 3 0 611 Bolikhamsay 01 Pakxanh 59 0 59 011 Bolikhamsay 02 Thaphabath 32 0 32 011 Bolikhamsay 03 Pakkading 51 0 51 011 Bolikhamsay 04 Bolikhanh 41 0 41 011 Bolikhamsay 05 Khamkheuth 19 90 0 109 5 2 711 Bolikhamsay 06 Viengthong 5 29 2 36 3 2 5
24 302 2 328 8 4 0 1218 Xaisombun 01 Saysomboun 28 2 0 30 2 1 318 Xaisombun 02 Thathom 29 29 018 Xaisombun 03 Phoon 26 26 0
28 2 55 85 2 1 0 3
TOTAL 1909 3894 143 5946 310 79 2 391

Lao Annual Opium Survey 2001 51
ANNEX 5
LAO NATIONAL OPIUM SURVEY 2000-2001 Estimated District Opium Poppy Cultivation and District Opium Production
P Province D District Village Growing
2001
Estimated Area
Applied Potential
Yield
Potential Production
ha kg/ha kg 02 Phongsaly 01 Phongsaly 45 378.20 9.69 3,663.12 02 Phongsaly 02 May 51 428.63 9.69 4,151.53 02 Phongsaly 03 Khua 58 487.46 9.69 4,721.35 02 Phongsaly 04 Samphanh 84 705.98 9.69 6,837.82 02 Phongsaly 05 Boon Neua 43 361.40 9.69 3,500.31 02 Phongsaly 06 Nhot Ou 73 613.53 9.69 5,942.39 02 Phongsaly 07 Boontai 36 302.56 9.69 2,930.49
390 3,277.77 31,747.02 03 Luang Namtha 01 Namtha 68 450.35 6.85 3,082.86 03 Luang Namtha 02 Sing 74 490.09 6.85 3,354.88 03 Luang Namtha 03 Long 79 593.96 4.96 2,948.01 03 Luang Namtha 04 Viengphoukha 17 112.59 6.85 770.72 03 Luang Namtha 05 Nalae 6 39.74 6.85 272.02
244 1,686.72 10,428.48 04 UdomXay 01 Xay 34 454.14 7.18 3,261.52 04 UdomXay 02 La 36 480.86 7.18 3,453.37 04 UdomXay 03 Namor 60 801.43 7.18 5,755.62 04 UdomXay 04 Nga 19 253.79 6.86 1,740.25 04 UdomXay 05 Beng 19 253.79 7.18 1,822.61 04 UdomXay 06 Hoon 38 507.57 7.18 3,645.22 04 UdomXay 07 Pakbeng 27 360.64 7.18 2,590.03
233 3,112.21 22,268.61 05 Bokeo 01 Huoixai 8 75.87 7.41 561.83 05 Bokeo 02 Tonpheung 4 37.94 7.41 280.92 05 Bokeo 03 Meung 4 37.94 7.41 280.92 05 Bokeo 04 Pha Oudom 8 75.87 7.41 561.83 05 Bokeo 05 Paktha 19 180.19 7.41 1,334.35 05 Bokeo 06 Special Region 2 18.97 7.41 140.46
45 426.78 3,160.30 06 Luang Prabang 01 Luang Prabang 12 182.49 7.06 1,288.45 06 Luang Prabang 02 Xieng Ngeun 16 243.32 7.06 1,717.93 06 Luang Prabang 03 Nan 5 76.04 7.06 536.85 06 Luang Prabang 04 Park Ou 15 228.12 7.06 1,610.56 06 Luang Prabang 05 Nambak 20 304.16 7.06 2,147.42 06 Luang Prabang 06 Ngoi 30 456.23 7.06 3,221.12 06 Luang Prabang 07 Pak Xeng 8 121.66 7.06 858.97 06 Luang Prabang 08 Phonxay 25 380.19 7.06 2,684.27 06 Luang Prabang 09 Chomphet 17 258.53 7.06 1,825.30 06 Luang Prabang 10 Viengkham 17 258.53 7.35 1,901.03 06 Luang Prabang 11 Phoukhoune 29 441.03 7.06 3,113.75
194 2,950.31 20,905.67 07 Huapanh 01 Xamneua 42 292.41 8.74 2,556.68 07 Huapanh 02 Xiengkhor 22 153.17 8.74 1,339.21 07 Huapanh 03 Viengthong 61 424.70 8.74 3,713.27 07 Huapanh 04 Viengxay 37 257.60 8.74 2,252.31 07 Huapanh 05 Huameuang 84 584.83 8.74 5,113.36 07 Huapanh 06 Xamtay 125 870.28 8.74 7,609.17 07 Huapanh 07 Sopbao 20 139.24 8.74 1,217.47 07 Huapanh 08 Add 26 181.02 8.74 1,582.71
417 2,903.24 25,384.18

Lao Annual Opium Survey 2001 52
LAO NATIONAL OPIUM SURVEY 2000-2001Estimated District Opium Poppy Cultivation and District Opium Production
P Province D District Village Growing
2001
Estimated Area
Applied Potential
Yield
Potential Production
ha kg/ha kg 08 Xayabouri 01 Xayabury 32 186.63 5.06 944.56 08 Xayabouri 02 Khop 13 106.65 5.06 539.75 08 Xayabouri 03 Hongsa 25 133.31 5.06 674.69 08 Xayabouri 04 Ngeun 11 97.76 5.06 494.77 08 Xayabouri 05 Xienghone 15 133.31 5.06 674.69 08 Xayabouri 06 Phiang 8 71.10 5.06 359.83 08 Xayabouri 07 Parklai - - 5.06 - 08 Xayabouri 08 Kenethao - - 5.06 - 08 Xayabouri 09 Botene - - 5.06 - 08 Xayabouri 10 Thongmyxay - - 5.06 -
104 728.75 3,688.29 09 Xieng Khuang 01 Pek 39 302.82 8.94 2,708.51 09 Xieng Khuang 02 Kham 29 225.17 8.94 2,014.02 09 Xieng Khuang 03 Nonghed 89 300.00 3.66 1,098.97 09 Xieng Khuang 04 Khoune 40 310.58 8.94 2,777.95 09 Xieng Khuang 05 Morkmay 23 178.58 8.94 1,597.32 09 Xieng Khuang 06 Phookood 8 62.12 8.94 555.59 09 Xieng Khuang 07 Phaxay 6 46.59 8.94 416.69
234 1,425.86 11,169.06 10 Vientiane 01 Phonhong - - 7.41 - 10 Vientiane 02 Thoulakhom - - 7.41 - 10 Vientiane 03 Keo Oudom - - 7.41 - 10 Vientiane 04 Kasy - - 7.41 - 10 Vientiane 05 Vangvieng - - 7.41 - 10 Vientiane 06 Feuang - - 7.41 - 10 Vientiane 07 Xanakharm - - 7.41 - 10 Vientiane 08 Mad - - 7.41 - 10 Vientiane 09 Viengkam - - 7.41 - 10 Vientiane 10 Hinhurp - - 7.41 - 10 Vientiane 11 Hom 8 72.30 7.41 535.40 10 Vientiane 12 Longxan 22 45.19 7.41 334.63
30 117.49 870.03 11 Bolikhamsay 01 Pakxanh - - 7.41 - 11 Bolikhamsay 02 Thaphabath - - 7.41 - 11 Bolikhamsay 03 Pakkading - - 7.41 - 11 Bolikhamsay 04 Bolikhanh - - 7.41 - 11 Bolikhamsay 05 Khamkheuth 19 79.66 7.41 589.85 11 Bolikhamsay 06 Viengthong 6 25.15 7.41 186.27
25 104.81 776.12 18 Xaisombun 01 Saysomboun 28 269.93 7.41 1,998.83 18 Xaisombun 02 Thathom 14 134.96 7.41 999.42 18 Xaisombun 03 Phoon 12 115.68 7.41 856.64
54 520.58 3,854.90 -
TOTAL 1,970 17,254.52 134,252.66
National Weighted Average Yield 7.78 kg/ha