Embed Size (px)
Citation preview

For Research Use Only. Not for use in diagnostic procedures
Have a question? Contact our Technical Support Team
NA: 800-955-6288 or INTL: 760-603-7200 Email: [email protected]
Page 1 of 12
LanthaScreen® Eu Kinase Binding Assay for CDK2/cyclin E1 Store at –80°C Catalog Number: PV6295 Size: 10 ug PV6296 100 ug PV6297 1 mg
Pub. No. MAN0010125 Rev. A.0
Overview This protocol describes how to perform a LanthaScreen® Eu Kinase Binding Assay designed to detect and characterize kinase inhibitors. Procedure 1 describes an experiment to optimize the concentration of tracer to use with a specific kinase target (not necessary when using kinases from Life Technologies). Procedure 2 describes how to perform kinase inhibitor affinity (IC50) measurements, using either the concentration of tracer determined by the user following Procedure 1 or using the concentration determined experimentally by Life Technologies. The protocol is accompanied by representative data generated at Life Technologies for both procedures.
LanthaScreen® Eu Kinase Binding Assays are based on the binding and displacement of a proprietary, Alexa Fluor® 647‐labeled, ATP‐competitive kinase inhibitor scaffold (kinase tracer) to the kinase of interest (Figure 1). Tracers based on a variety of scaffolds have been developed in order to address a wide range of kinase targets. Binding of the tracer to the kinase is detected using a europium‐labeled anti‐tag antibody, which binds to the kinase of interest. Simultaneous binding of both the tracer and antibody to the kinase results in a high degree of FRET (fluorescence resonance energy transfer) from the europium (Eu) donor fluorophore to the Alexa Fluor® 647 acceptor fluorophore on the kinase tracer. Binding of an inhibitor to the kinase competes for binding with the tracer, resulting in a loss of FRET.
Figure 1 Schematic of LanthaScreen® Eu Kinase Binding Assay
Kinase Tracers from Life Technologies are based on ATP‐competitive kinase inhibitors, making them suitable for detection of any compounds that bind to the ATP site or to an allosteric site altering the conformation of the ATP site. Inhibitors that bind the ATP site include both Type I kinase inhibitors, which bind solely to the ATP site, and Type II inhibitors (e.g., Gleevec®/Imatinib, Sorafenib, BIRB‐796), which bind to both the ATP site and a hydrophobic site exposed in the DFG‐out (non‐active) conformation. Type III inhibitors are compounds that do not compete with ATP, and are loosely referred to as allosteric inhibitors. A study of 15 diverse Type III inhibitors demonstrated that all but one compound was detected in the binding assay with equivalent potency to activity assays. The sole exception was a substrate‐competitive compound, and thus not a true allosteric inhibitor.
In contrast to most fluorescence‐based kinase activity assays, LanthaScreen® Eu Kinase Binding Assays can be read continuously, which facilitates evaluation of compounds with slow binding kinetics. Also, unlike most activity assays, binding assays can be performed using either active or non‐activated kinase preparations, which enables characterization of compounds that bind preferentially to non‐activated kinases, such as Gleevec®/imatinib and some allosteric inhibitors.

Optimization of a LanthaScreen® Eu Kinase Binding Assay for CDK2/cyclin E1
Page 2 of 12
Materials required Product Name Part Number Concentration Quantity Notes CDK2/cyclin E1 PV6295 Lot specific 10 µg (1) 5X Kinase Buffer A PV3189 5X 4 mL (2) Kinase Tracer 236 PV5592 50 µM in DMSO 25 µL (3) LanthaScreen® Eu-anti-GST Antibody PV5594 or PV5595 0.22 to 0.28 mg/mL
(1.5 to 1.8 µM) 25 µg or 1 mg (4)
Staurosporine (optional) PHZ1271 N/A 100 μg (5)
(1) CDK2/cyclin E1 is supplied at a concentration printed on the product label. The molecular weight of the kinase is 133.6 kDa, which can be found on the kinase Certificate of Analysis shipped with the product or at lifetechnologies.com/kinase. The kinase molecular weight will be needed to convert the concentration to molarity as required in the following protocol.
(2) Kinase Buffer A is supplied as a 5X concentrated stock. Prepare a 1X solution by adding 4 mL of the 5X solution to 16 mL of distilled H2O. The 1X kinase reaction buffer is stable at room temperature. 1X Kinase Buffer A consists of 50mM HEPES pH 7.5, 10 mM MgCl2, 1 mM EGTA, 0.01% Brij‐35.
(3) Kinase Tracer 236 is supplied as a 50 μM stock in DMSO.
(4) Prior to use, the antibody tube should be centrifuged at approximately 10,000 x g for 5 minutes, and the solution needed for the assay should be aspirated from the top of the solution. This centrifugation step will eliminate spurious data points that can arise on occasion due to any particulates in the product.
(5) A 1 mM stock of staurosporine can be prepared by dissolving 100 μg of staurosporine in 210 μL of DMSO.
Plate readers The data presented in this document were generated using a Tecan Infinite F‐500 plate reader using the appropriate filters and instrument settings for europium‐based LanthaScreen® assays. The assay can be performed on a variety of plate readers including those from Tecan (Ultra, Infinite F‐500, Safire2), Molecular Devices (Analyst and M5), BMG LABTECH (PHERAstar) and Perkin Elmer (EnVision®, Victor, and ViewLux) or any other plate reader configured for LANCE® or HTRF® assays. General instrument settings are listed in the table below:
Excitation 340 nm (30 nm bandpass) Kinase Tracer Emission 665 nm (10 nm bandpass) LanthaScreen® Eu-anti-Tag Antibody Emission 615 nm (10 nm bandpass) Dichroic Mirror Instrument dependent Delay Time 100 µs Integration Time 200 µs
For additional assistance, ask your Life Technologies representative for instrument‐specific setup guidelines, or contact Life Technologies Discovery Sciences technical support at 800‐955‐6288, or email [email protected] for more information on performing these assays on your particular instrument or for a control to test an instrument.
Plates Assays are typically performed in white low‐volume 384‐well plates (Corning Part No. 3673 or Greiner Part No. 784207) or black, low‐volume 384‐well plates (Corning Part No. 3676). White plates are generally recommended as they yield higher quality data for many assays, especially those with a relatively low assay window (1.5 to 2 fold) or those that are being measured on monochromater‐based instruments or some filter‐based instruments (e.g. Perkin Elmer EnVision®). In other cases, black and white plates yield comparable data.

Optimization of a LanthaScreen® Eu Kinase Binding Assay for CDK2/cyclin E1
Page 3 of 12
Basic protocol for inhibitor studies LanthaScreen® Kinase Binding Assays to evaluate inhibitors of CDK2/cyclin E1 are typically performed by addition of 3 components as follows:
1. Add 4 μL of 4X test compound.
2. Add 8 μL of 2X kinase/antibody mixture.
3. Add 4 μL of 4X tracer.
4. Incubate for 1 hour at room temperature and read plate.
Final assay conditions for inhibitor studies
2.5 nM kinase1
2 nM Eu‐Anti‐GST Antibody
100 nM Kinase Tracer 2362
1X Kinase Buffer A
1A kinase concentration of 2.5 nM kinase is recommended as a starting point for assay development as it typically results in a robust signal. Decreasing the kinase concentration may be necessary for accurate measurement of very tight‐binding inhibitors, similar to kinase activity assays. For specific test cases, successful assays have been performed with as little as 200 pM kinase, though the assay window may be lower.
2A tracer concentration of 100 nM is suggested by Life Technologies, but could also be experimentally determined or optimized in Procedure 1. Optimal tracer concentrations for validated kinases typically fall within the 1 to 100 nM range.

Optimization of a LanthaScreen® Eu Kinase Binding Assay for CDK2/cyclin E1
Page 4 of 12
Procedure 1. Optimization of tracer concentration Note: When using kinases from Life Technologies, this step is not necessary. Proceed directly to inhibitor studies (Procedure 2, page 7).
This step describes how to optimize the tracer concentration for use in subsequent inhibitor studies by performing binding assays with a 2‐fold serial dilution of tracer. This experiment allows for approximation of the tracer dissociation constant (Kd) and evaluation of the signal strength or “assay window” as a function of tracer concentration. It is typically best to select a tracer concentration near Kd or below Kd to ensure sensitive detection of inhibitors. For example, the measured IC50 value from a simple compound titration will approach Ki (dissociation constant of a competitive inhibitor) if [tracer] < tracer Kd and [kinase] << [tracer]. The majority of kinase assays validated by Life Technologies yield a robust signal with the tracer no more than twice the Kd value. In many cases, the Kd value can also be used to calculate Ki from a compound titration experiment using the Cheng‐Prusoff equation (see Procedure 2, page 7), which compensates for the tracer concentration being above Kd. The other factor to consider when selecting a tracer concentration is the signal strength or “assay window” as it correlates very well with assay robustness (i.e. Z’ values). Although in many cases assay windows can exceed 10‐fold, excellent Z’ values are typically obtained with an assay window as low as 2‐fold (see Appendix A, page 10). The specific end application may also impact the choice of tracer concentration, based on both the assay window, Z’, and Kd value.
The relatively simple method to determine tracer Kd described in Procedure 1 is supported by data from an alternative method to calculate Kd (in addition to Ki) as described in Appendix B (page 10). This alternative method is based on a series of inhibitor titrations performed at different tracer concentrations and the resulting Kd values correlate well with those derived using the more rapid method of Procedure 1.
Estimation of tracer Kd and assay window
(1.1) Reagent preparation 1. A dilution series of tracer is prepared at 4 times the final concentration to be assayed.
a. Dilute tracer to 4000 nM by adding 4.8 μL of 50 μM stock tracer to 55 μL of 1X Kinase Buffer A.
b. Add 50 μL of 1X Kinase Buffer A to 6 wells in each of 2 columns of a 96‐well plate.
c. Add 50 μL of 4000 nM tracer to well A1 and mix.
d. Remove 50 μL from well A1, transfer to well A2 and mix.
e. Remove 50 μL from well A2, transfer to well B1 and mix.
f. Continue process as depicted in Figure 2.
2. Prepare kinase/antibody solution at 5 nM kinase and 4 nM antibody (2X the desired final assay concentration). Centrifuge the antibody tube at approximately 10,000 × g for 10 minutes and aspirate desired volume from the top of the solution. Add the volumes of reagents calculated below to calculated volume of Kinase Buffer A.
Calculations (for a 1000 µL solution):
Figure 2 Serial dilution of tracer
Colum
n 1
Colum
n 2
ABCDEF
Serial dilution of tracer in Kinase Buffer A
Stock kinase conc. (nM) = stock conc. (mg/mL) * 1 × 10⁹ (nmol/mol)
133600 (g/mol) [Note: kinase MW]
Kinase volume needed (μL) = 1000 μL * 5 nM
Stock kinase conc. (nM)
Antibody volume needed (μL) = 1000 μL * 4 nM
Stock antibody conc. (μM) * 1000 (nmol /μmol)
Kinase Buffer A needed (μL) = 1000 μL – kinase volume needed (μL) – antibody volume needed (μL)
3. Prepare 40 μM staurosporine (“competitor solution”) by diluting 30 μL of 1 mM staurosporine (from a stock in DMSO) into 960 μL Kinase Buffer A.
4. Prepare 4% DMSO control solution by adding 40 μL DMSO to 960 μL Kinase Buffer A.

Optimization of a LanthaScreen® Eu Kinase Binding Assay for CDK2/cyclin E1
Page 5 of 12
(1.2) Experimental procedure 1. Add 4 μL of each concentration of serially diluted tracer to six replicate assay wells in a 384‐well plate (columns 1–6) as
depicted in Figure 3.
Figure 3 Transfer of tracer dilutions from 96-well to 384-well plate
Assay plate(384-Well)
Assay plate(384-Well)
Colum
n 1
ABCDEF
Colum
n 2
ABCDEF
A B
2. Add 4 μL of competitor solution to three wells for each tracer concentration (columns 1–3).
3. Add 4 μL of DMSO control solution to the other three wells for each tracer concentration (columns 4–6).
4. Add 8 μL of kinase/antibody solution to all wells in columns 1–6.
5. Incubate the plate at room temperature for 60 min and read plate.

Optimization of a LanthaScreen® Eu Kinase Binding Assay for CDK2/cyclin E1
Page 6 of 12
(1.3) Data analysis 1. Divide the acceptor/tracer emission (665 nM) by the
antibody/donor emission (615 nM) to calculate the “emission ratio”.
2. Plot [tracer] versus emission ratio for the competitor (staurosporine) and control (DMSO only) (Figure 4). The sigmoidal dose‐response curve with a variable slope can be fit to the data (optional). The following equation can be used with GraphPad™ Prism software:
F=50
logEC50=logECF-(1/HillSlope)*log(F/(100-F))
Y=Bottom+(Top-Bottom)/(1+10^((LogEC50-X)*HillSlope))
3. The assay window for any given tracer concentration can be calculated by dividing the signal in the absence of competitor (+ staurosporine curve) by the signal in the presence of competitor. The assay window is one of two criteria (the other being the tracer Kd) that are typically used to select a tracer concentration for inhibitor studies. Assays windows of ≥ 2 usually result in high Z’ values (see Appendix A, page 10).
Figure 4 Tracer titration curve
4. Subtract the competitor curve (+ staurosporine) from the control curve (DMSO only) to correct for background signal, which is typically due to diffusion enhanced FRET from Eu to unbound tracer.
5. Plot the background‐corrected emission ratios versus [tracer] and fit to the one site binding (hyperbola) equation to estimate the dissociation constant (Figure 5). In some cases data at the highest one or two tracer concentrations are excluded from curve fits due to relatively high “background” signal in presence of competitor. This can be observed as these data points deviate from the one site binding model, whereas the other points align.
The following equation can be used with GraphPad™ Prism software: Y=Bmax*X/(Kd + X)
Figure 5 Tracer Kd determination (Kd = 102 nM)

Optimization of a LanthaScreen® Eu Kinase Binding Assay for CDK2/cyclin E1
Page 7 of 12
Procedure 2. IC50 determination This procedure describes how to determine inhibitor potencies by generating a 10‐point IC50 curve from a 4‐fold dilution series of test compound. The concentration of tracer used in the below protocol is based on the tracer titration from Procedure 1 (page 2).
100 nM Tracer 236 was chosen by Life Technologies for inhibitor studies. Under these conditions a Z’ value of greater than 0.5 was obtained while keeping the tracer concentration close to the Kd value (102 nM).
(2.1) Reagent preparation 1. Prepare an intermediate dilution series of each test compound by 4X serial dilution in DMSO such that the top
concentration is 1 mM (suggested starting point) (Figure 6, Step 1).
a. Prepare 4 mM test compound in DMSO.
b. Add 60 μL of DMSO to 5 wells in each of 2 columns of a 96‐well plate (wells A1 to E2).
c. Add 20 μL of 4 mM compound to well A1 and mix.
d. Remove 20 μL from well A1, transfer to well A2 and mix.
e. Remove 20 μL from well A2, transfer to well B1 and mix.
f. Continue process as depicted in Step 1 of Figure 6.
Figure 6 Compound serial dilution
Colum
n 1
Colum
n 2
A
B
C
D
E
Colum
n 1
Colum
n 2
A
B
C
D
E
Colum
n 1
A
B
C
D
E
Colum
n 2
A
B
C
D
E
1 2 3 1 2 3
Master Dilutions100% DMSO
4X serial dilution100X conc.
(96-well plate)
Intermediate Dilutions3% DMSO3X conc.
(96-well plate)
Assay Plate(384-well plate)
Assay Plate(384-well plate)
STEP 1 STEP 2 STEP 3 STEP 4
2. Dilute the “Master Dilution” series 25‐fold into Kinase Buffer A. Remove 5 μL of each concentration of diluted compound, transfer to another 96‐well plate, add 125 μL of Kinase Buffer A and mix (Figure 6, Step 2).
3. Prepare tracer solution in Kinase Buffer A at 400 nM tracer (4X the desired final assay concentration). Add the volumes of reagents calculated below to calculated volume of Kinase Buffer A.
Calculations (for a 1000 µL solution):
Tracer volume needed (μL) = 1000 μL1 * 400 nM2
1000 nM/μM * 50 μM3 1final volume of solution 2desired 4X tracer concentration 3stock tracer concentration

Optimization of a LanthaScreen® Eu Kinase Binding Assay for CDK2/cyclin E1
Page 8 of 12
4. Prepare kinase/antibody solution at 5 nM kinase and 4 nM antibody (2X the desired final assay concentration). Centrifuge the antibody tube at approximately 10,000 x g for 10 minutes and aspirate desired volume from the top of the solution. Add volumes of reagents calculated below to calculated volume of Kinase Buffer A.
Calculations (for a 1000 µL solution):
Stock kinase conc. (nM) = stock conc. (mg/mL) * 1 × 10⁹ (nmol/mol)
133600 (g/mol) [Note: kinase MW]
Kinase volume needed (μL) = 1000 μL * 5 nM
Stock kinase conc. (nM)
Antibody volume needed (μL) = 1000 μL * 4 nM
Stock antibody conc. (μM) * 1000 (nmol /μmol)
Kinase Buffer A needed (μL) = 1000 μL – kinase volume needed (μL) – antibody volume needed (μL)
(2.2) Experimental procedure
1. Add 4 μL of each concentration of serially diluted compound to triplicate assay wells in a 384‐well plate (columns 1–3) as depicted in Steps 2 and 3 of Figure 6.
2. Add 8 μL of kinase/antibody solution to all wells.
3. Add 4 μL of tracer solution to all wells.
4. Incubate the plate at room temperature for 60 min and read.
Note: 60 minutes is a general guideline for incubation. However, in some cases multiple read times or continuous measurements may be used to examine the kinetics of binding reactions as might be of interest for studies on slow‐binding compounds.

Optimization of a LanthaScreen® Eu Kinase Binding Assay for CDK2/cyclin E1
Page 9 of 12
(2.3) Data analysis 1. Divide the acceptor/tracer emission (665 nM) by the antibody/donor emission (615 nM) to calculate the “emission ratio”.
2. Plot [test compound] versus emission ratio. The sigmoidal dose‐response curve with a variable slope can be fit to the data (see section 1.3, step 2 for equation). Representative date generated by Life Technologies for a control compound is presented in Figure 7.
Figure 7 Representative data generated at Life Technologies
3. In some cases, the Cheng‐Prusoff equation1 (equation 1) can be used to convert IC50 to Ki based on the concentration of Tracer and an accurate Tracer Kd (determined by following Procedure 1 or Appendix B).
(1) ( )[ ]
⎟⎟⎠
⎞⎜⎜⎝
⎛⎟⎟⎠
⎞⎜⎜⎝
⎛+
=
d
i
KTracerICK
1
50
This relationship holds true when the following criteria are met:
1. [kinase] << [tracer] and [kinase] << IC50
2. [kinase] < Tracer Kd
3. There is a single class of binding sites
In order to determine Ki values for very tight‐binding compounds, it may be necessary to perform assays at lower kinase concentrations.

Optimization of a LanthaScreen® Eu Kinase Binding Assay for CDK2/cyclin E1
Page 10 of 12
Appendix A. Assay robustness as a function of assay window The Z’‐factors for 215 kinase:tracer pairs were determined and plotted as a function of assay window (Figure A1). The data demonstrate excellent Z’ values are typically obtained with an assay window of ≥ 2. Whereas, assay windows in the 1.5 to 2‐fold range yield Z’ values between 0.4 and 0.7, which may be suitable for some applications.
0 5 10 15 20 25 300.00.10.20.30.40.50.60.70.80.91.0
Assay Window
Z'-f
acto
r
Appendix B. Alternate method to determine tracer Kd and Ki values
A simple method to determine tracer Kd values from a tracer titration is described in Procedure 1, whereas an alternate method is described here based on IC50 curves performed at various tracer concentrations followed by analysis with the Cheng‐Prusoff equation. In addition to determination of tracer Kd values, this method also enables calculation of Ki values (dissociation constant for the inhibitor). Rearrangement of the Cheng‐Prusoff equation results in a linear relationship (i.e. the form y = mx + b) useful for analysis of binding data from homogenous assays (equation 2)2. When plotted with the IC50 value on the y‐axis and the tracer concentration of the x‐axis, the Ki is equal to the y‐intercept and the slope equals [Ki]/[Kd]. Thus, the y‐intercept divided by the slope equals the tracer Kd. This method enables calculation of the tracer Kd from IC50 curves performed at various concentrations of tracer.
(2) [ ] id
i KTracerKKIC +⎟
⎟⎠
⎞⎜⎜⎝
⎛×⎟⎟⎠
⎞⎜⎜⎝
⎛=50
Application of the Cheng‐Prusoff equation is valid if the following criteria are met:
1. There is a single class of ligand binding site
2. The is no ligand depletion (i.e. [tracer] >> [kinase])
3. The receptor concentration < Kd
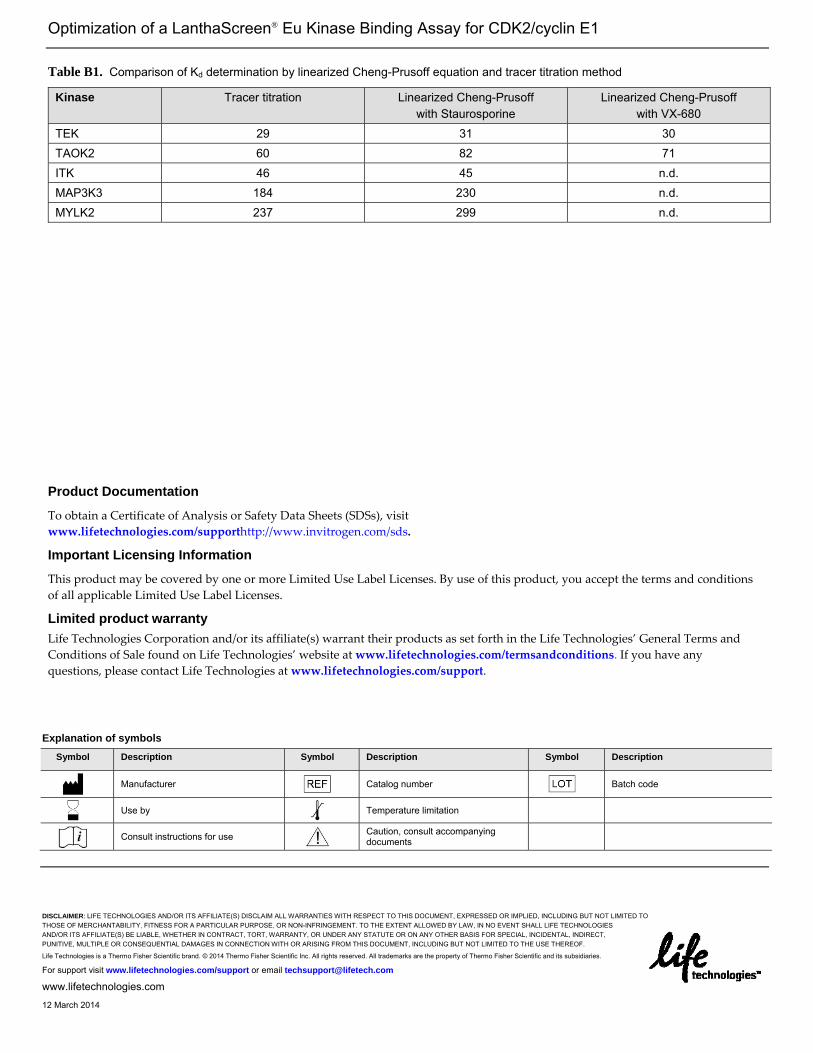
This method was applied to calculate the tracer Kd for representative kinase:tracer interactions with a range of affinities and compared to the tracer titration method (Procedure 1). Example data are presented for the kinase TEK. The Kd value calculated from a tracer titration is 29 nM whereas that calculated using the linearized Cheng‐Prusoff equation using staurosporine as the inhibitor is 31 nM and using VX680 is 30 nM, in close agreement (Figure B1). Data for all kinases compared with both methods is in Table B1, showing close agreement between both methods and supporting use of the more simple method based on a single tracer titration.
2Newton, P., et al. J Biomol Screen. 13(7) 674‐682 (2008).
Optimization of a LanthaScreen® Eu Kinase Binding Assay for CDK2/cyclin E1
Page 11 of 12
Figure B1. Determination of tracer Kd values by linearized Cheng-Prusoff equation and tracer titration method
The tracer Kd value was determined by the tracer titration method essentially as described in Procedure 1 with Kinase Tracer 236 and Eu-anti-GST antibody (A). IC50 curves were determined for TEK for the inhibitors staurosporine (B) and VX680 (C) essentially as described in Procedure 2 with various concentrations of Kinase Tracer 236. IC50 values were then plotted against the tracer concentration and the Kd values for the Tracer and Kinase and the Ki values for the inhibitor and the Kinase were determined from the slope and y-intercept.
A
0 25 50 75 100 125 1500.0
0.1
0.2
0.3
0.4
TEK/PV3628Kd = 29 nM
[Tracer 236] nM
Cor
rect
ed e
mis
sion
ratio
B C
D E
TEK Staurosporine IC50 plot
0 50 100 150 200 250 3000
50
100
150
200
250
300
Kd for Tracer 236 = 31 nMKi for Staurosporine = 28 nM
[Kinase Tracer 236] nM
IC50
val
ue
TEK VX680 IC50 plot
0 50 100 150 200 250 3000
100200300400500600700800900
10001100
Kd for Tracer 236 = 32 nMKi for VX680 = 120 nM
[Kinase Tracer 236] nM
IC50
val
ue
TEK/PV3628Varying Tracer 236 concentrations
Staurosporine titration
0.1 1 10 100 1000 10000 1000000.00
0.25
0.50
0.75
1.00
1.25
1.50
1.75250 nM
125 nM
63 nM
32 nM
16 nM
8 nM
4 nM
2 nM
1 nM
0.5 nM
[Staurosporine] nM
Emis
sion
rat
io
[tracer]TEK/PV3628
Varying Tracer 236concentrationsVX680 titration
0.1 1 10 100 1000 100000.00
0.25
0.50
0.75
1.00
1.25
1.50
1.75
250 nM
125 nM63 nM
32 nM
16 nM
8 nM
4 nM2 nM
1 nM
0.5 nM
[VX680] nM
Emis
sion
rat
io
[tracer]
Optimization of a LanthaScreen® Eu Kinase Binding Assay for CDK2/cyclin E1
DISCLAIMER: LIFE TECHNOLOGIES AND/OR ITS AFFILIATE(S) DISCLAIM ALL WARRANTIES WITH RESPECT TO THIS DOCUMENT, EXPRESSED OR IMPLIED, INCLUDING BUT NOT LIMITED TO THOSE OF MERCHANTABILITY, FITNESS FOR A PARTICULAR PURPOSE, OR NON-INFRINGEMENT. TO THE EXTENT ALLOWED BY LAW, IN NO EVENT SHALL LIFE TECHNOLOGIES AND/OR ITS AFFILIATE(S) BE LIABLE, WHETHER IN CONTRACT, TORT, WARRANTY, OR UNDER ANY STATUTE OR ON ANY OTHER BASIS FOR SPECIAL, INCIDENTAL, INDIRECT, PUNITIVE, MULTIPLE OR CONSEQUENTIAL DAMAGES IN CONNECTION WITH OR ARISING FROM THIS DOCUMENT, INCLUDING BUT NOT LIMITED TO THE USE THEREOF.
Life Technologies is a Thermo Fisher Scientific brand. © 2014 Thermo Fisher Scientific Inc. All rights reserved. All trademarks are the property of Thermo Fisher Scientific and its subsidiaries.
For support visit www.lifetechnologies.com/support or email [email protected]
www.lifetechnologies.com
12 March 2014
Table B1. Comparison of Kd determination by linearized Cheng-Prusoff equation and tracer titration method
Kinase Tracer titration Linearized Cheng-Prusoff with Staurosporine
Linearized Cheng-Prusoff with VX-680
TEK 29 31 30 TAOK2 60 82 71 ITK 46 45 n.d. MAP3K3 184 230 n.d. MYLK2 237 299 n.d.
Product Documentation
To obtain a Certificate of Analysis or Safety Data Sheets (SDSs), visit www.lifetechnologies.com/supporthttp://www.invitrogen.com/sds.
Important Licensing Information
This product may be covered by one or more Limited Use Label Licenses. By use of this product, you accept the terms and conditions of all applicable Limited Use Label Licenses.
Limited product warranty Life Technologies Corporation and/or its affiliate(s) warrant their products as set forth in the Life Technologies’ General Terms and Conditions of Sale found on Life Technologies’ website at www.lifetechnologies.com/termsandconditions. If you have any questions, please contact Life Technologies at www.lifetechnologies.com/support.
Explanation of symbols
Symbol Description Symbol Description Symbol Description
Manufacturer
Catalog number
Batch code
Use by Temperature limitation
Consult instructions for use Caution, consult accompanying
documents


![The regulation of SIRT2 function by cyclin-dependent kinases ......916JCB • VOLUME 180 • NUMBER 5 • 2008 with recombinant baculoviral cyclin E – Cdk2 and -[ 32 P]ATP ( Fig](https://img.pdfslide.us/doc/110x75/60d8933f6f7c6259ee7c52cd/the-regulation-of-sirt2-function-by-cyclin-dependent-kinases-916jcb-a.jpg)