Embed Size (px)
Citation preview

Lanphier High School Instructional Leadership Team
January 31, 2012

AGENDA 1. Design and Communicate data to staff
and stakeholders
2. Understand the data sets
3. Interpretation of data sets
4. Construct data talks for collaboration
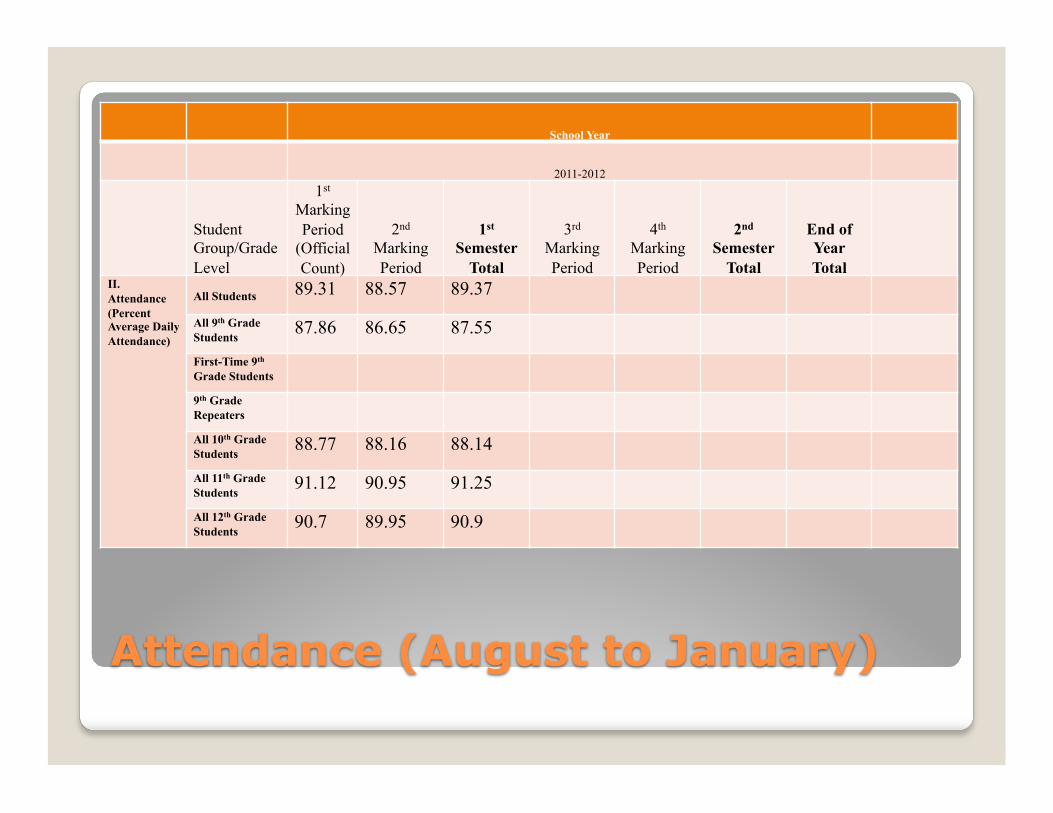
School Year
2011-2012
Student Group/Grade Level
1st Marking Period
(Official Count)
2nd Marking Period
1st Semester
Total
3rd Marking Period
4th Marking Period
2nd Semester
Total
End of Year Total
II. Attendance (Percent Average Daily Attendance)
All Students 89.31 88.57 89.37
All 9th Grade Students 87.86 86.65 87.55
First-Time 9th Grade Students 9th Grade Repeaters All 10th Grade Students 88.77 88.16 88.14
All 11th Grade Students 91.12 90.95 91.25
All 12th Grade Students 90.7 89.95 90.9

84
85
86
87
88
89
90
91
92
9th Grade 10th Grade 11th Grade 12th Grade
1st Quarter
2nd Quarter
1st Semester

School Year
2011-2012
Student Group/Grade Level
1st Marking Period
(Official Count)
2nd Marking Period
1st Semester
Total
3rd Marking Period
4th Marking Period
2nd Semester
Total
End of Year Total
III. Course Passing (Number of Students Who Failed One Course)
All Students 415 394 339
All 9th Grade Students
178 145 147
First-Time 9th Grade Students 9th Grade Repeaters All 10th Grade Students
111 110 90
All 11th Grade Students
57 66 50
All 12th Grade Students
69 73 52

0 20 40 60 80
100 120 140 160 180 200
9th Grade 10th Grade 11th Grade 12th Grade
1st Quarter
2nd Quarter
1st Semester
School Year
2011-2012
Student Group/Grade Level
1st Marking Period
(Official Count)
2nd Marking Period
1st Semester
Total
3rd Marking Period
4th Marking Period
2nd Semester
Total
End of Year Total
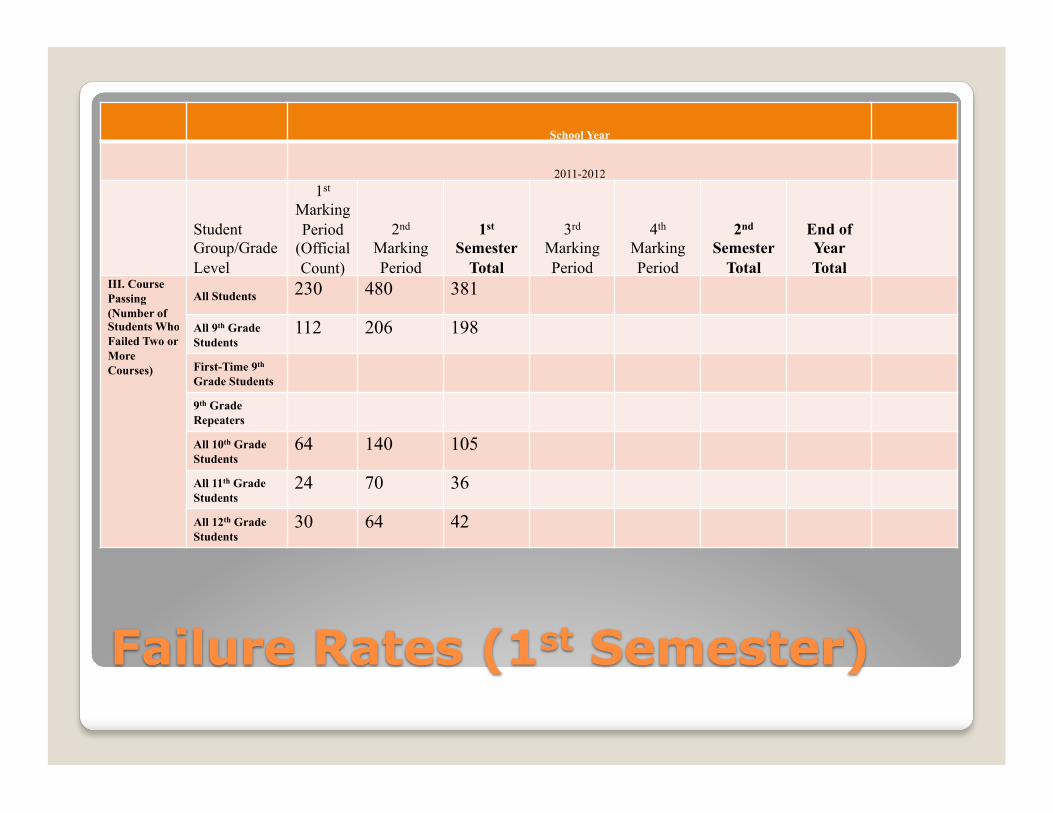
III. Course Passing (Number of Students Who Failed Two or More Courses)
All Students 230 480 381
All 9th Grade Students
112 206 198
First-Time 9th Grade Students 9th Grade Repeaters All 10th Grade Students
64 140 105
All 11th Grade Students
24 70 36
All 12th Grade Students
30 64 42

0
50
100
150
200
250
9th Grade 10th Grade 11th Grade 12th Grade
1st Quarter
2nd Quarter
1st Semester

0
10
20
30
40
50
60
70
Grade 9 Grade 10 Grade 11 Grade 12
Reading
Math

0
10
20
30
40
50
60
70
80
Grade 9 Grade 10 Grade 11 Grade 12
Reading
Math

0
5
10
15
20
25
30
35
40
0-12 13-15 16-19 20-23 24-27 28-32
Student Percentage
%

School Year
2011-2012
Student Group/Grade Level
1st Marking Period
(Official Count)
2nd Marking Period
1st Semester
Total
3rd Marking Period
4th Marking Period
2nd Semester
Total
End of Year Total
V. Suspensions (Number of In-School Suspensions)
All Students 439 1203 1642
All 9th Grade Students 237 398 635
First-Time 9th Grade Students 9th Grade Repeaters All 10th Grade Students 109 433 549
All 11th Grade Students 48 181 238
All 12th Grade Students 34 194 228

0
100
200
300
400
500
600
700
9th Grade 10th Grade 11th Grade 12th Grade
1st Quarter
2nd Quarter
1st Semester

School Year
2011-2012
Student Group/Grade Level
1st Marking Period
(Official Count)
2nd Marking Period
1st Semester
Total
3rd Marking Period
4th Marking Period
2nd Semester
Total
End of Year Total
V. Suspensions (Number of Out-of-School Suspensions)
All Students 113 119 332
All 9th Grade Students 56 60 116
First-Time 9th Grade Students 9th Grade Repeaters All 10th Grade Students 30 35 65
All 11th Grade Students 18 15 33
All 12th Grade Students 9 9 18

0
20
40
60
80
100
120
140
9th Grade 10th Grade 11th Grade 12th Grade
1st Quarter
2nd Quarter
1st Semester

DATA WALL ‘