Embed Size (px)
DESCRIPTION
Citation preview

GRAPH ANALYSIS
ECONOMICSE = EconomyC = ConsumerO = OrganizingN = NeutralO = ObjectivityM = Measurement I = InvestigationC = CapabilityS = Scarce
DEFINITION OF “ECONOMICS”
“The science which studies Human Behavior as a relationship between Ends
and Scarce means which have Alternative Uses”
(Lionel Robbins)Modern Economic Theory
K.K DewettPg:08
GRAPH ANALYSIS
“It is a Diagram showing how Two Variables are related to one another.
Graphs are the Language of Economics”The language of Graphs are lines and
curves.
(Paul Samuelson)Economics
Pg:18
WHO GAVE THE CONCEPT OF
GRAPHS ? IBN KHALDUN was a Muslim
Historiographer who is often viewed as one of the Fathers of Modern Historiography, Sociology and
Economics.He is best known for his Muqaddimah (known as Prolegomenon in English)
Wikipedia
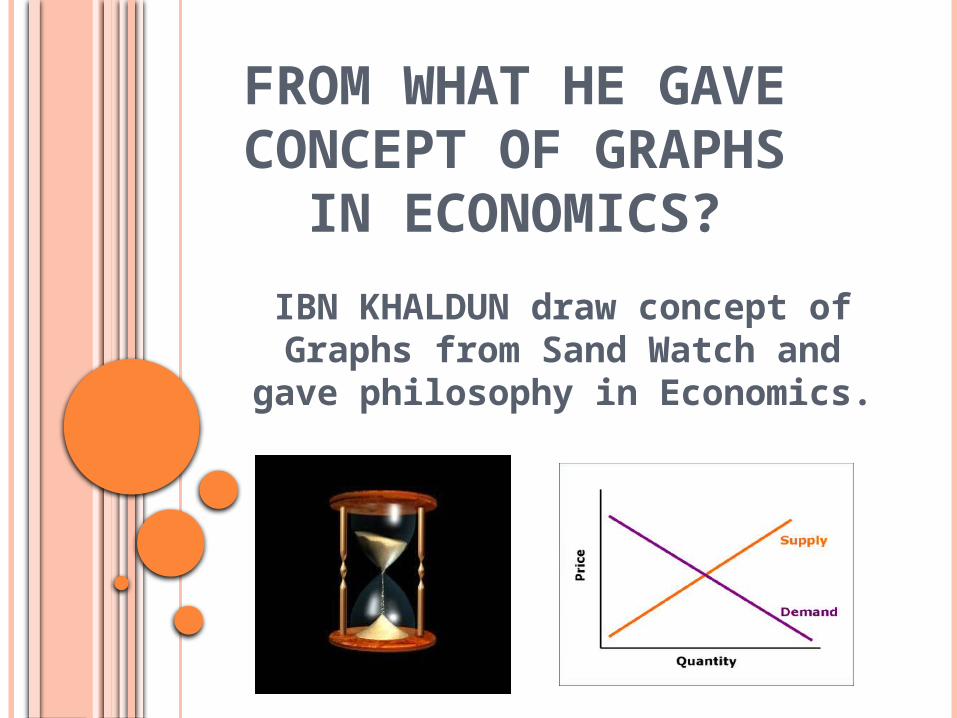
FROM WHAT HE GAVE CONCEPT OF GRAPHS
IN ECONOMICS?
IBN KHALDUN draw concept of Graphs from Sand Watch and
gave philosophy in Economics.
WHAT IS A LINE?Lines are Fixed and not
Flexible. We cannot make lines always as per Data.
PRICE LINE
This Vertical Line is called PRICE LINE in Economics.
It represent Price or any kind of Financial Value
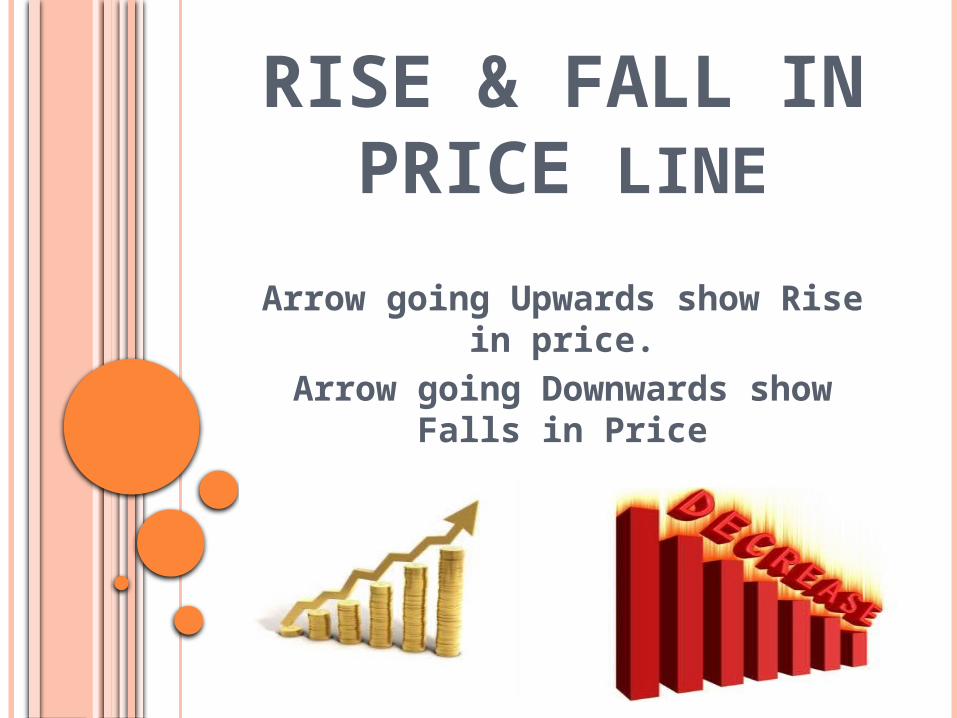
RISE & FALL IN PRICE LINE
Arrow going Upwards show Rise in price.Arrow going Downwards show Falls in
Price
QUANTITY LINE
This Horizontal Line in Economics is Called “Quantity Line”. It represent Quantity and
any kind of Volume.
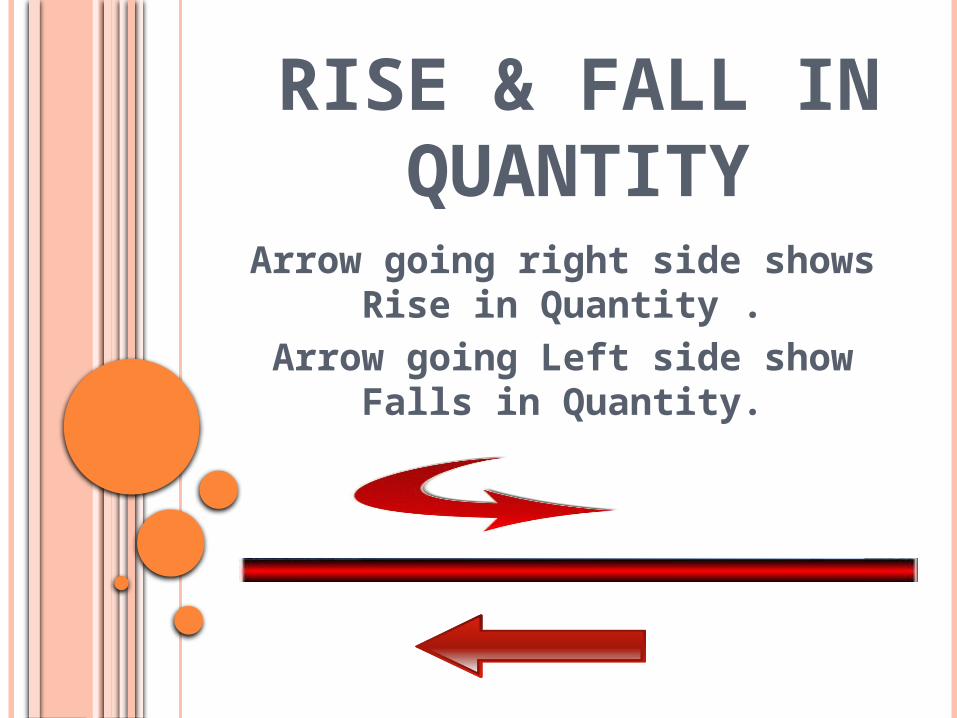
RISE & FALL IN QUANTITY
Arrow going right side shows Rise in Quantity .
Arrow going Left side show Falls in Quantity.
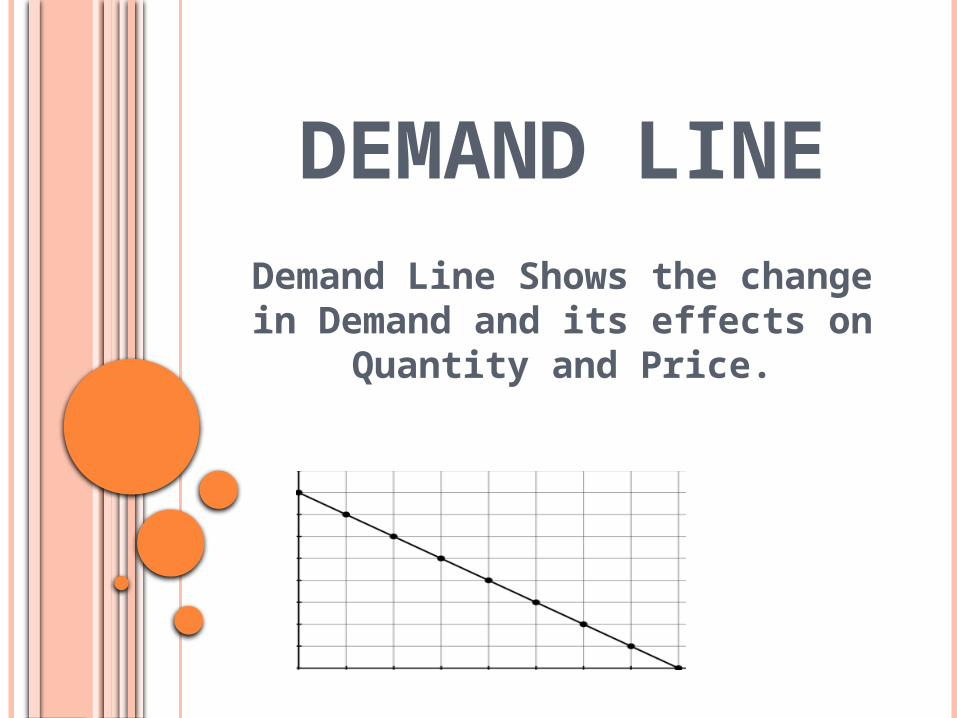
DEMAND LINEDemand Line Shows the change in
Demand and its effects on Quantity and Price.
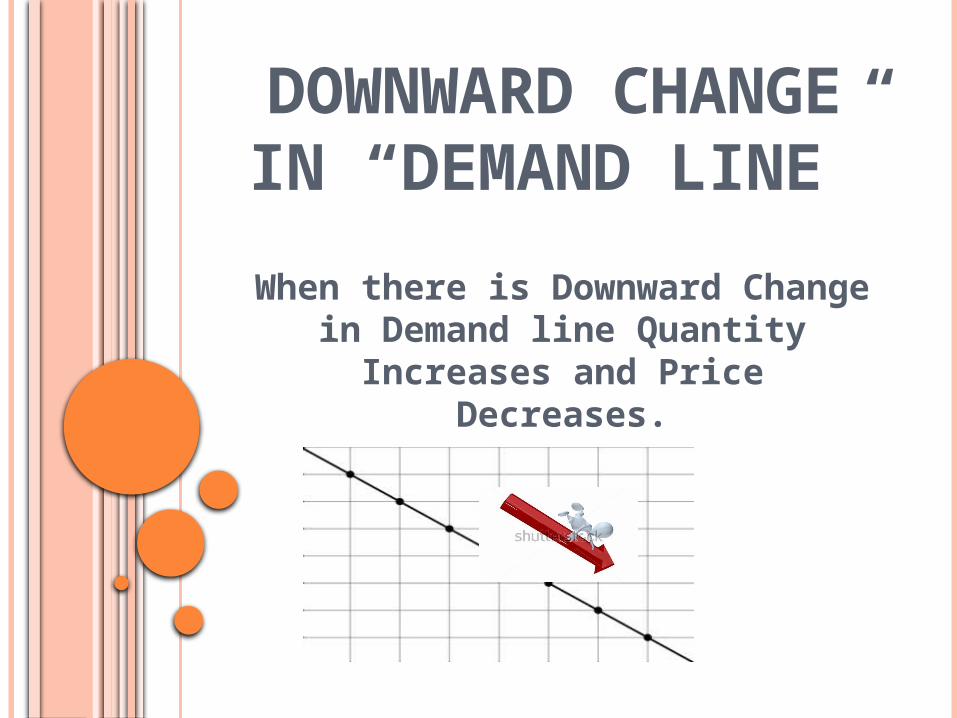
DOWNWARD CHANGE IN
“DEMAND LINE”
When there is Downward Change in Demand line Quantity
Increases and Price Decreases.
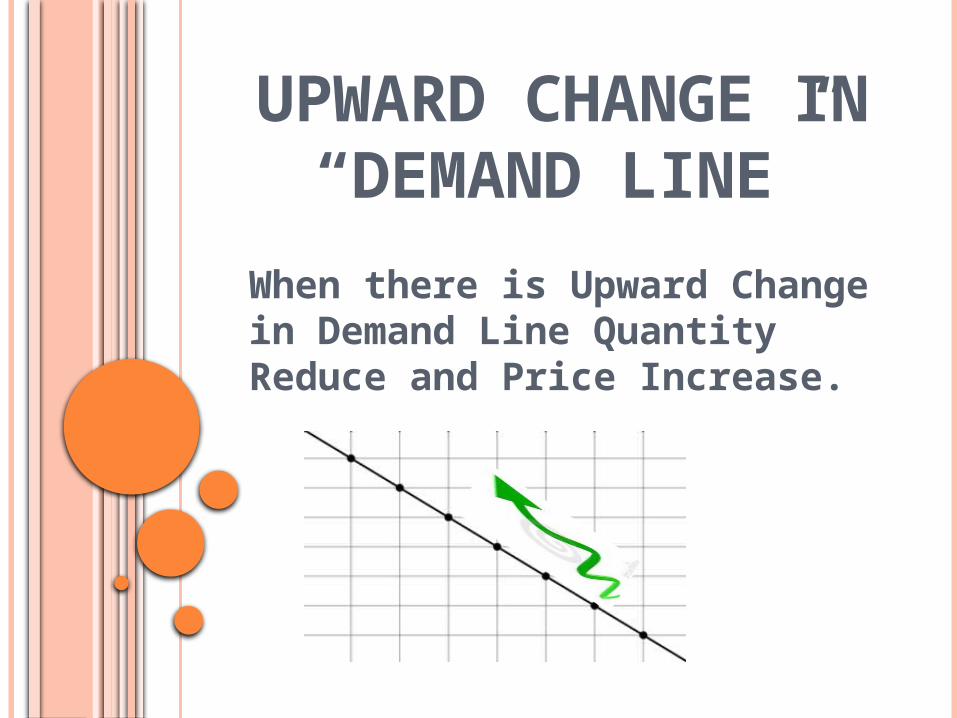
UPWARD CHANGE IN “DEMAND LINE”When there is Upward Change in Demand Line Quantity Reduce and Price Increase.
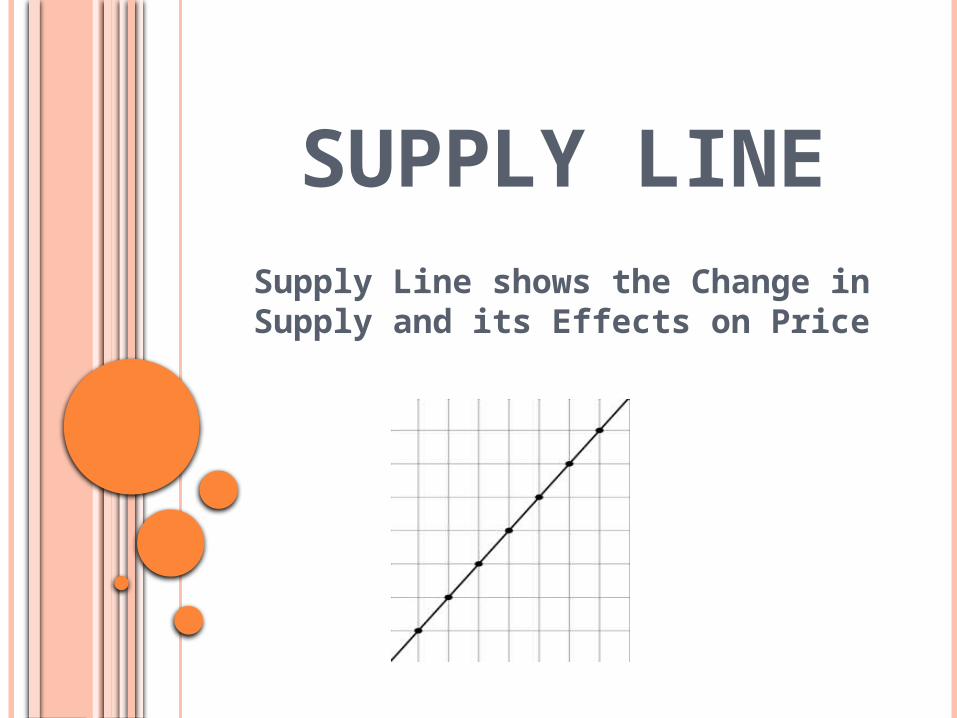
SUPPLY LINESupply Line shows the Change in
Supply and its Effects on Price
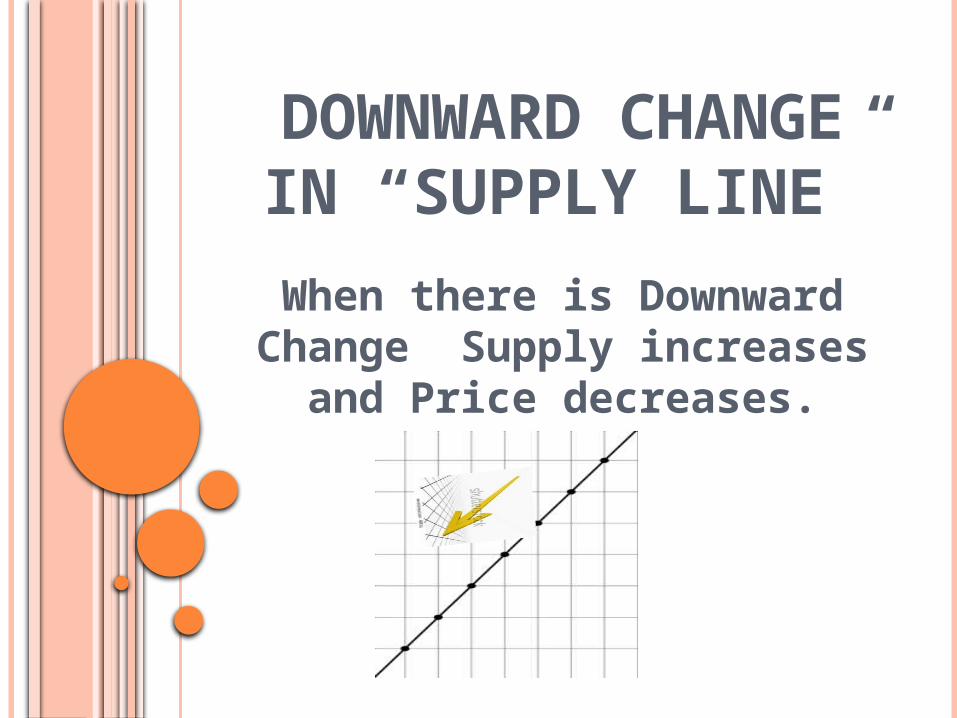
DOWNWARD CHANGE IN “SUPPLY LINE”
When there is Downward Change Supply increases and Price
decreases.
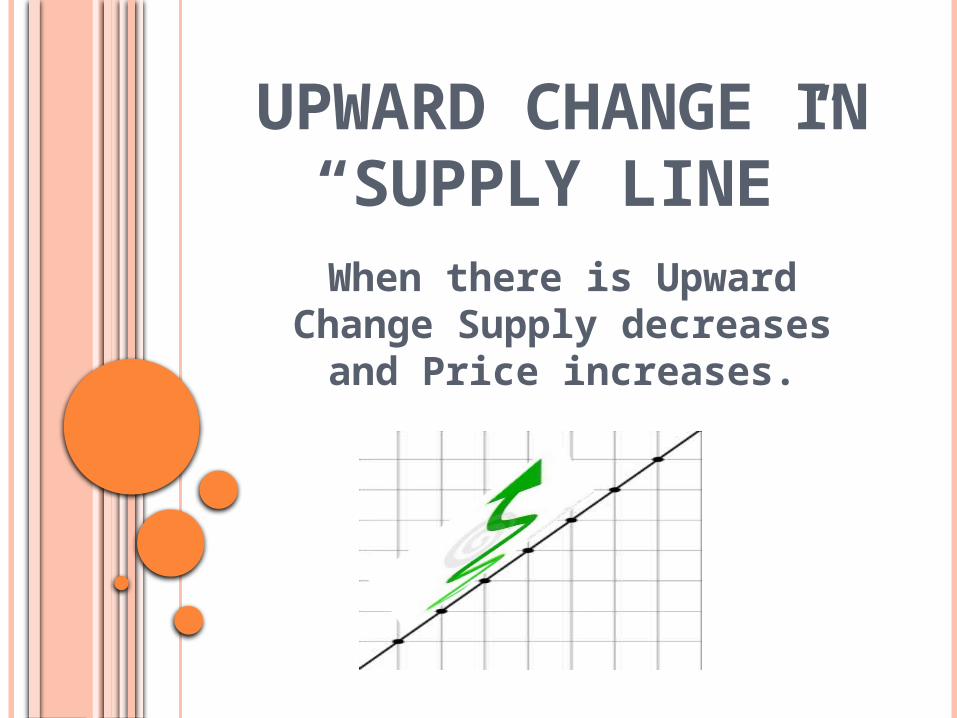
UPWARD CHANGE IN “SUPPLY LINE”
When there is Upward Change Supply decreases and Price increases.
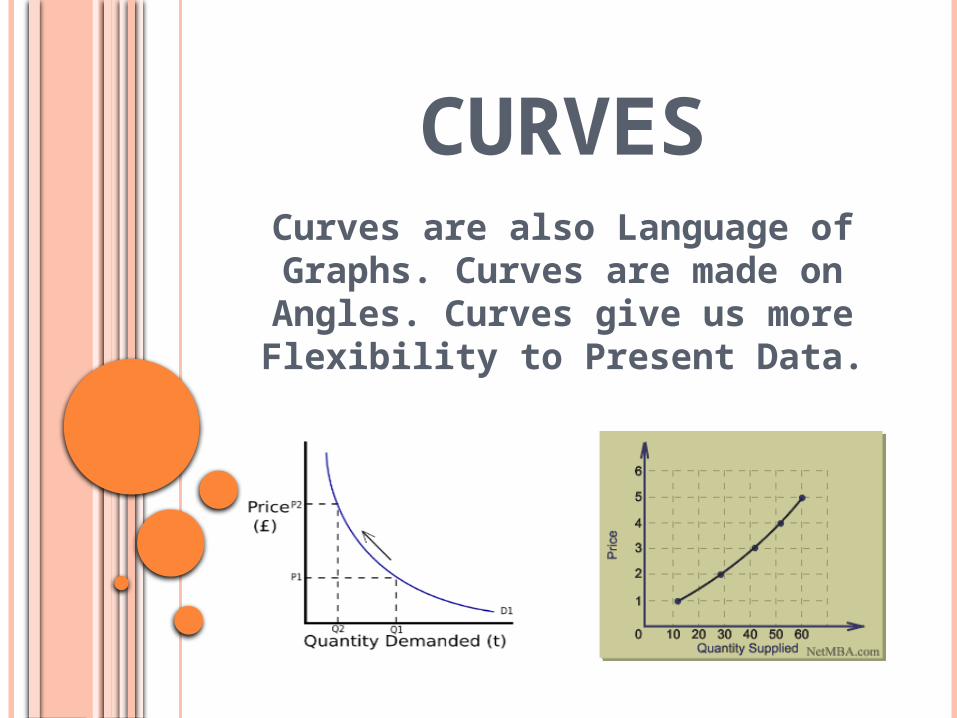
CURVESCurves are also Language of Graphs. Curves are made on Angles. Curves give us more Flexibility to Present Data.
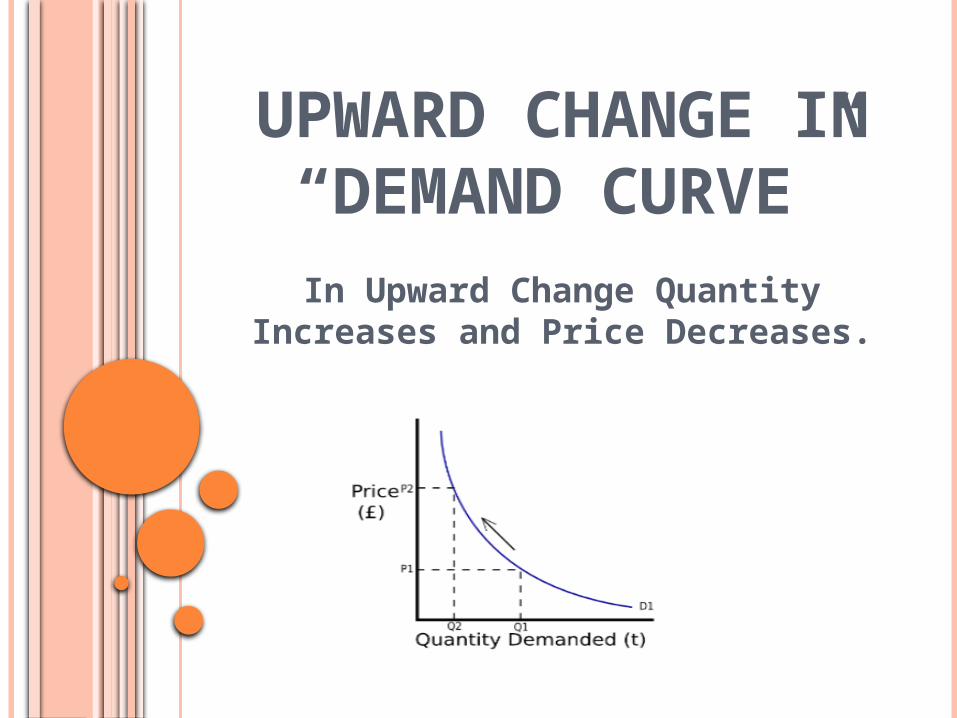
UPWARD CHANGE IN “DEMAND
CURVE”In Upward Change Quantity
Increases and Price Decreases.
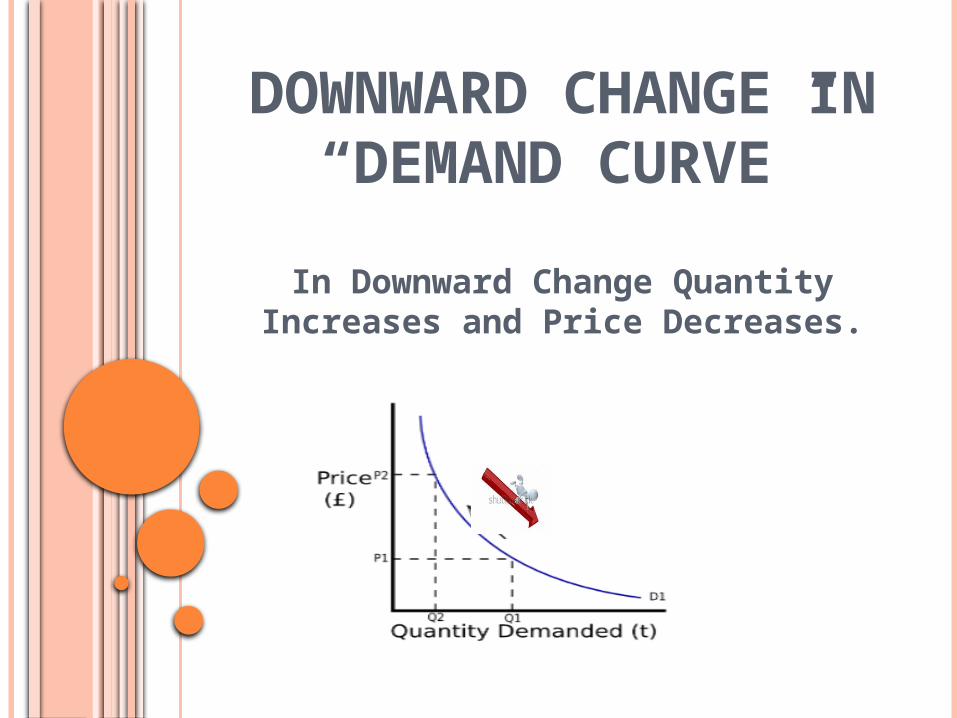
DOWNWARD CHANGE IN “DEMAND CURVE”
In Downward Change Quantity Increases and Price Decreases.
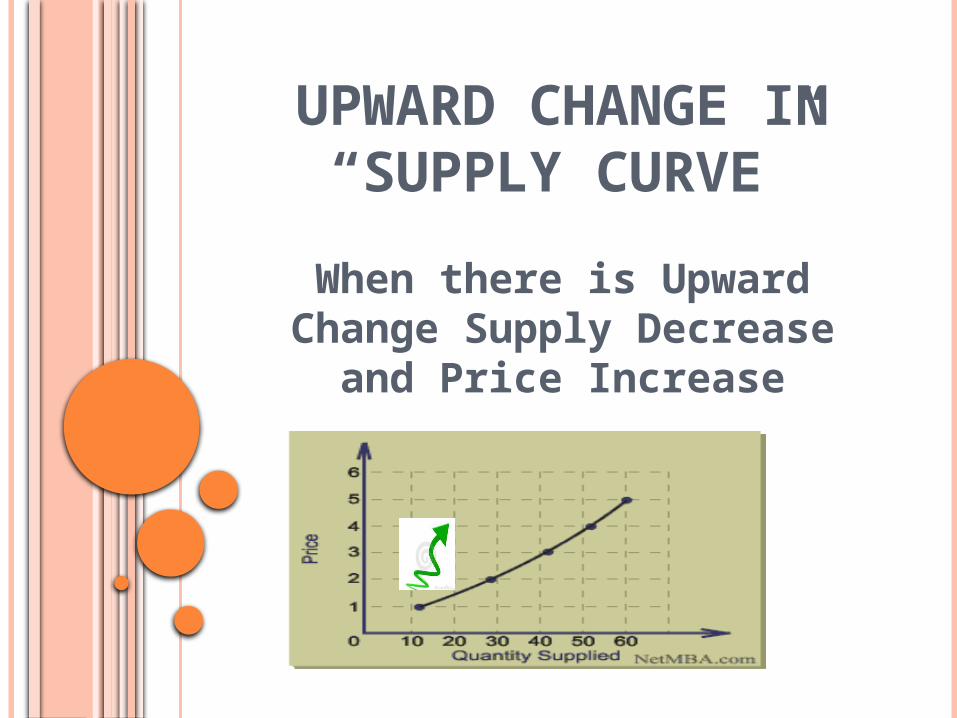
UPWARD CHANGE IN “SUPPLY CURVE”
When there is Upward Change Supply Decrease and Price
Increase
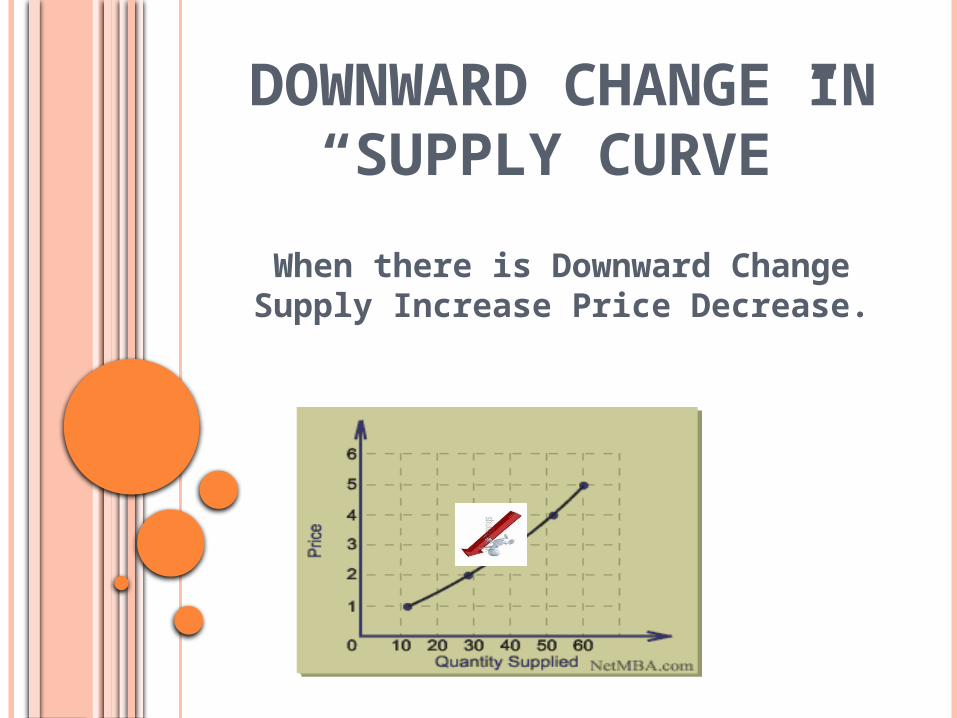
DOWNWARD CHANGE IN “SUPPLY CURVE”
When there is Downward Change Supply Increase Price Decrease.
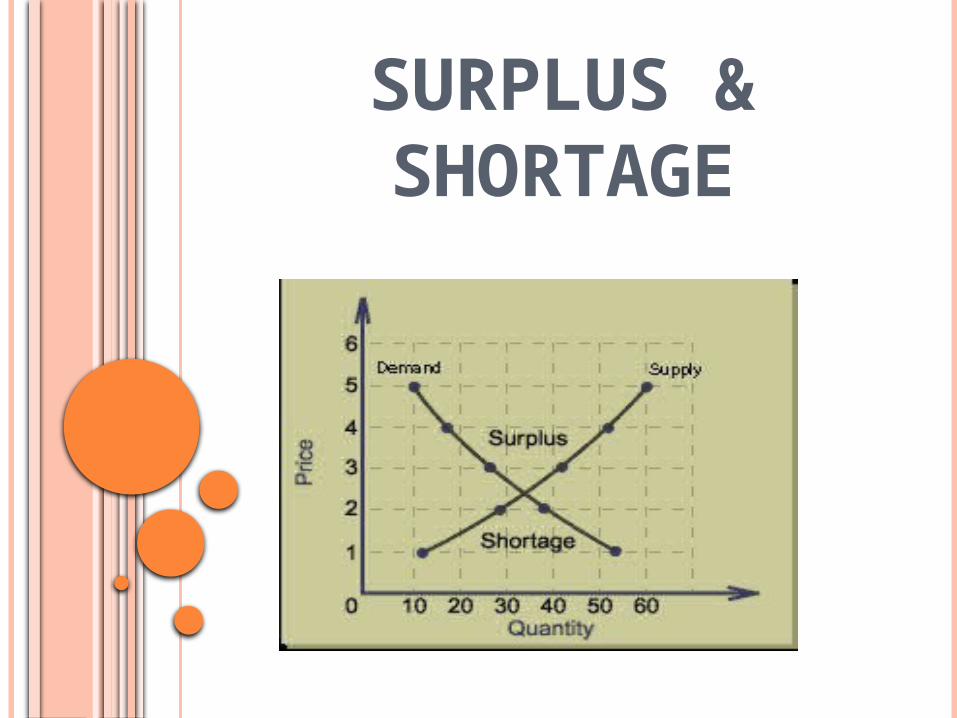
SURPLUS & SHORTAGE
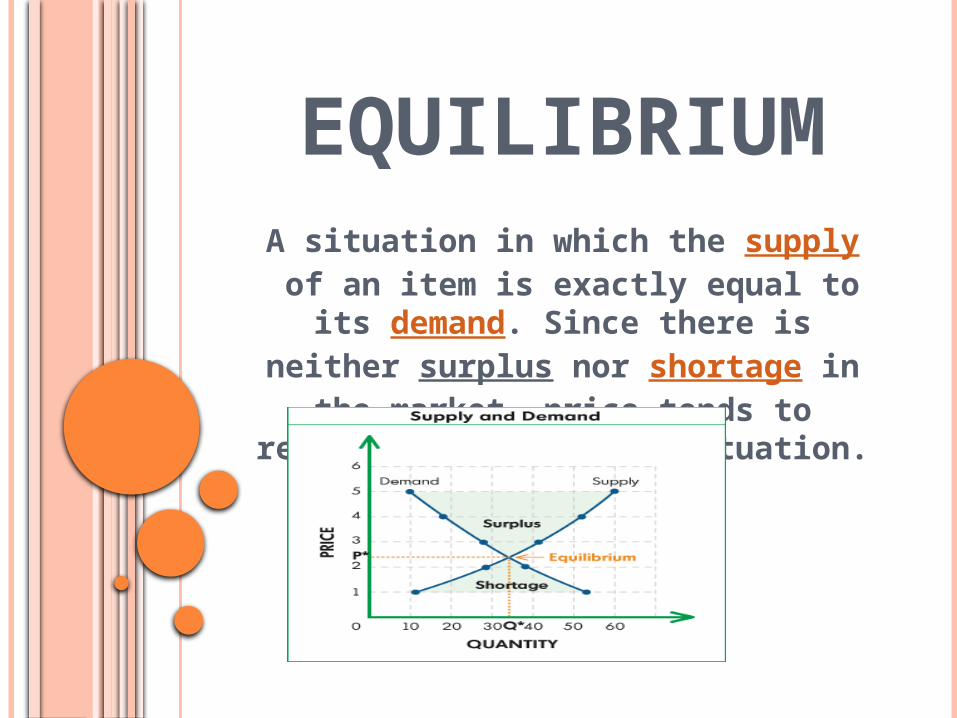
EQUILIBRIUMA situation in which the supply of an item is exactly equal to its demand. Since there is
neither surplus nor shortage in the market, price tends to remain stable in this situation.
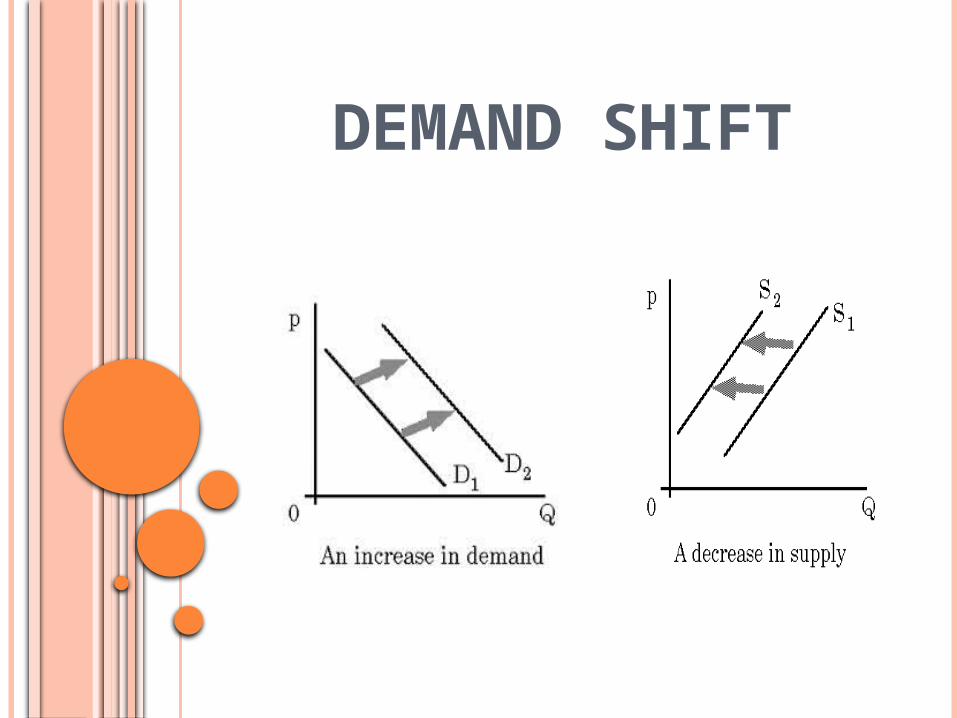
DEMAND SHIFT
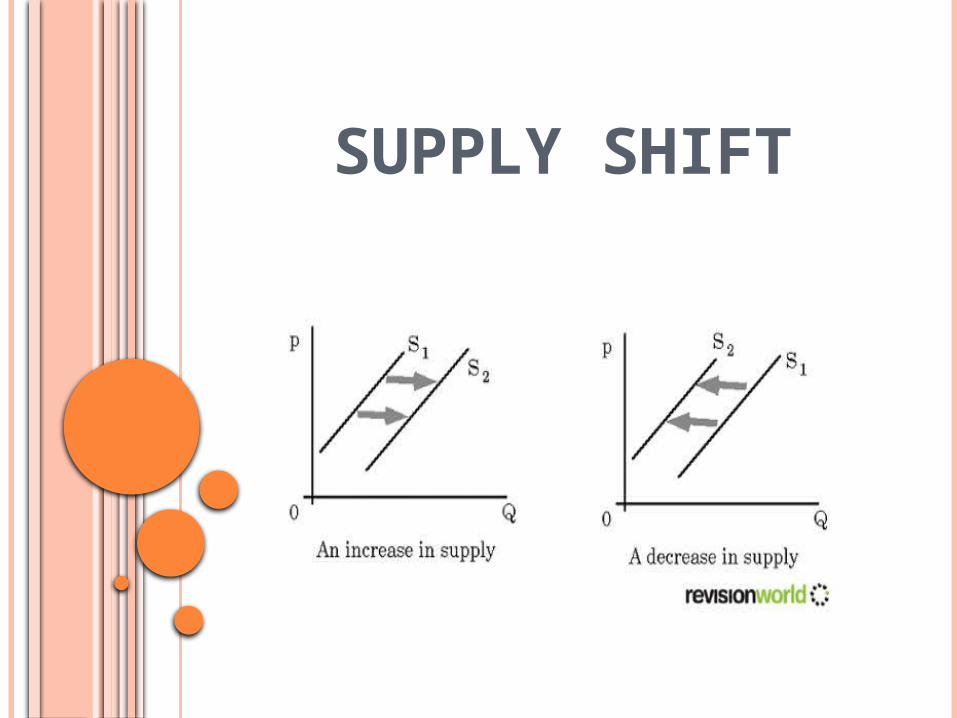
SUPPLY SHIFT
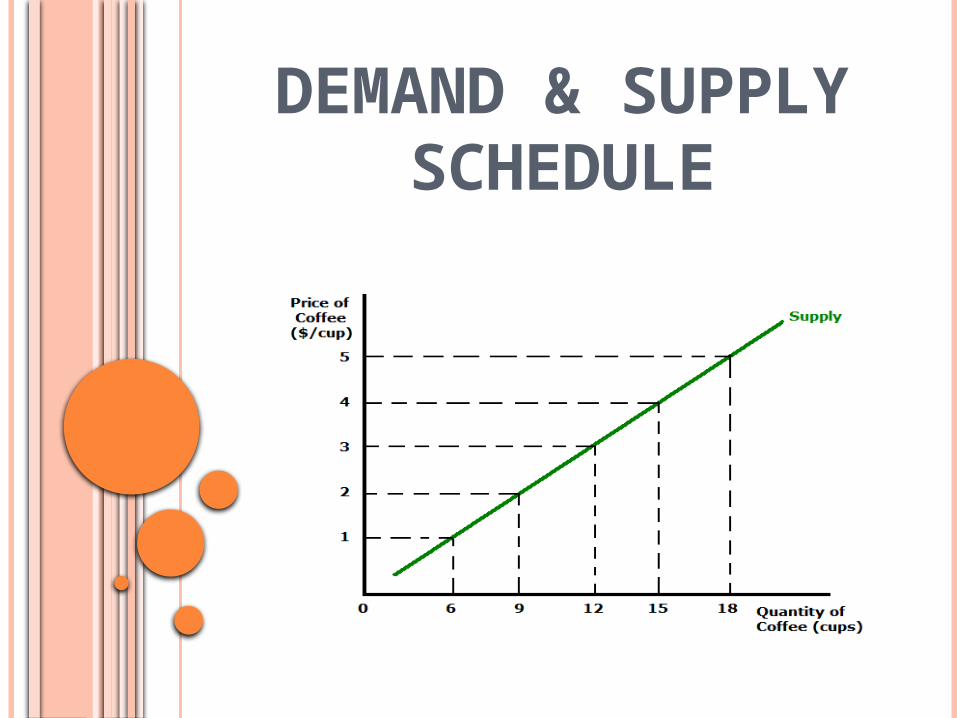
DEMAND & SUPPLY SCHEDULE

Thank you
![Graph Algorithms in the Language of Linear Algebragilbert/cs240a/slides/old/cs... · 2014. 2. 6. · Graph algorithms in the language of linear algebra • Kepner et al. study [2006]:](https://img.pdfslide.us/doc/110x75/600d37aae5ecaa483f0332c7/graph-algorithms-in-the-language-of-linear-algebra-gilbertcs240aslidesoldcs.jpg)