Embed Size (px)
Citation preview

Language FTR and Earnings Management: International Evidence
Marco Fasan Department of Management
Ca Foscari University of Venice [email protected]
Giorgio Gotti
College of Business University of Texas at El Paso
Tony Kang DeGroote School of Business
McMaster University [email protected]
Yi Liu
DeGroote School of Business McMaster University [email protected]
Abstract
We study whether a particular aspect of language structure, the future-time reference (FTR) of a language, explains variation in corporate earnings management behaviors around the world. Based on the Sapir-Whorf hypothesis (Whorf 1956), we predict that grammatically referencing the future, which induces humans to perceive the future more sharply distinct from the present, induces myopic management behavior. In support of this idea, we find that firms headquartered in strong-FTR language countries are more likely to engage in accrual and real activities earnings management to meet short-term earning benchmarks. Keywords: Accrual-based Earnings Management, Real Earnings Management,
Future-Time-Reference, Language, Myopia, Short-Termism Acknowledgements: We thank seminar participants at Syracuse University, Ca’ Foscari University
of Venice, and AAA-International Accounting Section 2016 Midyear meeting for helpful comments.
1
1. Introduction
The Sapir-Whorf hypothesis (Whorf 1956) posits that the structure of a language systematically
shapes the ways its speakers conceptualize the world, affecting their thoughts and behaviors.
Consistent with this idea, Wittgenstein (1922) argues that language is the means by which people
picture and reason about reality. In contrast, others claim that all human languages are constrained
by a “universal grammar” (Chomsky 1957) and that there is no compelling evidence that languages
dramatically shape their speakers’ way of thinking (Pinker 1994). To date, this remains an
unresolved issue in humanities and social science, and evidence in the context of economic decision
making is even more limited, with the exception of Chen (2013). Not surprisingly, the issue is
severely understudied in corporate settings. To fill this void in the literature and to enhance our
understanding on this issue, we study whether the dominant business language in a society explains
an important corporate decision, i.e., corporate earnings management behavior.
One major difference in language structure is the future-time reference (FTR), i.e., the way of
grammatically encoding the future events (Dahl 1985). If a language requires its speakers to
explicitly use future tense to mark prospective events, then the language is regarded as having
strong-FTR. If it does not have such a requirement, it is said to be a weak-FTR language. In this
paper, we investigate the effects of future-time reference (FTR) of language on corporate earnings
management. The motivation of our paper is twofold. First, prior economics and finance literature
has found that language FTR affects the economic behaviors across individual (e.g., individual
savings, Chen 2013), as well as firm behaviors, e.g., corporate social responsibility, (Liang et al.
2
2014) and corporate cash holdings (Chen et al. 2015). However, there is little evidence on whether
the language feature explains corporate financial reporting behavior. Second, international evidence
on earnings management shows that corporate earnings management varies with country-level legal,
economic and cultural institutions (e.g., Leuz et al. 2003; Han et al. 2010). Despite the potential
pervasive effect on human behavior and various institutions (Whorf et al. 1956; Liang et al. 2014),
however, there is no direct evidence that links the structure of the dominant business language in the
economy to the prevailing corporate reporting behavior.
We address this issue by testing whether firms headquartered in strong-FTR language countries,
where the economic agents have been shown to demonstrate more myopic behavior, manage
earnings more. Earnings management through accounting accruals or real operations to meet
short-term capital market benchmarks is often characterized as being myopic, as the decision tends
to reverse in the future (Healy and Wahlen 1999). If, as linguistics and economics theories predict,
strong-FTR language, by requiring grammatically separating the future from the present, leads its
speakers to feel less pressure from the future and, thus, fosters short-term oriented behavior,
managers in jurisdictions where the dominant business language is more future oriented are more
likely to engage in earnings management.
Next, we examine how language FTR interacts with investor protection in affecting earnings
management. A priori, the interaction between language FTR and investor protection is not obvious.
On the one hand, given that public accounting information is more extensively used in managerial
3
contracting in strong investor protection countries (Han et al. 2010), it is possible that myopic
strong-FTR managers are more incentivized to engage in earnings manipulation in countries with
strong investor protection to meet short-term capital market benchmarks. On the other hand,
however, since investor protection limits the ability of managers to acquire private control benefits
and mask firm performance (Leuz et al. 2003), the tendency for managers to engage in earnings
management harbored by strong language FTR should be curbed.
We empirically examine the above predictions about the effects of language FTR on earnings
management across 37 countries during the period 1994-2013. Following Liang et al. (2014) and
Chen et al. (2015), we categorize the FTR of the official language (strong versus weak) in each
country based on the classification of Chen (2013). We examine three types of earnings management
behaviors: accrual-based earnings management, earnings management through real economic
decisions (real earnings management) and earnings benchmark meeting/beating. We document a
significantly positive association between strong language FTR and earnings management (both
accrual-based and real activities) after accounting for firm, industry, country level controls.
Furthermore, this association decreases with the strength of investor protection, consistent with
investor protection acting as a governance mechanism in mitigating earnings manipulation.
This study makes important contributions to several strands of literature. First, it extends the
accounting, finance, and international business literature that documents institutional influence on
corporate earnings management behavior. Specifically, we identify language as a relevant human
4
institution that explains such behavior, in addition to legal and cultural institutions (e.g., Leuz et al.
2003; Han et al. 2010). Second, this study contributes to corporate finance literature on managerial
myopia by identifying strong-FTR languages as a driver of such behavior in corporate decisions.
Third, it contributes to the broader economics literature by providing evidence in support of the
Sapir-Whorf hypothesis (1956). Our findings complement recent studies that provided support to
this hypothesis using individual and household data (Chen 2013) by documenting evidence from
corporate behavior.
The remainder of this article is organized as follows. In section 2, we review related literature, and
develop our hypotheses. In section 3, we describe our key variables and model specifications. In
section 4, we present and interpret the main results. In section 5, we perform sensitivity analyses and
robustness checks. And finally in section 6, we make our conclusions.
2. Literature Review and Hypothesis Development
2.1 Linguistic relativity, Future-Time Reference of Language and Economic Behavior
One stream of research in linguistics, known as linguistic relativity (or Sapir-Whorf hypothesis),
argues that the structure of a language systematically shapes the ways its speakers conceptualize the
world, affects their thoughts and behaviors, and even influences their cognitive processes and
national culture (Sapir 1951; Whorf et al. 1956; Chen 2013). For instance, Slobin (1987) posits that
language affects thoughts because speakers are required to grammatically attend to and encode
various aspects of situations when they speak. Cognitive science research lends support to this

5
argument by showing that variation in grammatical systems influences speakers’ cognitive
representation of the reality (e.g., Evans and Levinson 2009).
Recent studies in economics and finance have started to link heterogeneity in language structure
with differences in both individual and corporate economic behaviors.
In particular, these studies relies on a stream of linguistics literature showing that languages differ
widely in terms of grammatically marking the future time of events (e.g., Dahl 1985). In some
languages (i.e., strong-FTR languages), e.g., English, the use of grammaticalized future-time
reference is “explicitly required in (main clause) prediction-based contexts” (Dahl 2000), whereas in
other languages (i.e., weak-FTR languages), e.g., Mandarin, the future tense is not required. To
illustrate, when talking about the future, English forces its speaker to put constructs such as “will”,
“shall”, or “be going to” in the sentence to refer to the future. However, since Mandarin does not
differentiate between the future and the present tenses, a Mandarin speaker tends to omit any
equivalent of “will” in English. Below is an example of how an English speaker and a Mandarin
speaker describe what they are going to do for tomorrow:
English: I will go to school.
Mandarin (original): Wo qu shangxue.
Mandarin (translated): I go to school.
As can be seen from the example, a future tense (or “will” in this case) is mandated in English, but
not in Mandarin. Linguistics literature has documented that this grammatical difference is

6
widespread among languages across countries.
By building on this notion, Chen (2013) finds that weak-FTR language speakers tend to have more
savings, consistent with weak-FTR leading to more future-oriented human behaviors. Tested at the
corporate level, weak-FTR language is found to be associated with greater firm future-oriented
activities, such as higher precautionary cash holdings (Chen et al. 2015), and more corporate social
responsibility (CSR) (Liang et al. 2014).
2.2 Earnings Management
Earnings management is defined as occurring when managers use judgment in financial reporting
and in structuring transactions to alter financial reports to either mislead some stakeholders about the
underlying economic performance of the company, or to influence contractual outcomes that depend
on reported accounting numbers (see Healy and Wahlen 1999).
Previous studies found the existence of two main types of earnings management: accrual-based
earnings management and management of real economic activities. For accruals management,
managers “borrow” earnings from past or future periods to improve earnings reported in the current
period (see Healy and Whalen 1999). For real activities management, managers time revenues or
adjust discretionary expenses to meet current earnings targets (see Bushee 1998; Roychowdhury
2006). While earnings management is usually seen in the light of the Agency Theory, where
managers with more information can achieve benefits at the expenses of the shareholders, Brochet et
al (2014) suggest that it is a short-term oriented practice, as firms are often found to manipulate
7
earnings in order to meet short-term capital market benchmarks.
2.3 Linguistic Hypotheses in Earnings Management
Based on the linguistic relativity literature and prior evidence on the connection between language
FTR and economic behaviors, we focus on one type of corporate behavior – earnings management,
which is to a large extent influenced by managerial short termism and thus very likely to be affected
by such a language structure difference.
Linguistic relativity posits that language influences people’s decision-making process through its
grammatical future-time reference. More specifically, Chen (2013) identifies two mechanisms
(perception of future distance and timing uncertainty) connecting language FTR to short termism.
First (perception of future distance), weak-FTR language speakers, who refer to future events as
they were happening now, should perceive future events as less distant. Therefore, they are more
long-term oriented than strong-FTR language speakers.
Second (timing uncertainty), to repeatedly refer to the future should lead to a sharper distinction
between the present and the future and to a clearer classification of future as a different category.
This lower (higher) timing uncertainty leads strong (weak) FTR language speakers being more short
(long) term oriented (see Chen, 2013).
Hence, strong-FTR language speakers would feel less pressure from the future, and their behaviors
tend to be more short-term oriented (Liang et al. 2014). Prior theories and evidence in accounting
indicate that managers placing a greater weight on the short term are more likely to manipulate
8
current-period earnings (either through accounting choices or real actions) in order to obtain the
benefits of short-term positive earnings surprises or to avoid adverse equity market consequences,
probably at the expense of future earnings and long-term value creation (Stein 1989; Brochet et al.
2014). Based on the above arguments, we hypothesize that strong-FTR language induces managers
to be more short-term oriented. And such managerial myopia increases the likelihood for managers
to engage in earnings management to meet short-term earnings benchmarks.
H1: Managers in strong-FTR language countries manage earnings more
In addition, we examine the interaction between language FTR and investor protection in affecting
earnings management. On the one hand, legal institutions such as investor protection may reinforce
the effect of language FTR on earnings management. For example, Han et al. (2010) argue that
public accounting information is more extensively used in managerial contracting in strong investor
protection countries than in weak investor protection countries. Supporting this argument, DeFond et
al. (2007) find that earnings are more highly correlated with stock prices in strong investor
protection countries. If this is the case, we would expect short-term oriented strong-FTR managers
to have more incentives to engage in earnings management to meet short-term earnings benchmarks
in strong investor protection environments. On the other hand, investor protection may mitigate the
effect of language FTR on earnings management. This is premised on the idea that strong investor
protection limits the ability of the managers to acquire private control benefits, reducing their
incentives to mask corporate performance (Leuz et al. 2003). Thus, investor protection may act as a
governance mechanism to curb myopic managers that are exposed to the influences of strong-FTR
language environments from indulging themselves in earnings manipulation. Taken together, a
9
priori, it is unclear how language FTR and investor protection interact with each other to affect
earnings management. Therefore, our second hypothesis, stated in null form, is:
H2: The interaction between language FTR and investor protection in affecting earnings
management is undeterminable.
3. Research Design and Sample
3.1 Measure of Future-Time Reference of Language
To categorize the FTR of the official language (strong versus weak) in each country, we use the
three measures in Chen (2013) and one aggregate measure developed using the principal component
analysis (PCA) . The first measure is 𝑠𝑡𝑟𝑜𝑛𝑔𝐹𝑇𝑅!", a dummy variable that takes the value of one
for firms headquartered in strong-FTR language countries, and zero otherwise. This categorization
mirrors Thieroff’s (2000) classification of neutral language for “futureless” language. The second
measure is 𝑆𝑅!" , which calculates the proportion of sentences containing a grammatical
future-marker when referring to the future in a language, while the third is 𝑉𝑅!" measuring the ratio
of the number of grammatically future-marked verbs to the total number of future-referring verb in a
language. These two measures are continuous variables and capture the frequency of a language
grammatically marking the future time. Finally, to capture the common dimension in the three
individual measures, we employ the PCA to construct an overall summary measure of the intensity
of the use of language FTR (𝑝𝑐𝐹𝑇𝑅!") for each country.
3.2 Measures of Earnings Management
The accounting literature generally documents two types of earnings management strategies:
10
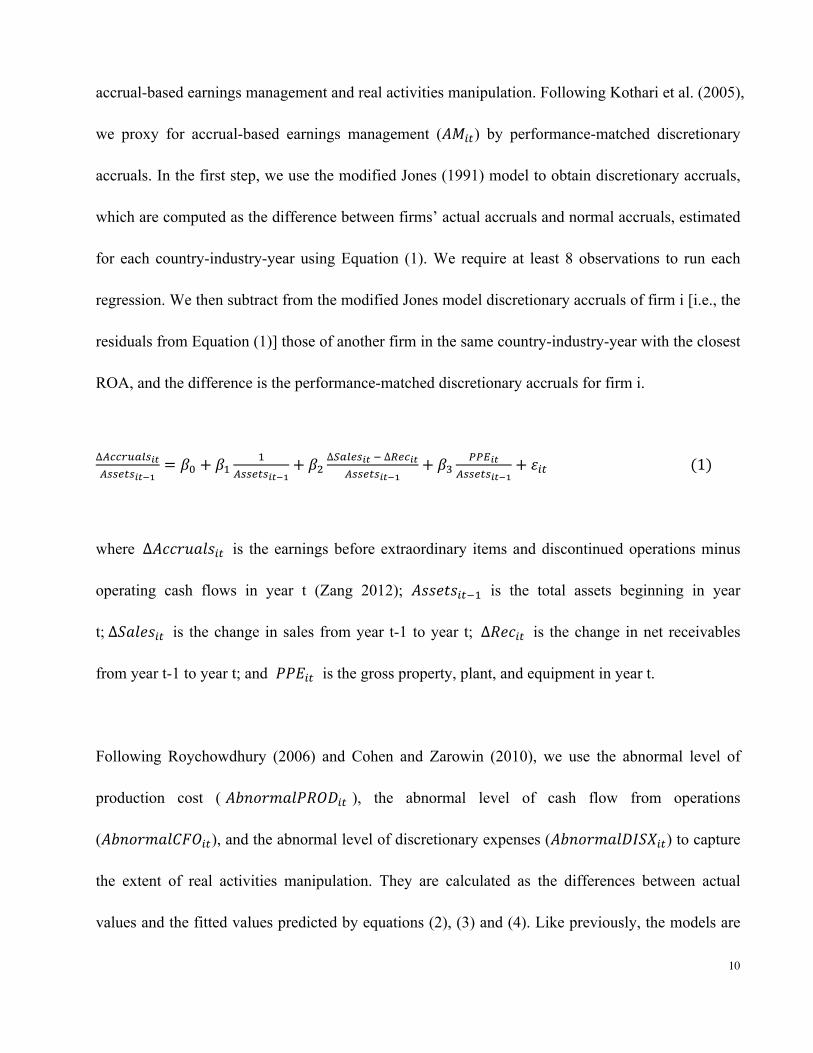
accrual-based earnings management and real activities manipulation. Following Kothari et al. (2005),
we proxy for accrual-based earnings management (𝐴𝑀!") by performance-matched discretionary
accruals. In the first step, we use the modified Jones (1991) model to obtain discretionary accruals,
which are computed as the difference between firms’ actual accruals and normal accruals, estimated
for each country-industry-year using Equation (1). We require at least 8 observations to run each
regression. We then subtract from the modified Jones model discretionary accruals of firm i [i.e., the
residuals from Equation (1)] those of another firm in the same country-industry-year with the closest
ROA, and the difference is the performance-matched discretionary accruals for firm i.
∆!""#$%&'!"!""#$"!"!!
= 𝛽! + 𝛽!!
!""#$"!"!!+ 𝛽!
∆!"#$%!" ! ∆!"#!"!""#$"!"!!
+ 𝛽!!!"!"
!""#$"!"!!+ 𝜀!" (1)
where ∆𝐴𝑐𝑐𝑟𝑢𝑎𝑙𝑠!" is the earnings before extraordinary items and discontinued operations minus
operating cash flows in year t (Zang 2012); 𝐴𝑠𝑠𝑒𝑡𝑠!"!! is the total assets beginning in year
t; ∆𝑆𝑎𝑙𝑒𝑠!" is the change in sales from year t-1 to year t; ∆𝑅𝑒𝑐!" is the change in net receivables
from year t-1 to year t; and 𝑃𝑃𝐸!" is the gross property, plant, and equipment in year t.
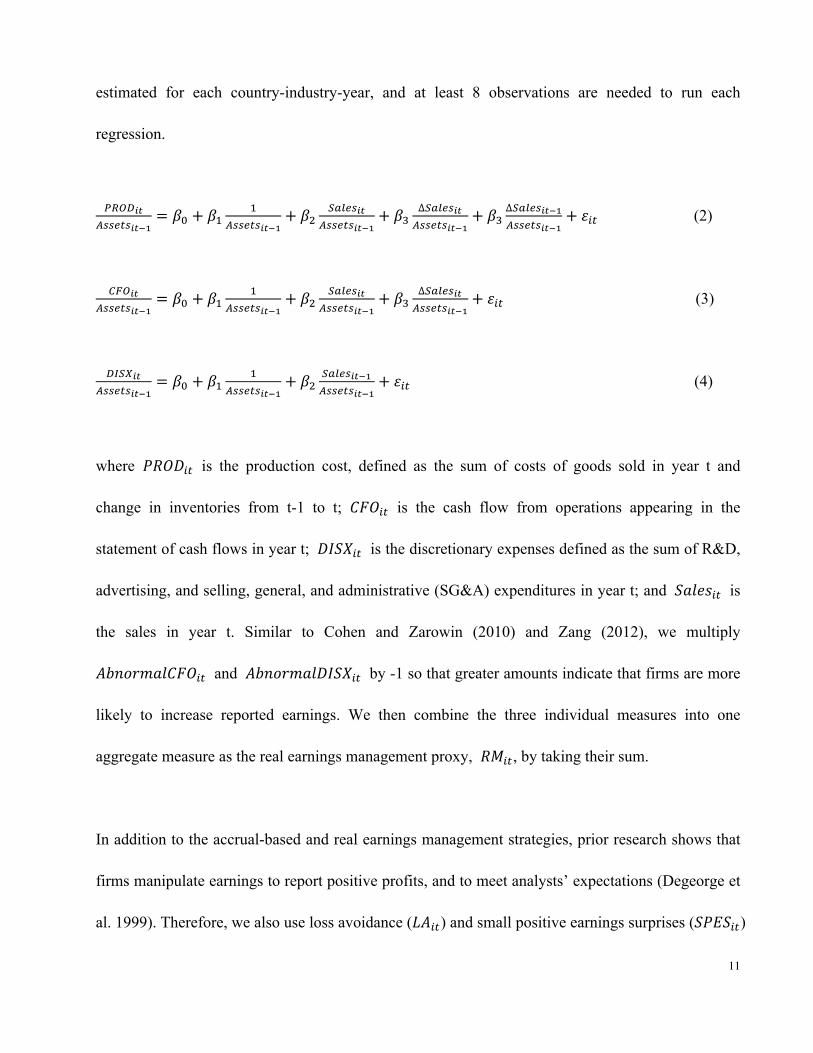
Following Roychowdhury (2006) and Cohen and Zarowin (2010), we use the abnormal level of
production cost ( 𝐴𝑏𝑛𝑜𝑟𝑚𝑎𝑙𝑃𝑅𝑂𝐷!" ), the abnormal level of cash flow from operations
(𝐴𝑏𝑛𝑜𝑟𝑚𝑎𝑙𝐶𝐹𝑂!"), and the abnormal level of discretionary expenses (𝐴𝑏𝑛𝑜𝑟𝑚𝑎𝑙𝐷𝐼𝑆𝑋!") to capture
the extent of real activities manipulation. They are calculated as the differences between actual
values and the fitted values predicted by equations (2), (3) and (4). Like previously, the models are
11
estimated for each country-industry-year, and at least 8 observations are needed to run each
regression.
!"#$!"!""#$"!"!!
= 𝛽! + 𝛽!!
!!!"#!!"!!+ 𝛽!
!"#$%!"!""#$"!"!!
+ 𝛽!∆!"#$%!"!""#$"!"!!
+ 𝛽!∆!"#$%!"!!!""#$"!"!!
+ 𝜀!" (2)
!"#!"!""#$"!"!!
= 𝛽! + 𝛽!!
!""#$"!"!!+ 𝛽!
!"#$%!"!""#$"!"!!
+ 𝛽!∆!"#$%!"!""#$"!"!!
+ 𝜀!" (3)
!"#$!"!""#$"!"!!
= 𝛽! + 𝛽!!
!""#$"!"!!+ 𝛽!
!"#$%!"!!!""#$"!"!!
+ 𝜀!" (4)
where 𝑃𝑅𝑂𝐷!" is the production cost, defined as the sum of costs of goods sold in year t and
change in inventories from t-1 to t; 𝐶𝐹𝑂!" is the cash flow from operations appearing in the
statement of cash flows in year t; 𝐷𝐼𝑆𝑋!" is the discretionary expenses defined as the sum of R&D,
advertising, and selling, general, and administrative (SG&A) expenditures in year t; and 𝑆𝑎𝑙𝑒𝑠!" is
the sales in year t. Similar to Cohen and Zarowin (2010) and Zang (2012), we multiply
𝐴𝑏𝑛𝑜𝑟𝑚𝑎𝑙𝐶𝐹𝑂!" and 𝐴𝑏𝑛𝑜𝑟𝑚𝑎𝑙𝐷𝐼𝑆𝑋!" by -1 so that greater amounts indicate that firms are more
likely to increase reported earnings. We then combine the three individual measures into one
aggregate measure as the real earnings management proxy, 𝑅𝑀!", by taking their sum.
In addition to the accrual-based and real earnings management strategies, prior research shows that
firms manipulate earnings to report positive profits, and to meet analysts’ expectations (Degeorge et
al. 1999). Therefore, we also use loss avoidance (𝐿𝐴!") and small positive earnings surprises (𝑆𝑃𝐸𝑆!")
12
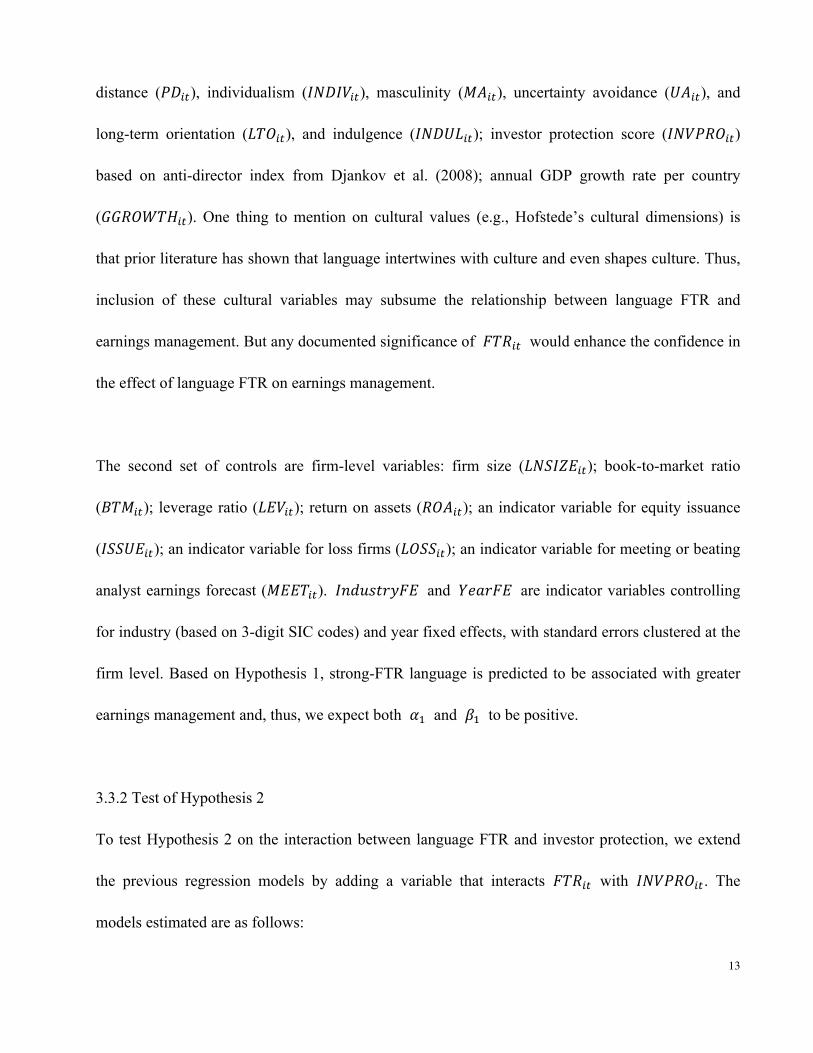
to proxy for corporate earnings management. We define 𝐿𝐴!" as a dummy variable that equals one
if a firm reports 0 to 0.01 earnings per share (𝐸𝑃𝑆!"), and zero otherwise. 𝑆𝑃𝐸𝑆!" is defined as a
dummy variable that equals one if a firm reports actual 𝐸𝑃𝑆!" 0 to 0.01 higher than consensus
earnings forecast, and zero otherwise1.
3.3 Model Specifications
3.3.1 Test of Hypothesis 1
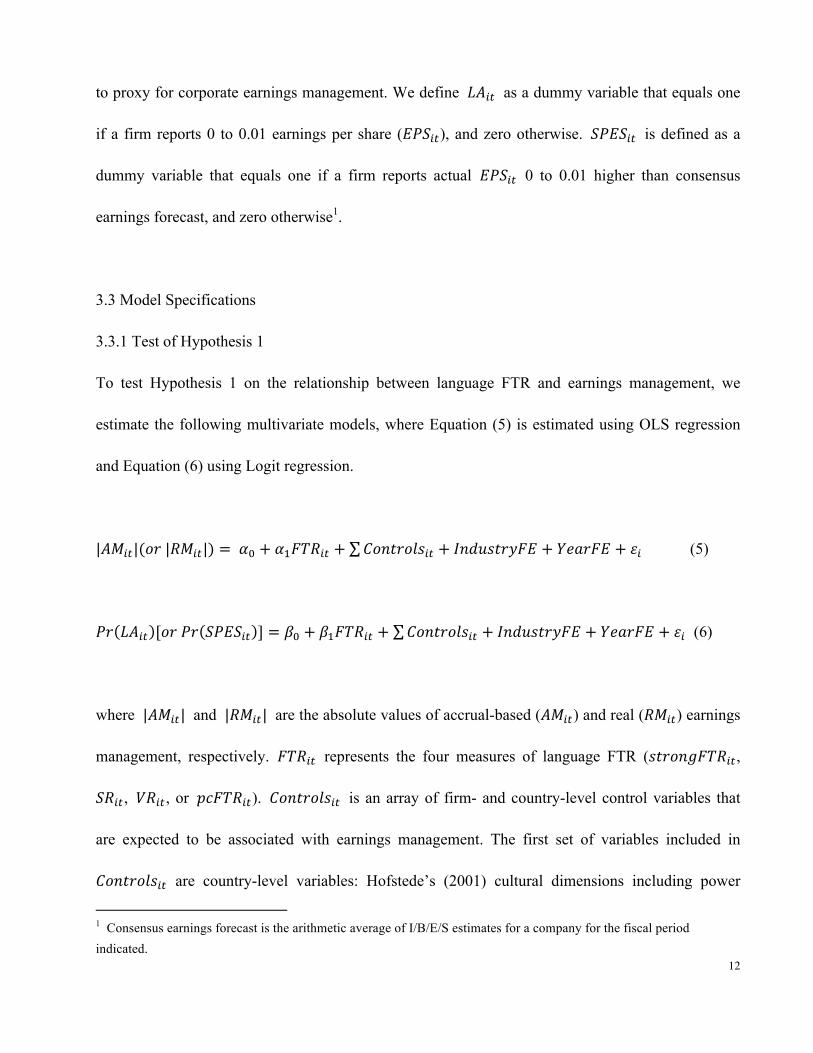
To test Hypothesis 1 on the relationship between language FTR and earnings management, we
estimate the following multivariate models, where Equation (5) is estimated using OLS regression
and Equation (6) using Logit regression.
|𝐴𝑀!"|(𝑜𝑟 |𝑅𝑀!"|) = 𝛼! + 𝛼!𝐹𝑇𝑅!" + 𝐶𝑜𝑛𝑡𝑟𝑜𝑙𝑠!" + 𝐼𝑛𝑑𝑢𝑠𝑡𝑟𝑦𝐹𝐸 + 𝑌𝑒𝑎𝑟𝐹𝐸 + 𝜀! (5)
𝑃𝑟 𝐿𝐴!" [𝑜𝑟 𝑃𝑟 𝑆𝑃𝐸𝑆!" ] = 𝛽! + 𝛽!𝐹𝑇𝑅!" + 𝐶𝑜𝑛𝑡𝑟𝑜𝑙𝑠!" + 𝐼𝑛𝑑𝑢𝑠𝑡𝑟𝑦𝐹𝐸 + 𝑌𝑒𝑎𝑟𝐹𝐸 + 𝜀! (6)
where |𝐴𝑀!"| and |𝑅𝑀!"| are the absolute values of accrual-based (𝐴𝑀!") and real (𝑅𝑀!") earnings
management, respectively. 𝐹𝑇𝑅!" represents the four measures of language FTR (𝑠𝑡𝑟𝑜𝑛𝑔𝐹𝑇𝑅!",
𝑆𝑅!", 𝑉𝑅!", or 𝑝𝑐𝐹𝑇𝑅!"). 𝐶𝑜𝑛𝑡𝑟𝑜𝑙𝑠!" is an array of firm- and country-level control variables that
are expected to be associated with earnings management. The first set of variables included in
𝐶𝑜𝑛𝑡𝑟𝑜𝑙𝑠!" are country-level variables: Hofstede’s (2001) cultural dimensions including power
1 Consensus earnings forecast is the arithmetic average of I/B/E/S estimates for a company for the fiscal period indicated.
13
distance (𝑃𝐷!"), individualism (𝐼𝑁𝐷𝐼𝑉!"), masculinity (𝑀𝐴!"), uncertainty avoidance (𝑈𝐴!"), and
long-term orientation (𝐿𝑇𝑂!"), and indulgence (𝐼𝑁𝐷𝑈𝐿!"); investor protection score (𝐼𝑁𝑉𝑃𝑅𝑂!")
based on anti-director index from Djankov et al. (2008); annual GDP growth rate per country
(𝐺𝐺𝑅𝑂𝑊𝑇𝐻!"). One thing to mention on cultural values (e.g., Hofstede’s cultural dimensions) is
that prior literature has shown that language intertwines with culture and even shapes culture. Thus,
inclusion of these cultural variables may subsume the relationship between language FTR and
earnings management. But any documented significance of 𝐹𝑇𝑅!" would enhance the confidence in
the effect of language FTR on earnings management.
The second set of controls are firm-level variables: firm size (𝐿𝑁𝑆𝐼𝑍𝐸!"); book-to-market ratio
(𝐵𝑇𝑀!"); leverage ratio (𝐿𝐸𝑉!"); return on assets (𝑅𝑂𝐴!"); an indicator variable for equity issuance
(𝐼𝑆𝑆𝑈𝐸!"); an indicator variable for loss firms (𝐿𝑂𝑆𝑆!"); an indicator variable for meeting or beating
analyst earnings forecast (𝑀𝐸𝐸𝑇!"). 𝐼𝑛𝑑𝑢𝑠𝑡𝑟𝑦𝐹𝐸 and 𝑌𝑒𝑎𝑟𝐹𝐸 are indicator variables controlling
for industry (based on 3-digit SIC codes) and year fixed effects, with standard errors clustered at the
firm level. Based on Hypothesis 1, strong-FTR language is predicted to be associated with greater
earnings management and, thus, we expect both 𝛼! and 𝛽! to be positive.
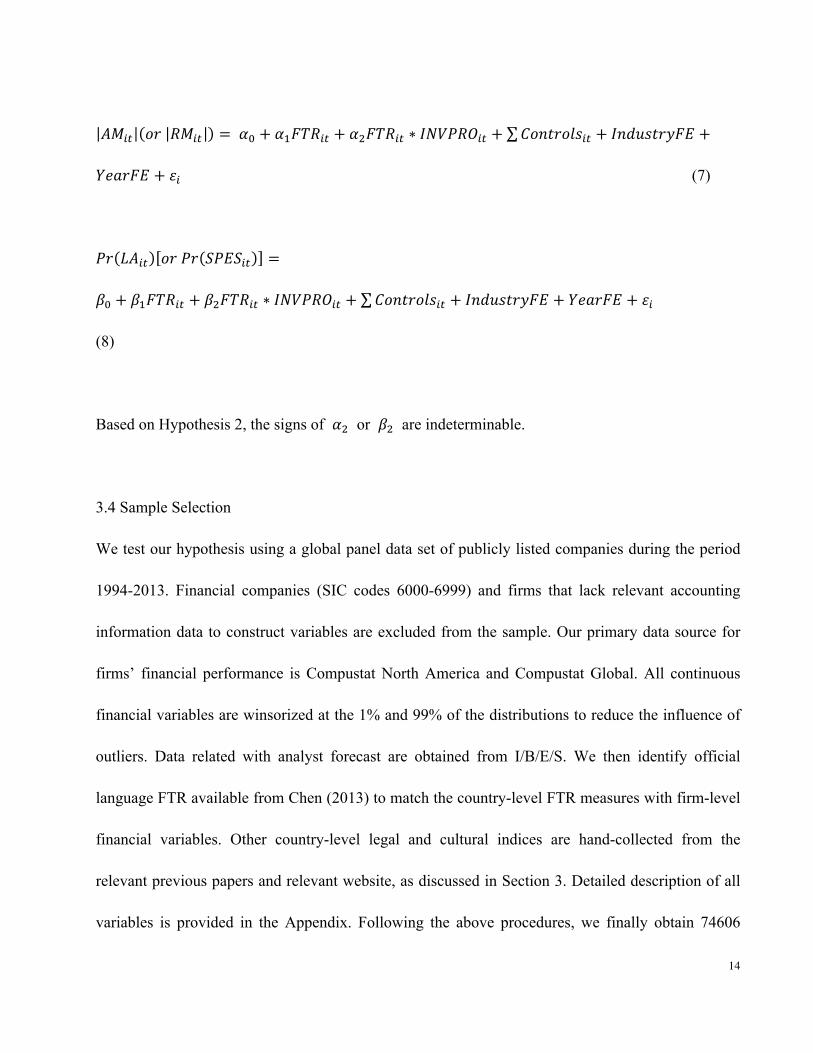
3.3.2 Test of Hypothesis 2
To test Hypothesis 2 on the interaction between language FTR and investor protection, we extend
the previous regression models by adding a variable that interacts 𝐹𝑇𝑅!" with 𝐼𝑁𝑉𝑃𝑅𝑂!". The
models estimated are as follows:
14
𝐴𝑀!" 𝑜𝑟 𝑅𝑀!" = 𝛼! + 𝛼!𝐹𝑇𝑅!" + 𝛼!𝐹𝑇𝑅!" ∗ 𝐼𝑁𝑉𝑃𝑅𝑂!" + 𝐶𝑜𝑛𝑡𝑟𝑜𝑙𝑠!" + 𝐼𝑛𝑑𝑢𝑠𝑡𝑟𝑦𝐹𝐸 +
𝑌𝑒𝑎𝑟𝐹𝐸 + 𝜀! (7)
𝑃𝑟 𝐿𝐴!" 𝑜𝑟 𝑃𝑟 𝑆𝑃𝐸𝑆!" =
𝛽! + 𝛽!𝐹𝑇𝑅!" + 𝛽!𝐹𝑇𝑅!" ∗ 𝐼𝑁𝑉𝑃𝑅𝑂!" + 𝐶𝑜𝑛𝑡𝑟𝑜𝑙𝑠!" + 𝐼𝑛𝑑𝑢𝑠𝑡𝑟𝑦𝐹𝐸 + 𝑌𝑒𝑎𝑟𝐹𝐸 + 𝜀!
(8)
Based on Hypothesis 2, the signs of 𝛼! or 𝛽! are indeterminable.
3.4 Sample Selection
We test our hypothesis using a global panel data set of publicly listed companies during the period
1994-2013. Financial companies (SIC codes 6000-6999) and firms that lack relevant accounting
information data to construct variables are excluded from the sample. Our primary data source for
firms’ financial performance is Compustat North America and Compustat Global. All continuous
financial variables are winsorized at the 1% and 99% of the distributions to reduce the influence of
outliers. Data related with analyst forecast are obtained from I/B/E/S. We then identify official
language FTR available from Chen (2013) to match the country-level FTR measures with firm-level
financial variables. Other country-level legal and cultural indices are hand-collected from the
relevant previous papers and relevant website, as discussed in Section 3. Detailed description of all
variables is provided in the Appendix. Following the above procedures, we finally obtain 74606
15
firm-year observations (with 15248 distinct firms) in 37 countries.
4. Results
4.1 Descriptive Statistics
Table 1 reports the country coverage and the FTR measures of the official languages for each
country. Among the 37 countries, U.S. constitutes the largest number of observations. Table 2
provides the descriptive statistics on our main regression variables. The mean (median) values for
|𝐴𝑀!"| and |𝑅𝑀!"| are 0.630 (0.101) and 0.662 (0.277), while the mean (median) for 𝐿𝐴!" and
𝑆𝑃𝐸𝑆!" are 0.009 (0) and 0.094 (0), respectively. 𝑠𝑡𝑟𝑜𝑛𝑔𝐹𝑇𝑅!" is right skewed with mean (median)
of 0.628 (1), consistent with Table 1 that there are more firm-year observations for strong-FTR
language countries than for weak-FTR language countries.
[Insert Table 1 and 2 Here]
Table 3 presents the pairwise correlations between the four language FTR measures and various
measures of earnings management. Generally, there is a significant and positive association between
𝑠𝑡𝑟𝑜𝑛𝑔𝐹𝑇𝑅!" , 𝑆𝑅!" , 𝑉𝑅!" , or 𝑝𝑐𝐹𝑇𝑅!" and |𝐴𝑀!"|, |𝑅𝑀!"|, 𝐿𝐴!" or 𝑆𝑃𝐸𝑆!" . In other words,
firms in strong-FTR countries have a higher level of both accrual-based and real earnings
management on average, and display a greater propensity to avoid losses and negative earnings
surprises. All correlations are statistically significant at 0.01 or 0.05 level.
[Insert Table 3 Here]
16
4.2 Univariate Comparison
Table 4 compares the mean (median) values of each earnings management measure between firms in
strong-FTR language countries (𝑠𝑡𝑟𝑜𝑛𝑔𝐹𝑇𝑅!" = 1) and those in weak-FTR language countries
(𝑠𝑡𝑟𝑜𝑛𝑔𝐹𝑇𝑅!" = 0). The magnitudes of all earnings management measures are greater for firms
headquartered in strong-FTR countries, and the differences between the two types of earnings
management are consistently significant, indicating that strong-FTR firms are more likely to engage
in earnings manipulation. But, given the above comparison is univariate, we shall turn to
multivariate regressions
[Insert Table 4 Here]
4.3 Multivariate Regressions
4.3.1 Test of Hypothesis 1
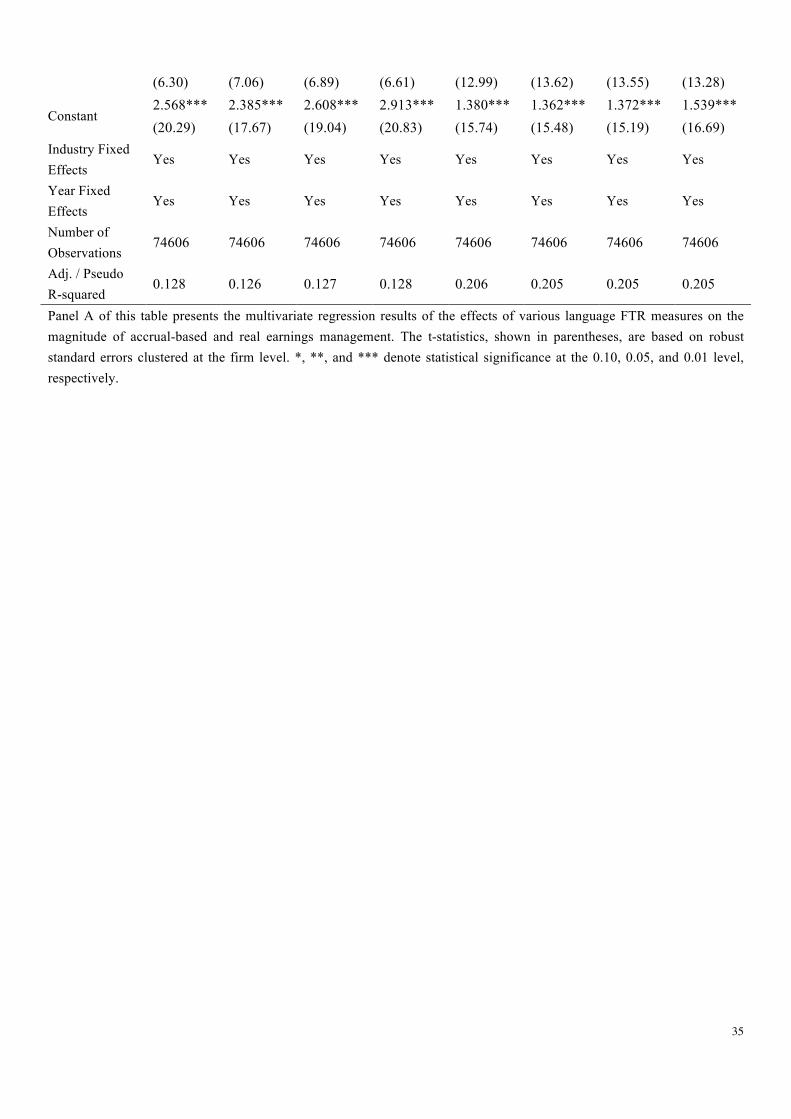
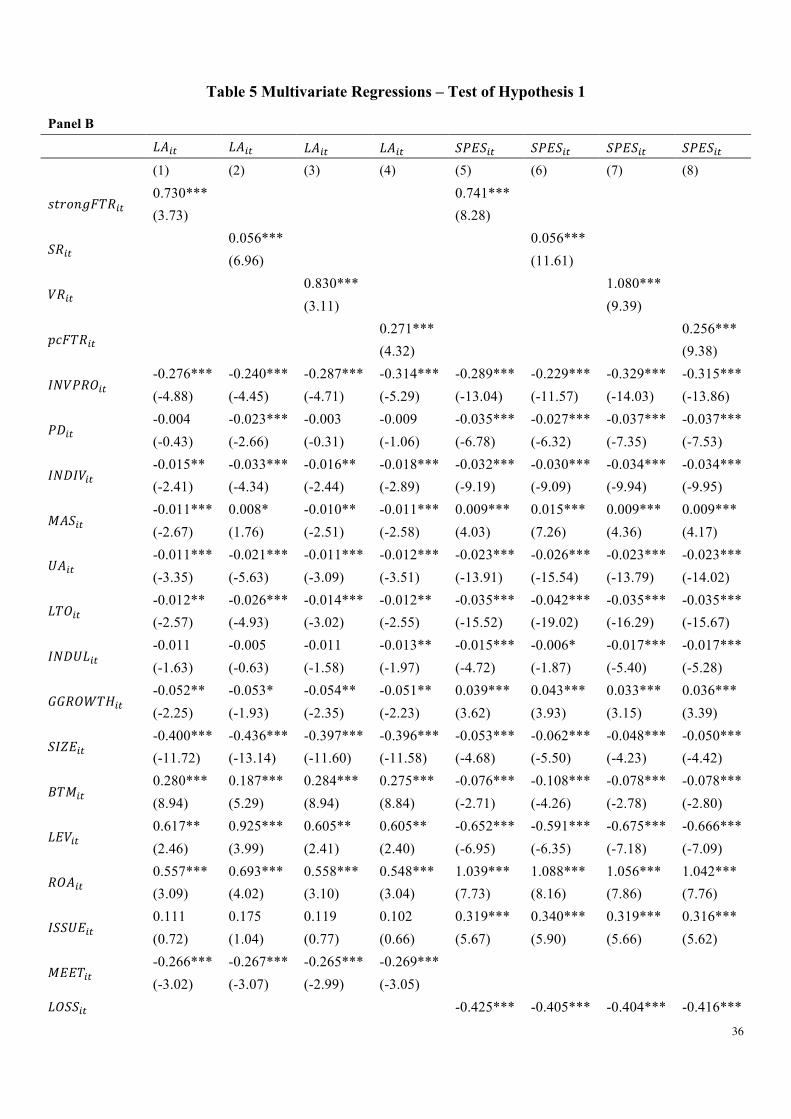
Table 5 reports the regression results for the hypothesis on the relationship between language FTR
and the absolute magnitudes of accrual-based and real earnings management as well as the
likelihood of reporting small positive income and earnings surprises. All columns include industry
and year fixed effects to control for the heterogeneity in earnings management of firms in different
industries and different years. And Panel A shows that 𝑠𝑡𝑟𝑜𝑛𝑔𝐹𝑇𝑅!", 𝑆𝑅!", 𝑉𝑅!", and 𝑝𝑐𝐹𝑇𝑅!"
are significantly positively associated with |𝐴𝑀!"| and 𝑅𝑀!" all at the 0.01 level. These results
indicate that firms headquartered in a strong-FTR country, on average, report 0.424 more
accrual-based and 0.210 more real earnings management than their counterparts in a weak-FTR
country. This effect is economically sizable, given that the mean values of absolute discretionary
17
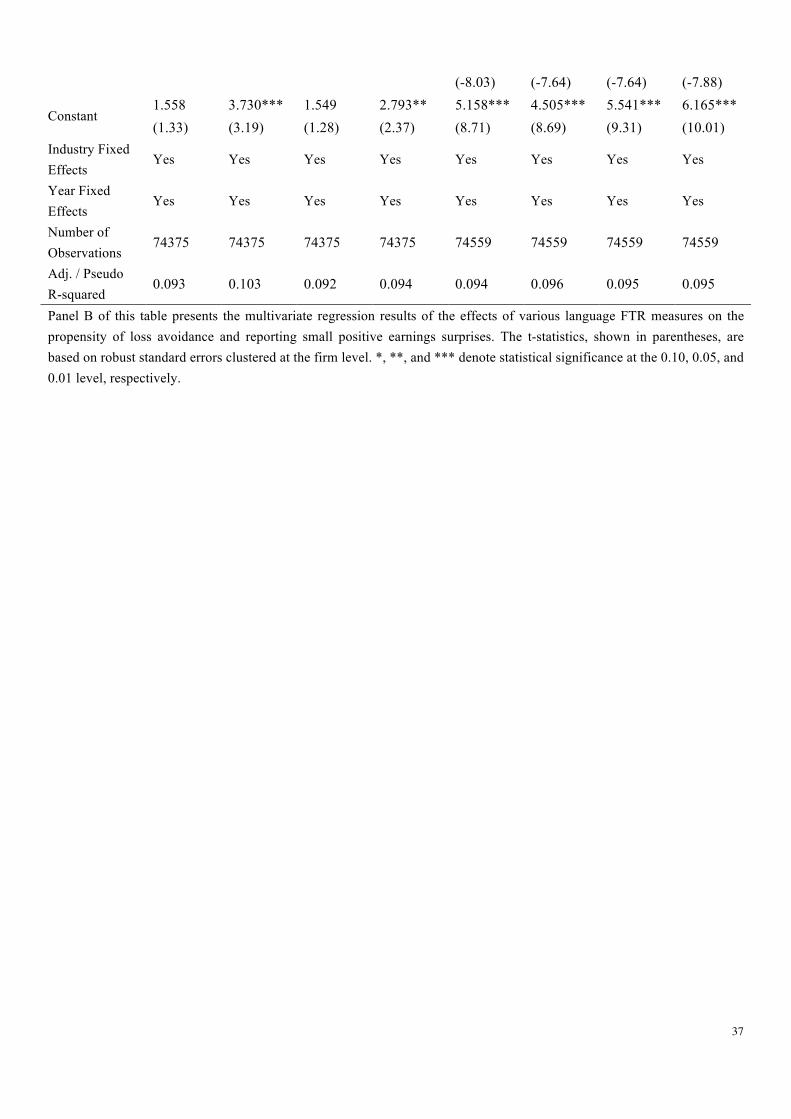
accruals and real activities manipulation are 0.630 and 0.662. Inspection of Panel B suggests that the
odds of firms avoiding reporting losses, and of meeting analysts’ earnings forecasts in a strong-FTR
language country are 2.075 (𝑒!.!"#) and 2.098 (𝑒!.!"#) times the odds of firms in a weak-FTR
language country2. These results are consistent with strong-FTR language inducing managers to
behave myopically to meet short-term benchmarks. Note that all the significance is after controlling
for cultural traits. Thus, it seems that language FTR is a fundamental source of managerial myopia
and, hence, corporate earnings management, and its influence is above and beyond conventionally
recognized cultural proxies. Indeed, Liang et al. (2014) argue that language is a key determinant
because it acts as a “specific underlying mechanism that carries culture”.
[Insert Table 5 Here]
Turning our attention to control variables, we find that 𝐼𝑁𝑉𝑃𝑅𝑂!" is significantly negatively
associated with |𝐴𝑀!"| , |𝑅𝑀!"| , 𝐿𝐴!" and 𝑆𝑃𝐸𝑆!" (at the 0.01 level), indicating that the
effectiveness of legal protection can reduce firms’ earnings management. 𝐼𝑁𝐷𝐼𝑉!" and 𝐿𝑇𝑂!" are
also generally negatively associated with these earnings management measures consistent with prior
research that managers in cultures with low levels of individualism are less likely to manipulate
earnings since they intend to protect the collective welfare of corporate stakeholders, and that
long-term oriented societies are less inclined to manipulate earnings due to its long-run perspective
(Doupnik 2008). On the contrary, 𝑀𝐴𝑆!" is generally positively associated with earnings
management, supporting the view that managers are more motivated to manage earnings to achieve
2 These results are robust to all the additional analyses discussed in Section 5.
18
financial goals in masculine societies.
4.3.2 Test of Hypothesis 2
Hypothesis 2 suggests that investor protection may influence the effects of language FTR on firms’
earnings manipulation pattern. The multivariate regression results of test of the second hypothesis
are provided in Table 6. Specifically, the estimated coefficients on the four interaction terms are
generally negatively significantly related with the four earnings management measures, suggesting
that the formal institution of investor protection acts as a governance mechanism in mitigating
earnings manipulation.
[Insert Table 6 Here]
Overall, our findings generally support the correlation between language FTR and earnings
management as predicted. This is consistent with the hypotheses that strong language FTR affects
managerial decision making process, and formal legal institution such as investor protection may
have an impact on such a process.
5. Additional Analyses
5.1 Additional Controls
Prior literature shows that religiosity is negatively associated with incidences of financial reporting
irregularities (McGuire et al. 2012). To the extent that religiosity is an integrated measure of cultural
19
values, one may be worried that our results are driven by differences in religiosities across countries.
To mitigate this concern, we include the variable 𝑅𝐸𝐿𝐼𝐺𝐶!", which measures the percentage of
Christianity (Protestant plus Catholic) religious beliefs in the country. Besides, recent emerging
evidence suggests that social trust increases investors’ demand for corporate information and
induces firms’ information production, thereby increasing financial reporting transparency (Nanda
and Wysocki 2013). We measure the level of social trust (𝑇𝑅𝑈𝑆𝑇!") in a country based on the
response of the World Values Survey to the question “Generally speaking, would you say that most
people can be trusted or that you can't be too careful in dealing with people?” In addition, we further
include an alternative measure of investor protection, i.e., the public enforcement index (𝑃𝐸𝑁𝐹!")
documented by Djankov et al. (2008). Untabulated results show that, after adding these additional
variables, all our main regression results hold.
These results are particularly important because they exclude the possibility that language FTR is
not causing earnings management but it is rather simply reflecting legal, regulatory or cultural
differences. Chen (2013) shows, both theoretically and empirically, that language and culture are
two different constructs. Our analysis extends this notion to companies, showing that the effect of
language FTR is not subsumed by any additional legal, regulatory and cultural institutions.
5.2 Dropping observations
Given that U.S. constitutes the largest number of observations (both in the general sample and in the
strong-FTR subsample), we repeat the tests after dropping the U.S. firms to assess the sensitivity of
the results to the U.S. exclusion. All earnings management measures continue to have a similar
20
association with language FTR as in the reported main results, except that 𝑝𝑐𝐹𝑇𝑅!" is now
insignificant for |𝑅𝑀!"|. Hence, other than this single real activities manipulation measure, the
inferences on the impact of language FTR on earnings management are not heavily affected by U.S.
firms. We also rerun the analysis by removing Japanese and Chinese firms, as they represent 55% of
the weak-FTR language subsample. The main results relative to both Hypothesis 1 and 2 hold, and
this allows us ruling out the possibility that results are driven by omitted country-level effects.
In addition, some countries have both strong and weak FTR populations. Belgium, Switzerland,
Hong Kong, Singapore, Nigeria and the Netherlands are either identified as “multilingual countries”
by Chen (2013) or have both strong FTR and weak FTR official languages. In order to get a cleaner
setting to test our hypotheses, we drop these six countries to check where our main findings still
hold. In untabulated results, the coefficients of language FTR are comparable to those reported using
the full dataset for Hypothesis 1, but not for Hypothesis 2.
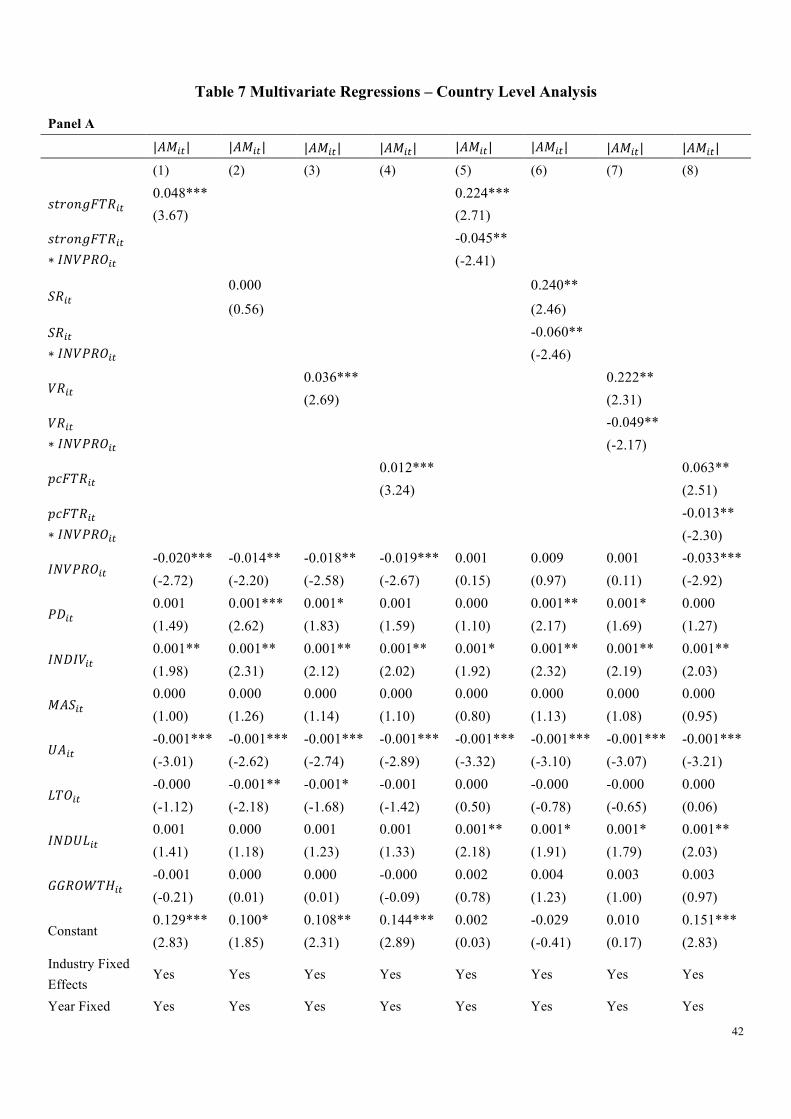
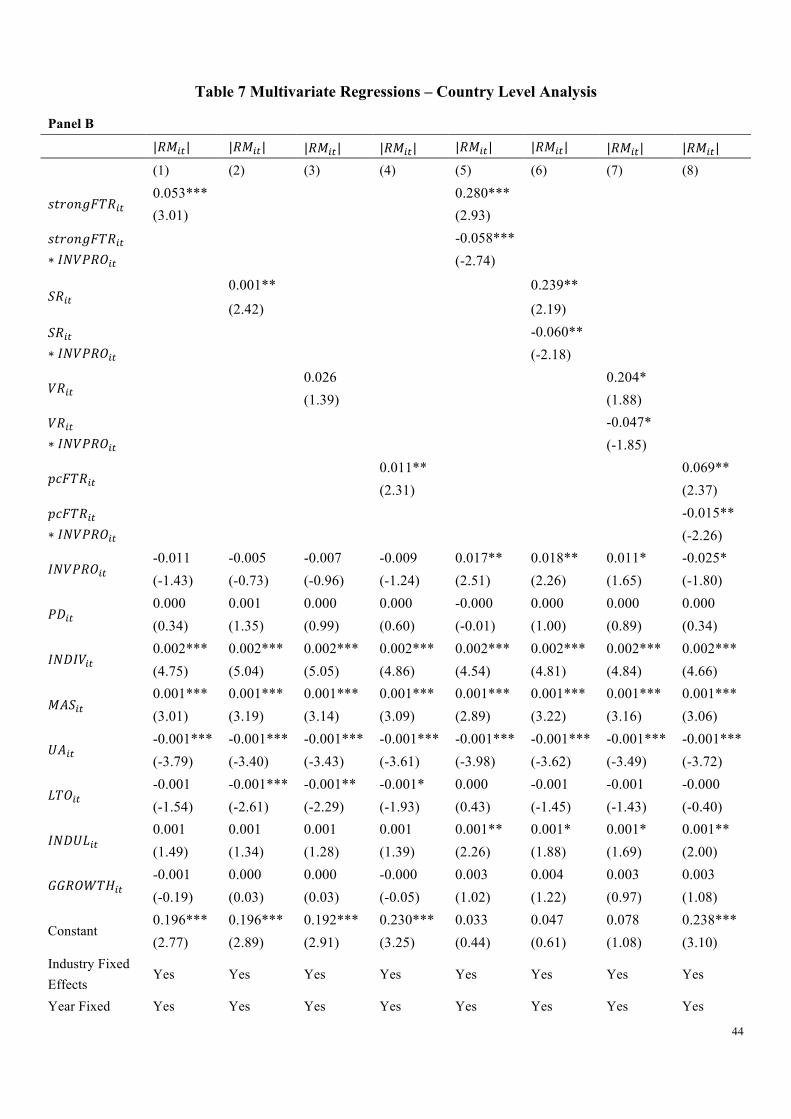
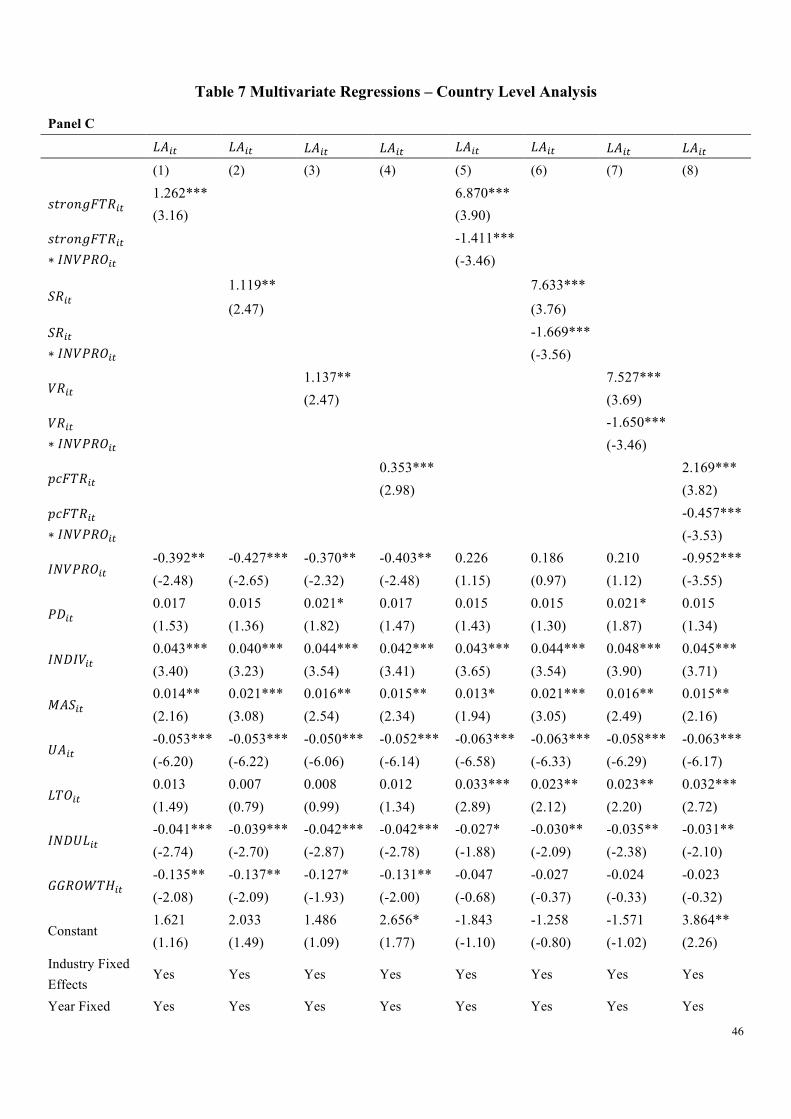
5.3 Country-Level Analysis
To mitigate the concern that the dependent earnings management variables are measured at the firm
level while the independent language FTR variables do not vary across firms in a country, we
perform a country-level analysis where |𝐴𝑀!"| and |𝑅𝑀!"| are calculated at their medians for each
country-year, and 𝐿𝐴!" and 𝑆𝑃𝐸𝑆!" are dummy variables that take one if a country has the above
median number of loss avoidance firms and small positive earnings surprises firms in a given year
and zero otherwise. We then regress them on different measures of 𝐹𝑇𝑅!", the interaction terms of
21
𝐹𝑇𝑅!" ∗ 𝐼𝑁𝑉𝑃𝑅𝑂!", and country-level legal, cultural and economic institutions, while controlling for
year fixed effects. This approach alleviates the concern of the regression results being influence by
uneven number of observations across countries, while controlling for any time-series variation in
the earnings management proxies driven by the other firm- and country-level factors. The evidence
for the new country-year observation sample is consistent with (though weaker than) the firm-year
observation sample, as almost all 𝐹𝑇𝑅!" measures and the interaction terms of 𝐹𝑇𝑅!" ∗ 𝐼𝑁𝑉𝑃𝑅𝑂!"
load significantly for most of the equations and all with the predicted signs.
[Insert Table 7 Here]
In general, results in this section support the hypothesis on the important role that the official
language FTR plays in shaping corporate earnings management. It turns out that language FTR is a
statistically and economically significant determinant of earnings management, beyond the
conventionally recognized cultural proxies. The results are robust to additional country-level
controls, different sample compositions, and a country-level regression.
6. Conclusion
In this paper, we investigate the effect of variation in an important linguistic feature, i.e., the future
time reference of a language, on international differences in earnings management. We identify
grammatical FTR as an key determinant of managerial myopia. Repeatedly encoding the future time
period induces strong-FTR language speakers to unconsciously separate the future from the present,
and induces more short-term oriented behaviors. Controlling for firm-, industry- and country-level
22
determinants of earnings management, we document a significantly positive association between
strong language FTR and the tendency (and intensity) to engage in real and accrual-based earnings
manipulation to meet short-term earnings benchmarks. Furthermore, this association decreases with
the strength of investor protection. These results are also robust to using multiple proxies for
earnings management, additional controls and different potential research design issues. Overall, our
results highlight the important role of a salient language feature in shaping corporate decision
making.
23
References
Brochet, F., Loumioti, M., Serafeim, G., 2014. Short-termism, investor clientele, and corporate
performance. Working Paper, Harvard University.
Bushee, B., 1998. The influence of institutional investors in myopic R&D investment behavior. The
Accounting Review 73(3), 305-334.
Chen, M. K., 2013. The effect of language on economic behavior: Evidence from savings rates,
health behaviors, and retirement assets. American Economic Review 103 (2), 690–731.
Chen, S., Cronqvist, H., Ni, S., Zhang, F., 2015. Languages and corporate cash holdings:
International Evidence. Working paper, China Europe International Business School.
Chomsky, N., 1957. Syntactic Structures. Paris: Mouton and Co.
Cohen, D., Zarowin, P., 2010. Accrual-based and real earnings management activities around
seasoned equity offerings. Journal of Accounting and Economics 50 (1), 2–19.
Dahl, O., 1985. Tense and Aspect Systems. Blackwell Publishers, Oxford, U.K.
Dahl, O., 2000. The grammar of future time reference in European languages. Tense and Aspect in
the Languages of Europe (6), 309–328.
DeFond, M., Hung, M., Trezevant, R., 2007. Investor protection and the information content of
annual earnings announcements: International evidence. Journal of Accounting and Economics 43
(1), 37-67.
24
Dechow, P. M., Sloan, R. G., Sweeny., A. P., 1995. Detecting earnings management. The
Accounting Review 70 (2), 193–225.
Degeorge, F., Patel, J., Zeckhauser, R., 1999. Earnings management to exceed thresholds. Journal of
Business 72 (1), 1–33.
Doupnik, T. S., 2008. Influence of culture on earnings management: A note. Abacus 44 (3), 317–
340.
Djankov, S., La Porta, R., Lopez-de-Silanes, F., Shleifer, A., 2008. The law and economics of
self-dealing. Journal of Financial Economics 88 (3), 430–465.
Evans, N., Levinson, S. C., 2009. The myth of language universals: Language diversity and its
importance for cognitive science. Behavioral and Brain Sciences 32 (5), 429–448.
Han, S., Kang, T., Salter, S., Yoo, Y. K., 2010. A cross-country study on the effects of national
culture on earnings management. Journal of International Business Studies 41 (1), 123–141.
Healy, P. M., Wahlen, J. M., 1999. A review of the earnings management literature and its
implications for standard setting. Accounting Horizons 13 (4), 365-383.
Hofstede, G. 2001 Culture’s Consequences, Comparing Values, Behaviors, Institutions, and
Organizations Across Nations. Sage, Thousand Oaks, CA.
Jones, J.J., 1991. Earnings management during import relief investigations. Journal of Accounting
Research 29 (2), 193–228
Kothari, S., Leone, A., Wasley, C., 2005. Performance matched discretionary accrual measures.
25
Journal of Accounting and Economics 39 (1), 163–197.
Leuz, C., Nanda, D., Wysocki, P. D., 2003. Earnings management and investor protection: An
international comparison. Journal of Financial Economics 69 (3), 505–527.
Liang, H., Marquis, C., Renneboog, L., Sun, S. L., 2014. Speaking of corporate social responsibility.
Working Paper, Harvard Business School.
McGuire, S. T., Omer, T. C., Sharp, N. Y., 2012. The impact of religion on financial reporting
irregularities. The Accounting Review 87 (2), 645–673.
Nanda, D., Wysocki, P., 2013. Trust, external capital and financial transparency. Working Paper,
University of Miami.
Pinker, S., 1994. The Language Instinct: How the Mind Creates Language. New York: William
Morrow and Company.
Roychowdhury, S., 2006. Earnings management through real activities manipulation. Journal of
Accounting and Economics 42 (3), 335–370.
Sapir, E., 1951. The Status of Linguistics as a Science. In Selected Writings. David Mandelbaum, ed.
Berkeley: University of California Press. Orig. pub. in Language 5, 207–214.
Slobin, D. I., 1987. Thinking for speaking. In: Proceedings of the Berkeley Linguistics Society. 3,
435–445.
Stein, J. C., 1989. Efficient capital markets, inefficient firms: A model of myopic corporate behavior.
Quarterly Journal of Economics 104 (4), 655–669.

26
Stulz, R., Williamson, R., 2003. Culture, openness, and finance. Journal of Financial Economics 70
(3), 261–300.
Thieroff, R., 2000. On the areal distribution of tense-aspect categories in Europe. Empirical
Approaches to Language Typology (6), 265–308.
Whorf, B. L., Carroll, J. B., Chase, S., 1956. Language, Thought and Reality: Selected Writings of
Benjamin Lee Whorf. MIT Press, Cambridge.
Wittgenstein, L. 1922. Tractatus Logico-Philosophicus. London: Routledge.
Zang, A., 2012. Evidence on the trade-off between real activities manipulation and accrual-based
earnings management. The Accounting Review 87 (2), 675–670.
27
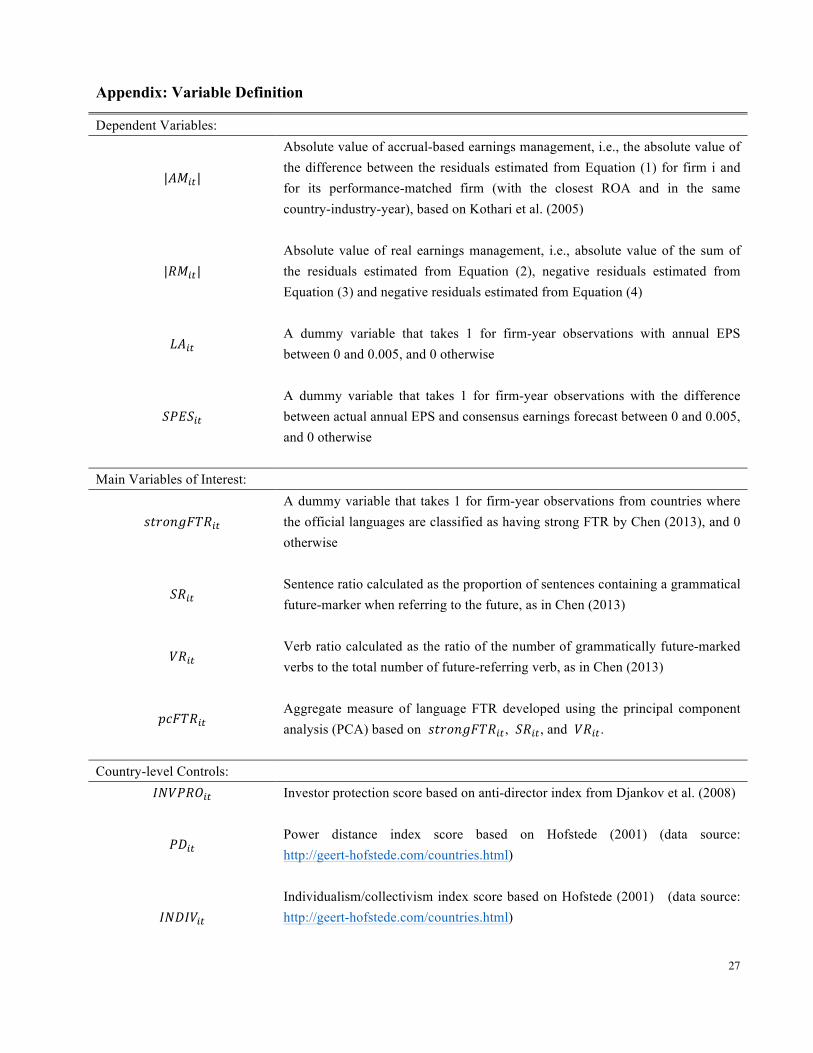
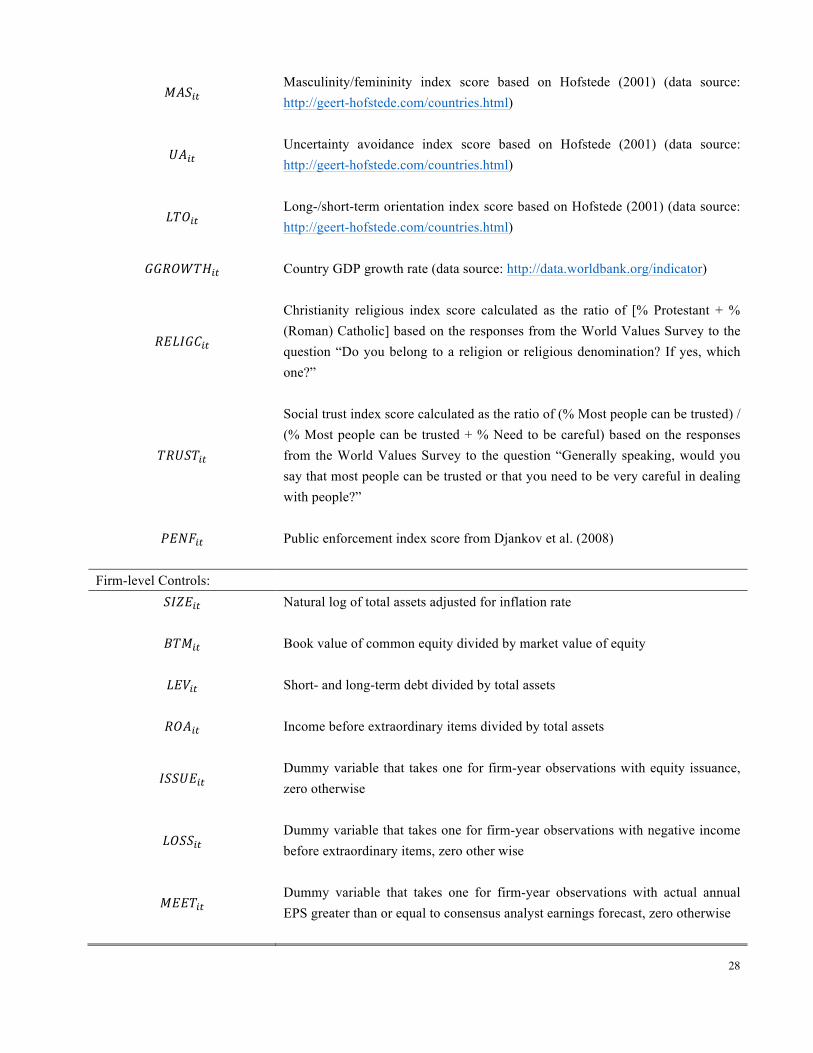
Appendix: Variable Definition
Dependent Variables:
|𝐴𝑀!"|
Absolute value of accrual-based earnings management, i.e., the absolute value of the difference between the residuals estimated from Equation (1) for firm i and for its performance-matched firm (with the closest ROA and in the same country-industry-year), based on Kothari et al. (2005)
|𝑅𝑀!"| Absolute value of real earnings management, i.e., absolute value of the sum of the residuals estimated from Equation (2), negative residuals estimated from Equation (3) and negative residuals estimated from Equation (4)
𝐿𝐴!" A dummy variable that takes 1 for firm-year observations with annual EPS between 0 and 0.005, and 0 otherwise
𝑆𝑃𝐸𝑆!" A dummy variable that takes 1 for firm-year observations with the difference between actual annual EPS and consensus earnings forecast between 0 and 0.005, and 0 otherwise
Main Variables of Interest:
𝑠𝑡𝑟𝑜𝑛𝑔𝐹𝑇𝑅!" A dummy variable that takes 1 for firm-year observations from countries where the official languages are classified as having strong FTR by Chen (2013), and 0 otherwise
𝑆𝑅!" Sentence ratio calculated as the proportion of sentences containing a grammatical future-marker when referring to the future, as in Chen (2013)
𝑉𝑅!" Verb ratio calculated as the ratio of the number of grammatically future-marked verbs to the total number of future-referring verb, as in Chen (2013)
𝑝𝑐𝐹𝑇𝑅!" Aggregate measure of language FTR developed using the principal component analysis (PCA) based on 𝑠𝑡𝑟𝑜𝑛𝑔𝐹𝑇𝑅!", 𝑆𝑅!", and 𝑉𝑅!".
Country-level Controls:
𝐼𝑁𝑉𝑃𝑅𝑂!" Investor protection score based on anti-director index from Djankov et al. (2008)
𝑃𝐷!" Power distance index score based on Hofstede (2001) (data source: http://geert-hofstede.com/countries.html)
𝐼𝑁𝐷𝐼𝑉!" Individualism/collectivism index score based on Hofstede (2001) (data source: http://geert-hofstede.com/countries.html)
28
𝑀𝐴𝑆!" Masculinity/femininity index score based on Hofstede (2001) (data source: http://geert-hofstede.com/countries.html)
𝑈𝐴!" Uncertainty avoidance index score based on Hofstede (2001) (data source: http://geert-hofstede.com/countries.html)
𝐿𝑇𝑂!" Long-/short-term orientation index score based on Hofstede (2001) (data source: http://geert-hofstede.com/countries.html)
𝐺𝐺𝑅𝑂𝑊𝑇𝐻!" Country GDP growth rate (data source: http://data.worldbank.org/indicator)
𝑅𝐸𝐿𝐼𝐺𝐶!"
Christianity religious index score calculated as the ratio of [% Protestant + % (Roman) Catholic] based on the responses from the World Values Survey to the question “Do you belong to a religion or religious denomination? If yes, which one?”
𝑇𝑅𝑈𝑆𝑇!"
Social trust index score calculated as the ratio of (% Most people can be trusted) / (% Most people can be trusted + % Need to be careful) based on the responses from the World Values Survey to the question “Generally speaking, would you say that most people can be trusted or that you need to be very careful in dealing with people?”
𝑃𝐸𝑁𝐹!" Public enforcement index score from Djankov et al. (2008)
Firm-level Controls:
𝑆𝐼𝑍𝐸!" Natural log of total assets adjusted for inflation rate
𝐵𝑇𝑀!" Book value of common equity divided by market value of equity
𝐿𝐸𝑉!" Short- and long-term debt divided by total assets
𝑅𝑂𝐴!" Income before extraordinary items divided by total assets
𝐼𝑆𝑆𝑈𝐸!" Dummy variable that takes one for firm-year observations with equity issuance, zero otherwise
𝐿𝑂𝑆𝑆!" Dummy variable that takes one for firm-year observations with negative income before extraordinary items, zero other wise
𝑀𝐸𝐸𝑇!" Dummy variable that takes one for firm-year observations with actual annual EPS greater than or equal to consensus analyst earnings forecast, zero otherwise
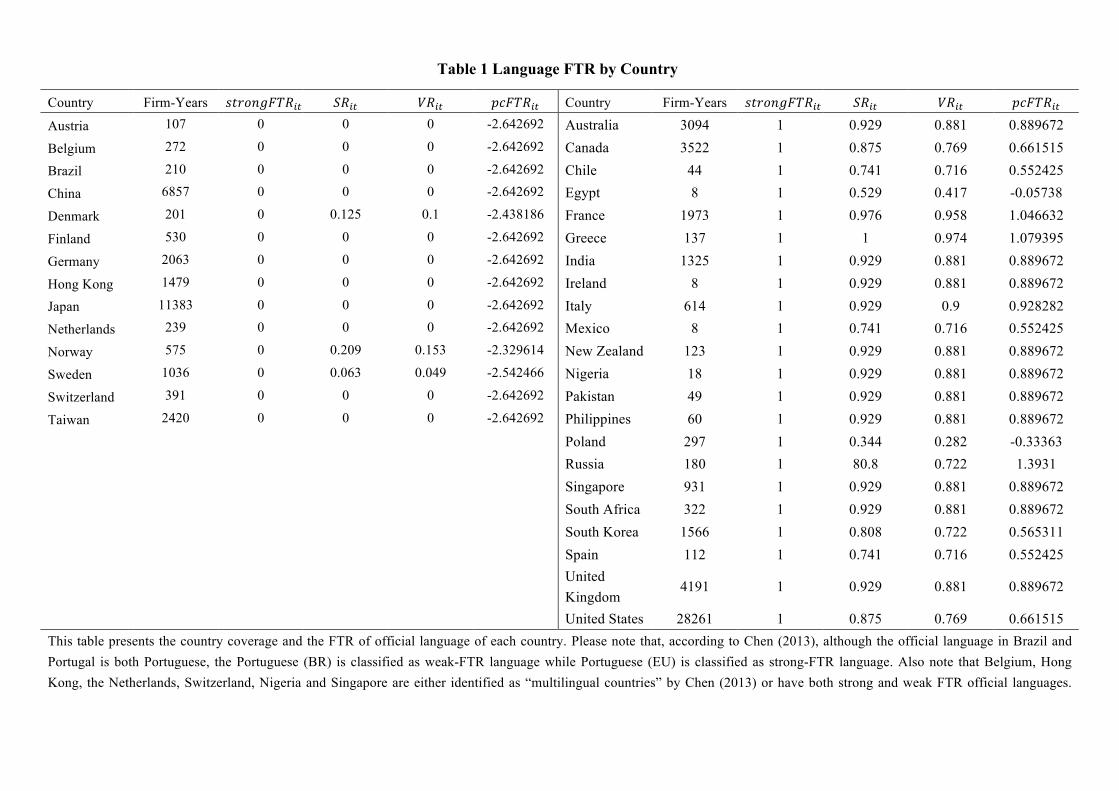
Table 1 Language FTR by Country
Country Firm-Years 𝑠𝑡𝑟𝑜𝑛𝑔𝐹𝑇𝑅!" 𝑆𝑅!" 𝑉𝑅!" 𝑝𝑐𝐹𝑇𝑅!" Country Firm-Years 𝑠𝑡𝑟𝑜𝑛𝑔𝐹𝑇𝑅!" 𝑆𝑅!" 𝑉𝑅!" 𝑝𝑐𝐹𝑇𝑅!"
Austria 107 0 0 0 -2.642692 Australia 3094 1 0.929 0.881 0.889672
Belgium 272 0 0 0 -2.642692 Canada 3522 1 0.875 0.769 0.661515
Brazil 210 0 0 0 -2.642692 Chile 44 1 0.741 0.716 0.552425
China 6857 0 0 0 -2.642692 Egypt 8 1 0.529 0.417 -0.05738
Denmark 201 0 0.125 0.1 -2.438186 France 1973 1 0.976 0.958 1.046632
Finland 530 0 0 0 -2.642692 Greece 137 1 1 0.974 1.079395
Germany 2063 0 0 0 -2.642692 India 1325 1 0.929 0.881 0.889672
Hong Kong 1479 0 0 0 -2.642692 Ireland 8 1 0.929 0.881 0.889672
Japan 11383 0 0 0 -2.642692 Italy 614 1 0.929 0.9 0.928282
Netherlands 239 0 0 0 -2.642692 Mexico 8 1 0.741 0.716 0.552425
Norway 575 0 0.209 0.153 -2.329614 New Zealand 123 1 0.929 0.881 0.889672
Sweden 1036 0 0.063 0.049 -2.542466 Nigeria 18 1 0.929 0.881 0.889672
Switzerland 391 0 0 0 -2.642692 Pakistan 49 1 0.929 0.881 0.889672
Taiwan 2420 0 0 0 -2.642692 Philippines 60 1 0.929 0.881 0.889672
Poland 297 1 0.344 0.282 -0.33363
Russia 180 1 80.8 0.722 1.3931
Singapore 931 1 0.929 0.881 0.889672
South Africa 322 1 0.929 0.881 0.889672
South Korea 1566 1 0.808 0.722 0.565311
Spain 112 1 0.741 0.716 0.552425
United
Kingdom 4191 1 0.929 0.881 0.889672
United States 28261 1 0.875 0.769 0.661515 This table presents the country coverage and the FTR of official language of each country. Please note that, according to Chen (2013), although the official language in Brazil and Portugal is both Portuguese, the Portuguese (BR) is classified as weak-FTR language while Portuguese (EU) is classified as strong-FTR language. Also note that Belgium, Hong Kong, the Netherlands, Switzerland, Nigeria and Singapore are either identified as “multilingual countries” by Chen (2013) or have both strong and weak FTR official languages.

30
Based on Stulz and Williamson (2003) and Chen et al. (2015), we categorize Belgium, Hong Kong, the Netherlands and Switzerland’s FTR as weak, and Nigeria and Singapore’s FTR as strong. In an additional analysis, we drop these countries to test whether the results hold under a cleaner setting.
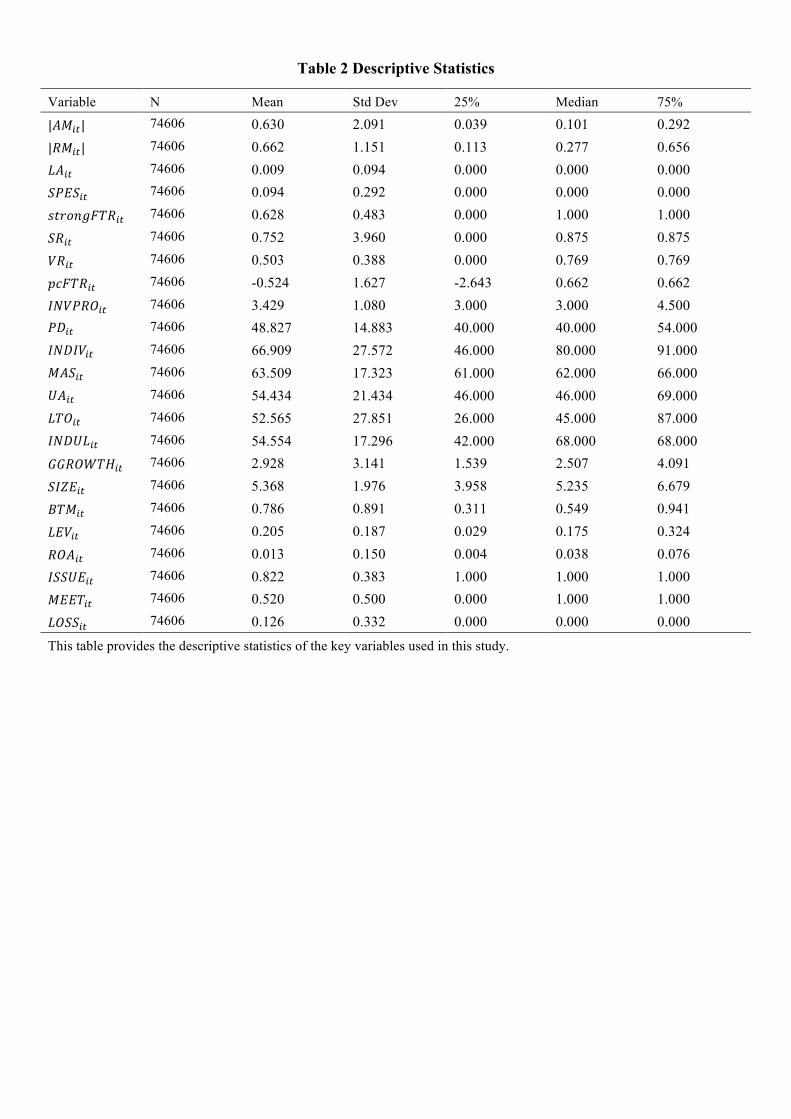
Table 2 Descriptive Statistics
Variable N Mean Std Dev 25% Median 75%
|𝐴𝑀!"| 74606 0.630 2.091 0.039 0.101 0.292
|𝑅𝑀!"| 74606 0.662 1.151 0.113 0.277 0.656
𝐿𝐴!" 74606 0.009 0.094 0.000 0.000 0.000
𝑆𝑃𝐸𝑆!" 74606 0.094 0.292 0.000 0.000 0.000
𝑠𝑡𝑟𝑜𝑛𝑔𝐹𝑇𝑅!" 74606 0.628 0.483 0.000 1.000 1.000
𝑆𝑅!" 74606 0.752 3.960 0.000 0.875 0.875
𝑉𝑅!" 74606 0.503 0.388 0.000 0.769 0.769
𝑝𝑐𝐹𝑇𝑅!" 74606 -0.524 1.627 -2.643 0.662 0.662
𝐼𝑁𝑉𝑃𝑅𝑂!" 74606 3.429 1.080 3.000 3.000 4.500 𝑃𝐷!" 74606 48.827 14.883 40.000 40.000 54.000 𝐼𝑁𝐷𝐼𝑉!" 74606 66.909 27.572 46.000 80.000 91.000 𝑀𝐴𝑆!" 74606 63.509 17.323 61.000 62.000 66.000 𝑈𝐴!" 74606 54.434 21.434 46.000 46.000 69.000 𝐿𝑇𝑂!" 74606 52.565 27.851 26.000 45.000 87.000 𝐼𝑁𝐷𝑈𝐿!" 74606 54.554 17.296 42.000 68.000 68.000
𝐺𝐺𝑅𝑂𝑊𝑇𝐻!" 74606 2.928 3.141 1.539 2.507 4.091
𝑆𝐼𝑍𝐸!" 74606 5.368 1.976 3.958 5.235 6.679
𝐵𝑇𝑀!" 74606 0.786 0.891 0.311 0.549 0.941
𝐿𝐸𝑉!" 74606 0.205 0.187 0.029 0.175 0.324
𝑅𝑂𝐴!" 74606 0.013 0.150 0.004 0.038 0.076
𝐼𝑆𝑆𝑈𝐸!" 74606 0.822 0.383 1.000 1.000 1.000
𝑀𝐸𝐸𝑇!" 74606 0.520 0.500 0.000 1.000 1.000
𝐿𝑂𝑆𝑆!" 74606 0.126 0.332 0.000 0.000 0.000
This table provides the descriptive statistics of the key variables used in this study.
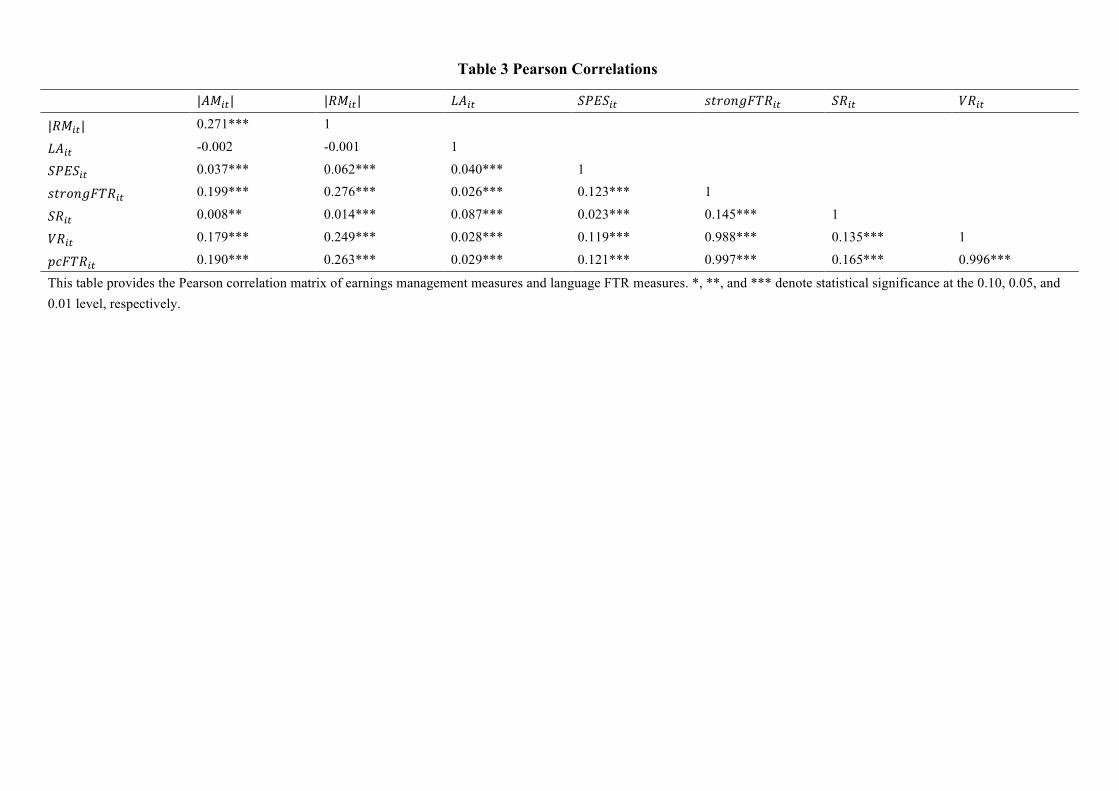
Table 3 Pearson Correlations
|𝐴𝑀!"| |𝑅𝑀!"| 𝐿𝐴!" 𝑆𝑃𝐸𝑆!" 𝑠𝑡𝑟𝑜𝑛𝑔𝐹𝑇𝑅!" 𝑆𝑅!" 𝑉𝑅!"
|𝑅𝑀!"| 0.271*** 1
𝐿𝐴!" -0.002 -0.001 1
𝑆𝑃𝐸𝑆!" 0.037*** 0.062*** 0.040*** 1
𝑠𝑡𝑟𝑜𝑛𝑔𝐹𝑇𝑅!" 0.199*** 0.276*** 0.026*** 0.123*** 1
𝑆𝑅!" 0.008** 0.014*** 0.087*** 0.023*** 0.145*** 1
𝑉𝑅!" 0.179*** 0.249*** 0.028*** 0.119*** 0.988*** 0.135*** 1
𝑝𝑐𝐹𝑇𝑅!" 0.190*** 0.263*** 0.029*** 0.121*** 0.997*** 0.165*** 0.996***
This table provides the Pearson correlation matrix of earnings management measures and language FTR measures. *, **, and *** denote statistical significance at the 0.10, 0.05, and 0.01 level, respectively.
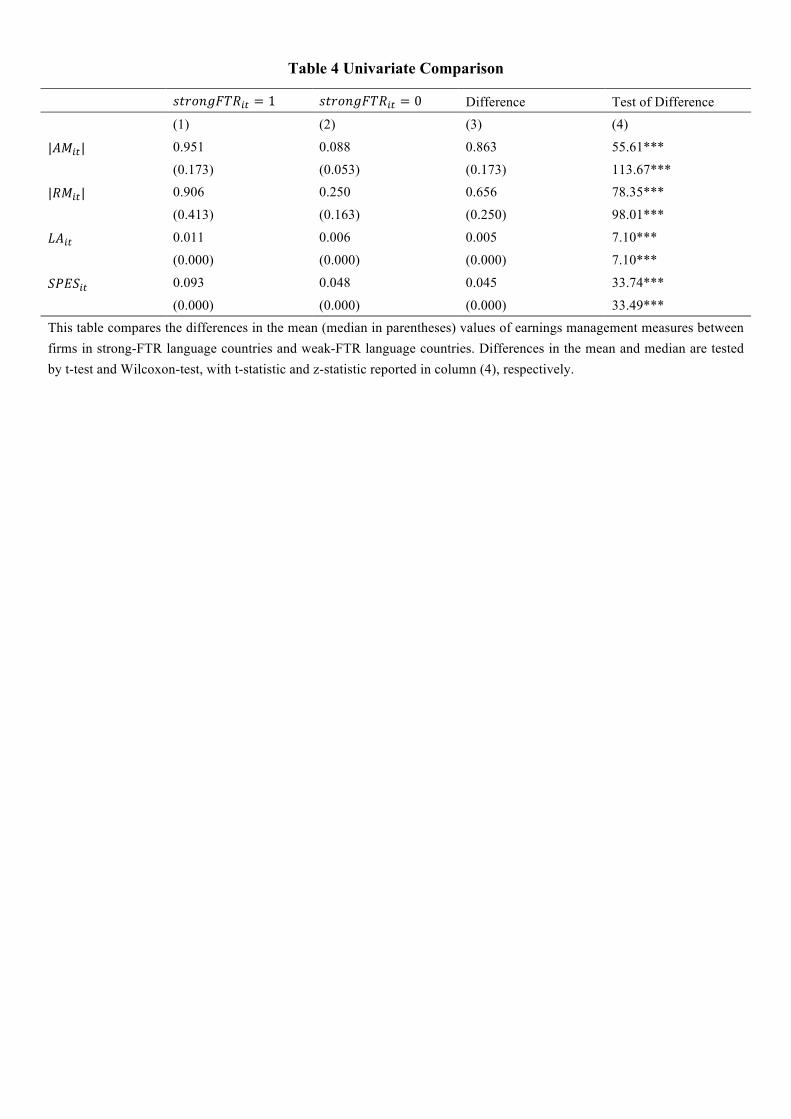
Table 4 Univariate Comparison
𝑠𝑡𝑟𝑜𝑛𝑔𝐹𝑇𝑅!" = 1 𝑠𝑡𝑟𝑜𝑛𝑔𝐹𝑇𝑅!" = 0 Difference Test of Difference (1) (2) (3) (4)
|𝐴𝑀!"| 0.951 0.088 0.863 55.61***
(0.173) (0.053) (0.173) 113.67***
|𝑅𝑀!"| 0.906 0.250 0.656 78.35***
(0.413) (0.163) (0.250) 98.01***
𝐿𝐴!" 0.011 0.006 0.005 7.10***
(0.000) (0.000) (0.000) 7.10***
𝑆𝑃𝐸𝑆!" 0.093 0.048 0.045 33.74***
(0.000) (0.000) (0.000) 33.49*** This table compares the differences in the mean (median in parentheses) values of earnings management measures between firms in strong-FTR language countries and weak-FTR language countries. Differences in the mean and median are tested by t-test and Wilcoxon-test, with t-statistic and z-statistic reported in column (4), respectively.

34
Table 5 Multivariate Regressions – Test of Hypothesis 1
Panel A
|𝐴𝑀!"| |𝐴𝑀!"| |𝐴𝑀!"| |𝐴𝑀!"| |𝑅𝑀!"| |𝑅𝑀!"| |𝑅𝑀!"| |𝑅𝑀!"| (1) (2) (3) (4) (5) (6) (7) (8)
𝑠𝑡𝑟𝑜𝑛𝑔𝐹𝑇𝑅!" 0.424***
0.210***
(19.66)
(14.29)
𝑆𝑅!" 0.007*** 0.010***
(11.88) (12.73)
𝑉𝑅!" 0.342*** 0.138***
(11.05) (6.79)
𝑝𝑐𝐹𝑇𝑅!" 0.108*** 0.051*** (15.59) (11.11)
𝐼𝑁𝑉𝑃𝑅𝑂!" -0.264*** -0.224*** -0.257*** -0.263*** -0.167*** -0.149*** -0.161*** -0.166***
(-31.63) (-30.46) (-29.95) (-30.96) (-30.51) (-30.05) (-28.95) (-29.94)
𝑃𝐷!" -0.004*** 0.003*** -0.002* -0.003*** -0.002*** 0.001 -0.001 -0.002***
(-4.51) (4.61) (-1.79) (-3.56) (-3.60) (1.01) (-0.87) (-2.76)
𝐼𝑁𝐷𝐼𝑉!" -0.008*** -0.003*** -0.007*** -0.008*** -0.003*** -0.001*** -0.002*** -0.003*** (-11.94) (-5.59) (-9.42) (-11.07) (-6.70) (-3.14) (-4.33) (-6.03)
𝑀𝐴𝑆!" 0.010*** 0.009*** 0.010*** 0.010*** 0.005*** 0.005*** 0.005*** 0.005***
(30.47) (21.34) (27.76) (29.62) (21.48) (18.37) (19.46) (20.97)
𝑈𝐴!" -0.004*** -0.004*** -0.004*** -0.004*** -0.002*** -0.002*** -0.002*** -0.002***
(-12.45) (-11.71) (-11.37) (-11.99) (-6.93) (-7.49) (-6.31) (-6.63)
𝐿𝑇𝑂!" -0.015*** -0.018*** -0.017*** -0.016*** -0.009*** -0.010*** -0.010*** -0.009*** (-27.22) (-33.36) (-30.19) (-28.63) (-21.43) (-26.69) (-24.30) (-22.77)
𝐼𝑁𝐷𝑈𝐿!" 0.005*** 0.007*** 0.005*** 0.005*** 0.002*** 0.004*** 0.003*** 0.003***
(5.98) (10.02) (6.62) (6.16) (4.56) (7.21) (5.39) (4.80)
𝐺𝐺𝑅𝑂𝑊𝑇𝐻!" -0.079*** -0.074*** -0.077*** -0.078*** -0.016*** -0.014*** -0.015*** -0.016***
(-24.62) (-22.92) (-23.88) (-24.24) (-9.87) (-8.43) (-9.26) (-9.61)
𝑆𝐼𝑍𝐸!" 0.038*** 0.032*** 0.037*** 0.038*** -0.002 -0.005 -0.003 -0.002 (8.51) (7.09) (8.08) (8.36) (-0.53) (-1.60) (-0.88) (-0.64)
𝐵𝑇𝑀!" -0.012** -0.010 -0.008 -0.011* -0.045*** -0.050*** -0.042*** -0.044***
(-1.98) (-1.49) (-1.26) (-1.83) (-10.53) (-11.83) (-9.82) (-10.38)
𝐿𝐸𝑉!" 0.083* 0.117*** 0.091** 0.086* -0.093*** -0.072** -0.087*** -0.091***
(1.87) (2.64) (2.05) (1.95) (-3.19) (-2.46) (-2.98) (-3.11)
𝑅𝑂𝐴!" 0.195*** 0.242*** 0.223*** 0.208*** 0.177*** 0.198*** 0.192*** 0.184*** (3.13) (3.90) (3.58) (3.35) (4.01) (4.51) (4.36) (4.18)
𝐼𝑆𝑆𝑈𝐸!" -0.022 -0.006 -0.013 -0.017 0.167*** 0.174*** 0.172*** 0.169***
(-0.80) (-0.22) (-0.47) (-0.63) (11.19) (11.65) (11.50) (11.34)
𝑀𝐸𝐸𝑇!" 0.056*** 0.062*** 0.059*** 0.057*** 0.042*** 0.045*** 0.044*** 0.043***
(3.92) (4.31) (4.12) (4.01) (5.28) (5.59) (5.49) (5.37) 𝐿𝑂𝑆𝑆!" 0.232*** 0.258*** 0.252*** 0.242*** 0.272*** 0.284*** 0.283*** 0.278***
35
(6.30) (7.06) (6.89) (6.61) (12.99) (13.62) (13.55) (13.28)
Constant 2.568*** 2.385*** 2.608*** 2.913*** 1.380*** 1.362*** 1.372*** 1.539***
(20.29) (17.67) (19.04) (20.83) (15.74) (15.48) (15.19) (16.69) Industry Fixed Effects
Yes Yes Yes Yes Yes Yes Yes Yes
Year Fixed Effects
Yes Yes Yes Yes Yes Yes Yes Yes
Number of Observations
74606 74606 74606 74606 74606 74606 74606 74606
Adj. / Pseudo R-squared
0.128 0.126 0.127 0.128 0.206 0.205 0.205 0.205
Panel A of this table presents the multivariate regression results of the effects of various language FTR measures on the magnitude of accrual-based and real earnings management. The t-statistics, shown in parentheses, are based on robust standard errors clustered at the firm level. *, **, and *** denote statistical significance at the 0.10, 0.05, and 0.01 level, respectively.
36
Table 5 Multivariate Regressions – Test of Hypothesis 1
Panel B
𝐿𝐴!" 𝐿𝐴!" 𝐿𝐴!" 𝐿𝐴!" 𝑆𝑃𝐸𝑆!" 𝑆𝑃𝐸𝑆!" 𝑆𝑃𝐸𝑆!" 𝑆𝑃𝐸𝑆!" (1) (2) (3) (4) (5) (6) (7) (8)
𝑠𝑡𝑟𝑜𝑛𝑔𝐹𝑇𝑅!" 0.730***
0.741***
(3.73)
(8.28)
𝑆𝑅!" 0.056*** 0.056***
(6.96) (11.61)
𝑉𝑅!" 0.830*** 1.080***
(3.11) (9.39)
𝑝𝑐𝐹𝑇𝑅!" 0.271*** 0.256*** (4.32) (9.38)
𝐼𝑁𝑉𝑃𝑅𝑂!" -0.276*** -0.240*** -0.287*** -0.314*** -0.289*** -0.229*** -0.329*** -0.315***
(-4.88) (-4.45) (-4.71) (-5.29) (-13.04) (-11.57) (-14.03) (-13.86)
𝑃𝐷!" -0.004 -0.023*** -0.003 -0.009 -0.035*** -0.027*** -0.037*** -0.037***
(-0.43) (-2.66) (-0.31) (-1.06) (-6.78) (-6.32) (-7.35) (-7.53)
𝐼𝑁𝐷𝐼𝑉!" -0.015** -0.033*** -0.016** -0.018*** -0.032*** -0.030*** -0.034*** -0.034*** (-2.41) (-4.34) (-2.44) (-2.89) (-9.19) (-9.09) (-9.94) (-9.95)
𝑀𝐴𝑆!" -0.011*** 0.008* -0.010** -0.011*** 0.009*** 0.015*** 0.009*** 0.009***
(-2.67) (1.76) (-2.51) (-2.58) (4.03) (7.26) (4.36) (4.17)
𝑈𝐴!" -0.011*** -0.021*** -0.011*** -0.012*** -0.023*** -0.026*** -0.023*** -0.023***
(-3.35) (-5.63) (-3.09) (-3.51) (-13.91) (-15.54) (-13.79) (-14.02)
𝐿𝑇𝑂!" -0.012** -0.026*** -0.014*** -0.012** -0.035*** -0.042*** -0.035*** -0.035*** (-2.57) (-4.93) (-3.02) (-2.55) (-15.52) (-19.02) (-16.29) (-15.67)
𝐼𝑁𝐷𝑈𝐿!" -0.011 -0.005 -0.011 -0.013** -0.015*** -0.006* -0.017*** -0.017***
(-1.63) (-0.63) (-1.58) (-1.97) (-4.72) (-1.87) (-5.40) (-5.28)
𝐺𝐺𝑅𝑂𝑊𝑇𝐻!" -0.052** -0.053* -0.054** -0.051** 0.039*** 0.043*** 0.033*** 0.036***
(-2.25) (-1.93) (-2.35) (-2.23) (3.62) (3.93) (3.15) (3.39)
𝑆𝐼𝑍𝐸!" -0.400*** -0.436*** -0.397*** -0.396*** -0.053*** -0.062*** -0.048*** -0.050*** (-11.72) (-13.14) (-11.60) (-11.58) (-4.68) (-5.50) (-4.23) (-4.42)
𝐵𝑇𝑀!" 0.280*** 0.187*** 0.284*** 0.275*** -0.076*** -0.108*** -0.078*** -0.078***
(8.94) (5.29) (8.94) (8.84) (-2.71) (-4.26) (-2.78) (-2.80)
𝐿𝐸𝑉!" 0.617** 0.925*** 0.605** 0.605** -0.652*** -0.591*** -0.675*** -0.666***
(2.46) (3.99) (2.41) (2.40) (-6.95) (-6.35) (-7.18) (-7.09)
𝑅𝑂𝐴!" 0.557*** 0.693*** 0.558*** 0.548*** 1.039*** 1.088*** 1.056*** 1.042*** (3.09) (4.02) (3.10) (3.04) (7.73) (8.16) (7.86) (7.76)
𝐼𝑆𝑆𝑈𝐸!" 0.111 0.175 0.119 0.102 0.319*** 0.340*** 0.319*** 0.316***
(0.72) (1.04) (0.77) (0.66) (5.67) (5.90) (5.66) (5.62)
𝑀𝐸𝐸𝑇!" -0.266*** -0.267*** -0.265*** -0.269***
(-3.02) (-3.07) (-2.99) (-3.05)
𝐿𝑂𝑆𝑆!" -0.425*** -0.405*** -0.404*** -0.416***
37
(-8.03) (-7.64) (-7.64) (-7.88)
Constant 1.558 3.730*** 1.549 2.793** 5.158*** 4.505*** 5.541*** 6.165***
(1.33) (3.19) (1.28) (2.37) (8.71) (8.69) (9.31) (10.01) Industry Fixed Effects
Yes Yes Yes Yes Yes Yes Yes Yes
Year Fixed Effects
Yes Yes Yes Yes Yes Yes Yes Yes
Number of Observations
74375 74375 74375 74375 74559 74559 74559 74559
Adj. / Pseudo R-squared
0.093 0.103 0.092 0.094 0.094 0.096 0.095 0.095
Panel B of this table presents the multivariate regression results of the effects of various language FTR measures on the propensity of loss avoidance and reporting small positive earnings surprises. The t-statistics, shown in parentheses, are based on robust standard errors clustered at the firm level. *, **, and *** denote statistical significance at the 0.10, 0.05, and 0.01 level, respectively.
38
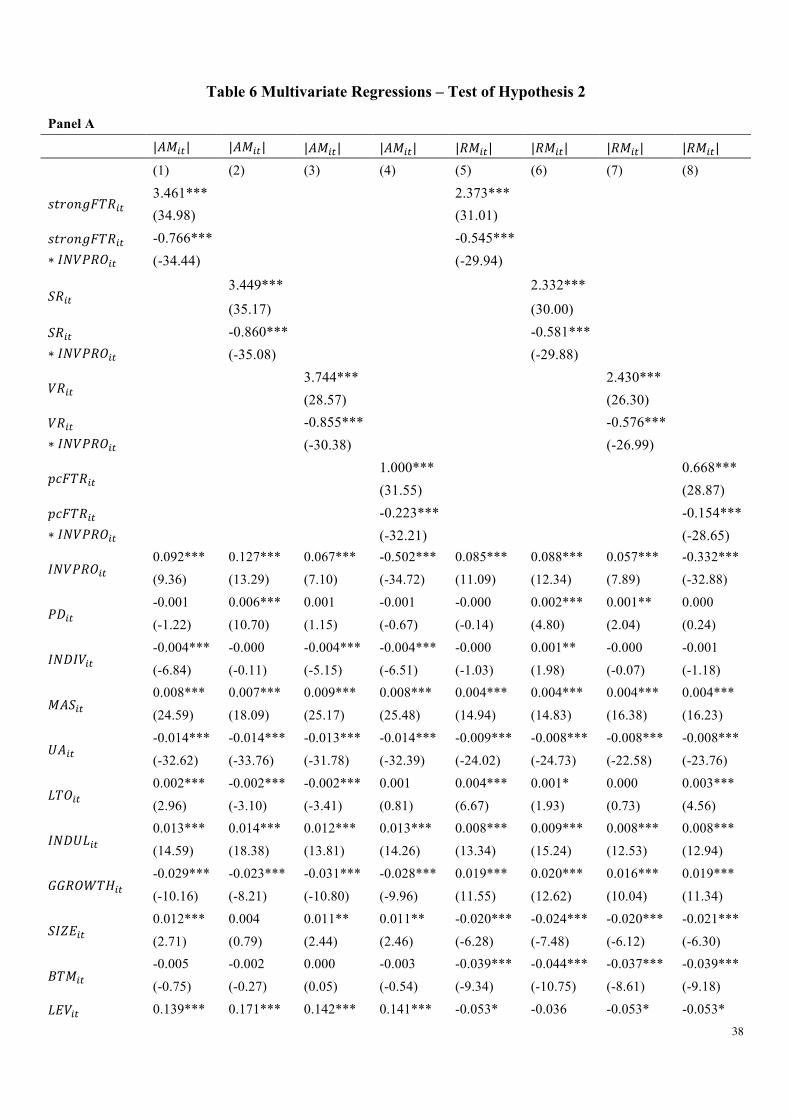
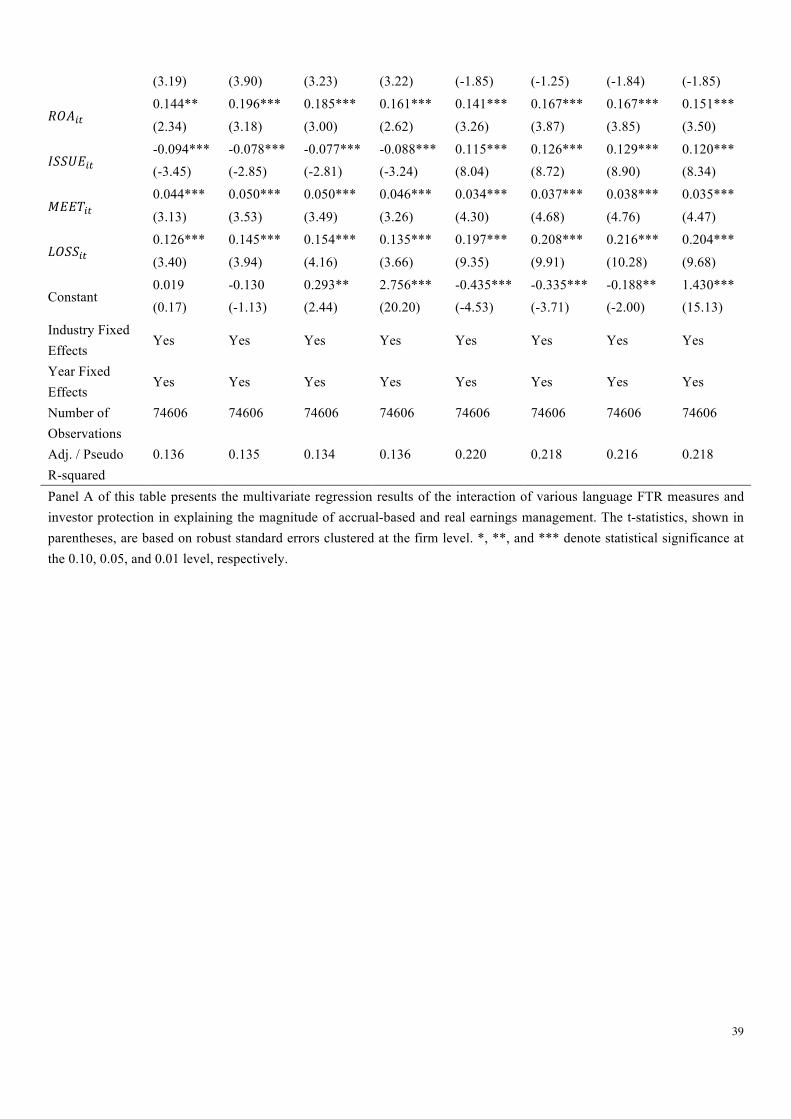
Table 6 Multivariate Regressions – Test of Hypothesis 2
Panel A
|𝐴𝑀!"| |𝐴𝑀!"| |𝐴𝑀!"| |𝐴𝑀!"| |𝑅𝑀!"| |𝑅𝑀!"| |𝑅𝑀!"| |𝑅𝑀!"| (1) (2) (3) (4) (5) (6) (7) (8)
𝑠𝑡𝑟𝑜𝑛𝑔𝐹𝑇𝑅!" 3.461***
2.373***
(34.98)
(31.01)
𝑠𝑡𝑟𝑜𝑛𝑔𝐹𝑇𝑅!"∗ 𝐼𝑁𝑉𝑃𝑅𝑂!"
-0.766*** -0.545***
(-34.44) (-29.94)
𝑆𝑅!" 3.449*** 2.332***
(35.17) (30.00)
𝑆𝑅!"∗ 𝐼𝑁𝑉𝑃𝑅𝑂!"
-0.860*** -0.581***
(-35.08) (-29.88)
𝑉𝑅!" 3.744*** 2.430***
(28.57) (26.30)
𝑉𝑅!"∗ 𝐼𝑁𝑉𝑃𝑅𝑂!"
-0.855*** -0.576***
(-30.38) (-26.99)
𝑝𝑐𝐹𝑇𝑅!" 1.000*** 0.668*** (31.55) (28.87)
𝑝𝑐𝐹𝑇𝑅!"∗ 𝐼𝑁𝑉𝑃𝑅𝑂!"
-0.223*** -0.154*** (-32.21) (-28.65)
𝐼𝑁𝑉𝑃𝑅𝑂!" 0.092*** 0.127*** 0.067*** -0.502*** 0.085*** 0.088*** 0.057*** -0.332***
(9.36) (13.29) (7.10) (-34.72) (11.09) (12.34) (7.89) (-32.88)
𝑃𝐷!" -0.001 0.006*** 0.001 -0.001 -0.000 0.002*** 0.001** 0.000
(-1.22) (10.70) (1.15) (-0.67) (-0.14) (4.80) (2.04) (0.24)
𝐼𝑁𝐷𝐼𝑉!" -0.004*** -0.000 -0.004*** -0.004*** -0.000 0.001** -0.000 -0.001
(-6.84) (-0.11) (-5.15) (-6.51) (-1.03) (1.98) (-0.07) (-1.18)
𝑀𝐴𝑆!" 0.008*** 0.007*** 0.009*** 0.008*** 0.004*** 0.004*** 0.004*** 0.004***
(24.59) (18.09) (25.17) (25.48) (14.94) (14.83) (16.38) (16.23)
𝑈𝐴!" -0.014*** -0.014*** -0.013*** -0.014*** -0.009*** -0.008*** -0.008*** -0.008***
(-32.62) (-33.76) (-31.78) (-32.39) (-24.02) (-24.73) (-22.58) (-23.76)
𝐿𝑇𝑂!" 0.002*** -0.002*** -0.002*** 0.001 0.004*** 0.001* 0.000 0.003***
(2.96) (-3.10) (-3.41) (0.81) (6.67) (1.93) (0.73) (4.56)
𝐼𝑁𝐷𝑈𝐿!" 0.013*** 0.014*** 0.012*** 0.013*** 0.008*** 0.009*** 0.008*** 0.008***
(14.59) (18.38) (13.81) (14.26) (13.34) (15.24) (12.53) (12.94)
𝐺𝐺𝑅𝑂𝑊𝑇𝐻!" -0.029*** -0.023*** -0.031*** -0.028*** 0.019*** 0.020*** 0.016*** 0.019***
(-10.16) (-8.21) (-10.80) (-9.96) (11.55) (12.62) (10.04) (11.34)
𝑆𝐼𝑍𝐸!" 0.012*** 0.004 0.011** 0.011** -0.020*** -0.024*** -0.020*** -0.021***
(2.71) (0.79) (2.44) (2.46) (-6.28) (-7.48) (-6.12) (-6.30)
𝐵𝑇𝑀!" -0.005 -0.002 0.000 -0.003 -0.039*** -0.044*** -0.037*** -0.039***
(-0.75) (-0.27) (0.05) (-0.54) (-9.34) (-10.75) (-8.61) (-9.18)
𝐿𝐸𝑉!" 0.139*** 0.171*** 0.142*** 0.141*** -0.053* -0.036 -0.053* -0.053*
39
(3.19) (3.90) (3.23) (3.22) (-1.85) (-1.25) (-1.84) (-1.85)
𝑅𝑂𝐴!" 0.144** 0.196*** 0.185*** 0.161*** 0.141*** 0.167*** 0.167*** 0.151***
(2.34) (3.18) (3.00) (2.62) (3.26) (3.87) (3.85) (3.50)
𝐼𝑆𝑆𝑈𝐸!" -0.094*** -0.078*** -0.077*** -0.088*** 0.115*** 0.126*** 0.129*** 0.120*** (-3.45) (-2.85) (-2.81) (-3.24) (8.04) (8.72) (8.90) (8.34)
𝑀𝐸𝐸𝑇!" 0.044*** 0.050*** 0.050*** 0.046*** 0.034*** 0.037*** 0.038*** 0.035***
(3.13) (3.53) (3.49) (3.26) (4.30) (4.68) (4.76) (4.47)
𝐿𝑂𝑆𝑆!" 0.126*** 0.145*** 0.154*** 0.135*** 0.197*** 0.208*** 0.216*** 0.204***
(3.40) (3.94) (4.16) (3.66) (9.35) (9.91) (10.28) (9.68)
Constant 0.019 -0.130 0.293** 2.756*** -0.435*** -0.335*** -0.188** 1.430*** (0.17) (-1.13) (2.44) (20.20) (-4.53) (-3.71) (-2.00) (15.13)
Industry Fixed Effects
Yes Yes Yes Yes Yes Yes Yes Yes
Year Fixed Effects
Yes Yes Yes Yes Yes Yes Yes Yes
Number of Observations
74606 74606 74606 74606 74606 74606 74606 74606
Adj. / Pseudo R-squared
0.136 0.135 0.134 0.136 0.220 0.218 0.216 0.218
Panel A of this table presents the multivariate regression results of the interaction of various language FTR measures and investor protection in explaining the magnitude of accrual-based and real earnings management. The t-statistics, shown in parentheses, are based on robust standard errors clustered at the firm level. *, **, and *** denote statistical significance at the 0.10, 0.05, and 0.01 level, respectively.
40
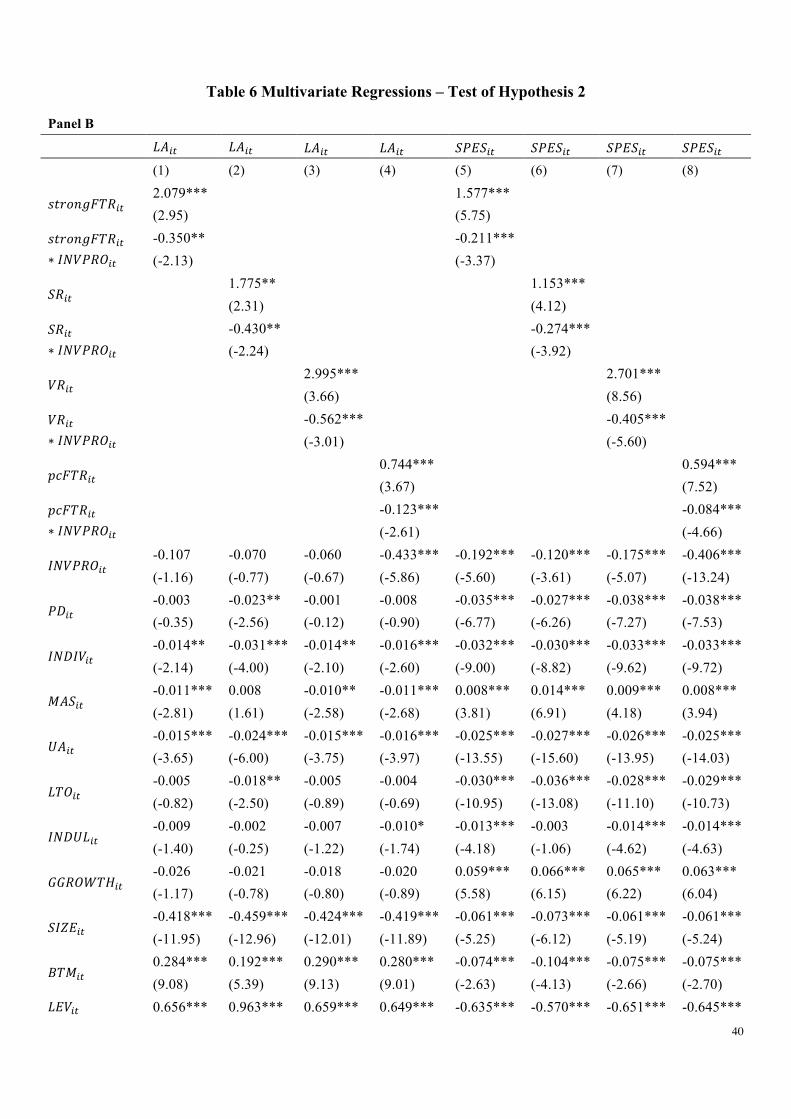
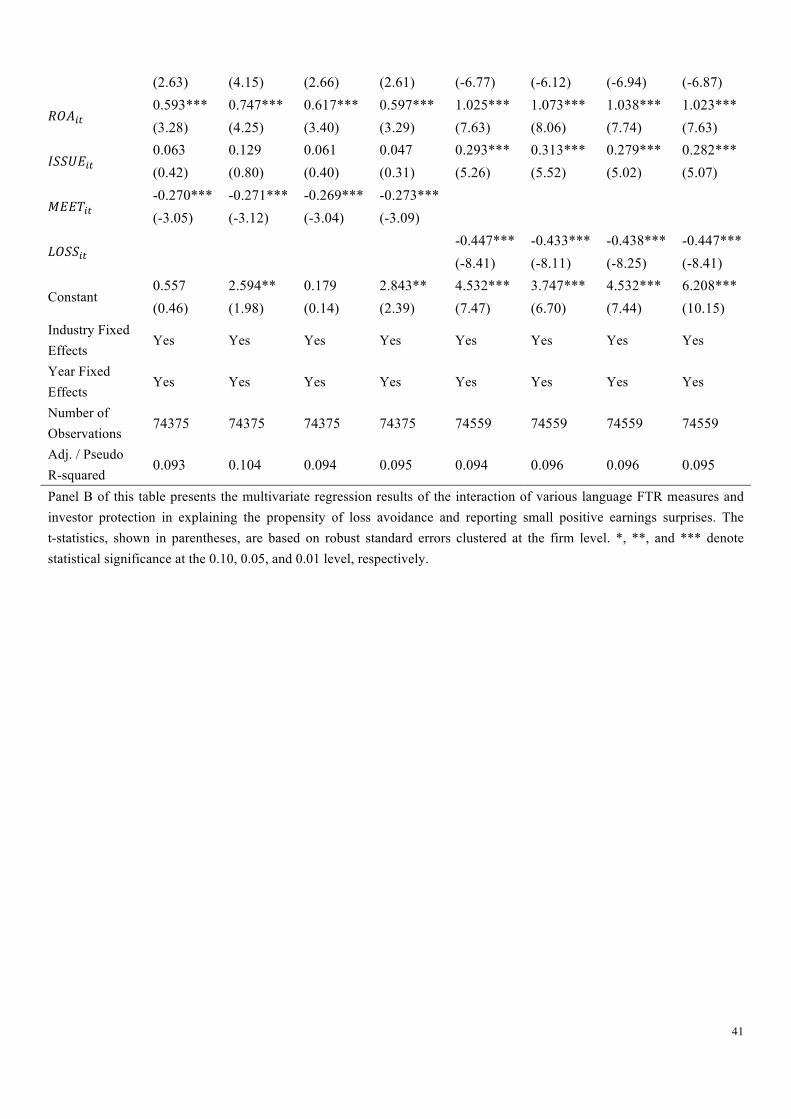
Table 6 Multivariate Regressions – Test of Hypothesis 2
Panel B
𝐿𝐴!" 𝐿𝐴!" 𝐿𝐴!" 𝐿𝐴!" 𝑆𝑃𝐸𝑆!" 𝑆𝑃𝐸𝑆!" 𝑆𝑃𝐸𝑆!" 𝑆𝑃𝐸𝑆!" (1) (2) (3) (4) (5) (6) (7) (8)
𝑠𝑡𝑟𝑜𝑛𝑔𝐹𝑇𝑅!" 2.079***
1.577***
(2.95)
(5.75)
𝑠𝑡𝑟𝑜𝑛𝑔𝐹𝑇𝑅!"∗ 𝐼𝑁𝑉𝑃𝑅𝑂!"
-0.350** -0.211***
(-2.13) (-3.37)
𝑆𝑅!" 1.775** 1.153***
(2.31) (4.12)
𝑆𝑅!"∗ 𝐼𝑁𝑉𝑃𝑅𝑂!"
-0.430** -0.274*** (-2.24) (-3.92)
𝑉𝑅!" 2.995*** 2.701***
(3.66) (8.56)
𝑉𝑅!"∗ 𝐼𝑁𝑉𝑃𝑅𝑂!"
-0.562*** -0.405***
(-3.01) (-5.60)
𝑝𝑐𝐹𝑇𝑅!" 0.744*** 0.594*** (3.67) (7.52)
𝑝𝑐𝐹𝑇𝑅!"∗ 𝐼𝑁𝑉𝑃𝑅𝑂!"
-0.123*** -0.084*** (-2.61) (-4.66)
𝐼𝑁𝑉𝑃𝑅𝑂!" -0.107 -0.070 -0.060 -0.433*** -0.192*** -0.120*** -0.175*** -0.406***
(-1.16) (-0.77) (-0.67) (-5.86) (-5.60) (-3.61) (-5.07) (-13.24)
𝑃𝐷!" -0.003 -0.023** -0.001 -0.008 -0.035*** -0.027*** -0.038*** -0.038*** (-0.35) (-2.56) (-0.12) (-0.90) (-6.77) (-6.26) (-7.27) (-7.53)
𝐼𝑁𝐷𝐼𝑉!" -0.014** -0.031*** -0.014** -0.016*** -0.032*** -0.030*** -0.033*** -0.033***
(-2.14) (-4.00) (-2.10) (-2.60) (-9.00) (-8.82) (-9.62) (-9.72)
𝑀𝐴𝑆!" -0.011*** 0.008 -0.010** -0.011*** 0.008*** 0.014*** 0.009*** 0.008***
(-2.81) (1.61) (-2.58) (-2.68) (3.81) (6.91) (4.18) (3.94)
𝑈𝐴!" -0.015*** -0.024*** -0.015*** -0.016*** -0.025*** -0.027*** -0.026*** -0.025*** (-3.65) (-6.00) (-3.75) (-3.97) (-13.55) (-15.60) (-13.95) (-14.03)
𝐿𝑇𝑂!" -0.005 -0.018** -0.005 -0.004 -0.030*** -0.036*** -0.028*** -0.029***
(-0.82) (-2.50) (-0.89) (-0.69) (-10.95) (-13.08) (-11.10) (-10.73)
𝐼𝑁𝐷𝑈𝐿!" -0.009 -0.002 -0.007 -0.010* -0.013*** -0.003 -0.014*** -0.014***
(-1.40) (-0.25) (-1.22) (-1.74) (-4.18) (-1.06) (-4.62) (-4.63)
𝐺𝐺𝑅𝑂𝑊𝑇𝐻!" -0.026 -0.021 -0.018 -0.020 0.059*** 0.066*** 0.065*** 0.063*** (-1.17) (-0.78) (-0.80) (-0.89) (5.58) (6.15) (6.22) (6.04)
𝑆𝐼𝑍𝐸!" -0.418*** -0.459*** -0.424*** -0.419*** -0.061*** -0.073*** -0.061*** -0.061***
(-11.95) (-12.96) (-12.01) (-11.89) (-5.25) (-6.12) (-5.19) (-5.24)
𝐵𝑇𝑀!" 0.284*** 0.192*** 0.290*** 0.280*** -0.074*** -0.104*** -0.075*** -0.075***
(9.08) (5.39) (9.13) (9.01) (-2.63) (-4.13) (-2.66) (-2.70) 𝐿𝐸𝑉!" 0.656*** 0.963*** 0.659*** 0.649*** -0.635*** -0.570*** -0.651*** -0.645***
41
(2.63) (4.15) (2.66) (2.61) (-6.77) (-6.12) (-6.94) (-6.87)
𝑅𝑂𝐴!" 0.593*** 0.747*** 0.617*** 0.597*** 1.025*** 1.073*** 1.038*** 1.023***
(3.28) (4.25) (3.40) (3.29) (7.63) (8.06) (7.74) (7.63)
𝐼𝑆𝑆𝑈𝐸!" 0.063 0.129 0.061 0.047 0.293*** 0.313*** 0.279*** 0.282***
(0.42) (0.80) (0.40) (0.31) (5.26) (5.52) (5.02) (5.07)
𝑀𝐸𝐸𝑇!" -0.270*** -0.271*** -0.269*** -0.273***
(-3.05) (-3.12) (-3.04) (-3.09)
𝐿𝑂𝑆𝑆!" -0.447*** -0.433*** -0.438*** -0.447***
(-8.41) (-8.11) (-8.25) (-8.41)
Constant 0.557 2.594** 0.179 2.843** 4.532*** 3.747*** 4.532*** 6.208***
(0.46) (1.98) (0.14) (2.39) (7.47) (6.70) (7.44) (10.15) Industry Fixed Effects
Yes Yes Yes Yes Yes Yes Yes Yes
Year Fixed Effects
Yes Yes Yes Yes Yes Yes Yes Yes
Number of Observations
74375 74375 74375 74375 74559 74559 74559 74559
Adj. / Pseudo R-squared
0.093 0.104 0.094 0.095 0.094 0.096 0.096 0.095
Panel B of this table presents the multivariate regression results of the interaction of various language FTR measures and investor protection in explaining the propensity of loss avoidance and reporting small positive earnings surprises. The t-statistics, shown in parentheses, are based on robust standard errors clustered at the firm level. *, **, and *** denote statistical significance at the 0.10, 0.05, and 0.01 level, respectively.
42
Table 7 Multivariate Regressions – Country Level Analysis
Panel A
|𝐴𝑀!"| |𝐴𝑀!"| |𝐴𝑀!"| |𝐴𝑀!"| |𝐴𝑀!"| |𝐴𝑀!"| |𝐴𝑀!"| |𝐴𝑀!"| (1) (2) (3) (4) (5) (6) (7) (8)
𝑠𝑡𝑟𝑜𝑛𝑔𝐹𝑇𝑅!" 0.048***
0.224***
(3.67)
(2.71)
𝑠𝑡𝑟𝑜𝑛𝑔𝐹𝑇𝑅!"∗ 𝐼𝑁𝑉𝑃𝑅𝑂!"
-0.045**
(-2.41)
𝑆𝑅!" 0.000 0.240**
(0.56) (2.46)
𝑆𝑅!"∗ 𝐼𝑁𝑉𝑃𝑅𝑂!"
-0.060**
(-2.46)
𝑉𝑅!" 0.036*** 0.222**
(2.69) (2.31)
𝑉𝑅!"∗ 𝐼𝑁𝑉𝑃𝑅𝑂!"
-0.049**
(-2.17)
𝑝𝑐𝐹𝑇𝑅!" 0.012*** 0.063** (3.24) (2.51)
𝑝𝑐𝐹𝑇𝑅!"∗ 𝐼𝑁𝑉𝑃𝑅𝑂!"
-0.013** (-2.30)
𝐼𝑁𝑉𝑃𝑅𝑂!" -0.020*** -0.014** -0.018** -0.019*** 0.001 0.009 0.001 -0.033***
(-2.72) (-2.20) (-2.58) (-2.67) (0.15) (0.97) (0.11) (-2.92)
𝑃𝐷!" 0.001 0.001*** 0.001* 0.001 0.000 0.001** 0.001* 0.000
(1.49) (2.62) (1.83) (1.59) (1.10) (2.17) (1.69) (1.27)
𝐼𝑁𝐷𝐼𝑉!" 0.001** 0.001** 0.001** 0.001** 0.001* 0.001** 0.001** 0.001**
(1.98) (2.31) (2.12) (2.02) (1.92) (2.32) (2.19) (2.03)
𝑀𝐴𝑆!" 0.000 0.000 0.000 0.000 0.000 0.000 0.000 0.000
(1.00) (1.26) (1.14) (1.10) (0.80) (1.13) (1.08) (0.95)
𝑈𝐴!" -0.001*** -0.001*** -0.001*** -0.001*** -0.001*** -0.001*** -0.001*** -0.001***
(-3.01) (-2.62) (-2.74) (-2.89) (-3.32) (-3.10) (-3.07) (-3.21)
𝐿𝑇𝑂!" -0.000 -0.001** -0.001* -0.001 0.000 -0.000 -0.000 0.000
(-1.12) (-2.18) (-1.68) (-1.42) (0.50) (-0.78) (-0.65) (0.06)
𝐼𝑁𝐷𝑈𝐿!" 0.001 0.000 0.001 0.001 0.001** 0.001* 0.001* 0.001**
(1.41) (1.18) (1.23) (1.33) (2.18) (1.91) (1.79) (2.03)
𝐺𝐺𝑅𝑂𝑊𝑇𝐻!" -0.001 0.000 0.000 -0.000 0.002 0.004 0.003 0.003
(-0.21) (0.01) (0.01) (-0.09) (0.78) (1.23) (1.00) (0.97)
Constant 0.129*** 0.100* 0.108** 0.144*** 0.002 -0.029 0.010 0.151***
(2.83) (1.85) (2.31) (2.89) (0.03) (-0.41) (0.17) (2.83) Industry Fixed Effects
Yes Yes Yes Yes Yes Yes Yes Yes
Year Fixed Yes Yes Yes Yes Yes Yes Yes Yes

43
Effects
Number of Observations
364 364 364 364 364 364 364 364
Adj. / Pseudo R-squared
0.071 0.053 0.060 0.065 0.084 0.073 0.071 0.078
Panel A of this table presents the multivariate regression results on accrual-based earnings management at the country-year level. The t-statistics, shown in parentheses, are based on White (1980) robust standard errors. *, **, and *** denote statistical significance at the 0.10, 0.05, and 0.01 level, respectively.
44
Table 7 Multivariate Regressions – Country Level Analysis
Panel B
|𝑅𝑀!"| |𝑅𝑀!"| |𝑅𝑀!"| |𝑅𝑀!"| |𝑅𝑀!"| |𝑅𝑀!"| |𝑅𝑀!"| |𝑅𝑀!"| (1) (2) (3) (4) (5) (6) (7) (8)
𝑠𝑡𝑟𝑜𝑛𝑔𝐹𝑇𝑅!" 0.053***
0.280***
(3.01)
(2.93)
𝑠𝑡𝑟𝑜𝑛𝑔𝐹𝑇𝑅!"∗ 𝐼𝑁𝑉𝑃𝑅𝑂!"
-0.058***
(-2.74)
𝑆𝑅!" 0.001** 0.239**
(2.42) (2.19)
𝑆𝑅!"∗ 𝐼𝑁𝑉𝑃𝑅𝑂!"
-0.060**
(-2.18)
𝑉𝑅!" 0.026 0.204*
(1.39) (1.88)
𝑉𝑅!"∗ 𝐼𝑁𝑉𝑃𝑅𝑂!"
-0.047*
(-1.85)
𝑝𝑐𝐹𝑇𝑅!" 0.011** 0.069** (2.31) (2.37)
𝑝𝑐𝐹𝑇𝑅!"∗ 𝐼𝑁𝑉𝑃𝑅𝑂!"
-0.015** (-2.26)
𝐼𝑁𝑉𝑃𝑅𝑂!" -0.011 -0.005 -0.007 -0.009 0.017** 0.018** 0.011* -0.025*
(-1.43) (-0.73) (-0.96) (-1.24) (2.51) (2.26) (1.65) (-1.80)
𝑃𝐷!" 0.000 0.001 0.000 0.000 -0.000 0.000 0.000 0.000
(0.34) (1.35) (0.99) (0.60) (-0.01) (1.00) (0.89) (0.34)
𝐼𝑁𝐷𝐼𝑉!" 0.002*** 0.002*** 0.002*** 0.002*** 0.002*** 0.002*** 0.002*** 0.002***
(4.75) (5.04) (5.05) (4.86) (4.54) (4.81) (4.84) (4.66)
𝑀𝐴𝑆!" 0.001*** 0.001*** 0.001*** 0.001*** 0.001*** 0.001*** 0.001*** 0.001***
(3.01) (3.19) (3.14) (3.09) (2.89) (3.22) (3.16) (3.06)
𝑈𝐴!" -0.001*** -0.001*** -0.001*** -0.001*** -0.001*** -0.001*** -0.001*** -0.001***
(-3.79) (-3.40) (-3.43) (-3.61) (-3.98) (-3.62) (-3.49) (-3.72)
𝐿𝑇𝑂!" -0.001 -0.001*** -0.001** -0.001* 0.000 -0.001 -0.001 -0.000
(-1.54) (-2.61) (-2.29) (-1.93) (0.43) (-1.45) (-1.43) (-0.40)
𝐼𝑁𝐷𝑈𝐿!" 0.001 0.001 0.001 0.001 0.001** 0.001* 0.001* 0.001**
(1.49) (1.34) (1.28) (1.39) (2.26) (1.88) (1.69) (2.00)
𝐺𝐺𝑅𝑂𝑊𝑇𝐻!" -0.001 0.000 0.000 -0.000 0.003 0.004 0.003 0.003
(-0.19) (0.03) (0.03) (-0.05) (1.02) (1.22) (0.97) (1.08)
Constant 0.196*** 0.196*** 0.192*** 0.230*** 0.033 0.047 0.078 0.238***
(2.77) (2.89) (2.91) (3.25) (0.44) (0.61) (1.08) (3.10) Industry Fixed Effects
Yes Yes Yes Yes Yes Yes Yes Yes
Year Fixed Yes Yes Yes Yes Yes Yes Yes Yes

45
Effects
Number of Observations
364 364 364 364 364 364 364 364
Adj. / Pseudo R-squared
0.186 0.172 0.173 0.179 0.202 0.186 0.179 0.190
Panel B of this table presents the multivariate regression results on real earnings management at the country-year level. The t-statistics, shown in parentheses, are based on White (1980) robust standard errors. *, **, and *** denote statistical significance at the 0.10, 0.05, and 0.01 level, respectively.
46
Table 7 Multivariate Regressions – Country Level Analysis
Panel C
𝐿𝐴!" 𝐿𝐴!" 𝐿𝐴!" 𝐿𝐴!" 𝐿𝐴!" 𝐿𝐴!" 𝐿𝐴!" 𝐿𝐴!" (1) (2) (3) (4) (5) (6) (7) (8)
𝑠𝑡𝑟𝑜𝑛𝑔𝐹𝑇𝑅!" 1.262***
6.870***
(3.16)
(3.90)
𝑠𝑡𝑟𝑜𝑛𝑔𝐹𝑇𝑅!"∗ 𝐼𝑁𝑉𝑃𝑅𝑂!"
-1.411***
(-3.46)
𝑆𝑅!" 1.119** 7.633***
(2.47) (3.76)
𝑆𝑅!"∗ 𝐼𝑁𝑉𝑃𝑅𝑂!"
-1.669***
(-3.56)
𝑉𝑅!" 1.137** 7.527***
(2.47) (3.69)
𝑉𝑅!"∗ 𝐼𝑁𝑉𝑃𝑅𝑂!"
-1.650***
(-3.46)
𝑝𝑐𝐹𝑇𝑅!" 0.353*** 2.169*** (2.98) (3.82)
𝑝𝑐𝐹𝑇𝑅!"∗ 𝐼𝑁𝑉𝑃𝑅𝑂!"
-0.457*** (-3.53)
𝐼𝑁𝑉𝑃𝑅𝑂!" -0.392** -0.427*** -0.370** -0.403** 0.226 0.186 0.210 -0.952***
(-2.48) (-2.65) (-2.32) (-2.48) (1.15) (0.97) (1.12) (-3.55)
𝑃𝐷!" 0.017 0.015 0.021* 0.017 0.015 0.015 0.021* 0.015
(1.53) (1.36) (1.82) (1.47) (1.43) (1.30) (1.87) (1.34)
𝐼𝑁𝐷𝐼𝑉!" 0.043*** 0.040*** 0.044*** 0.042*** 0.043*** 0.044*** 0.048*** 0.045***
(3.40) (3.23) (3.54) (3.41) (3.65) (3.54) (3.90) (3.71)
𝑀𝐴𝑆!" 0.014** 0.021*** 0.016** 0.015** 0.013* 0.021*** 0.016** 0.015**
(2.16) (3.08) (2.54) (2.34) (1.94) (3.05) (2.49) (2.16)
𝑈𝐴!" -0.053*** -0.053*** -0.050*** -0.052*** -0.063*** -0.063*** -0.058*** -0.063***
(-6.20) (-6.22) (-6.06) (-6.14) (-6.58) (-6.33) (-6.29) (-6.17)
𝐿𝑇𝑂!" 0.013 0.007 0.008 0.012 0.033*** 0.023** 0.023** 0.032***
(1.49) (0.79) (0.99) (1.34) (2.89) (2.12) (2.20) (2.72)
𝐼𝑁𝐷𝑈𝐿!" -0.041*** -0.039*** -0.042*** -0.042*** -0.027* -0.030** -0.035** -0.031**
(-2.74) (-2.70) (-2.87) (-2.78) (-1.88) (-2.09) (-2.38) (-2.10)
𝐺𝐺𝑅𝑂𝑊𝑇𝐻!" -0.135** -0.137** -0.127* -0.131** -0.047 -0.027 -0.024 -0.023
(-2.08) (-2.09) (-1.93) (-2.00) (-0.68) (-0.37) (-0.33) (-0.32)
Constant 1.621 2.033 1.486 2.656* -1.843 -1.258 -1.571 3.864**
(1.16) (1.49) (1.09) (1.77) (-1.10) (-0.80) (-1.02) (2.26) Industry Fixed Effects
Yes Yes Yes Yes Yes Yes Yes Yes
Year Fixed Yes Yes Yes Yes Yes Yes Yes Yes
47
Effects
Number of Observations
357 357 357 357 357 357 357 357
Adj. / Pseudo R-squared
0.238 0.251 0.229 0.237 0.267 0.283 0.258 0.270
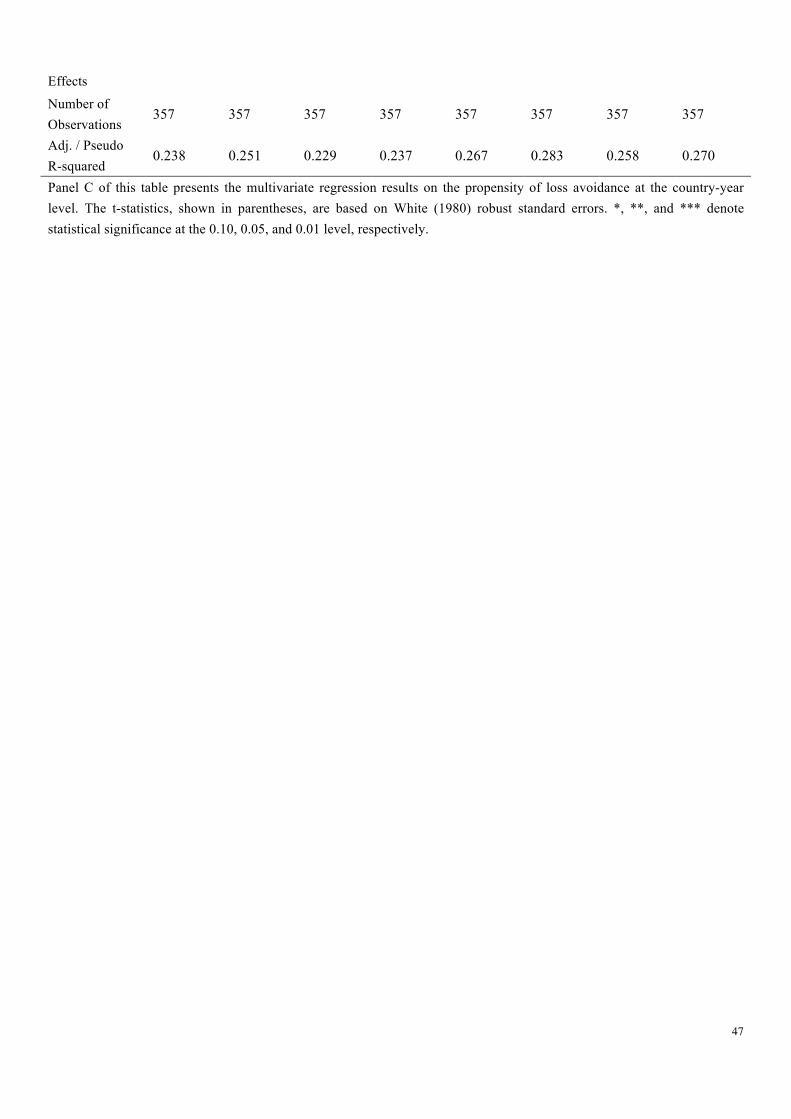
Panel C of this table presents the multivariate regression results on the propensity of loss avoidance at the country-year level. The t-statistics, shown in parentheses, are based on White (1980) robust standard errors. *, **, and *** denote statistical significance at the 0.10, 0.05, and 0.01 level, respectively.
48
Table 7 Multivariate Regressions – Country Level Analysis
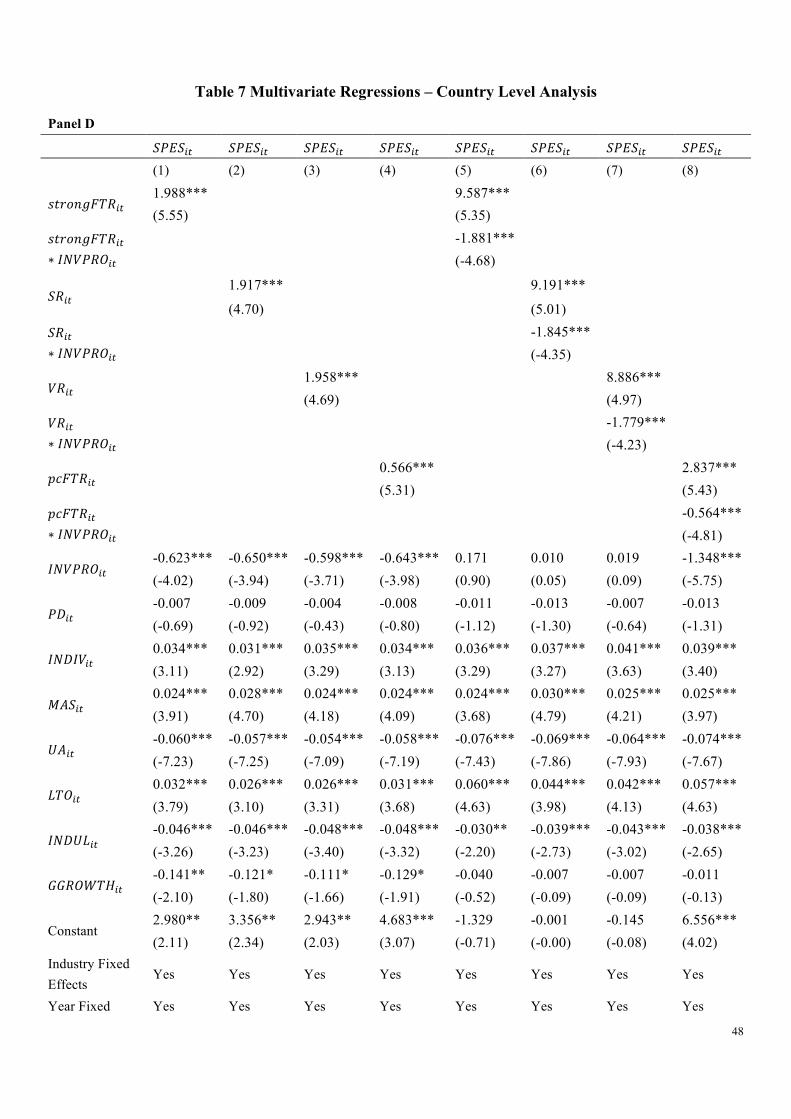
Panel D
𝑆𝑃𝐸𝑆!" 𝑆𝑃𝐸𝑆!" 𝑆𝑃𝐸𝑆!" 𝑆𝑃𝐸𝑆!" 𝑆𝑃𝐸𝑆!" 𝑆𝑃𝐸𝑆!" 𝑆𝑃𝐸𝑆!" 𝑆𝑃𝐸𝑆!" (1) (2) (3) (4) (5) (6) (7) (8)
𝑠𝑡𝑟𝑜𝑛𝑔𝐹𝑇𝑅!" 1.988***
9.587***
(5.55)
(5.35)
𝑠𝑡𝑟𝑜𝑛𝑔𝐹𝑇𝑅!"∗ 𝐼𝑁𝑉𝑃𝑅𝑂!"
-1.881***
(-4.68)
𝑆𝑅!" 1.917*** 9.191***
(4.70) (5.01)
𝑆𝑅!"∗ 𝐼𝑁𝑉𝑃𝑅𝑂!"
-1.845***
(-4.35)
𝑉𝑅!" 1.958*** 8.886***
(4.69) (4.97)
𝑉𝑅!"∗ 𝐼𝑁𝑉𝑃𝑅𝑂!"
-1.779***
(-4.23)
𝑝𝑐𝐹𝑇𝑅!" 0.566*** 2.837*** (5.31) (5.43)
𝑝𝑐𝐹𝑇𝑅!"∗ 𝐼𝑁𝑉𝑃𝑅𝑂!"
-0.564*** (-4.81)
𝐼𝑁𝑉𝑃𝑅𝑂!" -0.623*** -0.650*** -0.598*** -0.643*** 0.171 0.010 0.019 -1.348***
(-4.02) (-3.94) (-3.71) (-3.98) (0.90) (0.05) (0.09) (-5.75)
𝑃𝐷!" -0.007 -0.009 -0.004 -0.008 -0.011 -0.013 -0.007 -0.013
(-0.69) (-0.92) (-0.43) (-0.80) (-1.12) (-1.30) (-0.64) (-1.31)
𝐼𝑁𝐷𝐼𝑉!" 0.034*** 0.031*** 0.035*** 0.034*** 0.036*** 0.037*** 0.041*** 0.039***
(3.11) (2.92) (3.29) (3.13) (3.29) (3.27) (3.63) (3.40)
𝑀𝐴𝑆!" 0.024*** 0.028*** 0.024*** 0.024*** 0.024*** 0.030*** 0.025*** 0.025***
(3.91) (4.70) (4.18) (4.09) (3.68) (4.79) (4.21) (3.97)
𝑈𝐴!" -0.060*** -0.057*** -0.054*** -0.058*** -0.076*** -0.069*** -0.064*** -0.074***
(-7.23) (-7.25) (-7.09) (-7.19) (-7.43) (-7.86) (-7.93) (-7.67)
𝐿𝑇𝑂!" 0.032*** 0.026*** 0.026*** 0.031*** 0.060*** 0.044*** 0.042*** 0.057***
(3.79) (3.10) (3.31) (3.68) (4.63) (3.98) (4.13) (4.63)
𝐼𝑁𝐷𝑈𝐿!" -0.046*** -0.046*** -0.048*** -0.048*** -0.030** -0.039*** -0.043*** -0.038***
(-3.26) (-3.23) (-3.40) (-3.32) (-2.20) (-2.73) (-3.02) (-2.65)
𝐺𝐺𝑅𝑂𝑊𝑇𝐻!" -0.141** -0.121* -0.111* -0.129* -0.040 -0.007 -0.007 -0.011
(-2.10) (-1.80) (-1.66) (-1.91) (-0.52) (-0.09) (-0.09) (-0.13)
Constant 2.980** 3.356** 2.943** 4.683*** -1.329 -0.001 -0.145 6.556***
(2.11) (2.34) (2.03) (3.07) (-0.71) (-0.00) (-0.08) (4.02) Industry Fixed Effects
Yes Yes Yes Yes Yes Yes Yes Yes
Year Fixed Yes Yes Yes Yes Yes Yes Yes Yes
49
Effects
Number of Observations
362 362 362 362 362 362 362 362
Adj. / Pseudo R-squared
0.249 0.255 0.232 0.246 0.294 0.291 0.264 0.292
Panel D of this table presents the multivariate regression results on the propensity of reporting small positive earnings surprises at the country-year level. The t-statistics, shown in parentheses, are based on White (1980) robust standard errors. *, **, and *** denote statistical significance at the 0.10, 0.05, and 0.01 level, respectively.