Embed Size (px)
Citation preview
Language: English Original: English
PROJECT: Monduli District Water Supply and Sanitation Project COUNTRY: Tanzania
PROJECT COMPLETION REPORT Date: October 2009
Project Completion Team
Team Leader: Team Members: Sector Manager: ResRep Sector Director: Regional Director:
Paul Dzimiri Amel Hamza Sabas Marandu Sering B. Jallow Sipho Moyo Sering B. Jallow (OIC) Diarietou Gaye
Senior Fin. Analyst, OWAS2 Senior Gender Spec, OWAS2 Water & San. Eng., TZFO OWAS.2 TZFO OWAS & AWF OREA
Peer Reviewers
Mumina Wa-Kyendo, Principal Transport Engineer, OINF.2 Yeshiareg Dejene, Senior Gender Specialist, OSUS Amilcar Bilale, Senior Architect, OSHD
ii
TABLE OF CONTENTS
TABLE OF CONTENTS.......................................................................................................................... II
CURRENCY EQUIVALENTS.................................................................................................................. 1
FISCAL YEAR......................................................................................................................................... 1
WEIGHTS AND MEASURES.................................................................................................................. 1
ACRONYMS AND ABBREVIATIONS .................................................................................................... 1
A. PROJECT DATA AND KEY DATES.............................................................................................. 2
I. BASIC INFORMATION .............................................................................................................. 2 II. KEY DATES ............................................................................................................................... 2 III. RATINGS SUMMARY ................................................................................................................ 3 IV. RESPONSIBLE BANK STAFF.................................................................................................. 3
B. PROJECT CONTEXT..................................................................................................................... 4
C. PROJECT OBJECTIVES AND LOGICAL FRAMEWORK (LOG FRAME).................................... 5
D. OUTPUTS AND OUTCOMES ........................................................................................................ 8
V. ACHIEVEMENT OF OUTPUTS .................................................................................................. 8 VI. ACHIEVEMENT OFOUTCOMES ............................................................................................... 9
E. PROJECT DESIGN AND READINESS FOR IMPLEMENTATION .............................................. 11
F. IMPLEMENTATION...................................................................................................................... 14
F.1 KEY CHARACTERISTICS OF PROGRAMME IMPLEMENTATION ........................................................ 14
G. COMPLETION.............................................................................................................................. 17
H. SELECTED LESSONS LEARNT ................................................................................................. 18
I. PROJECT RATINGS SUMMARY ................................................................................................ 20
J. ROCESSING ................................................................................................................................ 22
1
Currency Equivalents
October 2009
UA 1.00 = TZS 2033.95 UA 1.00 = USD 1.62069 UA 1.00 = EURO 1.04507
Fiscal Year
1 July – 30 June
Weights and Measures
1metric tonne = 2204 pounds (lbs) 1 kilogramme (kg) = 2.200 lbs 1 metre (m) = 3.28 feet (ft) 1 millimetre (mm) = 0.03937 inch (“) 1 kilometre (km) = 0.62 mile 1 hectare (ha) = 2.471 acres
Acronyms and Abbreviations
ADB = African Development Bank PT = Project Taskforce ADF = African Development Fund RWSSI = Rural Water Supply and
Sanitation Initiative EIRR = Economic Internal Rate of
Return UFW = Unaccounted for Water
ESMP = Environmental and Social Management Plan
WACC = Weighted Average Cost of Capital
FIRR = Financial Internal Rate of Return
WUAs = Water User Associations
GOT = Government of the United Republic of Tanzania
MOHSW = Ministry of Health and Social Welfare
ICB = International Competitive Bidding
NCB = National Competitive Bidding
PIT = Project Implementation Team
JAST = Joint Assistance Strategy Tanzania
MKUKUTA = Mkakati wa Kukuza Uchumi
na Kupunguza Umasikini Tanzania /(National Strategy for Growth and Reduction of Poverty for Tanzania)
MOEVT = Ministry of Education and Vocational Training
2
A. PROJECT DATA AND KEY DATES
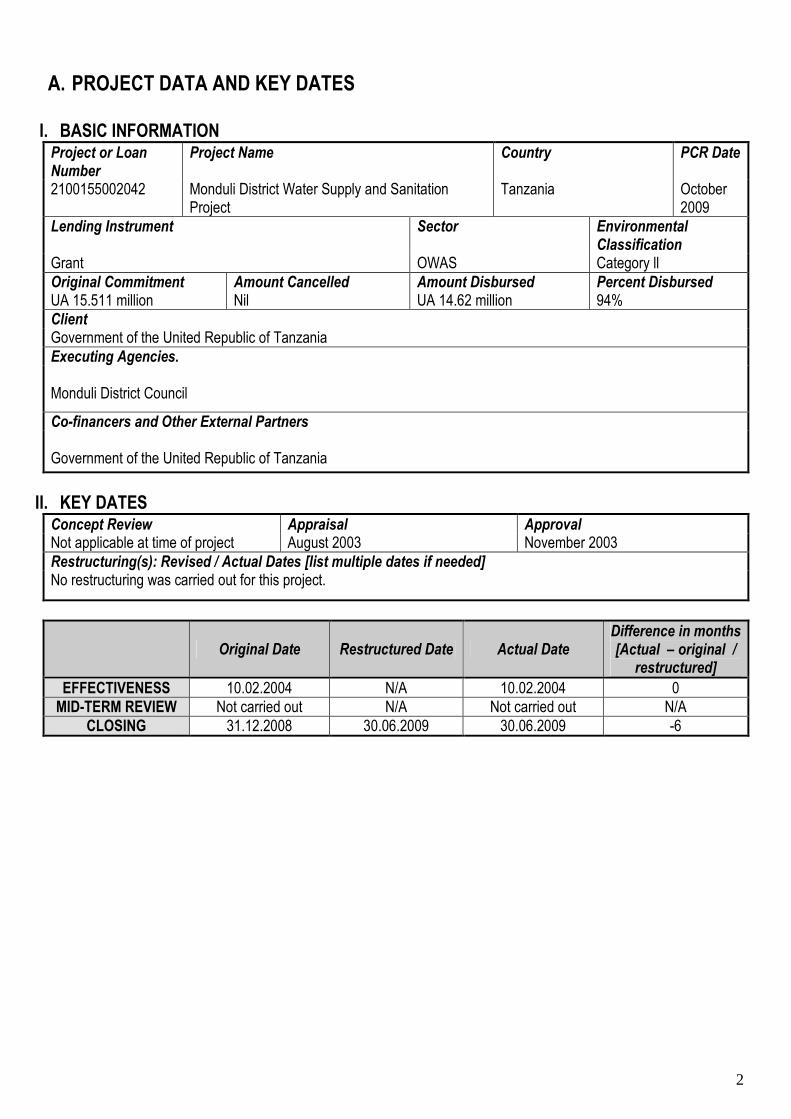
I. BASIC INFORMATION Project or Loan Number
Project Name Country PCR Date
2100155002042 Monduli District Water Supply and Sanitation Project
Tanzania October 2009
Lending Instrument Sector Environmental Classification
Grant OWAS Category ll
Original Commitment Amount Cancelled Amount Disbursed Percent Disbursed UA 15.511 million Nil UA 14.62 million 94%
Client Government of the United Republic of Tanzania
Executing Agencies. Monduli District Council
Co-financers and Other External Partners Government of the United Republic of Tanzania
II. KEY DATES Concept Review Appraisal Approval Not applicable at time of project August 2003 November 2003
Restructuring(s): Revised / Actual Dates [list multiple dates if needed] No restructuring was carried out for this project.
Original Date Restructured Date Actual Date
Difference in months [Actual – original /
restructured]
EFFECTIVENESS 10.02.2004 N/A 10.02.2004 0
MID-TERM REVIEW Not carried out N/A Not carried out N/A
CLOSING 31.12.2008 30.06.2009 30.06.2009 -6
3
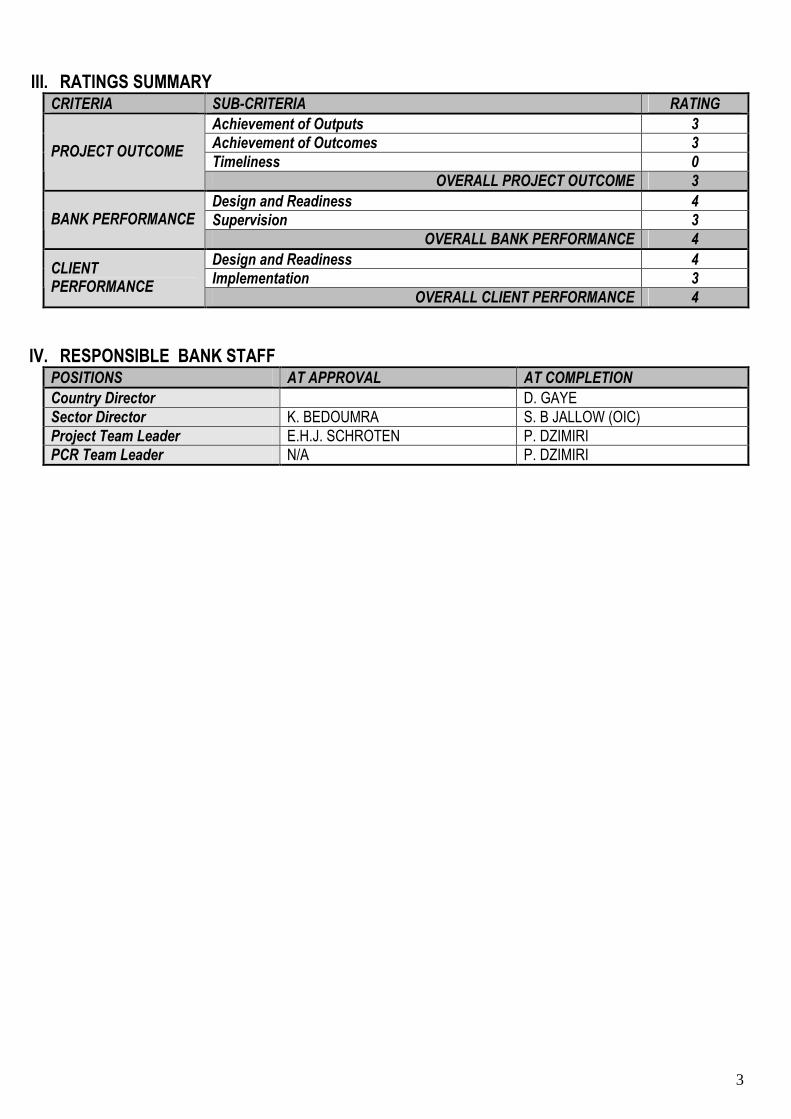
III. RATINGS SUMMARY CRITERIA SUB-CRITERIA RATING
Achievement of Outputs 3
Achievement of Outcomes 3
Timeliness 0 PROJECT OUTCOME
OVERALL PROJECT OUTCOME 3
Design and Readiness 4
Supervision 3 BANK PERFORMANCE
OVERALL BANK PERFORMANCE 4
Design and Readiness 4
Implementation 3 CLIENT PERFORMANCE
OVERALL CLIENT PERFORMANCE 4
IV. RESPONSIBLE BANK STAFF POSITIONS AT APPROVAL AT COMPLETION
Country Director D. GAYE
Sector Director K. BEDOUMRA S. B JALLOW (OIC)
Project Team Leader E.H.J. SCHROTEN P. DZIMIRI
PCR Team Leader N/A P. DZIMIRI
4
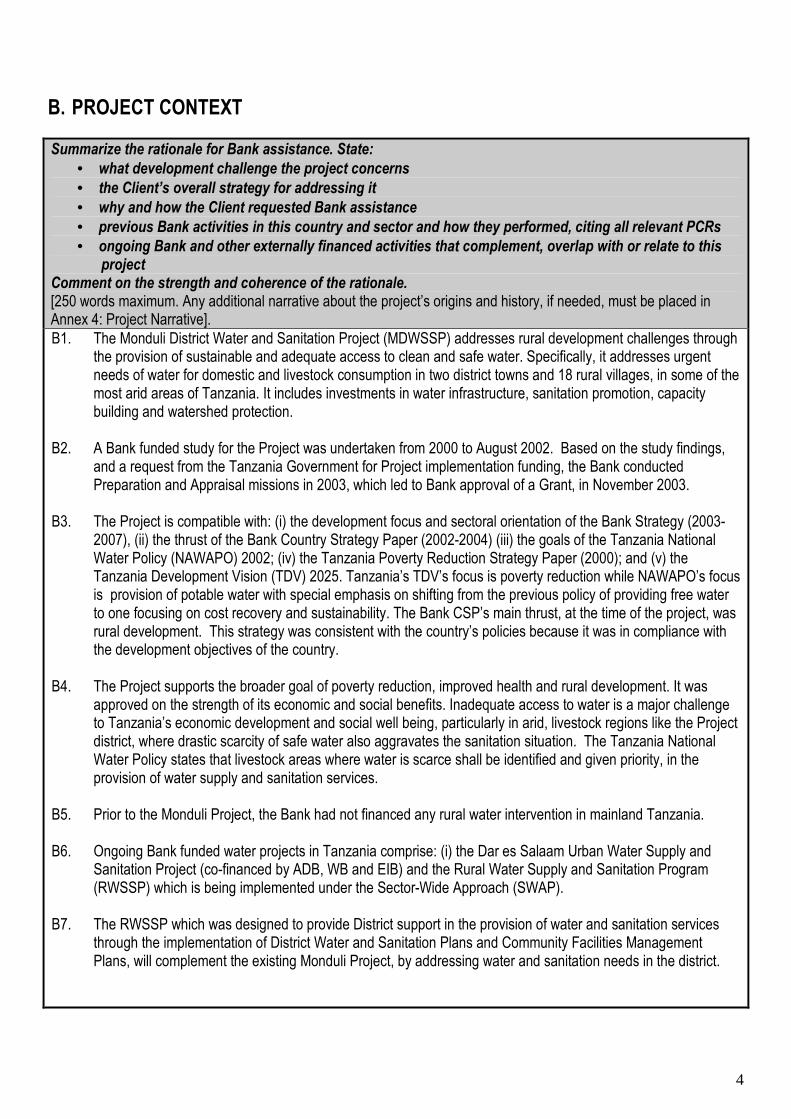
B. PROJECT CONTEXT
Summarize the rationale for Bank assistance. State:
• what development challenge the project concerns
• the Client’s overall strategy for addressing it
• why and how the Client requested Bank assistance
• previous Bank activities in this country and sector and how they performed, citing all relevant PCRs
• ongoing Bank and other externally financed activities that complement, overlap with or relate to this project
Comment on the strength and coherence of the rationale. [250 words maximum. Any additional narrative about the project’s origins and history, if needed, must be placed in Annex 4: Project Narrative].
B1. The Monduli District Water and Sanitation Project (MDWSSP) addresses rural development challenges through the provision of sustainable and adequate access to clean and safe water. Specifically, it addresses urgent needs of water for domestic and livestock consumption in two district towns and 18 rural villages, in some of the most arid areas of Tanzania. It includes investments in water infrastructure, sanitation promotion, capacity building and watershed protection.
B2. A Bank funded study for the Project was undertaken from 2000 to August 2002. Based on the study findings, and a request from the Tanzania Government for Project implementation funding, the Bank conducted Preparation and Appraisal missions in 2003, which led to Bank approval of a Grant, in November 2003.
B3. The Project is compatible with: (i) the development focus and sectoral orientation of the Bank Strategy (2003-2007), (ii) the thrust of the Bank Country Strategy Paper (2002-2004) (iii) the goals of the Tanzania National Water Policy (NAWAPO) 2002; (iv) the Tanzania Poverty Reduction Strategy Paper (2000); and (v) the Tanzania Development Vision (TDV) 2025. Tanzania’s TDV’s focus is poverty reduction while NAWAPO’s focus is provision of potable water with special emphasis on shifting from the previous policy of providing free water to one focusing on cost recovery and sustainability. The Bank CSP’s main thrust, at the time of the project, was rural development. This strategy was consistent with the country’s policies because it was in compliance with the development objectives of the country.
B4. The Project supports the broader goal of poverty reduction, improved health and rural development. It was approved on the strength of its economic and social benefits. Inadequate access to water is a major challenge to Tanzania’s economic development and social well being, particularly in arid, livestock regions like the Project district, where drastic scarcity of safe water also aggravates the sanitation situation. The Tanzania National Water Policy states that livestock areas where water is scarce shall be identified and given priority, in the provision of water supply and sanitation services.
B5. Prior to the Monduli Project, the Bank had not financed any rural water intervention in mainland Tanzania.
B6. Ongoing Bank funded water projects in Tanzania comprise: (i) the Dar es Salaam Urban Water Supply and Sanitation Project (co-financed by ADB, WB and EIB) and the Rural Water Supply and Sanitation Program (RWSSP) which is being implemented under the Sector-Wide Approach (SWAP).
B7. The RWSSP which was designed to provide District support in the provision of water and sanitation services through the implementation of District Water and Sanitation Plans and Community Facilities Management Plans, will complement the existing Monduli Project, by addressing water and sanitation needs in the district.
5
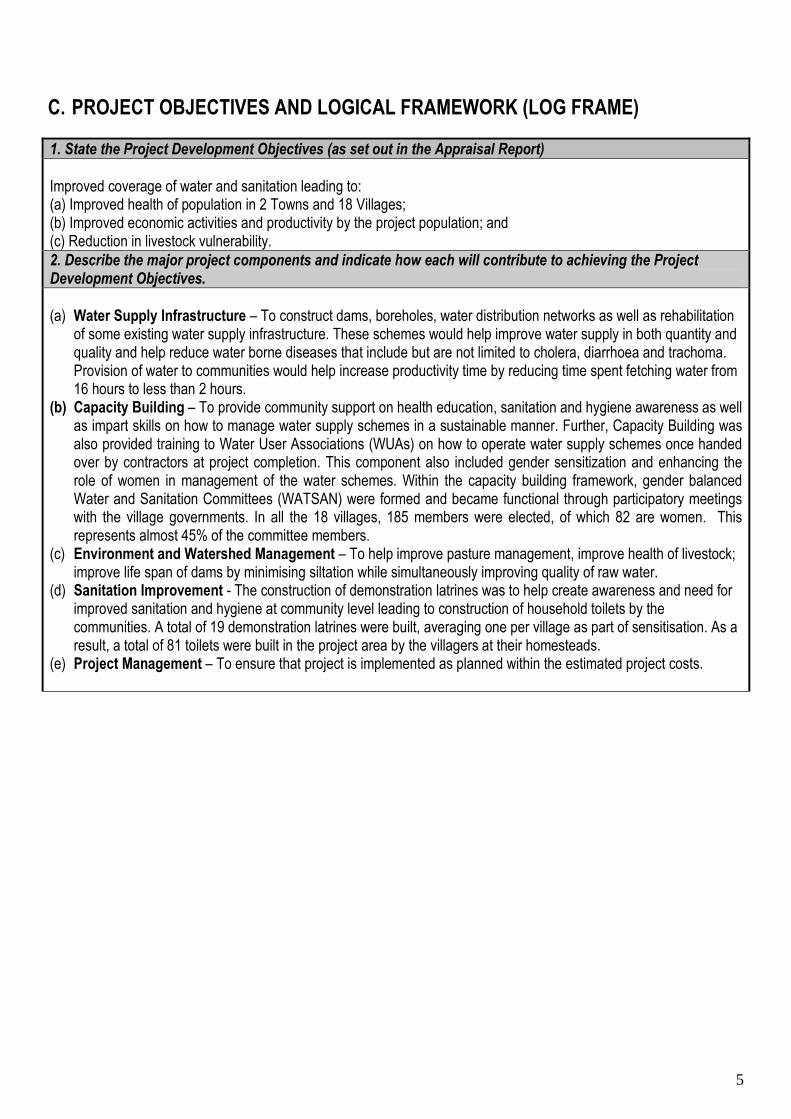
C. PROJECT OBJECTIVES AND LOGICAL FRAMEWORK (LOG FRAME)
1. State the Project Development Objectives (as set out in the Appraisal Report)
Improved coverage of water and sanitation leading to: (a) Improved health of population in 2 Towns and 18 Villages; (b) Improved economic activities and productivity by the project population; and (c) Reduction in livestock vulnerability.
2. Describe the major project components and indicate how each will contribute to achieving the Project Development Objectives.
(a) Water Supply Infrastructure – To construct dams, boreholes, water distribution networks as well as rehabilitation
of some existing water supply infrastructure. These schemes would help improve water supply in both quantity and quality and help reduce water borne diseases that include but are not limited to cholera, diarrhoea and trachoma. Provision of water to communities would help increase productivity time by reducing time spent fetching water from 16 hours to less than 2 hours.
(b) Capacity Building – To provide community support on health education, sanitation and hygiene awareness as well as impart skills on how to manage water supply schemes in a sustainable manner. Further, Capacity Building was also provided training to Water User Associations (WUAs) on how to operate water supply schemes once handed over by contractors at project completion. This component also included gender sensitization and enhancing the role of women in management of the water schemes. Within the capacity building framework, gender balanced Water and Sanitation Committees (WATSAN) were formed and became functional through participatory meetings with the village governments. In all the 18 villages, 185 members were elected, of which 82 are women. This represents almost 45% of the committee members.
(c) Environment and Watershed Management – To help improve pasture management, improve health of livestock; improve life span of dams by minimising siltation while simultaneously improving quality of raw water.
(d) Sanitation Improvement - The construction of demonstration latrines was to help create awareness and need for improved sanitation and hygiene at community level leading to construction of household toilets by the communities. A total of 19 demonstration latrines were built, averaging one per village as part of sensitisation. As a result, a total of 81 toilets were built in the project area by the villagers at their homesteads.
(e) Project Management – To ensure that project is implemented as planned within the estimated project costs.
6
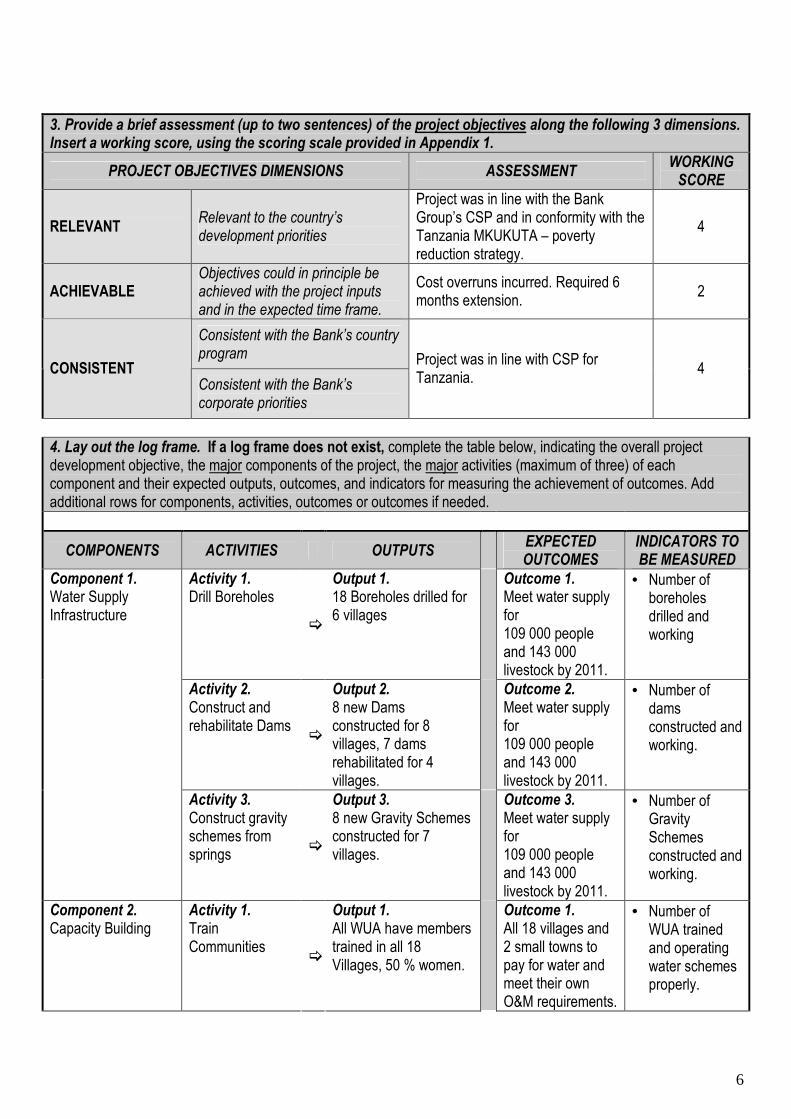
3. Provide a brief assessment (up to two sentences) of the project objectives along the following 3 dimensions. Insert a working score, using the scoring scale provided in Appendix 1.
PROJECT OBJECTIVES DIMENSIONS ASSESSMENT WORKING SCORE
RELEVANT Relevant to the country’s development priorities
Project was in line with the Bank Group’s CSP and in conformity with the Tanzania MKUKUTA – poverty reduction strategy.
4
ACHIEVABLE Objectives could in principle be achieved with the project inputs and in the expected time frame.
Cost overruns incurred. Required 6 months extension.
2
Consistent with the Bank’s country program
CONSISTENT Consistent with the Bank’s corporate priorities
Project was in line with CSP for Tanzania.
4
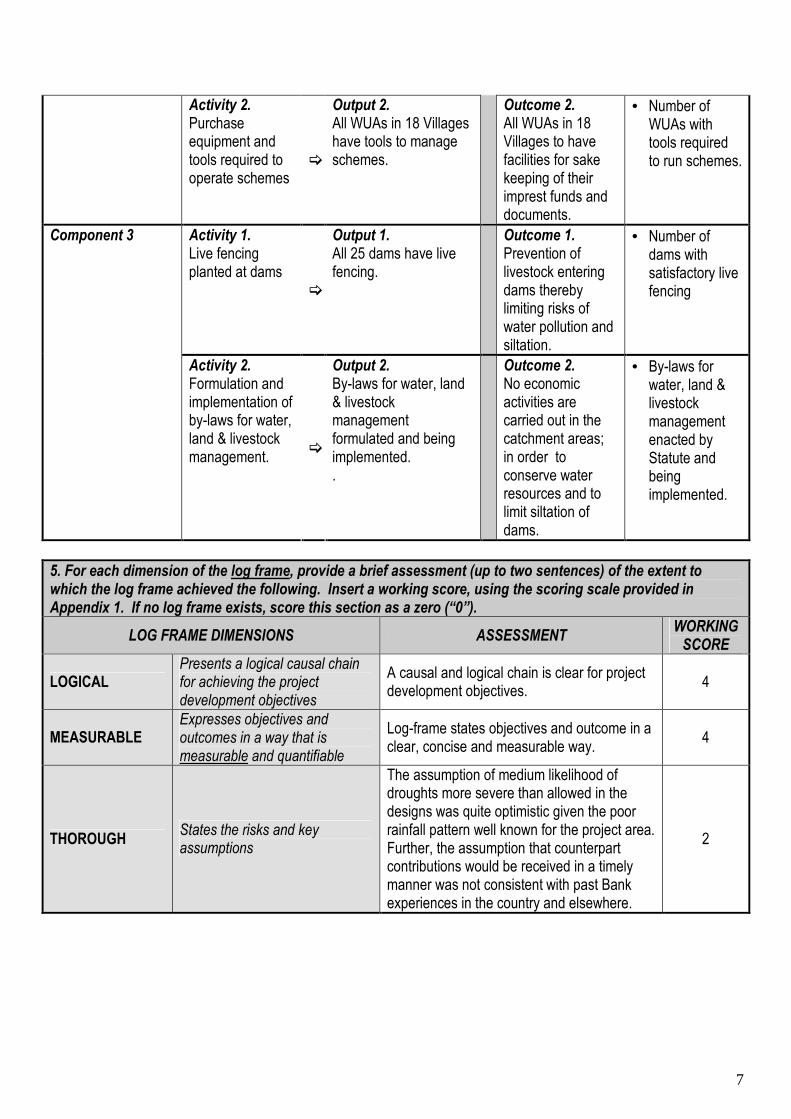
4. Lay out the log frame. If a log frame does not exist, complete the table below, indicating the overall project development objective, the major components of the project, the major activities (maximum of three) of each component and their expected outputs, outcomes, and indicators for measuring the achievement of outcomes. Add additional rows for components, activities, outcomes or outcomes if needed.
COMPONENTS ACTIVITIES OUTPUTS EXPECTED OUTCOMES
INDICATORS TO BE MEASURED
Activity 1. Drill Boreholes
�
Output 1. 18 Boreholes drilled for 6 villages
Outcome 1. Meet water supply for 109 000 people and 143 000 livestock by 2011.
• Number of boreholes drilled and working
Activity 2. Construct and rehabilitate Dams
�
Output 2. 8 new Dams constructed for 8 villages, 7 dams rehabilitated for 4 villages.
Outcome 2. Meet water supply for 109 000 people and 143 000 livestock by 2011.
• Number of dams constructed and working.
Component 1. Water Supply Infrastructure
Activity 3. Construct gravity schemes from springs
�
Output 3. 8 new Gravity Schemes constructed for 7 villages.
Outcome 3. Meet water supply for 109 000 people and 143 000 livestock by 2011.
• Number of Gravity Schemes constructed and working.
Component 2. Capacity Building
Activity 1. Train Communities
�
Output 1. All WUA have members trained in all 18 Villages, 50 % women.
Outcome 1. All 18 villages and 2 small towns to pay for water and meet their own O&M requirements.
• Number of WUA trained and operating water schemes properly.
7
Activity 2. Purchase equipment and tools required to operate schemes
�
Output 2. All WUAs in 18 Villages have tools to manage schemes.
Outcome 2. All WUAs in 18 Villages to have facilities for sake keeping of their imprest funds and documents.
• Number of WUAs with tools required to run schemes.
Activity 1. Live fencing planted at dams �
Output 1. All 25 dams have live fencing.
Outcome 1. Prevention of livestock entering dams thereby limiting risks of water pollution and siltation.
• Number of dams with satisfactory live fencing
Component 3
Activity 2. Formulation and implementation of by-laws for water, land & livestock management.
�
Output 2. By-laws for water, land & livestock management formulated and being implemented. .
Outcome 2. No economic activities are carried out in the catchment areas; in order to conserve water resources and to limit siltation of dams.
• By-laws for water, land & livestock management enacted by Statute and being implemented.
5. For each dimension of the log frame, provide a brief assessment (up to two sentences) of the extent to which the log frame achieved the following. Insert a working score, using the scoring scale provided in Appendix 1. If no log frame exists, score this section as a zero (“0”).
LOG FRAME DIMENSIONS ASSESSMENT WORKING SCORE
LOGICAL Presents a logical causal chain for achieving the project development objectives
A causal and logical chain is clear for project development objectives.
4
MEASURABLE Expresses objectives and outcomes in a way that is measurable and quantifiable
Log-frame states objectives and outcome in a clear, concise and measurable way.
4
THOROUGH States the risks and key assumptions
The assumption of medium likelihood of droughts more severe than allowed in the designs was quite optimistic given the poor rainfall pattern well known for the project area. Further, the assumption that counterpart contributions would be received in a timely manner was not consistent with past Bank experiences in the country and elsewhere.
2
8
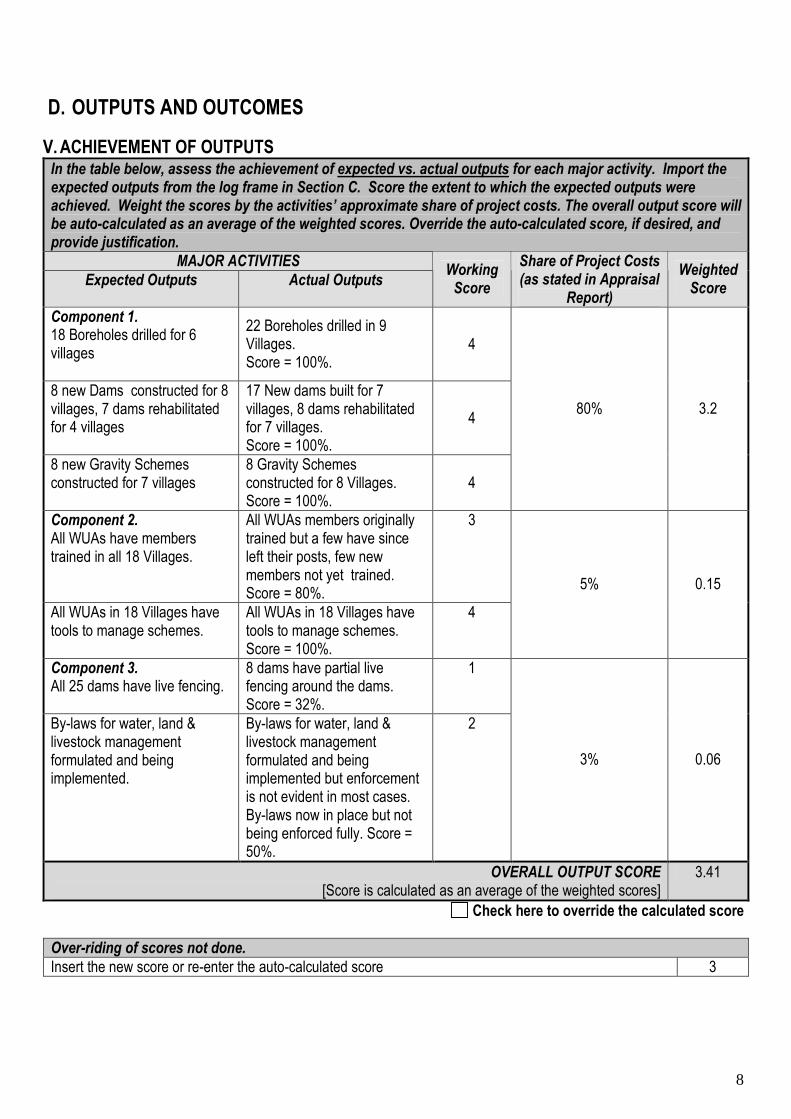
D. OUTPUTS AND OUTCOMES
V. ACHIEVEMENT OF OUTPUTS In the table below, assess the achievement of expected vs. actual outputs for each major activity. Import the expected outputs from the log frame in Section C. Score the extent to which the expected outputs were achieved. Weight the scores by the activities’ approximate share of project costs. The overall output score will be auto-calculated as an average of the weighted scores. Override the auto-calculated score, if desired, and provide justification.
MAJOR ACTIVITIES
Expected Outputs Actual Outputs Working Score
Share of Project Costs (as stated in Appraisal
Report)
Weighted Score
Component 1. 18 Boreholes drilled for 6 villages
22 Boreholes drilled in 9 Villages. Score = 100%.
4
8 new Dams constructed for 8 villages, 7 dams rehabilitated for 4 villages
17 New dams built for 7 villages, 8 dams rehabilitated for 7 villages. Score = 100%.
4
8 new Gravity Schemes constructed for 7 villages
8 Gravity Schemes constructed for 8 Villages. Score = 100%.
4
80% 3.2
Component 2. All WUAs have members trained in all 18 Villages.
All WUAs members originally trained but a few have since left their posts, few new members not yet trained. Score = 80%.
3
All WUAs in 18 Villages have tools to manage schemes.
All WUAs in 18 Villages have tools to manage schemes. Score = 100%.
4
5% 0.15
Component 3. All 25 dams have live fencing.
8 dams have partial live fencing around the dams. Score = 32%.
1
By-laws for water, land & livestock management formulated and being implemented.
By-laws for water, land & livestock management formulated and being implemented but enforcement is not evident in most cases. By-laws now in place but not being enforced fully. Score = 50%.
2
3% 0.06
OVERALL OUTPUT SCORE [Score is calculated as an average of the weighted scores]
3.41
Check here to override the calculated score
Over-riding of scores not done.
Insert the new score or re-enter the auto-calculated score 3
9
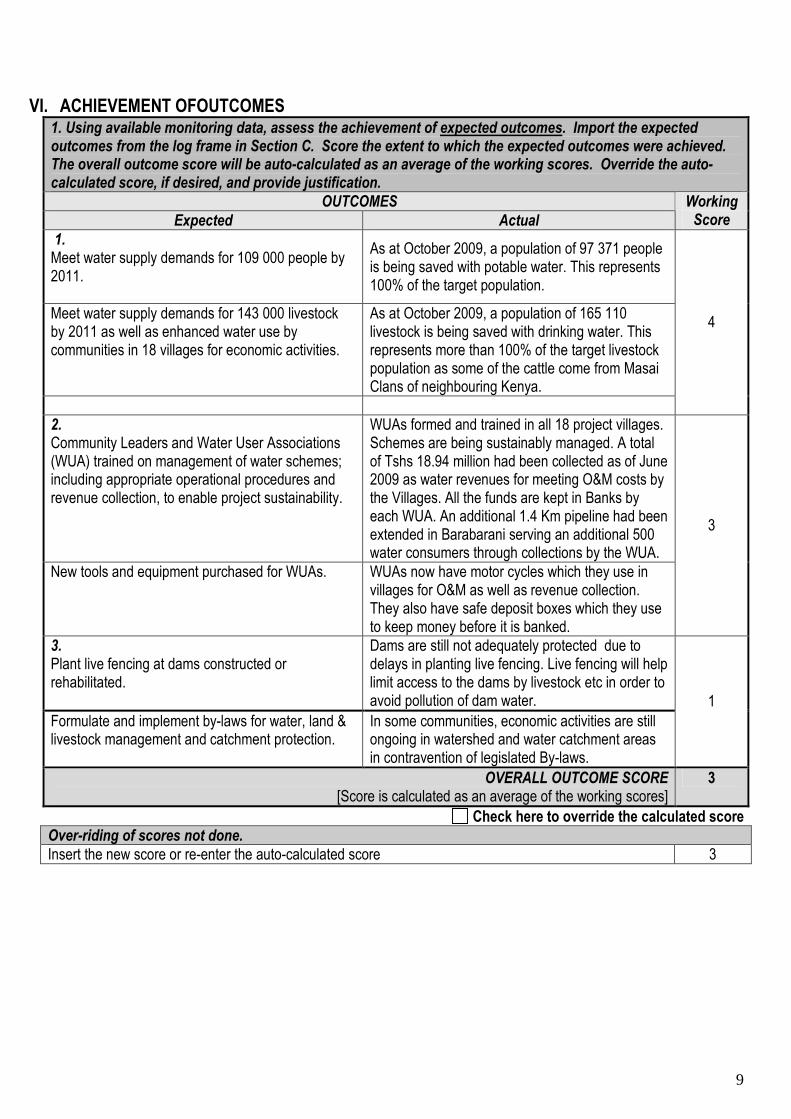
VI. ACHIEVEMENT OFOUTCOMES 1. Using available monitoring data, assess the achievement of expected outcomes. Import the expected outcomes from the log frame in Section C. Score the extent to which the expected outcomes were achieved. The overall outcome score will be auto-calculated as an average of the working scores. Override the auto-calculated score, if desired, and provide justification.
OUTCOMES
Expected Actual
Working Score
1. Meet water supply demands for 109 000 people by 2011.
As at October 2009, a population of 97 371 people is being saved with potable water. This represents 100% of the target population.
Meet water supply demands for 143 000 livestock by 2011 as well as enhanced water use by communities in 18 villages for economic activities.
As at October 2009, a population of 165 110 livestock is being saved with drinking water. This represents more than 100% of the target livestock population as some of the cattle come from Masai Clans of neighbouring Kenya.
4
2. Community Leaders and Water User Associations (WUA) trained on management of water schemes; including appropriate operational procedures and revenue collection, to enable project sustainability.
WUAs formed and trained in all 18 project villages. Schemes are being sustainably managed. A total of Tshs 18.94 million had been collected as of June 2009 as water revenues for meeting O&M costs by the Villages. All the funds are kept in Banks by each WUA. An additional 1.4 Km pipeline had been extended in Barabarani serving an additional 500 water consumers through collections by the WUA.
New tools and equipment purchased for WUAs. WUAs now have motor cycles which they use in villages for O&M as well as revenue collection. They also have safe deposit boxes which they use to keep money before it is banked.
3
3. Plant live fencing at dams constructed or rehabilitated.
Dams are still not adequately protected due to delays in planting live fencing. Live fencing will help limit access to the dams by livestock etc in order to avoid pollution of dam water.
Formulate and implement by-laws for water, land & livestock management and catchment protection.
In some communities, economic activities are still ongoing in watershed and water catchment areas in contravention of legislated By-laws.
1
OVERALL OUTCOME SCORE [Score is calculated as an average of the working scores]
3
Check here to override the calculated score
Over-riding of scores not done.
Insert the new score or re-enter the auto-calculated score 3
10
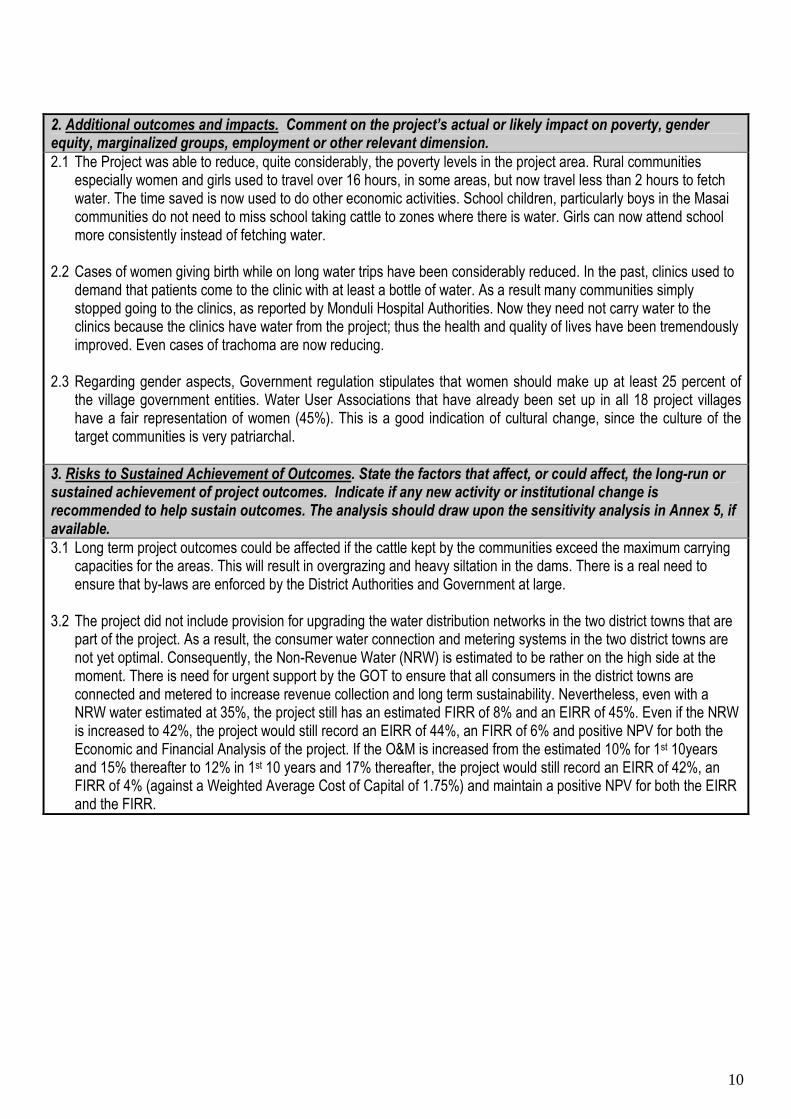
2. Additional outcomes and impacts. Comment on the project’s actual or likely impact on poverty, gender equity, marginalized groups, employment or other relevant dimension.
2.1 The Project was able to reduce, quite considerably, the poverty levels in the project area. Rural communities especially women and girls used to travel over 16 hours, in some areas, but now travel less than 2 hours to fetch water. The time saved is now used to do other economic activities. School children, particularly boys in the Masai communities do not need to miss school taking cattle to zones where there is water. Girls can now attend school more consistently instead of fetching water.
2.2 Cases of women giving birth while on long water trips have been considerably reduced. In the past, clinics used to
demand that patients come to the clinic with at least a bottle of water. As a result many communities simply stopped going to the clinics, as reported by Monduli Hospital Authorities. Now they need not carry water to the clinics because the clinics have water from the project; thus the health and quality of lives have been tremendously improved. Even cases of trachoma are now reducing.
2.3 Regarding gender aspects, Government regulation stipulates that women should make up at least 25 percent of
the village government entities. Water User Associations that have already been set up in all 18 project villages have a fair representation of women (45%). This is a good indication of cultural change, since the culture of the target communities is very patriarchal.
3. Risks to Sustained Achievement of Outcomes. State the factors that affect, or could affect, the long-run or sustained achievement of project outcomes. Indicate if any new activity or institutional change is recommended to help sustain outcomes. The analysis should draw upon the sensitivity analysis in Annex 5, if available.
3.1 Long term project outcomes could be affected if the cattle kept by the communities exceed the maximum carrying capacities for the areas. This will result in overgrazing and heavy siltation in the dams. There is a real need to ensure that by-laws are enforced by the District Authorities and Government at large.
3.2 The project did not include provision for upgrading the water distribution networks in the two district towns that are
part of the project. As a result, the consumer water connection and metering systems in the two district towns are not yet optimal. Consequently, the Non-Revenue Water (NRW) is estimated to be rather on the high side at the moment. There is need for urgent support by the GOT to ensure that all consumers in the district towns are connected and metered to increase revenue collection and long term sustainability. Nevertheless, even with a NRW water estimated at 35%, the project still has an estimated FIRR of 8% and an EIRR of 45%. Even if the NRW is increased to 42%, the project would still record an EIRR of 44%, an FIRR of 6% and positive NPV for both the Economic and Financial Analysis of the project. If the O&M is increased from the estimated 10% for 1st 10years and 15% thereafter to 12% in 1st 10 years and 17% thereafter, the project would still record an EIRR of 42%, an FIRR of 4% (against a Weighted Average Cost of Capital of 1.75%) and maintain a positive NPV for both the EIRR and the FIRR.
11
E. PROJECT DESIGN AND READINESS FOR IMPLEMENTATION
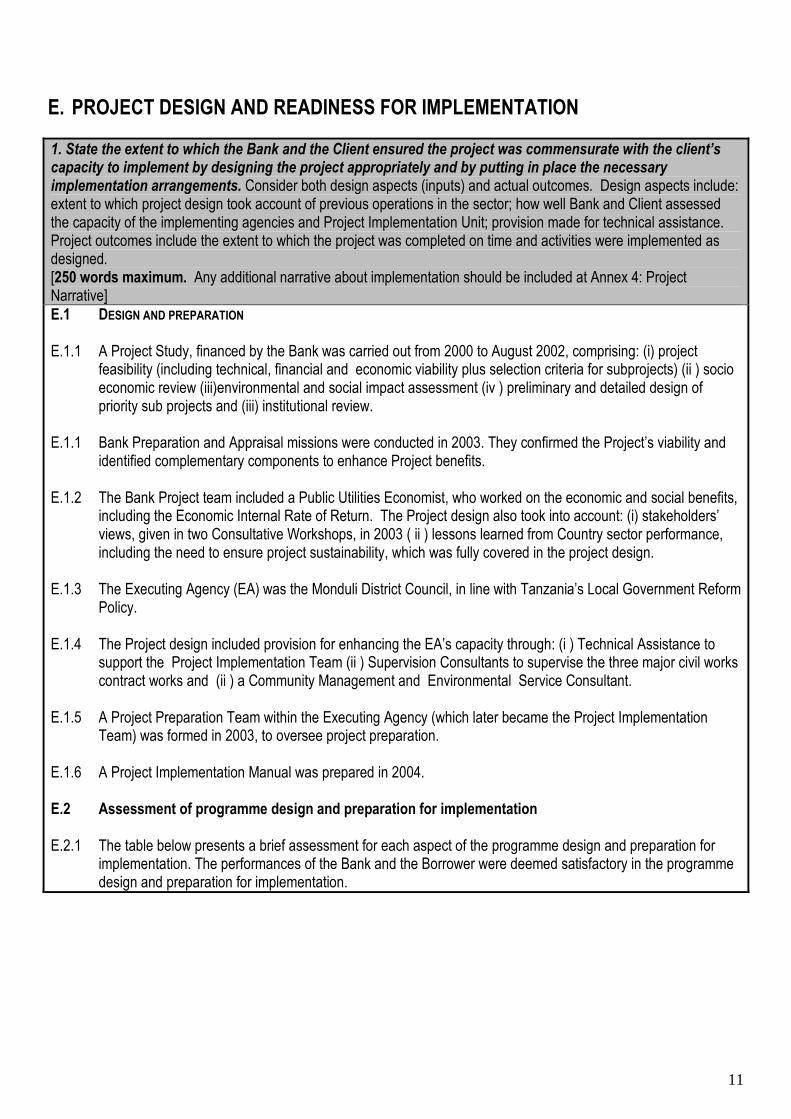
1. State the extent to which the Bank and the Client ensured the project was commensurate with the client’s capacity to implement by designing the project appropriately and by putting in place the necessary implementation arrangements. Consider both design aspects (inputs) and actual outcomes. Design aspects include: extent to which project design took account of previous operations in the sector; how well Bank and Client assessed the capacity of the implementing agencies and Project Implementation Unit; provision made for technical assistance. Project outcomes include the extent to which the project was completed on time and activities were implemented as designed. [250 words maximum. Any additional narrative about implementation should be included at Annex 4: Project Narrative]
E.1 DESIGN AND PREPARATION E.1.1 A Project Study, financed by the Bank was carried out from 2000 to August 2002, comprising: (i) project
feasibility (including technical, financial and economic viability plus selection criteria for subprojects) (ii ) socio economic review (iii)environmental and social impact assessment (iv ) preliminary and detailed design of priority sub projects and (iii) institutional review.
E.1.1 Bank Preparation and Appraisal missions were conducted in 2003. They confirmed the Project’s viability and identified complementary components to enhance Project benefits.
E.1.2 The Bank Project team included a Public Utilities Economist, who worked on the economic and social benefits,
including the Economic Internal Rate of Return. The Project design also took into account: (i) stakeholders’ views, given in two Consultative Workshops, in 2003 ( ii ) lessons learned from Country sector performance, including the need to ensure project sustainability, which was fully covered in the project design.
E.1.3 The Executing Agency (EA) was the Monduli District Council, in line with Tanzania’s Local Government Reform Policy.
E.1.4 The Project design included provision for enhancing the EA’s capacity through: (i ) Technical Assistance to support the Project Implementation Team (ii ) Supervision Consultants to supervise the three major civil works contract works and (ii ) a Community Management and Environmental Service Consultant.
E.1.5 A Project Preparation Team within the Executing Agency (which later became the Project Implementation Team) was formed in 2003, to oversee project preparation.
E.1.6 A Project Implementation Manual was prepared in 2004. E.2 Assessment of programme design and preparation for implementation
E.2.1 The table below presents a brief assessment for each aspect of the programme design and preparation for
implementation. The performances of the Bank and the Borrower were deemed satisfactory in the programme design and preparation for implementation.
12
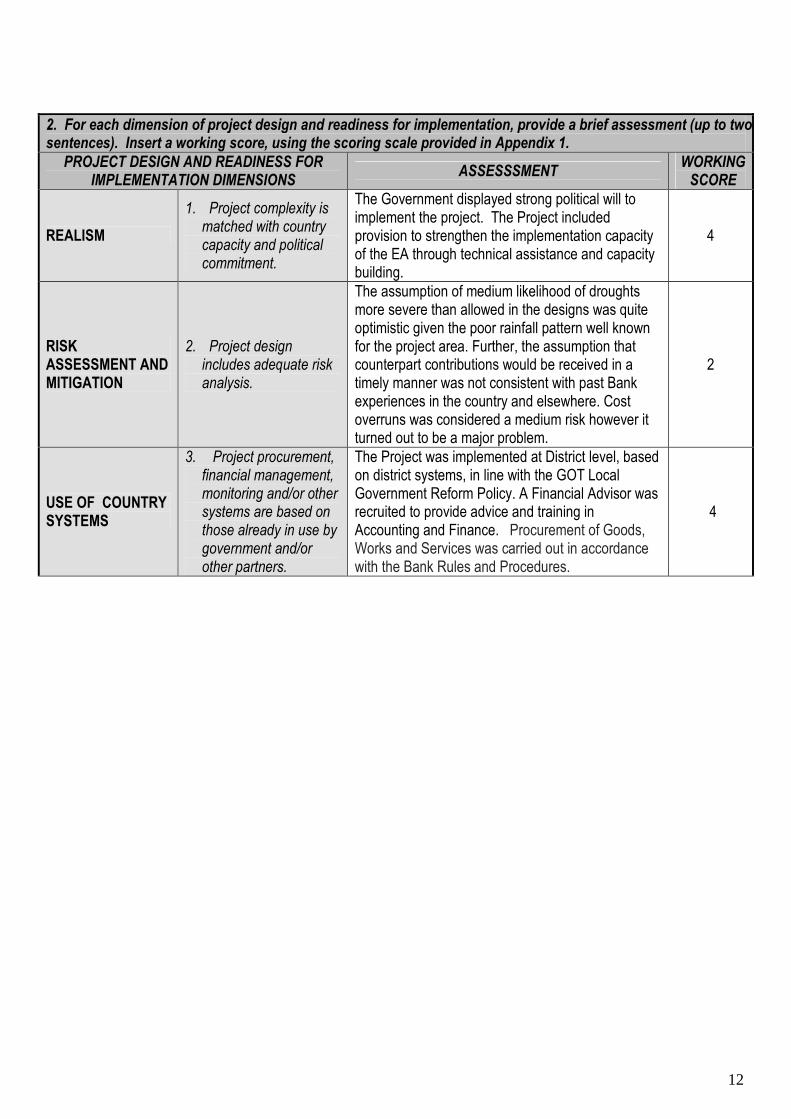
2. For each dimension of project design and readiness for implementation, provide a brief assessment (up to two sentences). Insert a working score, using the scoring scale provided in Appendix 1.
PROJECT DESIGN AND READINESS FOR IMPLEMENTATION DIMENSIONS
ASSESSSMENT WORKING SCORE
REALISM
1. Project complexity is matched with country capacity and political commitment.
The Government displayed strong political will to implement the project. The Project included provision to strengthen the implementation capacity of the EA through technical assistance and capacity building.
4
RISK ASSESSMENT AND MITIGATION
2. Project design includes adequate risk analysis.
The assumption of medium likelihood of droughts more severe than allowed in the designs was quite optimistic given the poor rainfall pattern well known for the project area. Further, the assumption that counterpart contributions would be received in a timely manner was not consistent with past Bank experiences in the country and elsewhere. Cost overruns was considered a medium risk however it turned out to be a major problem.
2
USE OF COUNTRY SYSTEMS
3. Project procurement, financial management, monitoring and/or other systems are based on those already in use by government and/or other partners.
The Project was implemented at District level, based on district systems, in line with the GOT Local Government Reform Policy. A Financial Advisor was recruited to provide advice and training in Accounting and Finance. Procurement of Goods, Works and Services was carried out in accordance with the Bank Rules and Procedures.
4
13
WORKING SCORE
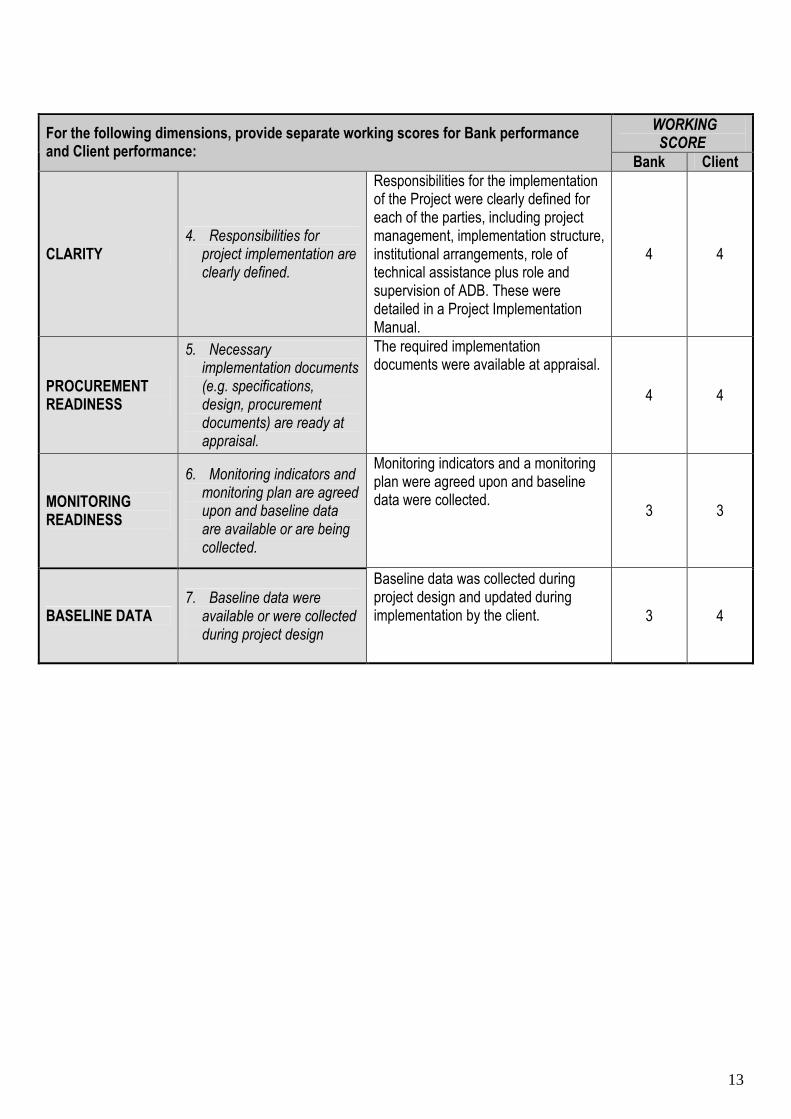
For the following dimensions, provide separate working scores for Bank performance and Client performance:
Bank Client
CLARITY 4. Responsibilities for project implementation are clearly defined.
Responsibilities for the implementation of the Project were clearly defined for each of the parties, including project management, implementation structure, institutional arrangements, role of technical assistance plus role and supervision of ADB. These were detailed in a Project Implementation Manual.
4 4
PROCUREMENT READINESS
5. Necessary implementation documents (e.g. specifications, design, procurement documents) are ready at appraisal.
The required implementation documents were available at appraisal.
4 4
MONITORING READINESS
6. Monitoring indicators and monitoring plan are agreed upon and baseline data are available or are being collected.
Monitoring indicators and a monitoring plan were agreed upon and baseline data were collected.
3 3
BASELINE DATA 7. Baseline data were available or were collected during project design
Baseline data was collected during project design and updated during implementation by the client. 3 4
14
F. IMPLEMENTATION
1. The major characteristics of project implementation with reference to: adherence to schedules, quality of construction or other work, performance of consultants, effectiveness of Bank supervision, effectiveness of Client oversight, and compliance with safeguards.
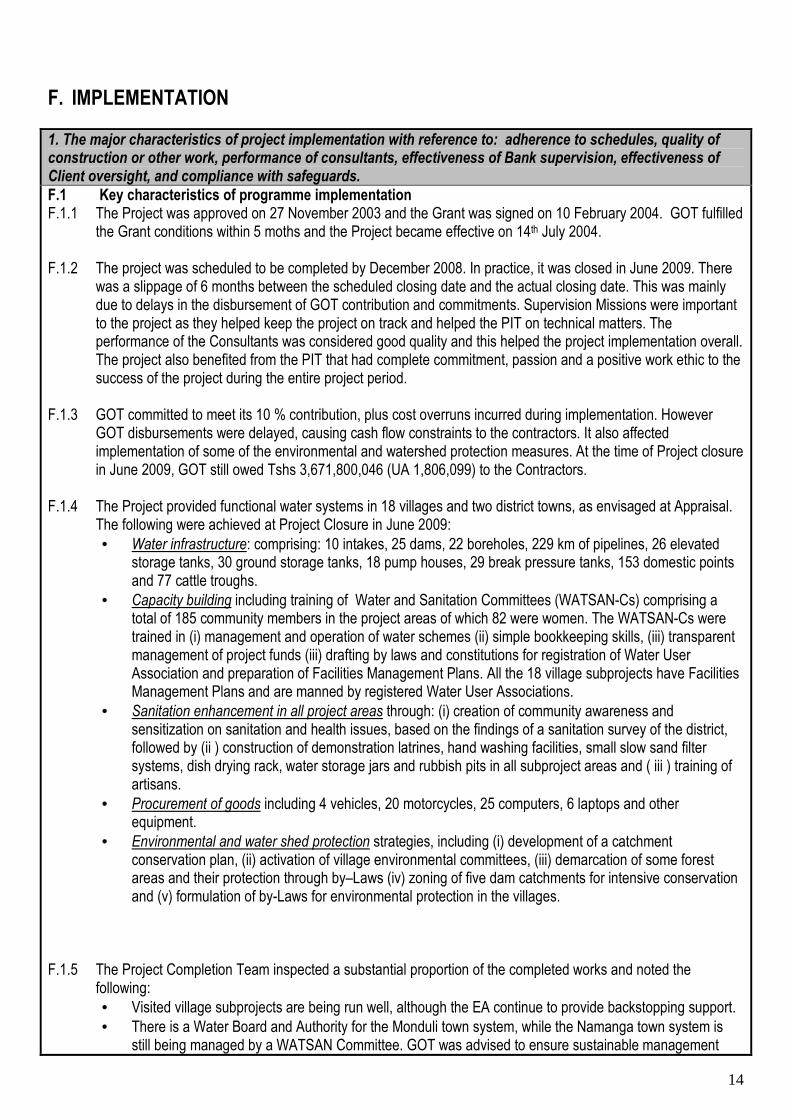
F.1 Key characteristics of programme implementation F.1.1 The Project was approved on 27 November 2003 and the Grant was signed on 10 February 2004. GOT fulfilled
the Grant conditions within 5 moths and the Project became effective on 14th July 2004.
F.1.2 The project was scheduled to be completed by December 2008. In practice, it was closed in June 2009. There was a slippage of 6 months between the scheduled closing date and the actual closing date. This was mainly due to delays in the disbursement of GOT contribution and commitments. Supervision Missions were important to the project as they helped keep the project on track and helped the PIT on technical matters. The performance of the Consultants was considered good quality and this helped the project implementation overall. The project also benefited from the PIT that had complete commitment, passion and a positive work ethic to the success of the project during the entire project period.
F.1.3 GOT committed to meet its 10 % contribution, plus cost overruns incurred during implementation. However GOT disbursements were delayed, causing cash flow constraints to the contractors. It also affected implementation of some of the environmental and watershed protection measures. At the time of Project closure in June 2009, GOT still owed Tshs 3,671,800,046 (UA 1,806,099) to the Contractors.
F.1.4 The Project provided functional water systems in 18 villages and two district towns, as envisaged at Appraisal. The following were achieved at Project Closure in June 2009:
• Water infrastructure: comprising: 10 intakes, 25 dams, 22 boreholes, 229 km of pipelines, 26 elevated storage tanks, 30 ground storage tanks, 18 pump houses, 29 break pressure tanks, 153 domestic points and 77 cattle troughs.
• Capacity building including training of Water and Sanitation Committees (WATSAN-Cs) comprising a total of 185 community members in the project areas of which 82 were women. The WATSAN-Cs were trained in (i) management and operation of water schemes (ii) simple bookkeeping skills, (iii) transparent management of project funds (iii) drafting by laws and constitutions for registration of Water User Association and preparation of Facilities Management Plans. All the 18 village subprojects have Facilities Management Plans and are manned by registered Water User Associations.
• Sanitation enhancement in all project areas through: (i) creation of community awareness and sensitization on sanitation and health issues, based on the findings of a sanitation survey of the district, followed by (ii ) construction of demonstration latrines, hand washing facilities, small slow sand filter systems, dish drying rack, water storage jars and rubbish pits in all subproject areas and ( iii ) training of artisans.
• Procurement of goods including 4 vehicles, 20 motorcycles, 25 computers, 6 laptops and other equipment.
• Environmental and water shed protection strategies, including (i) development of a catchment conservation plan, (ii) activation of village environmental committees, (iii) demarcation of some forest areas and their protection through by–Laws (iv) zoning of five dam catchments for intensive conservation and (v) formulation of by-Laws for environmental protection in the villages.
F.1.5 The Project Completion Team inspected a substantial proportion of the completed works and noted the following:
• Visited village subprojects are being run well, although the EA continue to provide backstopping support.
• There is a Water Board and Authority for the Monduli town system, while the Namanga town system is still being managed by a WATSAN Committee. GOT was advised to ensure sustainable management
15
and operation of the town schemes by (i) strengthening the operational capacity of the Monduli Town Authority and (ii) by ensuring the establishment of a Registered Water Entity to run the Namanga town system
• GOT will need to ensure that the distribution networks for the town schemes are upgraded and that all water users are connected and metered for effective revenue collection and long term viability of the scheme.
• Continuous sensitization and surveillance on sanitation will be needed, since behavioral changes take time.
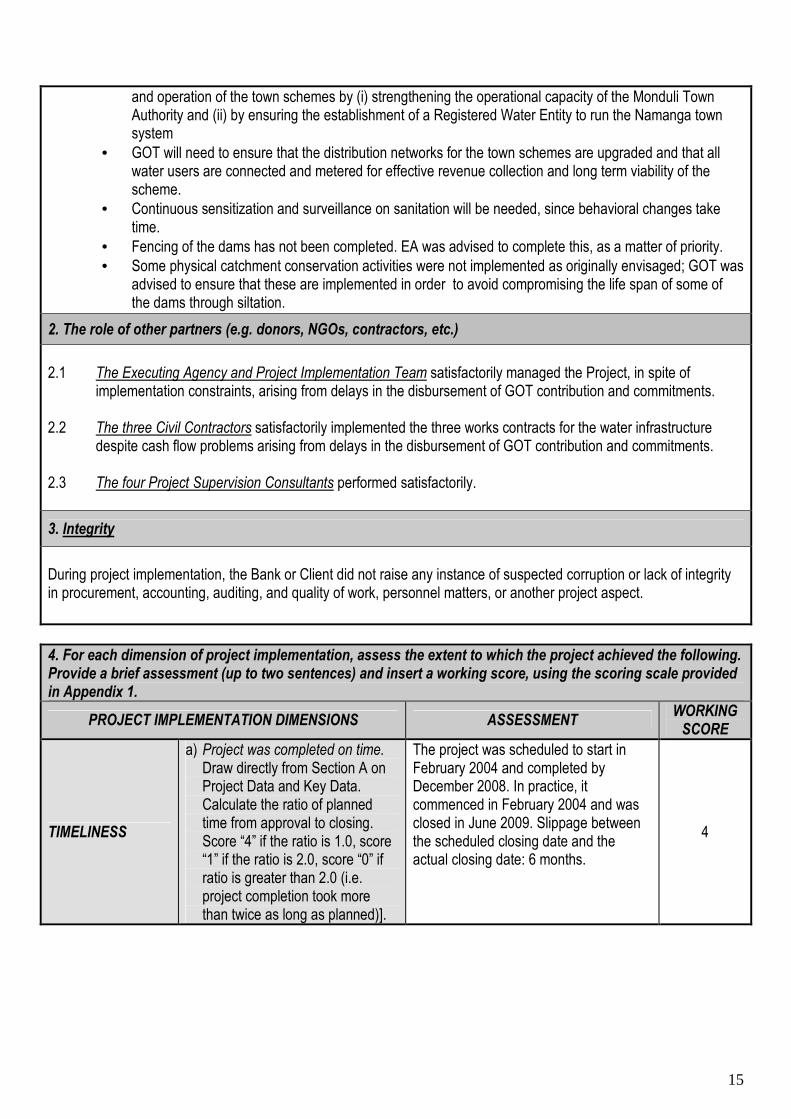
• Fencing of the dams has not been completed. EA was advised to complete this, as a matter of priority.
• Some physical catchment conservation activities were not implemented as originally envisaged; GOT was advised to ensure that these are implemented in order to avoid compromising the life span of some of the dams through siltation.
2. The role of other partners (e.g. donors, NGOs, contractors, etc.)
2.1 The Executing Agency and Project Implementation Team satisfactorily managed the Project, in spite of implementation constraints, arising from delays in the disbursement of GOT contribution and commitments.
2.2 The three Civil Contractors satisfactorily implemented the three works contracts for the water infrastructure despite cash flow problems arising from delays in the disbursement of GOT contribution and commitments.
2.3 The four Project Supervision Consultants performed satisfactorily.
3. Integrity
During project implementation, the Bank or Client did not raise any instance of suspected corruption or lack of integrity in procurement, accounting, auditing, and quality of work, personnel matters, or another project aspect.
4. For each dimension of project implementation, assess the extent to which the project achieved the following. Provide a brief assessment (up to two sentences) and insert a working score, using the scoring scale provided in Appendix 1.
PROJECT IMPLEMENTATION DIMENSIONS ASSESSMENT WORKING SCORE
TIMELINESS
a) Project was completed on time. Draw directly from Section A on Project Data and Key Data. Calculate the ratio of planned time from approval to closing. Score “4” if the ratio is 1.0, score “1” if the ratio is 2.0, score “0” if ratio is greater than 2.0 (i.e. project completion took more than twice as long as planned)].
The project was scheduled to start in February 2004 and completed by December 2008. In practice, it commenced in February 2004 and was closed in June 2009. Slippage between the scheduled closing date and the actual closing date: 6 months.
4
16
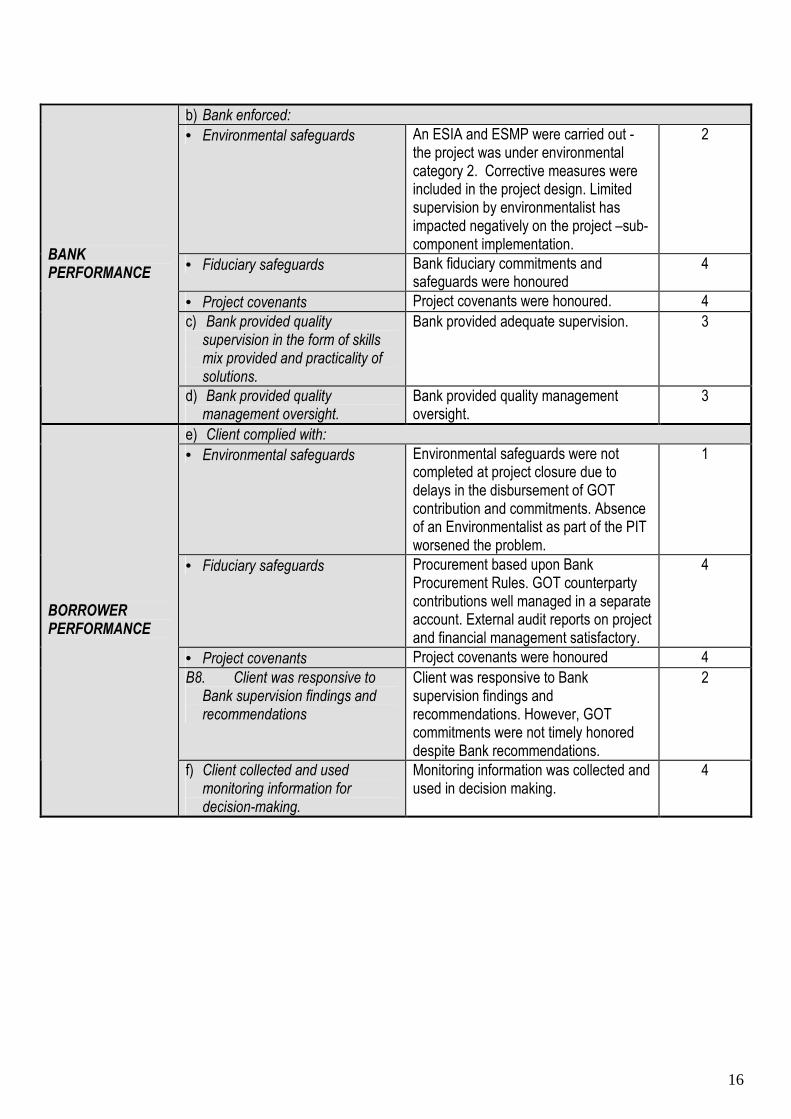
b) Bank enforced: • Environmental safeguards An ESIA and ESMP were carried out -
the project was under environmental category 2. Corrective measures were included in the project design. Limited supervision by environmentalist has impacted negatively on the project –sub-component implementation.
2
• Fiduciary safeguards Bank fiduciary commitments and safeguards were honoured
4
• Project covenants Project covenants were honoured. 4
c) Bank provided quality supervision in the form of skills mix provided and practicality of solutions.
Bank provided adequate supervision. 3
BANK PERFORMANCE
d) Bank provided quality management oversight.
Bank provided quality management oversight.
3
e) Client complied with: • Environmental safeguards Environmental safeguards were not
completed at project closure due to delays in the disbursement of GOT contribution and commitments. Absence of an Environmentalist as part of the PIT worsened the problem.
1
• Fiduciary safeguards Procurement based upon Bank Procurement Rules. GOT counterparty contributions well managed in a separate account. External audit reports on project and financial management satisfactory.
4
• Project covenants Project covenants were honoured 4
B8. Client was responsive to Bank supervision findings and recommendations
Client was responsive to Bank supervision findings and recommendations. However, GOT commitments were not timely honored despite Bank recommendations.
2
BORROWER PERFORMANCE
f) Client collected and used monitoring information for decision-making.
Monitoring information was collected and used in decision making.
4
G. COMPLETION
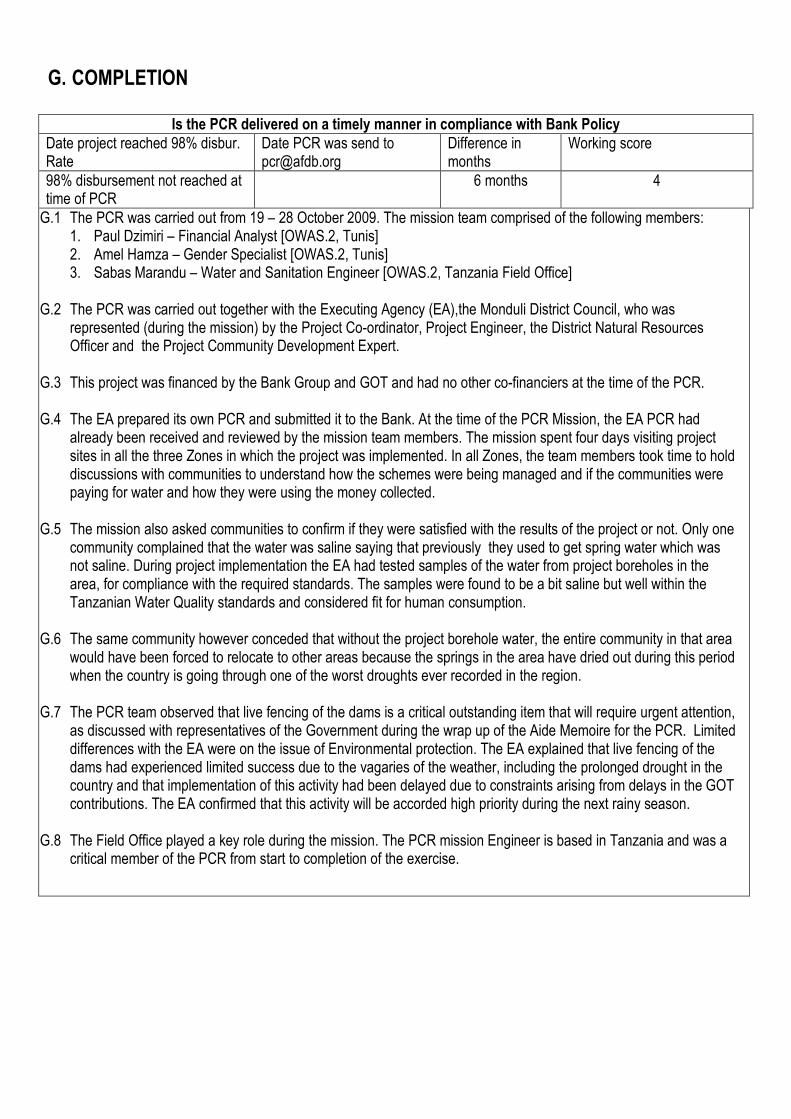
Is the PCR delivered on a timely manner in compliance with Bank Policy
Date project reached 98% disbur. Rate
Date PCR was send to [email protected]
Difference in months
Working score
98% disbursement not reached at time of PCR
6 months 4
G.1 The PCR was carried out from 19 – 28 October 2009. The mission team comprised of the following members: 1. Paul Dzimiri – Financial Analyst [OWAS.2, Tunis] 2. Amel Hamza – Gender Specialist [OWAS.2, Tunis] 3. Sabas Marandu – Water and Sanitation Engineer [OWAS.2, Tanzania Field Office]
G.2 The PCR was carried out together with the Executing Agency (EA),the Monduli District Council, who was
represented (during the mission) by the Project Co-ordinator, Project Engineer, the District Natural Resources Officer and the Project Community Development Expert.
G.3 This project was financed by the Bank Group and GOT and had no other co-financiers at the time of the PCR. G.4 The EA prepared its own PCR and submitted it to the Bank. At the time of the PCR Mission, the EA PCR had
already been received and reviewed by the mission team members. The mission spent four days visiting project sites in all the three Zones in which the project was implemented. In all Zones, the team members took time to hold discussions with communities to understand how the schemes were being managed and if the communities were paying for water and how they were using the money collected.
G.5 The mission also asked communities to confirm if they were satisfied with the results of the project or not. Only one
community complained that the water was saline saying that previously they used to get spring water which was not saline. During project implementation the EA had tested samples of the water from project boreholes in the area, for compliance with the required standards. The samples were found to be a bit saline but well within the Tanzanian Water Quality standards and considered fit for human consumption.
G.6 The same community however conceded that without the project borehole water, the entire community in that area
would have been forced to relocate to other areas because the springs in the area have dried out during this period when the country is going through one of the worst droughts ever recorded in the region.
G.7 The PCR team observed that live fencing of the dams is a critical outstanding item that will require urgent attention,
as discussed with representatives of the Government during the wrap up of the Aide Memoire for the PCR. Limited differences with the EA were on the issue of Environmental protection. The EA explained that live fencing of the dams had experienced limited success due to the vagaries of the weather, including the prolonged drought in the country and that implementation of this activity had been delayed due to constraints arising from delays in the GOT contributions. The EA confirmed that this activity will be accorded high priority during the next rainy season.
G.8 The Field Office played a key role during the mission. The PCR mission Engineer is based in Tanzania and was a
critical member of the PCR from start to completion of the exercise.
18
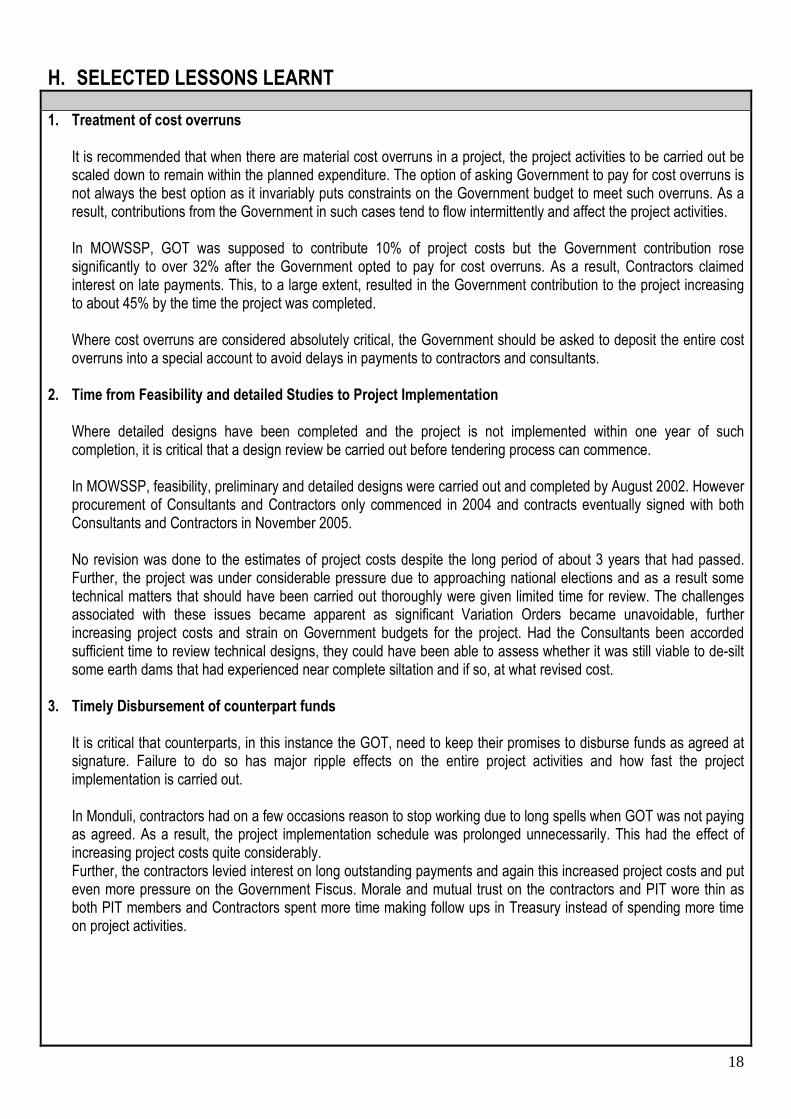
H. SELECTED LESSONS LEARNT
1. Treatment of cost overruns It is recommended that when there are material cost overruns in a project, the project activities to be carried out be scaled down to remain within the planned expenditure. The option of asking Government to pay for cost overruns is not always the best option as it invariably puts constraints on the Government budget to meet such overruns. As a result, contributions from the Government in such cases tend to flow intermittently and affect the project activities. In MOWSSP, GOT was supposed to contribute 10% of project costs but the Government contribution rose significantly to over 32% after the Government opted to pay for cost overruns. As a result, Contractors claimed interest on late payments. This, to a large extent, resulted in the Government contribution to the project increasing to about 45% by the time the project was completed. Where cost overruns are considered absolutely critical, the Government should be asked to deposit the entire cost overruns into a special account to avoid delays in payments to contractors and consultants.
2. Time from Feasibility and detailed Studies to Project Implementation Where detailed designs have been completed and the project is not implemented within one year of such completion, it is critical that a design review be carried out before tendering process can commence. In MOWSSP, feasibility, preliminary and detailed designs were carried out and completed by August 2002. However procurement of Consultants and Contractors only commenced in 2004 and contracts eventually signed with both Consultants and Contractors in November 2005. No revision was done to the estimates of project costs despite the long period of about 3 years that had passed. Further, the project was under considerable pressure due to approaching national elections and as a result some technical matters that should have been carried out thoroughly were given limited time for review. The challenges associated with these issues became apparent as significant Variation Orders became unavoidable, further increasing project costs and strain on Government budgets for the project. Had the Consultants been accorded sufficient time to review technical designs, they could have been able to assess whether it was still viable to de-silt some earth dams that had experienced near complete siltation and if so, at what revised cost.
3. Timely Disbursement of counterpart funds It is critical that counterparts, in this instance the GOT, need to keep their promises to disburse funds as agreed at signature. Failure to do so has major ripple effects on the entire project activities and how fast the project implementation is carried out. In Monduli, contractors had on a few occasions reason to stop working due to long spells when GOT was not paying as agreed. As a result, the project implementation schedule was prolonged unnecessarily. This had the effect of increasing project costs quite considerably. Further, the contractors levied interest on long outstanding payments and again this increased project costs and put even more pressure on the Government Fiscus. Morale and mutual trust on the contractors and PIT wore thin as both PIT members and Contractors spent more time making follow ups in Treasury instead of spending more time on project activities.
19
4. Sustainability in rural projects is possible In the Masai Communities of Longido, Kisongo and Manyara Zones all the water users interviewed were paying for water. More importantly, these communities had a clear understanding as to why they needed to pay for the water and did not need any outside party to make them pay for the water. It was also clear that the rural communities have a sound ability to identify who amongst them was not able to afford to pay and help such members in the communities. The old impression that the cattle herders (mostly Masai) are less economically minded does not hold anymore. Indeed, in the early years of implementation, the EA had considerable challenges working with the Masai [and yes, although minor glitches linger on]; the project has clearly shown that with concerted efforts at training water users from any background, success is possible in time. The Naiti area was one project area visited in which the communities reviewed their tariffs to an amount higher than Monduli Town. The villagers interviewed explained that they needed to raise enough money to pay for their operating costs. All Water Users in the project areas have bank accounts with amounts well in excess of their needs for the following three months. In Mto Wa Mbu, the communities have been able to extend the water distribution network by an incredible 2.4 kilometres from their revenue collections. This shows that there is potential for, especially peri-urban areas, to cover more than just the operational and maintenance costs.
20
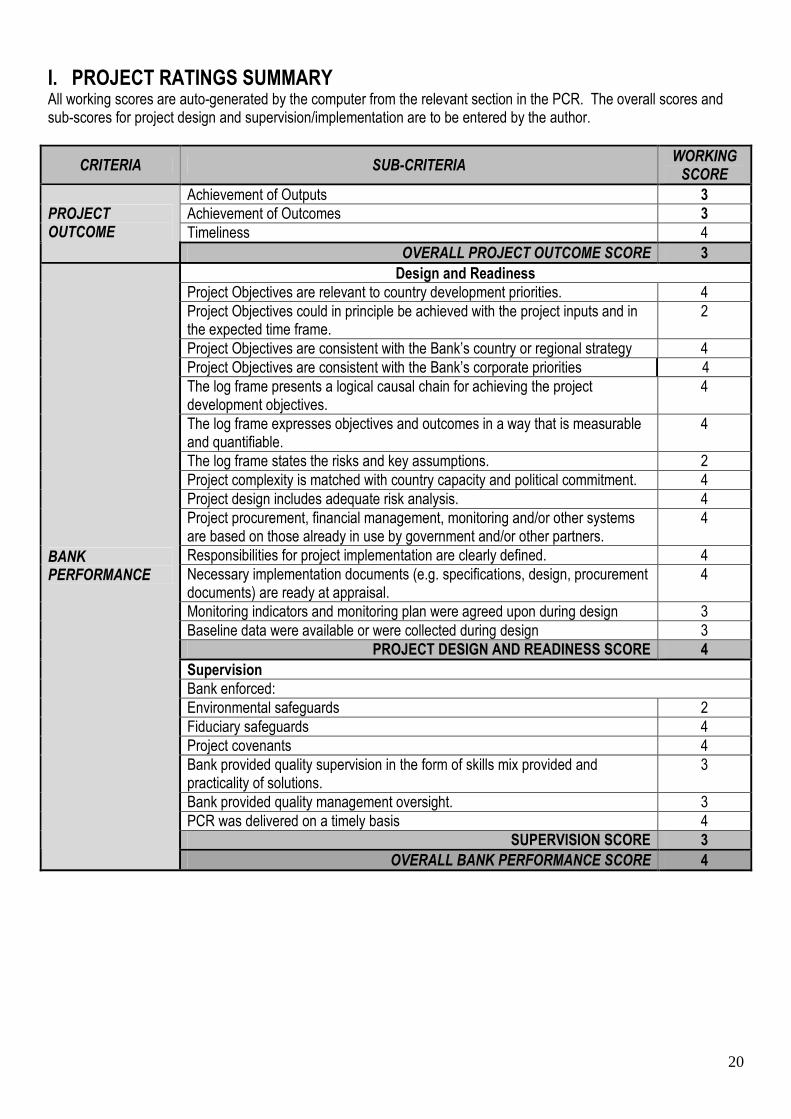
I. PROJECT RATINGS SUMMARY All working scores are auto-generated by the computer from the relevant section in the PCR. The overall scores and sub-scores for project design and supervision/implementation are to be entered by the author.
CRITERIA SUB-CRITERIA WORKING SCORE
Achievement of Outputs 3
Achievement of Outcomes 3
Timeliness 4
PROJECT OUTCOME
OVERALL PROJECT OUTCOME SCORE 3
Design and Readiness
Project Objectives are relevant to country development priorities. 4
Project Objectives could in principle be achieved with the project inputs and in the expected time frame.
2
Project Objectives are consistent with the Bank’s country or regional strategy 4
Project Objectives are consistent with the Bank’s corporate priorities 4
The log frame presents a logical causal chain for achieving the project development objectives.
4
The log frame expresses objectives and outcomes in a way that is measurable and quantifiable.
4
The log frame states the risks and key assumptions. 2
Project complexity is matched with country capacity and political commitment. 4
Project design includes adequate risk analysis. 4
Project procurement, financial management, monitoring and/or other systems are based on those already in use by government and/or other partners.
4
Responsibilities for project implementation are clearly defined. 4
Necessary implementation documents (e.g. specifications, design, procurement documents) are ready at appraisal.
4
Monitoring indicators and monitoring plan were agreed upon during design 3
Baseline data were available or were collected during design 3
PROJECT DESIGN AND READINESS SCORE 4
Supervision
Bank enforced:
Environmental safeguards 2
Fiduciary safeguards 4
Project covenants 4
Bank provided quality supervision in the form of skills mix provided and practicality of solutions.
3
Bank provided quality management oversight. 3
PCR was delivered on a timely basis 4
SUPERVISION SCORE 3
BANK PERFORMANCE
OVERALL BANK PERFORMANCE SCORE 4
21
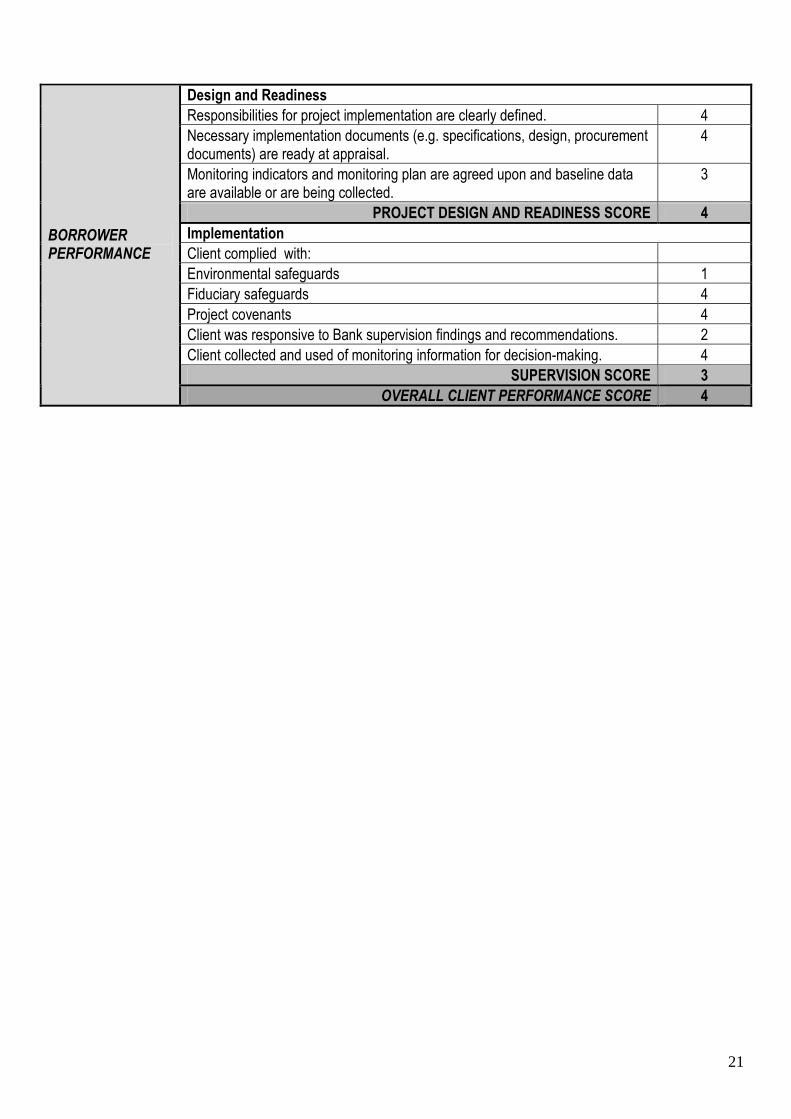
Design and Readiness
Responsibilities for project implementation are clearly defined. 4
Necessary implementation documents (e.g. specifications, design, procurement documents) are ready at appraisal.
4
Monitoring indicators and monitoring plan are agreed upon and baseline data are available or are being collected.
3
PROJECT DESIGN AND READINESS SCORE 4
Implementation
Client complied with:
Environmental safeguards 1
Fiduciary safeguards 4
Project covenants 4
Client was responsive to Bank supervision findings and recommendations. 2
Client collected and used of monitoring information for decision-making. 4
SUPERVISION SCORE 3
BORROWER PERFORMANCE
OVERALL CLIENT PERFORMANCE SCORE 4
22
J. PROCESSING
Signature and Comments Date
S.B Jallow Sector Manager Clearance
D. Gaye Regional Director Clearance
S.B. Jallow (OIC) Sector Director Approval
MONDULI DISTRICT WATER SUPPLY AND SANITATION PROJECT
TECHNICAL ANNEXES
24
Table of Contents: Annex 1. Project Cost and Financing by Component Annex 2. Bank Inputs Annex 3. Economic Analysis and Financial Analysis Annex 4. Summary of Procurement Annex 5 List of Supporting Documents Annex 6. Project Narrative Annex 7 Project Map
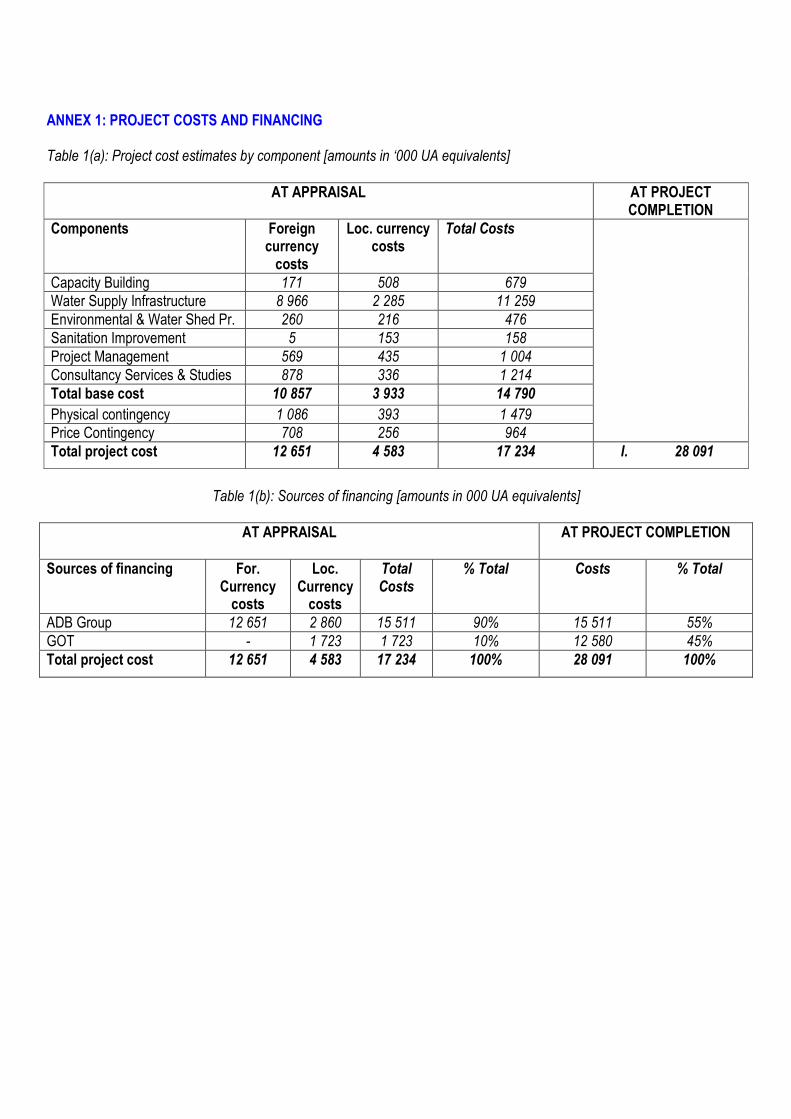
ANNEX 1: PROJECT COSTS AND FINANCING Table 1(a): Project cost estimates by component [amounts in ‘000 UA equivalents]
AT APPRAISAL
AT PROJECT COMPLETION
Components Foreign currency costs
Loc. currency costs
Total Costs
Capacity Building 171 508 679
Water Supply Infrastructure 8 966 2 285 11 259
Environmental & Water Shed Pr. 260 216 476
Sanitation Improvement 5 153 158
Project Management 569 435 1 004
Consultancy Services & Studies 878 336 1 214
Total base cost 10 857 3 933 14 790
Physical contingency 1 086 393 1 479
Price Contingency 708 256 964
Total project cost 12 651 4 583 17 234 I. 28 091
Table 1(b): Sources of financing [amounts in 000 UA equivalents]
AT APPRAISAL
AT PROJECT COMPLETION
Sources of financing For. Currency costs
Loc. Currency costs
Total Costs
% Total Costs % Total
ADB Group 12 651 2 860 15 511 90% 15 511 55%
GOT - 1 723 1 723 10% 12 580 45%
Total project cost 12 651 4 583 17 234 100% 28 091 100%
26
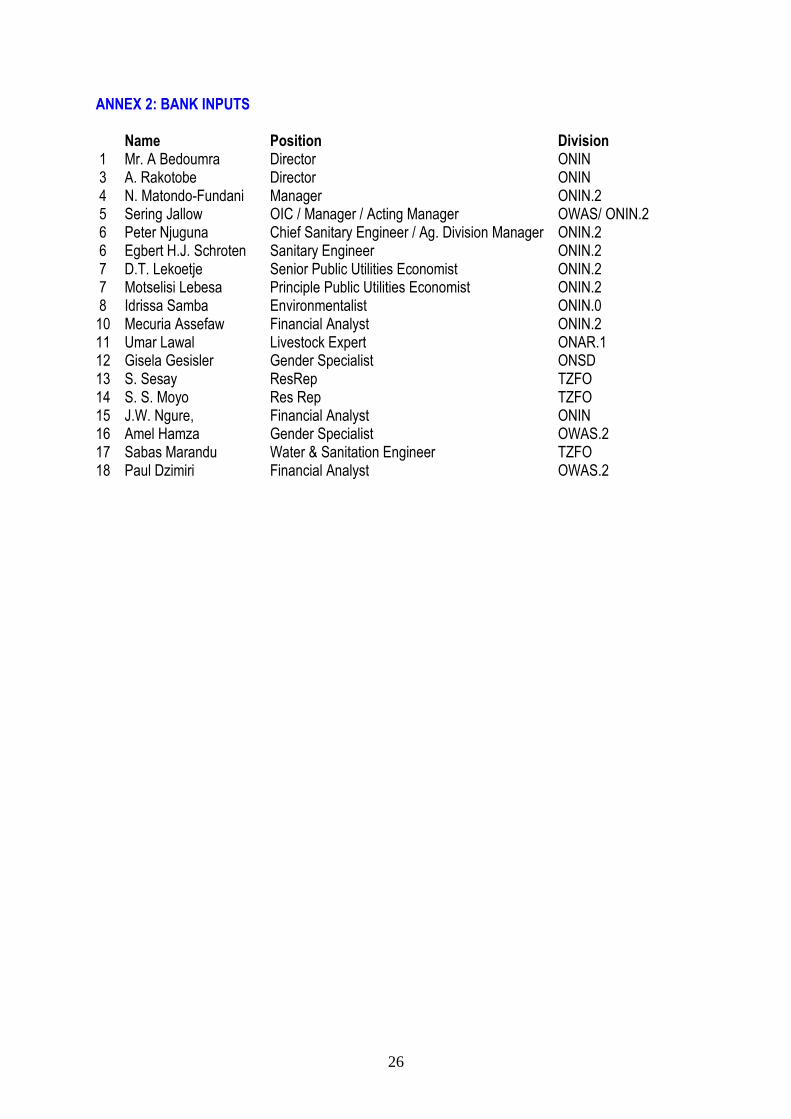
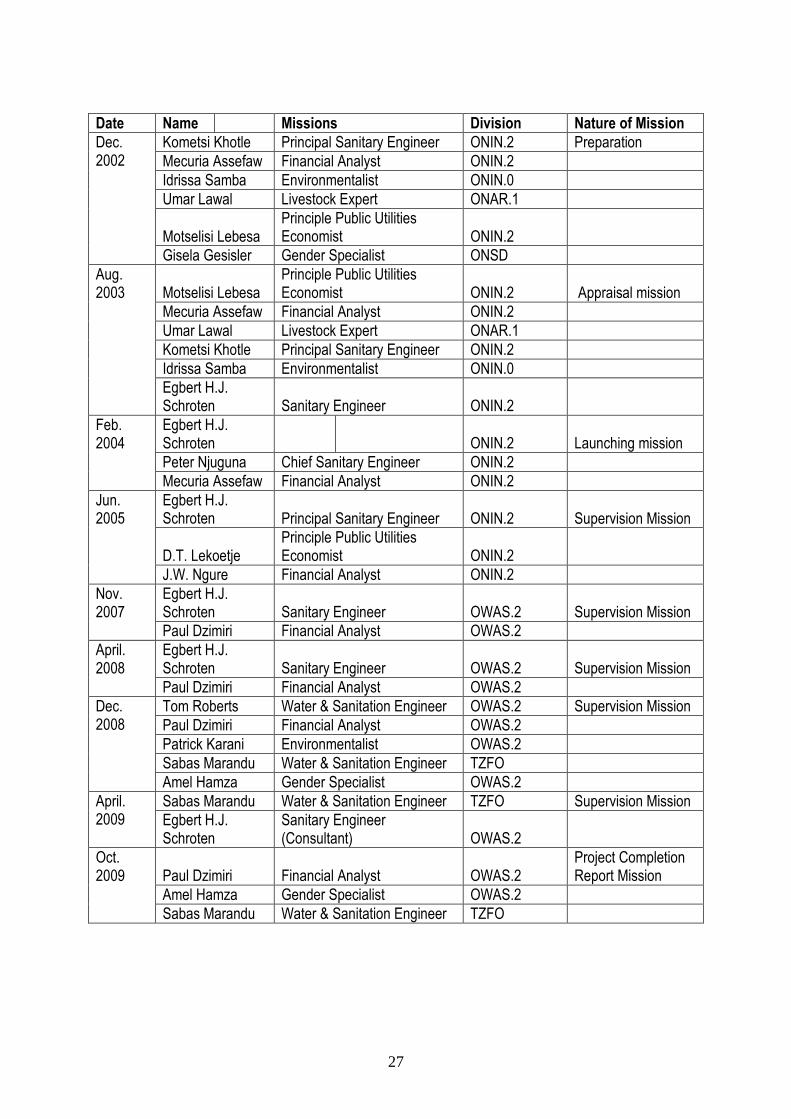
ANNEX 2: BANK INPUTS
Name Position Division 1 Mr. A Bedoumra Director ONIN 3 A. Rakotobe Director ONIN 4 N. Matondo-Fundani Manager ONIN.2 5 Sering Jallow OIC / Manager / Acting Manager OWAS/ ONIN.2 6 Peter Njuguna Chief Sanitary Engineer / Ag. Division Manager ONIN.2 6 Egbert H.J. Schroten Sanitary Engineer ONIN.2 7 D.T. Lekoetje Senior Public Utilities Economist ONIN.2 7 Motselisi Lebesa Principle Public Utilities Economist ONIN.2 8 Idrissa Samba Environmentalist ONIN.0 10 Mecuria Assefaw Financial Analyst ONIN.2 11 Umar Lawal Livestock Expert ONAR.1 12 Gisela Gesisler Gender Specialist ONSD 13 S. Sesay ResRep TZFO 14 S. S. Moyo Res Rep TZFO 15 J.W. Ngure, Financial Analyst ONIN 16 Amel Hamza Gender Specialist OWAS.2 17 Sabas Marandu Water & Sanitation Engineer TZFO 18 Paul Dzimiri Financial Analyst OWAS.2
27
Date Name Missions Division Nature of Mission
Kometsi Khotle Principal Sanitary Engineer ONIN.2 Preparation
Mecuria Assefaw Financial Analyst ONIN.2
Idrissa Samba Environmentalist ONIN.0
Umar Lawal Livestock Expert ONAR.1
Motselisi Lebesa Principle Public Utilities Economist ONIN.2
Dec. 2002
Gisela Gesisler Gender Specialist ONSD
Motselisi Lebesa Principle Public Utilities Economist ONIN.2 Appraisal mission
Mecuria Assefaw Financial Analyst ONIN.2
Umar Lawal Livestock Expert ONAR.1
Kometsi Khotle Principal Sanitary Engineer ONIN.2
Idrissa Samba Environmentalist ONIN.0
Aug. 2003
Egbert H.J. Schroten Sanitary Engineer ONIN.2
Egbert H.J. Schroten ONIN.2 Launching mission
Peter Njuguna Chief Sanitary Engineer ONIN.2
Feb. 2004
Mecuria Assefaw Financial Analyst ONIN.2
Egbert H.J. Schroten Principal Sanitary Engineer ONIN.2 Supervision Mission
D.T. Lekoetje Principle Public Utilities Economist ONIN.2
Jun. 2005
J.W. Ngure Financial Analyst ONIN.2
Egbert H.J. Schroten Sanitary Engineer OWAS.2 Supervision Mission
Nov. 2007
Paul Dzimiri Financial Analyst OWAS.2
Egbert H.J. Schroten Sanitary Engineer OWAS.2 Supervision Mission
April. 2008
Paul Dzimiri Financial Analyst OWAS.2
Tom Roberts Water & Sanitation Engineer OWAS.2 Supervision Mission
Paul Dzimiri Financial Analyst OWAS.2
Patrick Karani Environmentalist OWAS.2
Sabas Marandu Water & Sanitation Engineer TZFO
Dec. 2008
Amel Hamza Gender Specialist OWAS.2
Sabas Marandu Water & Sanitation Engineer TZFO Supervision Mission April. 2009 Egbert H.J.
Schroten Sanitary Engineer (Consultant) OWAS.2
Paul Dzimiri Financial Analyst OWAS.2 Project Completion Report Mission
Amel Hamza Gender Specialist OWAS.2
Oct. 2009
Sabas Marandu Water & Sanitation Engineer TZFO
28
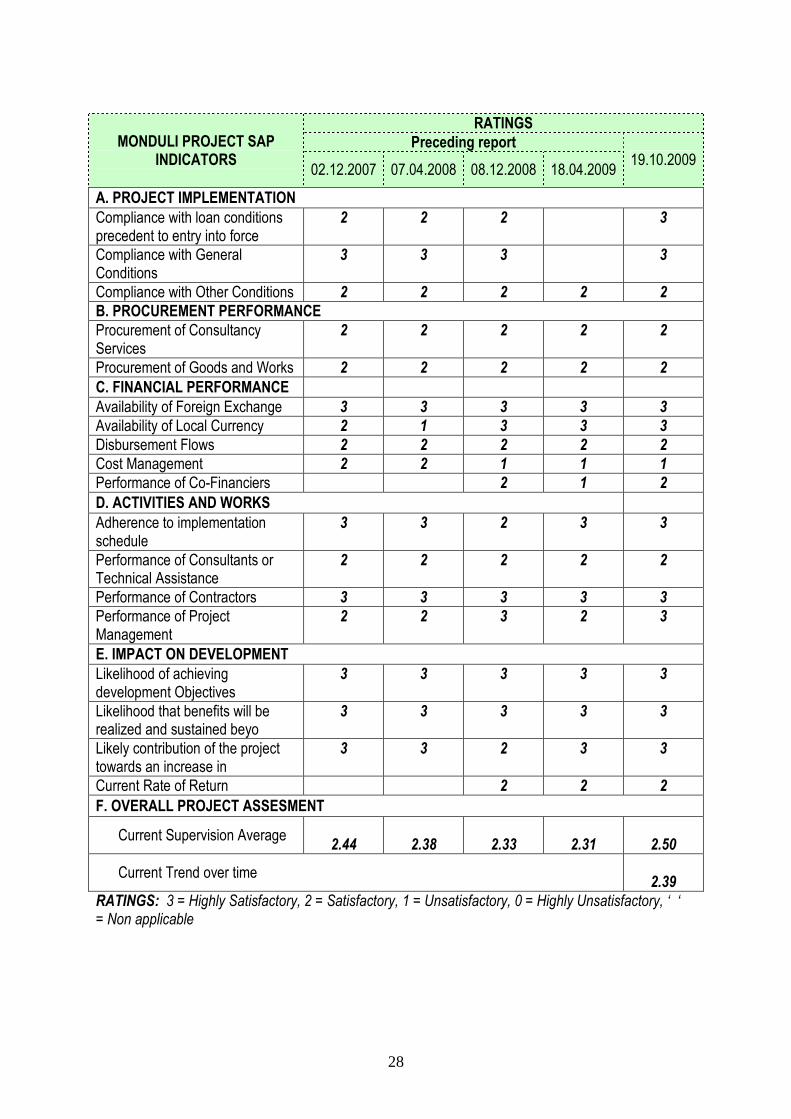
RATINGS
Preceding report
MONDULI PROJECT SAP
INDICATORS
02.12.2007 07.04.2008 08.12.2008 18.04.2009 19.10.2009
A. PROJECT IMPLEMENTATION
Compliance with loan conditions precedent to entry into force
2 2 2 3
Compliance with General Conditions
3 3 3 3
Compliance with Other Conditions 2 2 2 2 2
B. PROCUREMENT PERFORMANCE
Procurement of Consultancy Services
2 2 2 2 2
Procurement of Goods and Works 2 2 2 2 2
C. FINANCIAL PERFORMANCE
Availability of Foreign Exchange 3 3 3 3 3
Availability of Local Currency 2 1 3 3 3
Disbursement Flows 2 2 2 2 2
Cost Management 2 2 1 1 1
Performance of Co-Financiers 2 1 2
D. ACTIVITIES AND WORKS
Adherence to implementation schedule
3 3 2 3 3
Performance of Consultants or Technical Assistance
2 2 2 2 2
Performance of Contractors 3 3 3 3 3
Performance of Project Management
2 2 3 2 3
E. IMPACT ON DEVELOPMENT
Likelihood of achieving development Objectives
3 3 3 3 3
Likelihood that benefits will be realized and sustained beyo
3 3 3 3 3
Likely contribution of the project towards an increase in
3 3 2 3 3
Current Rate of Return 2 2 2
F. OVERALL PROJECT ASSESMENT
Current Supervision Average
2.44
2.38
2.33
2.31
2.50
Current Trend over time
2.39
RATINGS: 3 = Highly Satisfactory, 2 = Satisfactory, 1 = Unsatisfactory, 0 = Highly Unsatisfactory, ‘ ‘ = Non applicable
29
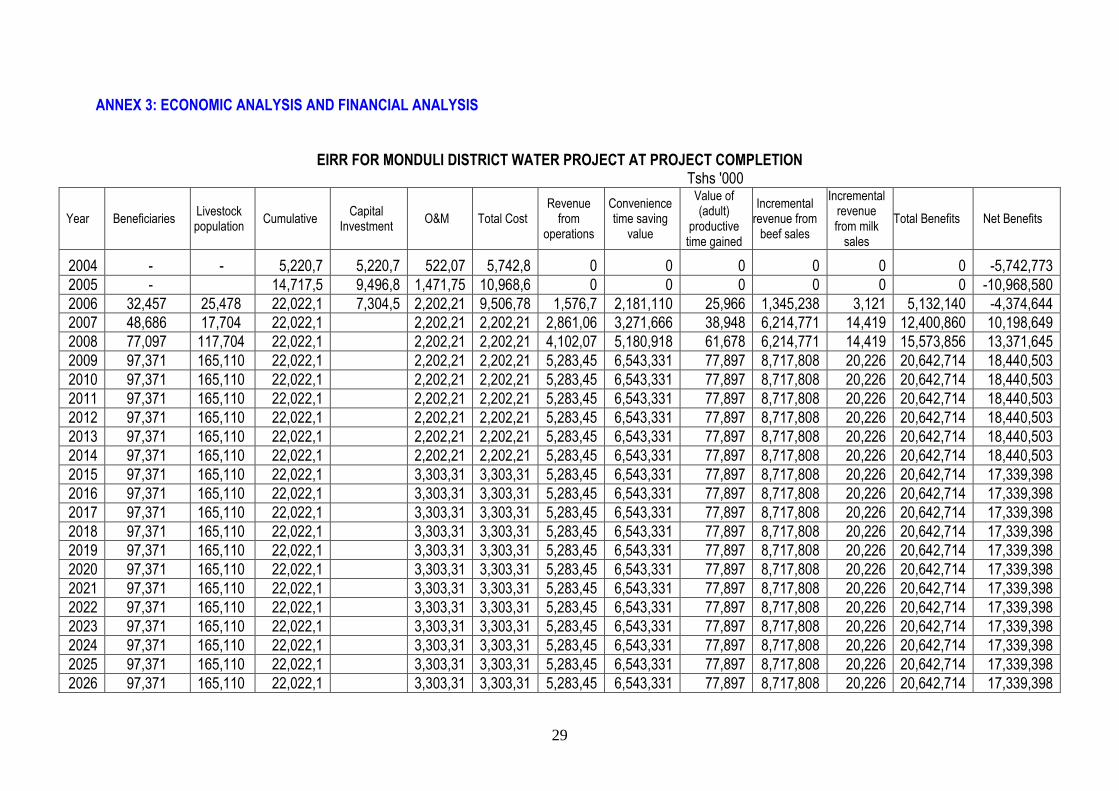
ANNEX 3: ECONOMIC ANALYSIS AND FINANCIAL ANALYSIS
EIRR FOR MONDULI DISTRICT WATER PROJECT AT PROJECT COMPLETION
Tshs '000
Year Beneficiaries Livestock population
Cumulative Capital
Investment O&M Total Cost
Revenue from
operations
Convenience time saving
value
Value of (adult)
productive time gained
Incremental revenue from beef sales
Incremental revenue from milk sales
Total Benefits Net Benefits
2004 - - 5,220,7 5,220,7 522,07 5,742,8 0 0 0 0 0 0 -5,742,773
2005 - 14,717,5 9,496,8 1,471,75 10,968,6 0 0 0 0 0 0 -10,968,580
2006 32,457 25,478 22,022,1 7,304,5 2,202,21 9,506,78 1,576,7 2,181,110 25,966 1,345,238 3,121 5,132,140 -4,374,644
2007 48,686 17,704 22,022,1 2,202,21 2,202,21 2,861,06 3,271,666 38,948 6,214,771 14,419 12,400,860 10,198,649
2008 77,097 117,704 22,022,1 2,202,21 2,202,21 4,102,07 5,180,918 61,678 6,214,771 14,419 15,573,856 13,371,645
2009 97,371 165,110 22,022,1 2,202,21 2,202,21 5,283,45 6,543,331 77,897 8,717,808 20,226 20,642,714 18,440,503
2010 97,371 165,110 22,022,1 2,202,21 2,202,21 5,283,45 6,543,331 77,897 8,717,808 20,226 20,642,714 18,440,503
2011 97,371 165,110 22,022,1 2,202,21 2,202,21 5,283,45 6,543,331 77,897 8,717,808 20,226 20,642,714 18,440,503
2012 97,371 165,110 22,022,1 2,202,21 2,202,21 5,283,45 6,543,331 77,897 8,717,808 20,226 20,642,714 18,440,503
2013 97,371 165,110 22,022,1 2,202,21 2,202,21 5,283,45 6,543,331 77,897 8,717,808 20,226 20,642,714 18,440,503
2014 97,371 165,110 22,022,1 2,202,21 2,202,21 5,283,45 6,543,331 77,897 8,717,808 20,226 20,642,714 18,440,503
2015 97,371 165,110 22,022,1 3,303,31 3,303,31 5,283,45 6,543,331 77,897 8,717,808 20,226 20,642,714 17,339,398
2016 97,371 165,110 22,022,1 3,303,31 3,303,31 5,283,45 6,543,331 77,897 8,717,808 20,226 20,642,714 17,339,398
2017 97,371 165,110 22,022,1 3,303,31 3,303,31 5,283,45 6,543,331 77,897 8,717,808 20,226 20,642,714 17,339,398
2018 97,371 165,110 22,022,1 3,303,31 3,303,31 5,283,45 6,543,331 77,897 8,717,808 20,226 20,642,714 17,339,398
2019 97,371 165,110 22,022,1 3,303,31 3,303,31 5,283,45 6,543,331 77,897 8,717,808 20,226 20,642,714 17,339,398
2020 97,371 165,110 22,022,1 3,303,31 3,303,31 5,283,45 6,543,331 77,897 8,717,808 20,226 20,642,714 17,339,398
2021 97,371 165,110 22,022,1 3,303,31 3,303,31 5,283,45 6,543,331 77,897 8,717,808 20,226 20,642,714 17,339,398
2022 97,371 165,110 22,022,1 3,303,31 3,303,31 5,283,45 6,543,331 77,897 8,717,808 20,226 20,642,714 17,339,398
2023 97,371 165,110 22,022,1 3,303,31 3,303,31 5,283,45 6,543,331 77,897 8,717,808 20,226 20,642,714 17,339,398
2024 97,371 165,110 22,022,1 3,303,31 3,303,31 5,283,45 6,543,331 77,897 8,717,808 20,226 20,642,714 17,339,398
2025 97,371 165,110 22,022,1 3,303,31 3,303,31 5,283,45 6,543,331 77,897 8,717,808 20,226 20,642,714 17,339,398
2026 97,371 165,110 22,022,1 3,303,31 3,303,31 5,283,45 6,543,331 77,897 8,717,808 20,226 20,642,714 17,339,398
30
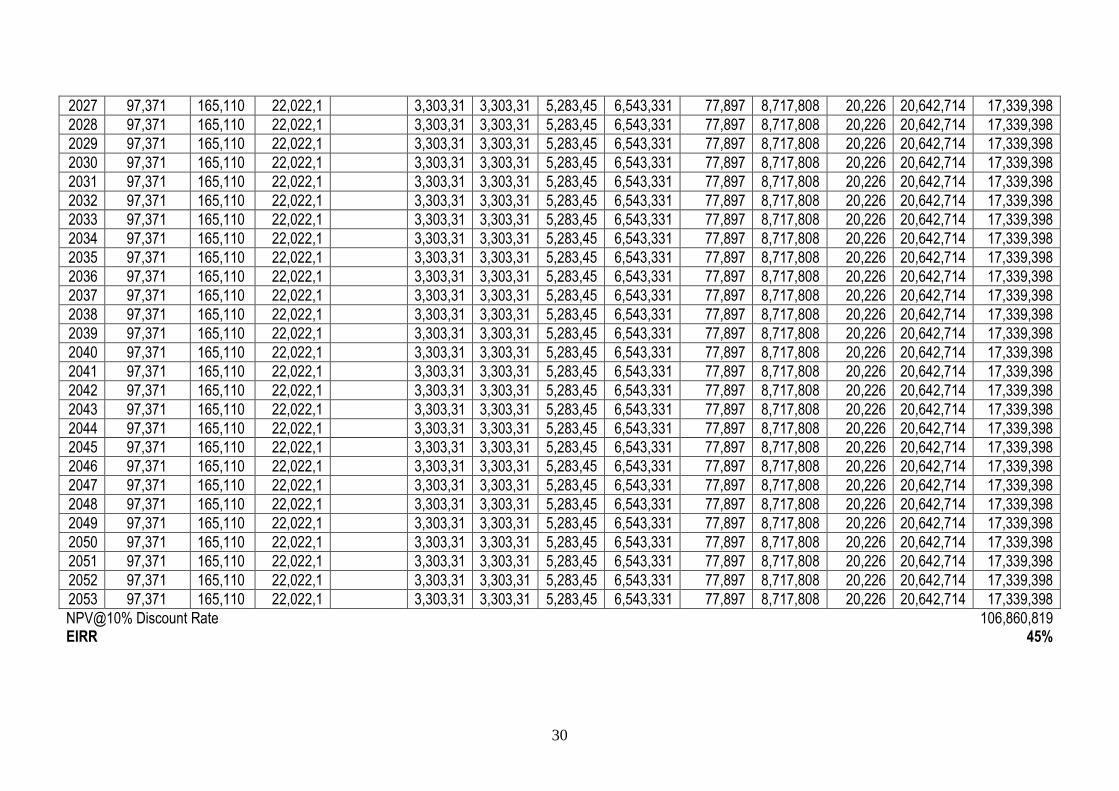
2027 97,371 165,110 22,022,1 3,303,31 3,303,31 5,283,45 6,543,331 77,897 8,717,808 20,226 20,642,714 17,339,398
2028 97,371 165,110 22,022,1 3,303,31 3,303,31 5,283,45 6,543,331 77,897 8,717,808 20,226 20,642,714 17,339,398
2029 97,371 165,110 22,022,1 3,303,31 3,303,31 5,283,45 6,543,331 77,897 8,717,808 20,226 20,642,714 17,339,398
2030 97,371 165,110 22,022,1 3,303,31 3,303,31 5,283,45 6,543,331 77,897 8,717,808 20,226 20,642,714 17,339,398
2031 97,371 165,110 22,022,1 3,303,31 3,303,31 5,283,45 6,543,331 77,897 8,717,808 20,226 20,642,714 17,339,398
2032 97,371 165,110 22,022,1 3,303,31 3,303,31 5,283,45 6,543,331 77,897 8,717,808 20,226 20,642,714 17,339,398
2033 97,371 165,110 22,022,1 3,303,31 3,303,31 5,283,45 6,543,331 77,897 8,717,808 20,226 20,642,714 17,339,398
2034 97,371 165,110 22,022,1 3,303,31 3,303,31 5,283,45 6,543,331 77,897 8,717,808 20,226 20,642,714 17,339,398
2035 97,371 165,110 22,022,1 3,303,31 3,303,31 5,283,45 6,543,331 77,897 8,717,808 20,226 20,642,714 17,339,398
2036 97,371 165,110 22,022,1 3,303,31 3,303,31 5,283,45 6,543,331 77,897 8,717,808 20,226 20,642,714 17,339,398
2037 97,371 165,110 22,022,1 3,303,31 3,303,31 5,283,45 6,543,331 77,897 8,717,808 20,226 20,642,714 17,339,398
2038 97,371 165,110 22,022,1 3,303,31 3,303,31 5,283,45 6,543,331 77,897 8,717,808 20,226 20,642,714 17,339,398
2039 97,371 165,110 22,022,1 3,303,31 3,303,31 5,283,45 6,543,331 77,897 8,717,808 20,226 20,642,714 17,339,398
2040 97,371 165,110 22,022,1 3,303,31 3,303,31 5,283,45 6,543,331 77,897 8,717,808 20,226 20,642,714 17,339,398
2041 97,371 165,110 22,022,1 3,303,31 3,303,31 5,283,45 6,543,331 77,897 8,717,808 20,226 20,642,714 17,339,398
2042 97,371 165,110 22,022,1 3,303,31 3,303,31 5,283,45 6,543,331 77,897 8,717,808 20,226 20,642,714 17,339,398
2043 97,371 165,110 22,022,1 3,303,31 3,303,31 5,283,45 6,543,331 77,897 8,717,808 20,226 20,642,714 17,339,398
2044 97,371 165,110 22,022,1 3,303,31 3,303,31 5,283,45 6,543,331 77,897 8,717,808 20,226 20,642,714 17,339,398
2045 97,371 165,110 22,022,1 3,303,31 3,303,31 5,283,45 6,543,331 77,897 8,717,808 20,226 20,642,714 17,339,398
2046 97,371 165,110 22,022,1 3,303,31 3,303,31 5,283,45 6,543,331 77,897 8,717,808 20,226 20,642,714 17,339,398
2047 97,371 165,110 22,022,1 3,303,31 3,303,31 5,283,45 6,543,331 77,897 8,717,808 20,226 20,642,714 17,339,398
2048 97,371 165,110 22,022,1 3,303,31 3,303,31 5,283,45 6,543,331 77,897 8,717,808 20,226 20,642,714 17,339,398
2049 97,371 165,110 22,022,1 3,303,31 3,303,31 5,283,45 6,543,331 77,897 8,717,808 20,226 20,642,714 17,339,398
2050 97,371 165,110 22,022,1 3,303,31 3,303,31 5,283,45 6,543,331 77,897 8,717,808 20,226 20,642,714 17,339,398
2051 97,371 165,110 22,022,1 3,303,31 3,303,31 5,283,45 6,543,331 77,897 8,717,808 20,226 20,642,714 17,339,398
2052 97,371 165,110 22,022,1 3,303,31 3,303,31 5,283,45 6,543,331 77,897 8,717,808 20,226 20,642,714 17,339,398
2053 97,371 165,110 22,022,1 3,303,31 3,303,31 5,283,45 6,543,331 77,897 8,717,808 20,226 20,642,714 17,339,398
NPV@10% Discount Rate 106,860,819 EIRR 45%
31
Sensitivity Analysis
If the Operation and Maintenance costs are increased from 10% for the first 10 years to 12% and from 15% from the 11th year to even 17%, the project will still
have an EIRR of 42% and a positive NPV of Tshs 98.82 billion.
If the Non Revenue Water is increased to 42%, the project will still have an EIRR of 44% and NPV value of Tshs 102.76 billion.
This shows that the project’s economic return to the project beneficiaries in Monduli are exceedingly high and is likely to have a long term, sustainable economic
benefits to the communities in the project area.
Major Assumptions
1. An average Adult time gained due to less diarrheal illness of 2 days per annum is assumed;
2. An minimum wage of Tshs 80 000.00 per month is assumed; and
3. An average productive time gained due to less diarrheal illness gained will be about 6 hours.
32
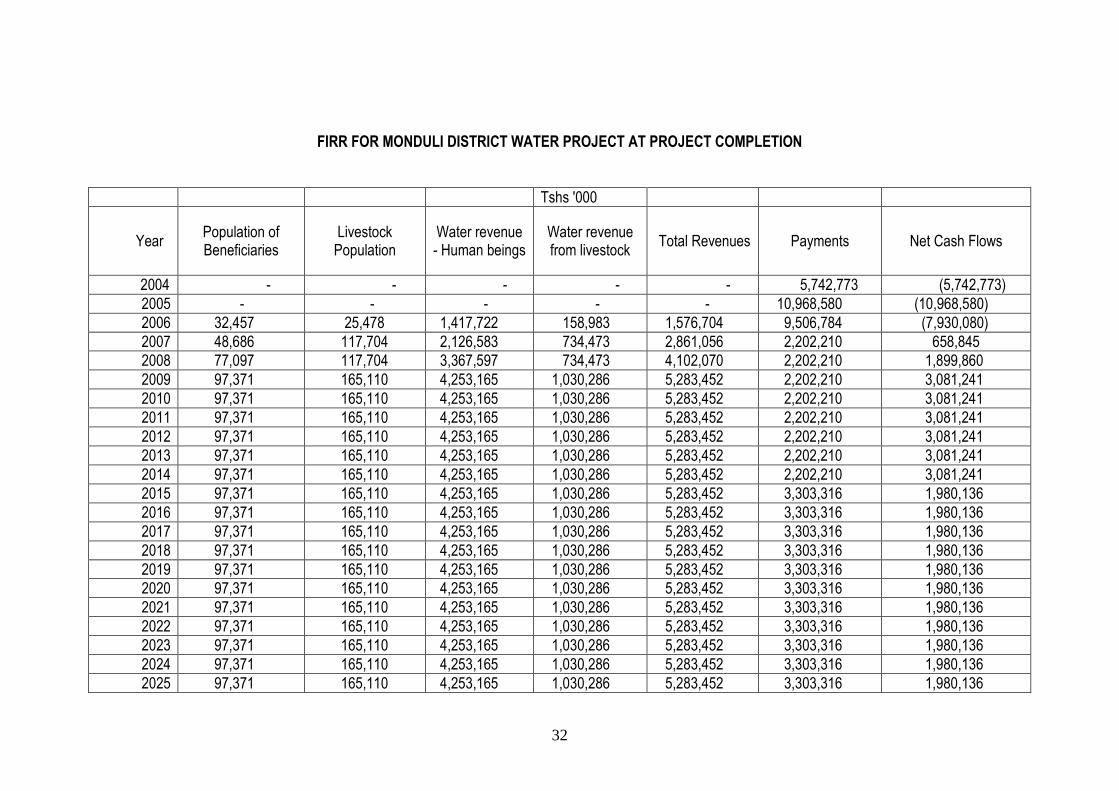
FIRR FOR MONDULI DISTRICT WATER PROJECT AT PROJECT COMPLETION
Tshs '000
Year Population of Beneficiaries
Livestock Population
Water revenue - Human beings
Water revenue from livestock
Total Revenues Payments Net Cash Flows
2004 - - - - - 5,742,773 (5,742,773)
2005 - - - - - 10,968,580 (10,968,580)
2006 32,457 25,478 1,417,722 158,983 1,576,704 9,506,784 (7,930,080)
2007 48,686 117,704 2,126,583 734,473 2,861,056 2,202,210 658,845
2008 77,097 117,704 3,367,597 734,473 4,102,070 2,202,210 1,899,860
2009 97,371 165,110 4,253,165 1,030,286 5,283,452 2,202,210 3,081,241
2010 97,371 165,110 4,253,165 1,030,286 5,283,452 2,202,210 3,081,241
2011 97,371 165,110 4,253,165 1,030,286 5,283,452 2,202,210 3,081,241
2012 97,371 165,110 4,253,165 1,030,286 5,283,452 2,202,210 3,081,241
2013 97,371 165,110 4,253,165 1,030,286 5,283,452 2,202,210 3,081,241
2014 97,371 165,110 4,253,165 1,030,286 5,283,452 2,202,210 3,081,241
2015 97,371 165,110 4,253,165 1,030,286 5,283,452 3,303,316 1,980,136
2016 97,371 165,110 4,253,165 1,030,286 5,283,452 3,303,316 1,980,136
2017 97,371 165,110 4,253,165 1,030,286 5,283,452 3,303,316 1,980,136
2018 97,371 165,110 4,253,165 1,030,286 5,283,452 3,303,316 1,980,136
2019 97,371 165,110 4,253,165 1,030,286 5,283,452 3,303,316 1,980,136
2020 97,371 165,110 4,253,165 1,030,286 5,283,452 3,303,316 1,980,136
2021 97,371 165,110 4,253,165 1,030,286 5,283,452 3,303,316 1,980,136
2022 97,371 165,110 4,253,165 1,030,286 5,283,452 3,303,316 1,980,136
2023 97,371 165,110 4,253,165 1,030,286 5,283,452 3,303,316 1,980,136
2024 97,371 165,110 4,253,165 1,030,286 5,283,452 3,303,316 1,980,136
2025 97,371 165,110 4,253,165 1,030,286 5,283,452 3,303,316 1,980,136
33
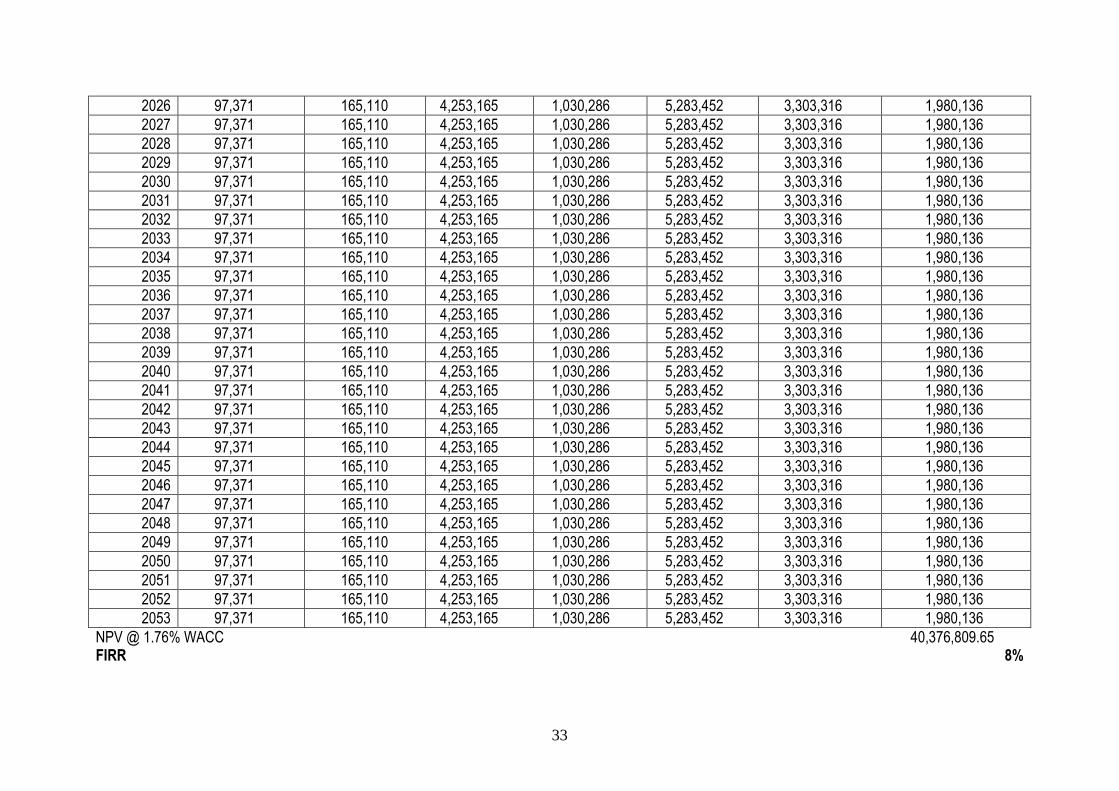
2026 97,371 165,110 4,253,165 1,030,286 5,283,452 3,303,316 1,980,136
2027 97,371 165,110 4,253,165 1,030,286 5,283,452 3,303,316 1,980,136
2028 97,371 165,110 4,253,165 1,030,286 5,283,452 3,303,316 1,980,136
2029 97,371 165,110 4,253,165 1,030,286 5,283,452 3,303,316 1,980,136
2030 97,371 165,110 4,253,165 1,030,286 5,283,452 3,303,316 1,980,136
2031 97,371 165,110 4,253,165 1,030,286 5,283,452 3,303,316 1,980,136
2032 97,371 165,110 4,253,165 1,030,286 5,283,452 3,303,316 1,980,136
2033 97,371 165,110 4,253,165 1,030,286 5,283,452 3,303,316 1,980,136
2034 97,371 165,110 4,253,165 1,030,286 5,283,452 3,303,316 1,980,136
2035 97,371 165,110 4,253,165 1,030,286 5,283,452 3,303,316 1,980,136
2036 97,371 165,110 4,253,165 1,030,286 5,283,452 3,303,316 1,980,136
2037 97,371 165,110 4,253,165 1,030,286 5,283,452 3,303,316 1,980,136
2038 97,371 165,110 4,253,165 1,030,286 5,283,452 3,303,316 1,980,136
2039 97,371 165,110 4,253,165 1,030,286 5,283,452 3,303,316 1,980,136
2040 97,371 165,110 4,253,165 1,030,286 5,283,452 3,303,316 1,980,136
2041 97,371 165,110 4,253,165 1,030,286 5,283,452 3,303,316 1,980,136
2042 97,371 165,110 4,253,165 1,030,286 5,283,452 3,303,316 1,980,136
2043 97,371 165,110 4,253,165 1,030,286 5,283,452 3,303,316 1,980,136
2044 97,371 165,110 4,253,165 1,030,286 5,283,452 3,303,316 1,980,136
2045 97,371 165,110 4,253,165 1,030,286 5,283,452 3,303,316 1,980,136
2046 97,371 165,110 4,253,165 1,030,286 5,283,452 3,303,316 1,980,136
2047 97,371 165,110 4,253,165 1,030,286 5,283,452 3,303,316 1,980,136
2048 97,371 165,110 4,253,165 1,030,286 5,283,452 3,303,316 1,980,136
2049 97,371 165,110 4,253,165 1,030,286 5,283,452 3,303,316 1,980,136
2050 97,371 165,110 4,253,165 1,030,286 5,283,452 3,303,316 1,980,136
2051 97,371 165,110 4,253,165 1,030,286 5,283,452 3,303,316 1,980,136
2052 97,371 165,110 4,253,165 1,030,286 5,283,452 3,303,316 1,980,136
2053 97,371 165,110 4,253,165 1,030,286 5,283,452 3,303,316 1,980,136
NPV @ 1.76% WACC 40,376,809.65 FIRR 8%
34
Sensitivity Analysis If the NRW is increased to 42%, the project will still have an FIRR of 6% and NPV value of Tshs 23.4 billion. If the Operation and Maintenance costs are increased from 10% for the first 10 years to 12% and from 15% from the 11th year to even 17%, the project will still have an FIRR of 4% and a positive NPV of Tshs 9.3 billion. This shows that the project has a strong likelihood of financial sustainable due to the voluntary willingness of water users to pay for the water for their lives and that of their livestock. Major Assumptions 1. Water will be sold at an average tariff of Tshs 20.00 for 20 litres of water; 2. A water billing collection efficiency of 65% will be maintained; 3. An off-take rate of 10% will be maintained and average weight of 120kg will be realized; 4. Milk will be sold at an average price of Tshs 700.00 per litre; 5. Beef will be sold at an average price of Tshs 4 400.00 per kilogram; 6. Cows comprise 60% of all cattle and only 50% of these are milk cows; 7. Operation and Maintenance costs will be 10% of Investment cost in the first 10 years and will increase to about 15% thereafter.

35
ANNEX 4 - SUMMARY OF PROCUREMENT
This annex summarizes the number and value of contracts financed by the loan, broken down by procurement method (ICB, LCB, Turnkey, etc.)
CONSULTANCY SERVICE CONTRACTS PROJECTMANAGEMENT SUPPORT AND TRAINING
SERVICES IN CONSTRUCTION SUPERVISION
COMMUNITY MANAGEMENT AND ENVIRONMENTAL
SERVICES
PROJECT AUDITING
Date of Tender July,2004 July,2004 July,2004 October,2005
Original Contract Value (excl VAT) USD. 1,035,900 USD.722,100 912,632 Tshs. 21,445,000
Company NORPLAN A.S. with Don Consult Ltd NORPLAN A.S. with Don Consult Ltd
NINHAM SHAND (PTY) LTD / CODA AND PARTNERS
FINANCIAL CONSULTANTS & SERVICES
Procurement Mode (Appraisal) ICB ICB ICB ICB
Actual Mode of Procurement ICB ICB ICB ICB
CIVIL WORKS CONTRACTS
CONSTRUCTION OF WATER SUPPLY SCHEMES - KISONGO
CONSTRUCTION OF WATER SUPPLY SCHEMES - MANYARA
CONSTRUCTION OF WATER SUPPLY SCHEMES - LONGIDO
Date of Tender February,2005 February,2005 February,2005
Original Contract Value (Excluding VAT) Tshs. 10,182,287,870 Tshs. 10,488,788,708 Tshs. 5,175,179,000
Company M/S Sinohydro Corporation M/S China Geo – Engineering M/S Jandu Plumbers Limited
Procurement Mode (Appraisal) ICB ICB ICB
Procurement Mode (Actual) ICB ICB ICB
GOODS CONTRACTS TWO (2) 4 WD STATION
WAGON HARD TOP
TWO (2) 4 WD DOUBLE CABIN
PICKUPS
TWENTY (20) MOT OR CYCLES
TWO (2) PHOTOCOPIERS & ONE FAX MACHINE
11 DESKTOP COMPUTERS & LAPTOPS AND ACCESSORIES
14 COMPUTER SETS
Date of Tender July,2005 July,2005 July,2005 March,2005 August,2006 March,2005
Orig. Contract Value YEN 7,758,968.56 USD .45,766.59 USD. 68,800.00 USD 4,807.00 USD 32,567.09 USD 37,939.59
Company Toyota Tanzania Toyota Tanzania Quality Motors Tanz
Office Solutions Business Machines Office Solutions
Procurement (Appraisal) NCB NCB NCB NCB NCB NCB
Procurement (Actual) NCB NCB NCB NCB NCB NCB
ANNEX 5: LIST OF SUPPORTING DOCUMENTS
1. Appraisal Report of the Monduli Water Supply and Sanitation Project, AfDB September 2003; 2. Quarterly Progress Reports; 3. Project Completion Report, Monduli District Council, June 2009; 4. Project Completion Report – Annexes and Detailed information, Monduli District Council, June 2009 5. Bank Supervision Reports; 6. Audited Project Accounts 7. MOWSSP - Consultant Completion Report, KISONGO ZONE, 8. MOWSSP- Consultant Completion Report, LONGIDO ZONE 9. MOWSSP Consultant Completion Report, MANYARA ZONE
ANNEX 6 - PROJECT NARRATIVE Project Background a) A Project Study, financed by the Bank was completed in August 2002, comprising: (i) project feasibility (ii )
socio economic review (iii)environmental and social impact assessment (iv ) detailed design of priority sub projects and (iii) institutional review.
b) Bank Preparation and Appraisal missions were conducted in 2003. They confirmed the Project’s viability and
identified complementary components to enhance Project benefits. c) The Project supports the broader goal of poverty reduction, improved health and rural development. It was
approved on the strength of its economic and social benefits. Inadequate access to water is a major constraint to Tanzania’s economic development and social well being, particularly in arid, livestock regions like the Project district, where drastic scarcity of safe water also aggravates the sanitation situation.
Project Results and Impact d) The Project is now providing functional water systems in 18 villages and two district towns, serving 97 371
people and more than 165,110 livestock, which is in excess of the envisaged quantum at Appraisal. Capacity building including training of communities on operation of the water systems, sanitation improvement and environmental and watershed protection activities were carried out.
e) Villagers in Longido Zone, informed the Bank Project Completion mission in October 2009, that the recent
drying of springs due to the excessive drought would have forced them to abandon their habitats due to lack of water, if new borehole water sources had not been availed by the Project. In addition, businesses at Namanga border town have been relying on water from the Project. In the past, many livestock in the area used to die due to lack of water but such deaths have now been substantially mitigated by the Project.
f) While sustainability has been potentially problematic in Tanzania, the mission noted that all Water User Associations in the Project areas now maintain bank accounts and some of these have balances well in excess of Tshs. 12 million collected in the last twelve months or so.
Project Implementation g) The Project was approved on 27 November 2003 and the Grant was signed on 10 February 2004. The
Government fulfilled the Grant conditions within 5 moths and the Project became effective on 14th July 2004.
37
h) The project was scheduled to be completed by December 2008. In practice, it was closed in June 2009. There was a slippage of 6 months, mainly due to delays in the disbursement of Government contribution and commitments.
i) The Government committed to meet its 10 % contribution, plus cost overruns incurred during implementation.
However Government disbursements were delayed, causing cash flow constraints to the contractors. It also affected implementation of some of the environmental and watershed protection measures. At the time of Project closure in June 2009, the Government was still owed Tshs 3,671,800,046 (UA 1,806,099).
j) Project cost overruns included (i) extra cost due to bid prices being above the allocated budget, which the
Government committed to pay (ii) extra cost due to BOQ revisions by the EA and (iii) interest due to delayed payments.
k) Tendering, through international competitive bidding, for the three major civil works contracts, commenced in
February 2005 and the works contracts were awarded in October 2005. The tender prices for the three major works contracts amounted to UA 15,421,026 which exceeded the original budget of UA 9,935,319 for the works.
l) In a letter of 14 July 2005, the Tanzania Government confirmed that the cost overruns arising from the bid
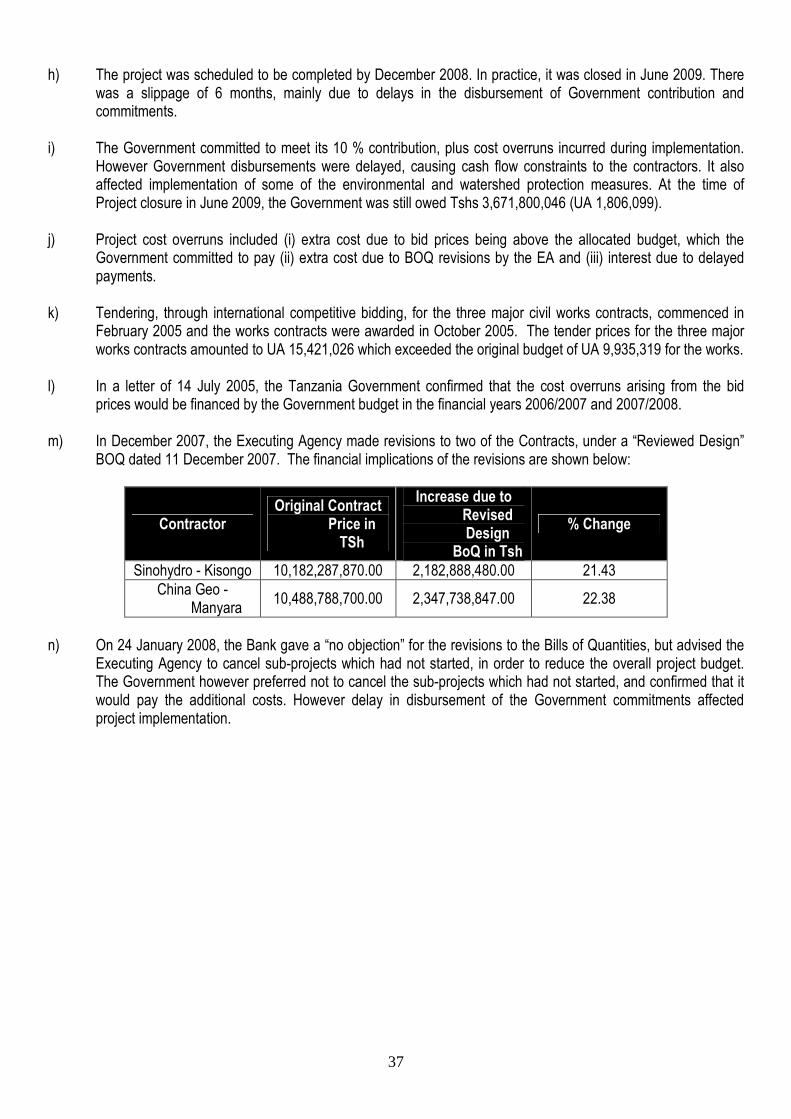
prices would be financed by the Government budget in the financial years 2006/2007 and 2007/2008. m) In December 2007, the Executing Agency made revisions to two of the Contracts, under a “Reviewed Design”
BOQ dated 11 December 2007. The financial implications of the revisions are shown below:
Contractor Original Contract
Price in TSh
Increase due to Revised Design
BoQ in Tsh
% Change
Sinohydro - Kisongo 10,182,287,870.00 2,182,888,480.00 21.43
China Geo - Manyara
10,488,788,700.00 2,347,738,847.00 22.38
n) On 24 January 2008, the Bank gave a “no objection” for the revisions to the Bills of Quantities, but advised the
Executing Agency to cancel sub-projects which had not started, in order to reduce the overall project budget. The Government however preferred not to cancel the sub-projects which had not started, and confirmed that it would pay the additional costs. However delay in disbursement of the Government commitments affected project implementation.
38
Unforeseen Factors during Implementation o) Some project components were damaged by landslides during early 2008, and had to be reconstructed. Accomplishments and Outstanding Matters p) The following were achieved at Project Closure in June 2009:
• Water infrastructure: comprising: 10 intakes, 25 dams, 22 boreholes, 229 km of pipelines, 26 elevated storage tanks, 30 ground storage tanks, 18 pump houses, 29 break pressure tanks, 153 domestic points and 77 cattle troughs.
• Capacity building including training of community water and sanitation committees on operation of the water systems. All the 18 village subprojects have Facilities Management Plans and are manned by registered Water User Associations.
• Sanitation enhancement in all project areas through: (i) creation of community awareness and sensitization on sanitation and health issues, based on the findings of a sanitation survey of the district, followed by (ii ) construction of demonstration latrines, hand washing facilities, small slow sand filter systems, dish drying rack, water storage jars and rubbish pits in all subproject areas and ( iii ) training of artisans.
• Procurement of goods including 4 vehicles, 20 motorcycles, 25 computers, 6 laptops and other equipment.
• Environmental and water shed protection strategies, including (i) development of a catchment conservation plan, (ii) activation of village environmental committees, (iii) demarcation of some forest areas and their protection through by–Laws (iv) zoning of five dam catchments for intensive conservation and (v) formulation of by-Laws for environmental protection in the villages.
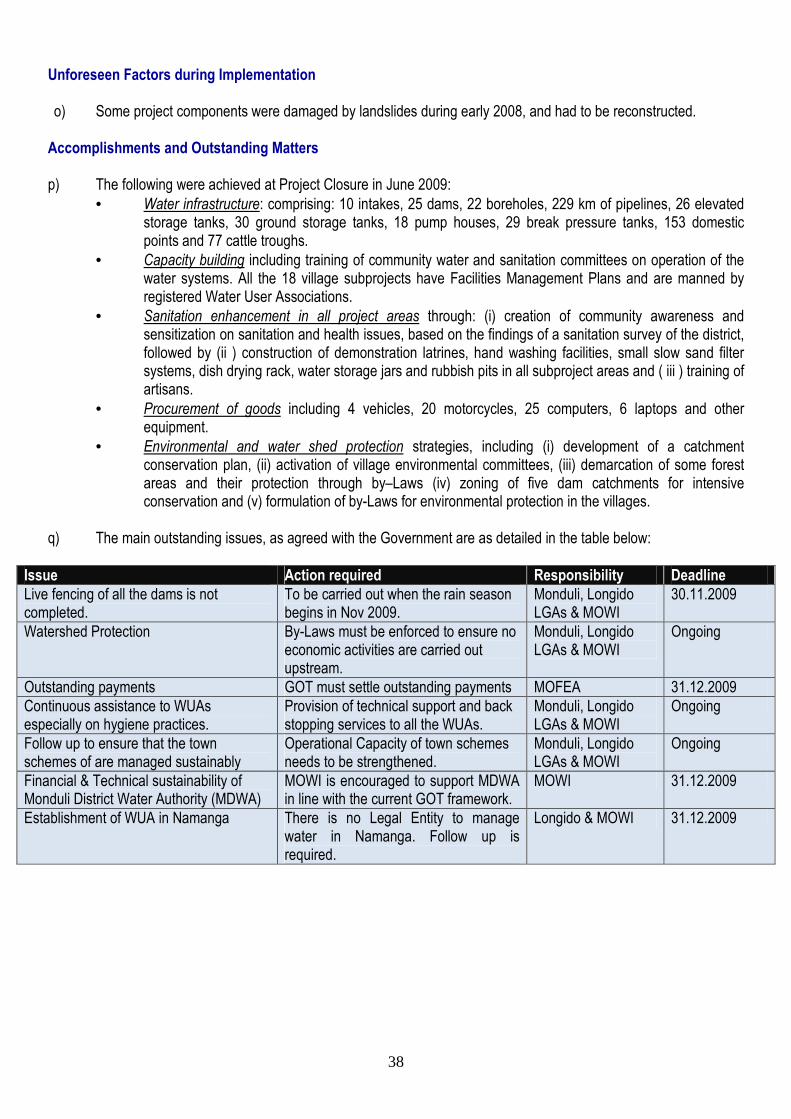
q) The main outstanding issues, as agreed with the Government are as detailed in the table below:
Issue Action required Responsibility Deadline
Live fencing of all the dams is not completed.
To be carried out when the rain season begins in Nov 2009.
Monduli, Longido LGAs & MOWI
30.11.2009
Watershed Protection By-Laws must be enforced to ensure no economic activities are carried out upstream.
Monduli, Longido LGAs & MOWI
Ongoing
Outstanding payments GOT must settle outstanding payments MOFEA 31.12.2009
Continuous assistance to WUAs especially on hygiene practices.
Provision of technical support and back stopping services to all the WUAs.
Monduli, Longido LGAs & MOWI
Ongoing
Follow up to ensure that the town schemes of are managed sustainably
Operational Capacity of town schemes needs to be strengthened.
Monduli, Longido LGAs & MOWI
Ongoing
Financial & Technical sustainability of Monduli District Water Authority (MDWA)
MOWI is encouraged to support MDWA in line with the current GOT framework.
MOWI 31.12.2009
Establishment of WUA in Namanga There is no Legal Entity to manage water in Namanga. Follow up is required.
Longido & MOWI 31.12.2009
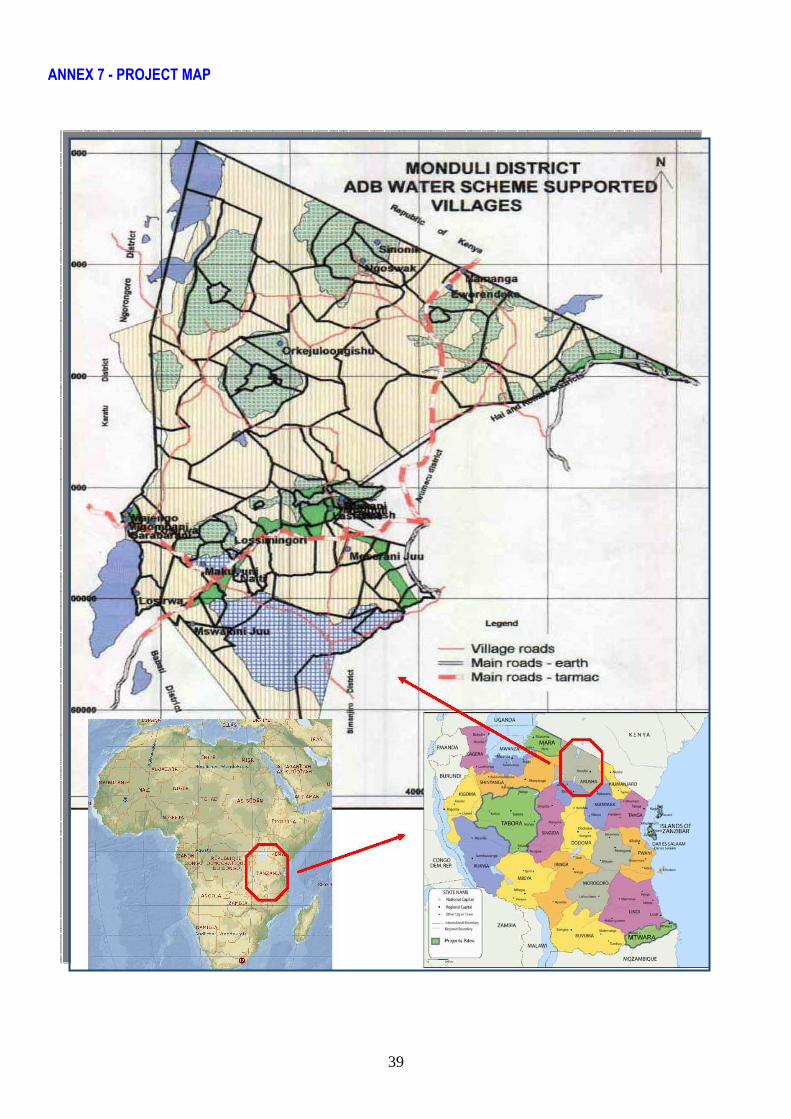
39
ANNEX 7 - PROJECT MAP