Embed Size (px)
Citation preview
LANGUAGE COMPREHENSION AS AN EFFECT OF AGING AND HAND PREFERENCE USING THE COMPUTERIZED REVISED TOKEN TEST-READING-
WORD FADE
by
Ashley J. Byrne
B.A. in Communication Science and Disorders, University of Pittsburgh, 2015
Submitted to the Graduate Faculty of
The School of Health and Rehabilitation Sciences in partial fulfillment
of the requirements for the degree of
Master of Science in Communication Science and Disorders
University of Pittsburgh
2017
ii
UNIVERSITY OF PITTSBURGH
SCHOOL OF HEALTH AND REHABILITATION SCIENCES
This thesis was presented
by
Ashley J. Byrne
It was defended on
May 23, 2017
and approved by
J. Scott Yaruss, PhD, Associate Professor, Department of Communication Science and
Disorders
Thesis Director: Malcolm R. McNeil, PhD, Distinguished Service Professor, Department of
Communication Science and Disorders
Thesis Director: Sheila R. Pratt, PhD, Professor, Department of Communication Science and
Disorders

iii
Copyright © by Ashley J. Byrne
2017
iv
Aims: The Computerized Revised Token Test (CRTT) is a standardized assessment of language
comprehension and processing abilities. The CRTT-Reading-Word-Fade (CRTT-R-WF) is a self-
paced version of the CRTT in which the previous word in a sentence disappears with the onset of
each new word. In addition to the language skills needed to complete the assessment, the CRTT
also requires perceptual-motor and cognitive capabilities that have the potential to negatively
influence participant results. The purpose of this study was to investigate the effect of age and
hand preference as two of these potential influences on CRTT performance.
Methods: Sixty-four healthy, normal adults participated in this study. Participants were divided
into two groups: younger adults (Group 1, 20-32 years) and older adults (Group 2, 65-78 years).
Each group consisted of 32 participants (16 males and 16 females). All 64 participants completed
the CRTT-R-WF version of the CRTT and CRTT-RT battery with both their right and left hand.
The CRTT-R-WF mean scores, efficiency scores, and reading times were investigated to evaluate
the effects of age and hand preference on the accuracy and efficiency of participant responses.
Results: Statistically significant main effects were observed for both age and hand use on CRTT-
R-WF mean scores, efficiency scores, and reading plus response times. The older adults
demonstrated significantly lower mean and efficiency scores, as well as significantly slower
reading times. Mean scores, efficiency scores and reading plus response times achieved with the
left hand were also significantly lower and slower than the right hand across participants.
LANGUAGE COMPREHENSION AS AN EFFECT OF AGING AND HAND
PREFERENCE USING THE COMPUTERIZED REVISED TOKEN TEST-
READING-WORD FADE
Ashley J. Byrne, M.S.
v
Significant interactions between age and hand were found on CRTT-R-WF mean and efficiency
scores. The older adult’s mean and efficiency scores were over-additively reduced with their left
hand.
Discussion: Decreased comprehension and efficiency of responses, as measured by the CRTT-R-
WF, were observed with age and with non-preferred hand use with a computer mouse. Slower
reading plus response times were also observed as an effect of age. Theories of working
memory, processing speed, and resource allocation were discussed as possible explanations as to
why these results were observed.
vi
TABLE OF CONTENTS
PREFACE .................................................................................................................................... XI
1.0 INTRODUCTION ........................................................................................................ 1
1.1 BACKGROUND .................................................................................................. 2
1.1.1 Revised Token Test (RTT) .............................................................................. 3
1.1.2 Aging Theories on Cognition and Language ................................................. 5
1.1.3 Aging and Reading Comprehension .............................................................. 9
1.1.4 Cognitive Aging, Motor Performance, and Hand Preference ................... 11
1.2 EXPERIMENTAL QUESTIONS AND HYPOTHESIS ................................ 13
2.0 METHODS ................................................................................................................. 16
2.1 PARTICIPANTS ............................................................................................... 16
2.1.1 Inclusionary Criterion and Preliminary Procedures ................................. 17
2.2 PROTOCOL ...................................................................................................... 19
2.2.1 Computerized Revised Token Test – Reading – Word Fade ..................... 20
2.2.2 Computerized Revised Token Test – Reaction Time Battery ................... 24
3.0 RESULTS ................................................................................................................... 25
3.1 STATISTICAL ANALYSIS ............................................................................. 25
3.1.1 Mean CRTT-R-WF Scores ............................................................................. 25
3.1.2 CRTT-R-WF Efficiency Scores ...................................................................... 28
vii
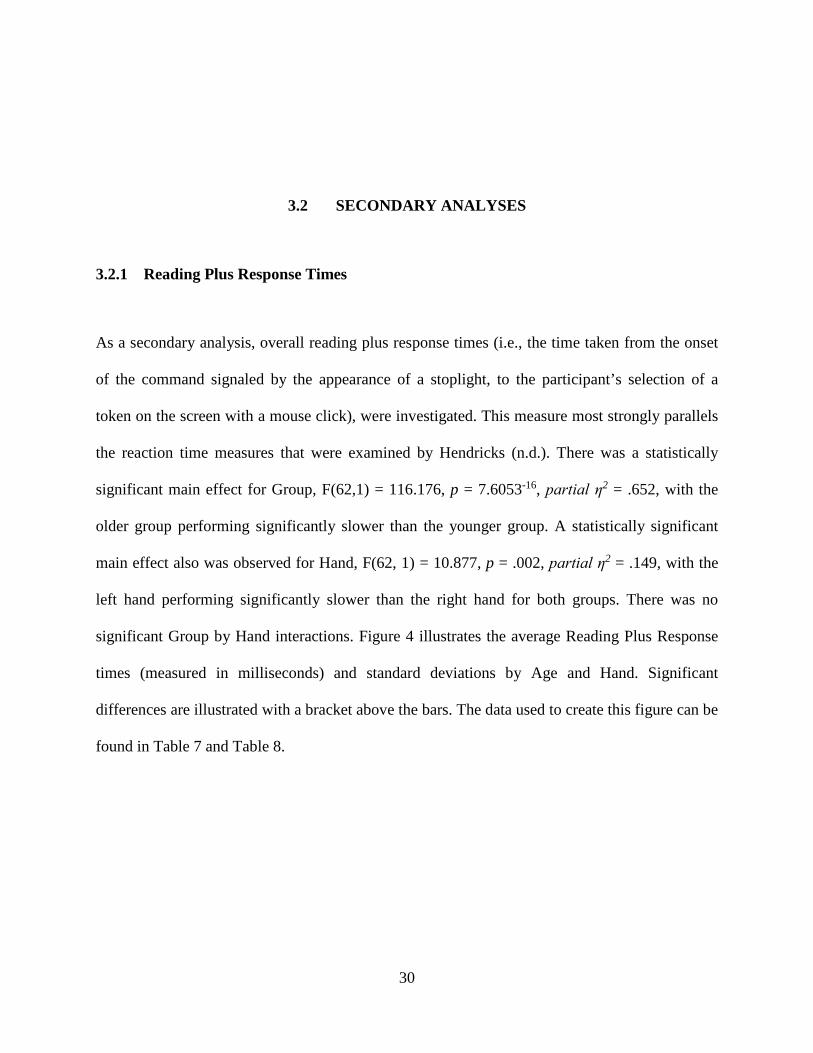
3.2 SECONDARY ANALYSES .............................................................................. 30
3.2.1 Reading Plus Response Times ...................................................................... 30
3.2.2 Sex Differences ............................................................................................... 34
3.3 BRINLEY PLOT ............................................................................................... 34
4.0 DISCUSSION ............................................................................................................. 36
4.1 AGING ................................................................................................................ 36
4.2 HAND USE ......................................................................................................... 38
4.3 READING PLUS RESPONSE TIMES ........................................................... 39
5.0 LIMITATIONS AND OBSERVATIONS ................................................................ 42
5.1 STUDY LIMITATIONS ................................................................................... 42
5.2 OBSERVATIONS FOR FURTURE RESEARCH......................................... 43
6.0 SUMMARY AND CONCLUSION ........................................................................... 45
APPENDIX A : DEMOGRAPHICS ......................................................................................... 47
APPENDIX B : CRTT-RT BATTERY TASK DESCRIPTIONS AND DATA .................... 64
APPENDIX C : SUBJECT HISTORY FORM ........................................................................ 67
APPENDIX D : EDINBURGH HANDEDNESS INVENTORY ............................................ 69
BIBLIOGRAPHY ....................................................................................................................... 71
viii
LIST OF TABLES
Table 1: CRTT Scoring Categories – Adaption (Eberwein et al., 2008) ...................................... 22
Table 2: Total Number of Commands Removed Per Subtest (Combined Right and Left Hands) 23
Table 3: Older Group Average Mean CRTT-R-WF Scores and Standard Deviations by Subtest
and Hand ....................................................................................................................................... 27
Table 4: Younger Group Average Mean CRTT-R-WF Scores and Standard Deviations by Subtest
and Hand ....................................................................................................................................... 27
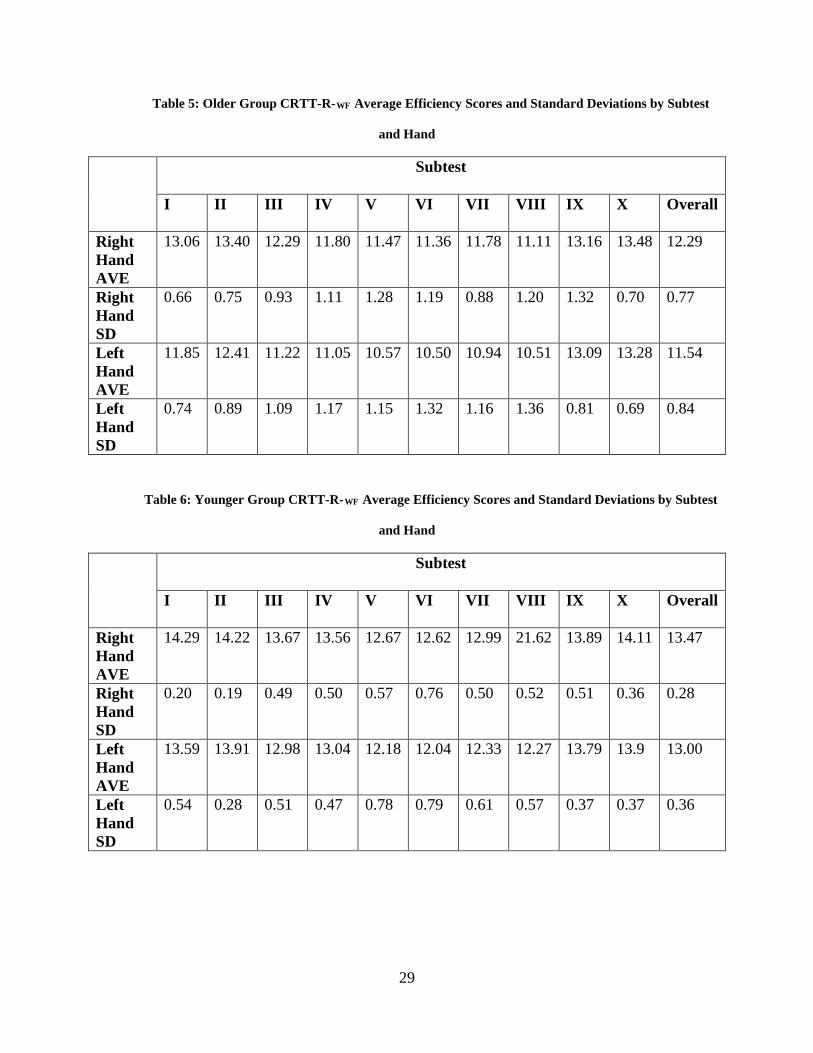
Table 5: Older Group CRTT-R-WF Average Efficiency Scores and Standard Deviations by
Subtest and Hand .......................................................................................................................... 29
Table 6: Younger Group CRTT-R-WF Average Efficiency Scores and Standard Deviations by
Subtest and Hand .......................................................................................................................... 29
Table 7: Older Group CRTT-R-WF Average Reading Plus Response Times (msec) and Standard
Deviations by Subtest and Hand ................................................................................................... 31
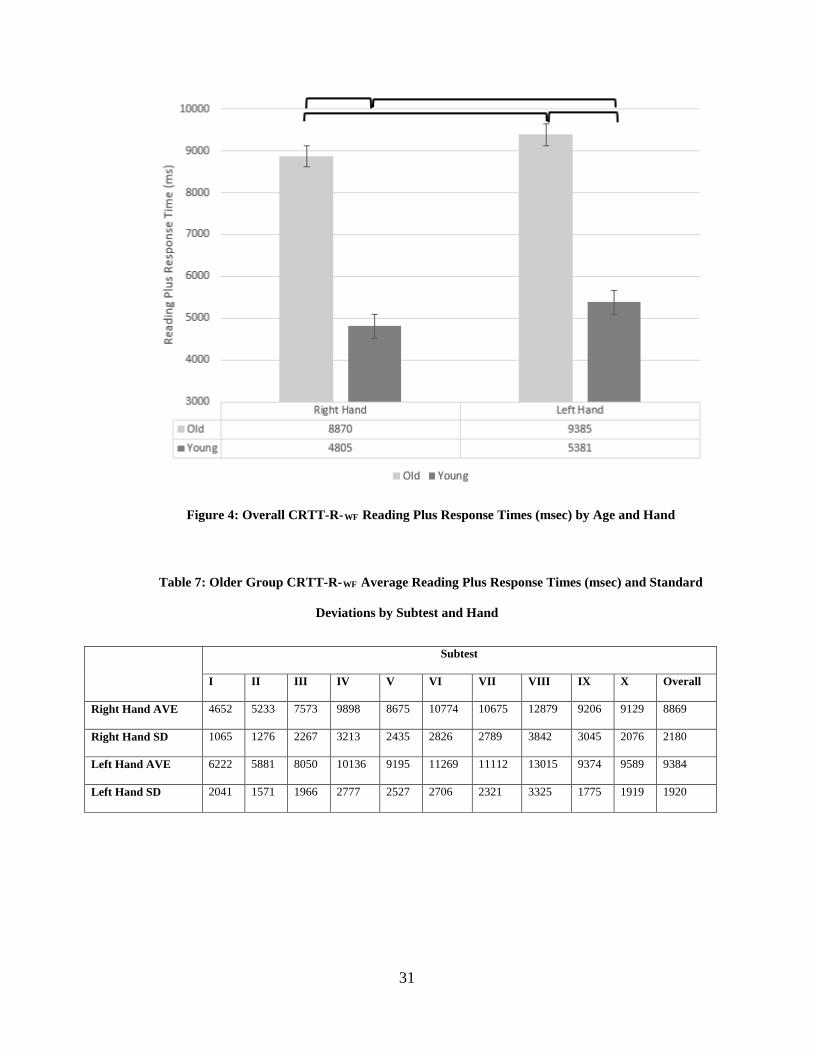
Table 8: Younger Group CRTT-R-WF Average Reading Plus Response Times (msec) and
Standard Deviations by Subtest and Hand .................................................................................... 32
Table 9: Paired t-tests to Examine Subtest by Hand Effects ........................................................ 33
Table 10: Younger Group Participant Demographics (Based on Subject History Questionnaire)47
Table 11: Older Group Participant Demographics (Based on Subject History Questionnaire) ... 49
ix
Table 12: Younger Group Hand Preference (Based on Subject History Questionnaire) ............. 50
Table 13: Older Group Hand Preference (Based on Subject History Questionnaire) .................. 51
Table 14: Younger Group CELF-5 Scores ................................................................................... 52
Table 15: Older Group CELF-5 Scores ........................................................................................ 53
Table 16: Younger Group ABCD Story Retell Scores ................................................................. 54
Table 17: Older Group ABCD Story Retell Scores ...................................................................... 55
Table 18: Younger Group WAIS-5 Digit Span Scores ................................................................. 56
Table 19: Older Group WAIS-5 Digit Span Scores...................................................................... 57
Table 20: Younger Group LEAP-Q Responses ............................................................................ 58
Table 21: Older Group LEAP-Q Responses ................................................................................. 59
Table 22: Younger Group Edinburgh Handedness Inventory ...................................................... 60
Table 23: Older Group Edinburgh Handedness Inventory ........................................................... 61
Table 24: Subject Test Order ........................................................................................................ 62
Table 25: Reaction Time Combined Data .................................................................................... 66
x
LIST OF FIGURES
Figure 1: The Computerized Screen of the 20 CRTT Tokens (McNeil et al., 2015a).................. 21
Figure 2: Overall Mean CRTT-R-WF Scores by Age and Hand ................................................... 26
Figure 3: Overall Efficiency CRTT-R-WF Scores by Age and Hand ............................................ 28
Figure 4: Overall CRTT-R-WF Reading Plus Response Times (msec) by Age and Hand ........... 31
Figure 5: CRTT-R-WF Reading Plus Response Times of Group by Subtest (effect size is written
above significance brackets) ......................................................................................................... 34
Figure 6: Brinley Plot of CRTT-R-WF Average Reading Plus Response Times of Younger Adults
by Older Adults ............................................................................................................................. 35
xi
PREFACE
This research project would not have been possible without the numerous individuals who
volunteered their time, knowledge and guidance. In particular, I would like to acknowledge:
my committee members; Dr. Malcolm McNeil, Dr. Sheila Pratt, and Dr. J. Scott Yaruss, for their
continued input, advice and support; my peer and co-investigator, Emily Hendricks, with whom
it was an honor to complete this journey; Neil Szuminsky for serving as the programmer and
problem-solver when glitches arose; my professors, for sharing their knowledge throughout my
graduate schooling; the participants whose volunteered time made this study possible; my
friends, classmates, and faculty at the School of Health and Rehabilitation Sciences for their
ongoing assistance (especially with EndNote and Excel) during the entire process; and especially
my family for always answering my phone calls without knowing what type of mood I am in.
Everything I am you helped me to be. Thank you!
1
1.0 INTRODUCTION
An issue plaguing all assessment tools is one of task impurity. That is, to what extent does a test
produce results that reflect only the construct, process or behavior targeted by that test? The
Computerized Revised Token Test (CRTT) was designed to measure language comprehension
and processing in persons with aphasia (PWA; McNeil et al., 2015b). In addition to language
deficits, this population often presents with physical, perceptual and cognitive limitations which
potentially impact CRTT results. Results would then reflect more than just language processing.
Test results could also be influenced by cognitive, perceptual and motor changes that naturally
occur with aging. Assessment tools intended for use across the lifespan need to consider age-
related effects. In addition to the effects of age on test performance, hand use can impact
performance. This is especially true for populations that need to use their non-dominant hand,
such as those with hemiplegia.
This study assessed the effects of age and hand preference in healthy, normal adults on
language comprehension and processing using the CRTT-Reading-Word Fade (CRTT-R-WF)
test. Simultaneously, a parallel study (Hendricks, n.d.) was performed to evaluate the effects of
age and hand preference in the same participants on a battery of reaction time (RT) tasks. These
RT tasks are hypothesized to target the primary underlying sensorimotor and cognitive functions
required for participation on the CRTT-R-WF. The eventual combination of the data collected
2
from these two preliminary studies will help to determine if and/or to what extent these
perceptual-motor and cognitive abilities contribute to performance on the CRTT.
1.1 BACKGROUND
A hospital can be an overwhelming place. When a person receives news that their loved one has
been diagnosed with aphasia, they may not digest the information immediately after receiving it.
It may take some time for family members to understand what that diagnosis means, and the
consequences that accompany it. Often times, when a person is not familiar with a medical term
they will “Google it” on the Internet. Merriam-Webster defines aphasia as, “a loss or impairment
of the power to use or comprehend words usually resulting from brain damage” ("Asphia [Def.
2].", (n.d.)). However, from a clinical perspective, aphasia is much more involved than that. For
the purposes of this study, aphasia is a “multimodality physiological inefficiency with verbal
symbolic manipulations (e.g. association, storage, retrieval and rule implementation). In isolated
form, it is caused by focal damage to cortical and/or subcortical structures of the hemisphere(s)
dominant for such symbolic manipulations. It is affected by and affects other physiological
information processes to the degree that they support, interact with, or are supported by the
symbolic deficits” (McNeil, 1988, p. 693). This is a comprehensive definition that requires
dissection to begin to understand the particulars of the disorder. Aphasia alone can occur after
damage to either the outer layer of the brain, or structures found in the deeper layers of brain. It
can impact any combination of the areas of communication – both understanding and producing
language. These domains function on the mental process and symbolic representations used to
retrieve and produce language through speech, gesturing or writing. However, rarely do areas of
3
the brain operate in isolation. Additional regions of the brain responsible for other cognitive and
executive functions and the areas responsible for language are interdependent. The severity of
those signs and symptoms depends on how intricately the structures are intertwined. Since PWA
present with deficits that involve spoken and written comprehension and production, it is
essential to use a battery of tests that will assess an individual’s strengths and weaknesses in all
forms of communication. Speech-language pathologists (SLPs) are clinicians who are trained to
assess, diagnose and treat patients with speech, language, communication and swallowing
disorders across the lifespan. These clinicians especially understand that a dynamic assessment is
imperative for the purposes of differential diagnoses and planning interventions so as to best
serve their patients. The Computerized Revised Token Test (CRTT) was developed to aid in
these functions. The CRTT can be administered via different modalities (auditorily or visually)
and includes multiple versions with differential task demands. Therefore, the CRTT has the
potential to be a key component of a battery of tests (McNeil et al., 2015b).
1.1.1 Revised Token Test (RTT)
The Revised Token Test (RTT) is a diagnostic tool designed to assess the auditory language
processing skills of persons with aphasia. Its use has been extended to other populations with
language processing problems (e.g., children with specific language impairment and brain injury,
adults with learning disabilities and traumatic brain injury, and persons with central auditory
processing disorders). The test was constructed to provide information about an individual’s
ability to process language while keeping word-level content simple and syntactic forms
constrained. These constraints allow for stimulus manipulations that stress attention, working
4
memory, and temporal processing mechanisms, thereby allowing for the examination of their
impact on the ability to process language. The RTT requires the identification of plastic objects
by touching or manipulating them in response to orally presented commands. Test administrators
required extensive training on how to administer and score the test. The scoring system of the
RTT is complex, as each part of speech in every sentence receives a score between 1 and 15.
Scores are assigned depending on both the individual’s response accuracy and the need for
additional information such as a repeat or cue of the command (Heilman, 2008; McNeil &
Prescott, 1978).
More recently, a computerized version of the RTT, the Computerized Revised Token Test
(CRTT), was created to provide reliable, automated presentations and scoring of auditory
stimuli. Instead of touching and manipulating tangible objects, the participant responds to the
shapes present on a computer with a mouse or on a touch screen. The computer program also
records the real-time, multidimensional scores of each of the subtests. This format diminishes
many of the inter- and intra-judge reliability and training constraints associated with the
clinician-administered and scored RTT (McNeil et al., 2015a). The auditory, or listening, version
of the CRTT (CRTT-L) is almost identical to the original RTT. It consists of the same number of
sentences per subtest, total number of subtests, and linguist constraints within each sentence. The
CRTT was later expanded to include three CRTT reading (CRTT-R) versions: CRTT-Reading-
Full Sentence (CRTT-R-FS), CRTT-Reading-Word Constant (CRTT-R-WC), and CRTT-Reading-
Word Fade (CRTT-R-WF). As a result, the CRTT can be used to compare listening and reading
skills among PWA (McNeil et al., 2015b). While one study examined the effects of age on
CRTT listening performance (Jorgensen et al., n.d.), to date, there have been no studies
examining the effects of age on CRTT reading tasks. The Jorgensen et al study used stimuli
5
intensity level adjustments to accommodate hearing loss. The results failed to find age effects on
the CRTT-L when the acoustic stimuli were equated for audibility. The study also found that
slower response times recorded by older participants did not impede response accuracy. No age
effects were observed in the RTT (McNeil & Prescott, 1978). Silagi, Rabelo, Schochat, and
Mansur (2015) reported an age effect on subtests 9 and 10 of the RTT, where adults (50-59 years
of age) performed significantly better than young-old participants (60-69 years of age) and old-
old participants (70-80 years of age). The Indiana University Tokens Test (IUTT) is an
alternative paper and pencil token test designed to test listening comprehension and executive
function of two- and three- step commands. The IUTT requires participants to respond to orally
presented commands by pointing to shapes of various colors and sizes. The IUTT also relies on a
multi-dimensional scoring system, but is much less complex than that of the RTT. Correct scores
receive two points. If the response is incorrect on the first try, the command is repeated. A
correct response after a repeated command receives a score of one. An incorrect response after a
repeat receives a score of zero (Unverzagt, 1999). Using the IUTT, Snitz et al. (2009) did find an
age effect, as well as an effect of gender, education and race. The current study seeks to compare
the CRTT-R- WF scores across two different age groups. The CRTT-R- WF is discussed in greater
detail in Chapter 2.2.1.
1.1.2 Aging Theories on Cognition and Language
Aging is accompanied by neuroanatomical, neurophysiological and cognitive changes. These
changes may be present in healthy older adults as a result of normal aging, as well as a
consequence of disease that may be associated with aging (Birren & Woodruff, 1983). It is
important to understand what comprises cognition, how it affects language, and how function
6
change with age. Language is a symbolic system that is governed by rules and regulations. When
the system is arranged in specific patterns, it can be used to express thoughts. The language
system is comprised of five domains: phonology (sounds), morphology (words), syntax
(sentences), semantics (meaning), and pragmatics (within a social context). Thoughts can be
expressed through a variety of modalities, including speech, writing and gestures. Cognition
includes cognitive processes (attention, perception, memory, organization, executive
functioning) and the neurological systems that operate them. Many of these processes are
involved in producing or understanding language. When either the cognitive processes that
support language or the components of language are primarily or secondarily impaired, an
individual may have functional deficits in behavioral self-regulation, social interactions, and
learning and academic performance (American Speech-Language-Hearing Assocication, 2005).
Current research provides conflicting evidence as to when age-related cognitive declines
begin in healthy adults. Some research has shown that after cognitive efficiency peaks during a
person’s mid-twenties, there is a gradual decline of functioning until they enter their fifties. At
that age, the rate of decline may increase (Thomas, Dave, & Bonura, 2010). Others have found
that age-related cognitive declines vary across abilities (Salthouse, 2004), but can begin in
healthy, educated adults in as early as their third or fourth decade (Salthouse, 2009).
Research involving the effects of aging on cognition is vast and has been explored by
researchers within several disciplines. Burke and Shafto (2008) discuss six theories of cognitive
aging and their relation to language processing. The resource theory is centered around the
notion that a person has a restricted quantity of resources that is shared by psychological
processes that occur at or around the same time. The limited availability of resources constrains
the system’s ability to encode and decode information accurately and efficiently. Age-related
7
declines in resources cause certain operations to be more difficult than others, draining the
resources available for these “simpler” cognitive tasks in older adults more so than in younger
adults. Though sometimes controversial, the term “resources” is often considered to include
some of the previously mentioned cognitive processes, such as processing speed, working
memory, attention and inhibition.
More recent research has shifted towards an attempt in isolating underlying mechanisms
that relate to the resource. Working memory is often considered an aspect of short-term memory
that is used to store information that is currently in use. Working memory is thought to be
involved in the receiving and encoding of information, the retrieval of previous information, and
the manipulation of that information. Finally, the manipulation then allows a person to perform
the desired action. If demands differentially placed on retrieval, storage, or computation are too
great, there will be a cost to other functions. For example, if there are a large number of demands
placed on the retrieval of information, there could be less cognitive resources available to
process incoming information (Siegel, 1994). Therefore, working memory theories are shaped by
models that assume working memory has both storage and processing responsibilities. Working
memory theories differ from resource theories when considering where limitations occur.
Proponents of the resources theory believe that verbal working memory is constrained by the
language system as a whole, whereas working memory theorists consider working memory to be
its own component limited by its own capacity. In working memory theories associated with
cognitive aging, aging decreases working memory’s storage capacity, making it more difficult
for older adults to understand and produce complex linguistic information (Burke & Shafto,
2008). As previously mentioned, the sentences within the CRTT are constructed with the specific
intent of constraining word-level and syntactic forms. In the full-sentence reading version of the
8
CRTT, these constraints limit the demands placed on working memory. The CRTT-R-WF, unlike
the other reading versions, prevents participants from re-reading previously presented stimuli.
One could then argue that the CRTT-R-WF increases the cognitive demands of short-term and
working memory of the test taker when compared to other reading versions.
Other theories are based on the idea that an inhibitory process regulates attention and
working memory. This process is believed to prevent unnecessary information from distracting a
person from the cognitive tasks to which they are attending. The inhibition deficit theory claims
that these inhibitory processes deteriorate with age, which could impact many cognitive abilities,
including language comprehension and production. For example, older adults may be more
easily distracted by competing noise when reading or listening (Burke & Shafto, 2008; Hasher &
Zacks, 1988).
The transmission deficit theory proposes that there are connections among
representational components within the language system that are activated and strengthened by
consistent use. In this theory, aging collectively weakens the strength of these connections. This
hypothetical decrease in connection strength reduces the ability to activate already constructed
representations, resulting in deficits across cognitive processes as opposed to a specific one. The
functional impact that these deficits have on language depends on the design of the symbolic
representations. Language components that have multiple connections may be less susceptible
than units that only have one connection (Burke & Shafto, 2008).
The sensory/perceptual deficit (degraded signal) theory states that aging yields declines
in sensory and perceptual processes. Declines in these areas allow partial or inaccurate
information to alter phonological and orthographic codes. These alterations impair an older
adult’s ability to correctly select words and other components required for computations.
9
Although it is the least developed theory, it hypothesizes that equalizing language perception
across ages would eliminate word recognition deficiencies (Burke & Shafto, 2008). This theory
appears to be consistent with the results of Jorgensen et al. (n.d.).
Perhaps the most investigated theory of aging is the general slowing theory. This theory
argues that declines in cognitive performance as an effect of age are due to a global slowing of
the hypothesized underlying mechanisms, most commonly referred to as processing speed.
Declines seen in perceptual-motor speed further support this theory, proposing that older adults
process information less efficiently, and are therefore slower to perform perceptual-motor tasks
(Salthouse, 1996). Such tasks have shown similar age-related variance as language tasks (Burke
& Shafto, 2008; Salthouse, 1985). This theory has been used to explain why older adults have
more difficulty comprehending faster speech than younger adults (Wingfield, 1996).
Because of the interactive nature between language and cognition, it is difficult to isolate
the processing level of each language domain. Aspects of language production as an effect of age
were deemed outside the scope of this paper, as language comprehension more closely aligns
with the requirements of reading comprehension. The effects of aging on reading comprehension
is described in more detail in the following section.
1.1.3 Aging and Reading Comprehension
The assessment tool used in this study requires the comprehension of written text. It is therefore
important to consider how age impacts reading comprehension. It is difficult to assess how aging
influences comprehension abilities, as many cognitive processes come into play when assessing
reading comprehension. In order to comprehend a sentence, one must first recognize the words
through whole word recognition or through grapheme to phoneme conversion, build
10
relationships among the words, and associate a meaning to the sentence in its entirety (DeDe &
Flax, 2016). Older adults have been observed to take longer to reach a level of comprehension
comparable to younger readers. This could suggest that changes in cognitive abilities, as opposed
to deficits with linguistic knowledge account for the comprehension reductions (DeDe & Flax,
2016). Supporting this claim, when comparing older and younger adults, Hannon and Daneman
(2009) reported declines in older participants’ ability to remember new information within a text,
make inferences about the new information, access prior knowledge in long-term memory, and
integrate prior knowledge with the new information.
Working memory is an important, though not the only, cognitive process that is engaged
during reading. During reading, one component of working memory aids in the processing of
incoming words and sentences and storing them long enough so that longer units can also be
comprehended. Another part of working memory is retrieving prior knowledge of grammatical
rules and word meanings (Siegel, 1994). Working memory, as measured by digit span and
reading span tasks, has been shown to decline with age (Carpenter, Miyake, & Just, 1994). If
these tasks measure performance of the same working memory processes during sentence
reading, limitations of working memory could explain age-related changes in language
processing. Kemper and Herman (2006) reported that syntactic processes rely on the same
working memory resources that are also allocated for non-syntactic tasks. Their results support a
single-resource model of working memory. That is, increases in sentence complexity and
decreases in working-memory capacity (from either an imposed memory load or secondary to
aging) make online language processing more difficult. Reduced online processing can
negatively impact overall comprehension and recall (Kemper & Herman, 2006).
11
Some areas of language, such vocabulary size, are relatively well maintained throughout
the lifespan. Deficits in language as an effect of age are commonly seen in word retrieval and
comprehension of spoken language. This is especially true with increased rate of speech and
background noise. Whether the decrease in comprehension is due to sensory deficits (i.e. hearing
loss) or cognitive deficits is difficult to determine (Clark-Cotton, Williams, Goral, & Obler,
2007).While Jorgensen et al. (n.d.) examined age effects on the listening version of the CRTT
(CRTT-L), no studies comparing CRTT-R accuracy or speed of performance as an effect of age
have been conducted. Reading times are often a dependent variable in comprehension studies, as
they are believed to provide insight into task requirements during reading. When assessing the
reading times on a word-by-word basis, which is similar to the word-by-word presentation of the
CRTT-R-WF, Stine (1990) older adults paused longer at clause boundaries than younger adults.
Pauses at the end of a sentence are believed to allow for “wrap-up” operations, whereby a reader
ensures that there are no inconsistencies within a sentence and syntactic integration can occur
(Just & Carpenter, 1980). Perhaps older adults did not pause at the end of the sentence because
working memory limitations prevented them from maintaining the information long enough to
reach the end of the sentence. Instead, limitations in working memory capacity forced older
adults to pause within the sentence at clause boundaries (Stine, 1990)
1.1.4 Cognitive Aging, Motor Performance, and Hand Preference
An important aspect to consider in the understanding of sentence comprehension is that
essentially all language comprehension measures require both the processing of auditory or
visual stimuli and a motor response. The CRTT version used in this study is one such measure.
Therefore, it is crucial to explore cognitive aging effects on sensorimotor performance.
12
Although an interdependence of cognitive aging and declines in motor performance has
been mentioned, the links between cognitive aging, motor functioning and motor learning have
only been suggested rather than demonstrated (Ren, Wu, Chan, & Yan, 2013; Yan, Aberneth, &
Li, 2009). Indeed, many of the previously mentioned cognitive processes needed for language
also are needed for normal motor performance. One hypothesized explanation of the link
between cognitive aging and motor performance is a reduction in attention as an effect of aging.
Attention can be considered as the ability to assign mental resources to a specific target and its
associated, and defining elements such as location, orientation and dimension in the case of
visual tasks. The amount of attention a person is able to devote to a task or target has been shown
to decline with age (Ren et al., 2013). Response speed in tasks requiring participants to find
specific targets, has been shown to be slower in older adults (Hommel, Li, & Li, 2004). Similar
perceptual-motor functions are required in the CRTT. Another task demand in the performance
of the CRTT is related to the hand used for response selection. Due to neurological deficits,
some individuals for whom the test is intended are required to use their non-preferred hand. It is
therefore imperative that such effects on performance be evaluated. Additionally, it is essential to
evaluate whether any effects of aging are equivalent across preferred and non-preferred hands.
While little research to date has been published on the effects of hand use on CRTT
performance, McNeil et al. (2009) did report a nonsignificant main effect for hand on the CRTT-
L when comparing touchscreen versus computer mouse access mode, left versus right hand use,
and individuals with aphasia versus normal adult healthy controls.
Hand preference, the habitual use of one hand over the other, has been established as an
innate human asymmetry (Peters, 1981; Triggs, Calvanio, Levine, Heaton, & Heilman, 2000).
Most individuals demonstrate a hand preference when participating in activities that require both
13
skilled and unskilled performance. Research has supported this notion by suggesting an
interrelation between handedness and the allocation of attention (Song & Bédard, 2013); a
greater number of attentional resources being distributed to the individual’s non-dominant hand
when performing fine motor activities. A large body of research has investigated the differences
between right- and left-handed participants on cognitive and motor tasks. However, few studies
have compared preferred and non-preferred hand differences within an individual. Kourtis and
Vingerhoets (2016) identified both handedness and degree of handedness (i.e. how consistently a
person uses the preferred hand) as important components for determining where and to what
extent attention is allocated to hand movement. Results suggest that the amount of use has more
of an impact on movement control than hand dominance.
1.2 EXPERIMENTAL QUESTIONS AND HYPOTHESIS
As the average age of the population continues to rise in the United States, it is imperative to
gain a better understanding of how age, language comprehension, and motor performance are
related. This is relevant for clinicians who manage adults with communication deficits, where it
is likely that language assessments may have to be completed by many individuals using their
non-dominant hand following a stroke, traumatic brain injury or degenerative disease. The
primary goal of this study was to explore the effects of aging and hand dominance on CRTT
performance in healthy adults. The following questions were investigated:
1. Is there a significant (p < .05) difference in CRTT-R-WF mean scores between
younger and older groups?
14
2. Is there a significant (p < .05) difference in CRTT-R-WF mean scores between
right and left hand used?
3. Is there a significant (p < .05) difference in CRTT-R-WF efficiency scores
between younger and older groups?
4. Is there a significant (p < .05) difference in CRTT-R-WF efficiency scores
between right and left hand used?
5. Are there significant (p < .05) interactions between groups and hand used for the
mean score or for the efficiency score?
Secondary questions were also addressed. These include:
1. Is there a significant (p < .05 difference in CRTT-R-WF reading plus response
times between right and left hand used?
2. Is there a significant (p < .05) difference in CRTT-R-WF reading plus response
times between younger and older groups?
3. Are there significant (p < .05) interactions between groups and hand used for the
reading plus response times? With sex as a covariate?
Given the background information on working memory demands and cognitive slowing with
age, it was predicted that the older normal healthy control participants would evidence
significantly lower mean and efficiency scores on the CRTT-R-WF than the younger age group.
Little research has been done on the effects of hand preference in language tasks that require
behavioral responses. However, it was assumed that participants would be less familiar and
motorically unpracticed using a computer mouse with their non-preferred hand. This
15
unfamiliarity was predicted to result in more attention being directed towards the motor
components required for accurately moving the mouse, subsequently slowing performance.
Therefore, it was predicted that the non-preferred hand would result in a longer response times,
negatively influencing a participant’s efficiency score, but not their mean score.
16
2.0 METHODS
2.1 PARTICIPANTS
Sixty-four healthy, normal adults completed this study. Participants were divided into two groups
with 16 males and 16 females per group in order to balance differences across tasks, especially
during the RT tasks (Dykiert, Der, Starr, & Deary, 2012). Group 1 (young) consisted of
individuals recruited between the ages of 20-35 years (mean: 23.8 years; range 20-32 years).
Group 2 (old) included individuals recruited between the ages of 65-79 years (mean: 71.8 years;
range 65-78 years).
Sixty-two participants self-identified as Caucasian; one participant in Group 1 self-
identified as African-American, and one participant in Group 2 identified as Latino American
(See Appendix A, Table 10 and Table 11). All participants reported English as their native
language. Only one participant identified as bilingual. Appendix A contains additional sex, age,
race, education level, and occupation demographic information for each participant.
The University of Pittsburgh Institutional Review Board approved this study
(PRO16030419). A parallel study was simultaneously conducted that examined the effects of age
and hand used on reaction time (RT) performance using the CRTT-RT battery. These RT tasks
are described in Appendix B. Participants completed both the CRTT-R-WF and CRTT-RT, with
their preferred and non-preferred hands, in random order during a single session. Language
17
processing and RT data was then separated and analyzed by the appropriate researcher for their
respective study. Verbal and written informed consent was obtained from all participants prior to
initiating the study protocol. Upon completion of the study, each participant received $15.00
compensation. Participants were recruited via flyers approved by the University of Pittsburgh
and through communication among participants.
2.1.1 Inclusionary Criterion and Preliminary Procedures
Research in cognitive aging suggests variations of cognitive processing skills as an effect of
aging, such as processing speed, attention, perception and working memory (Dennis & Cabeza,
2008; Salthouse, 2004, 2009; Thomas et al., 2010). This study’s criteria for determining a
“healthy, normal adult” accepted these age-related differences.
Participants qualified for this study using six criterion measures: (1) Participants
completed a self-reported questionnaire (see Appendix C) adapted from Heilman (2008) that
provided qualitative information regarding their native language, years of education and
occupational history (see Appendix A, Table 10 and Table 11). Participants were excluded from
this study if they self-reported a medical, psychological, or other cognitive conditions that could
impact performance (e.g. stroke, alcoholism, depression, Parkinson’s Disease, Alzheimer’s
Disease, etc.) and/or physical impairments that would limit the use of their hands, wrists, or arms
during the protocol; (2) All participants completed a vision screening using the Reduced Snellen
Chart (Snellen, 1862) with a visual acuity of 20/40 or better, corrected or uncorrected; (3) The
Clinical Evaluation of Fundamentals 5th Edition (CELF-5) (Wiig, Semel, & Secord, 2013)
reading subtest for ages 13-21 year was used to assess reading comprehension. Participants read
two passages and responded to orally presented reading comprehension questions. Participants
18
were required to achieve a combined raw score of 17 or greater (see Appendix A, Table 14 and
Table 15); (4) The intermediate/delayed story retell task from the Arizona Battery of
Communication Disorders of Dementia (ABCD; Bayles & Tomoeda, 1993) was used to screen
immediate and delayed memory capabilities. Participants were required to achieve a ratio
(delayed recall / immediate recall) of .70 or greater (see Appendix A, Table 16 and Table 17); (5)
Participants were required to achieve a scaled score of 8 or greater when compared to age-
matched normative data the Digit Span Forward and Backward subtest of the Wechsler Adult
Intelligence Scale – Fourth Edition (WAIS-IV; Wechsler, 2008) (see Appendix A, Table 18 and
Table 19); (6) Participants were required to pass the Fade Reading Pretest of the CRTT-R-WF. By
doing so, they demonstrated their ability to accurately identify “big/little,” “circle/square,” and
“black/white/red/green/blue.” This pretest also ensured appropriate vision, color discrimination,
and the ability to accurately move and select the stimulus from the screen using the computer
mouse; all of which are required functions and abilities to complete the tasks.
Two other preliminary procedures were included in the study protocol as descriptive
measures: (1) The Language Experience and Proficiency Questionnaire (LEAP-Q; Marian,
Blumenfeld, & Kaushanskaya, 2007) was completed to obtain subjective reports of each
individual’s language experiences. The LEAP-Q allowed participants to indicate the percentage
of current exposure to each language they reported knowing, as well as the percentage of time
they choose to read and speak in each language (see Appendix A, Table 20 and Table 21); (2)
The Edinburgh Handedness Inventory (Oldfield, 1971) was used to identify participant hand
dominance on various activities (see Appendix A, Table 22 and Table 23; Appendix D).
Participant also reported hand preference during computer-related activities and estimated their
19
computer use in hours per day on the Subject History Form (see Appendix A, Table 12 and Table
13; Appendix C).
One participant did not meet the self-reported medical conditions criterion, and was
therefore ineligible for participation in the study. That participant was not compensated.
2.2 PROTOCOL
Every participant completed the CRTT-R- WF and the six RT tasks from the CRTT-RT Battery.
Each participant completed these procedures twice, once with their left hand and once with their
right hand. This resulted in four task conditions per participant: CRTT-R-WF Right, CRTT-R- WF
Left, RT Right Hand, and RT Left Hand. The order of completion of these four tasks was
randomized for each participant to minimize possible order effects (see Appendix A, Table 24).
Subtests within each task were not randomized in order to conform to the original test designs.
The components of the CRTT-R-WF and the data collection for these tasks are discussed in
greater detail in the following sections. The CRTT-RT battery is detailed in Appendix B. Two
different laptop computers were used during administration of the primary dependent measures
(CRTT-R-WF and CRTT-RT battery). Both computers used standard, wired mouse (Staples
Wired Mouse, Model # 23415). Data was collected in quite laboratories or office spaces within
Forbes Tower. Data collected outside of Forbes Tower occurred in a participant’s private
quarters, in a room free of distractions, with no individuals present except for study personnel
and the participant.
20
2.2.1 Computerized Revised Token Test – Reading – Word Fade
The participants were administered the 100-item, word-fade reading comprehension version of
the CRTT (CRTT-R-WF), which is comprised of 10 sentences for each of the 10 subtests. As in
the original RTT, the CRTT includes 10 or 20 tokens (alternating between subtests) that
participants are required to touch or move in response to imperative sentences. Commands were
presented in text at the bottom of the computer screen in a word-by-word, self-paced moving
window. That is, the one word appears for every mouse-click, with the previous word
disappearing with onset of each new word (McNeil et al., 2015b). Participants must hold each
part of speech in their short-term memory, comprehend the sentence in its entirety, and respond
accordingly. The tokens appear on the screen after the participant clicks the mouse after reading
the final word in the sentence. Unlike other reading versions of the CRTT, this method of
presentation prevents participants from re-reading previously presented stimuli and allows the
measurement of reading times for each word. These times are analyzable to better identify the
point of increased processing demands within each sentence. The commands are comprised of
combinations of two actions (touch, put), two shapes (circle, square), two sizes (big, small), five
colors (black, white, red, green, blue), 10 prepositions (above, before, behind, below, beside, by,
in front of, on, next, under) and five different adverbial clauses (instead of, unless, either, if there
is, if you have not) (McNeil et al., 2015b; McNeil & Prescott, 1978). Figure 1 displays the 20
tokens seen during Subtests II, IV, VI, VIII, and X. The remaining five subtests use only the 10
big tokens. Subtests systematically increase in syntactic complexity. The subtests differ from one
another in sentence length and syntactic complexity. They also vary from simple one-part
commands (e.g. “touch the red circle” or “touch the little red circle”) to compound two-part
commands (e.g. “touch the red circle and blue square” or “touch the little red circle and the big
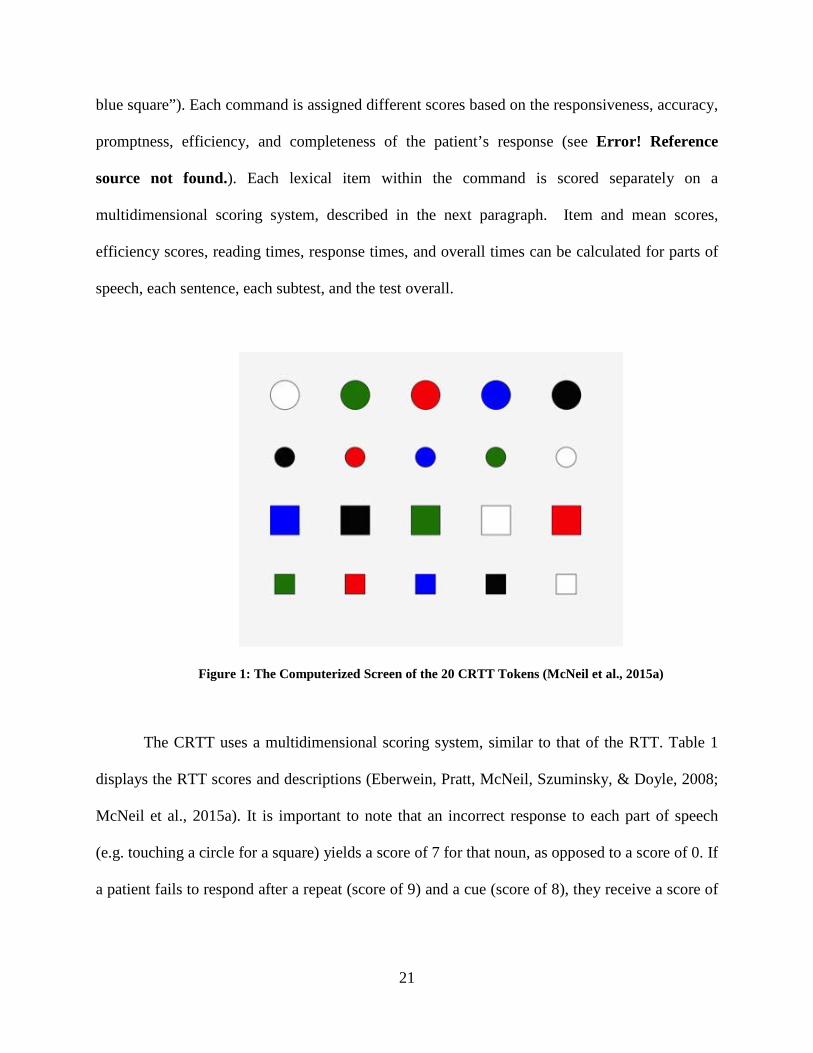
21
blue square”). Each command is assigned different scores based on the responsiveness, accuracy,
promptness, efficiency, and completeness of the patient’s response (see Error! Reference
source not found.). Each lexical item within the command is scored separately on a
multidimensional scoring system, described in the next paragraph. Item and mean scores,
efficiency scores, reading times, response times, and overall times can be calculated for parts of
speech, each sentence, each subtest, and the test overall.
Figure 1: The Computerized Screen of the 20 CRTT Tokens (McNeil et al., 2015a)
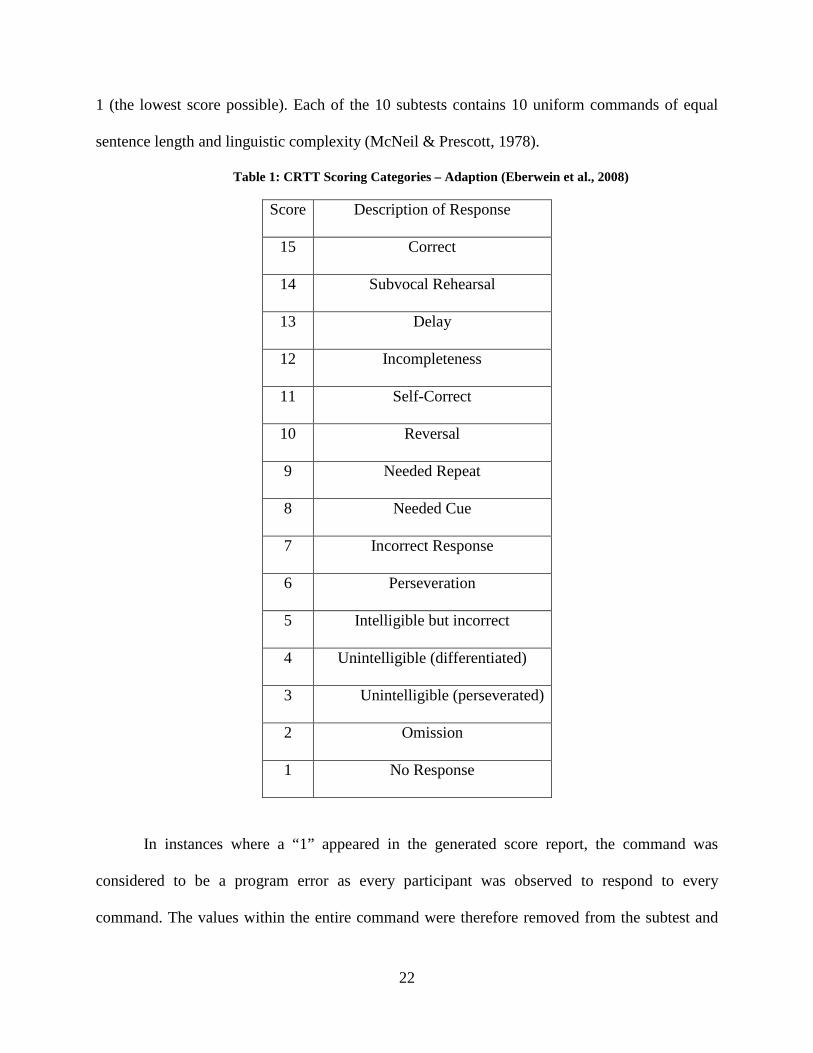
The CRTT uses a multidimensional scoring system, similar to that of the RTT. Table 1
displays the RTT scores and descriptions (Eberwein, Pratt, McNeil, Szuminsky, & Doyle, 2008;
McNeil et al., 2015a). It is important to note that an incorrect response to each part of speech
(e.g. touching a circle for a square) yields a score of 7 for that noun, as opposed to a score of 0. If
a patient fails to respond after a repeat (score of 9) and a cue (score of 8), they receive a score of
22
1 (the lowest score possible). Each of the 10 subtests contains 10 uniform commands of equal
sentence length and linguistic complexity (McNeil & Prescott, 1978).
Table 1: CRTT Scoring Categories – Adaption (Eberwein et al., 2008)
Score Description of Response
15 Correct
14 Subvocal Rehearsal
13 Delay
12 Incompleteness
11 Self-Correct
10 Reversal
9 Needed Repeat
8 Needed Cue
7 Incorrect Response
6 Perseveration
5 Intelligible but incorrect
4 Unintelligible (differentiated)
3 Unintelligible (perseverated)
2 Omission
1 No Response
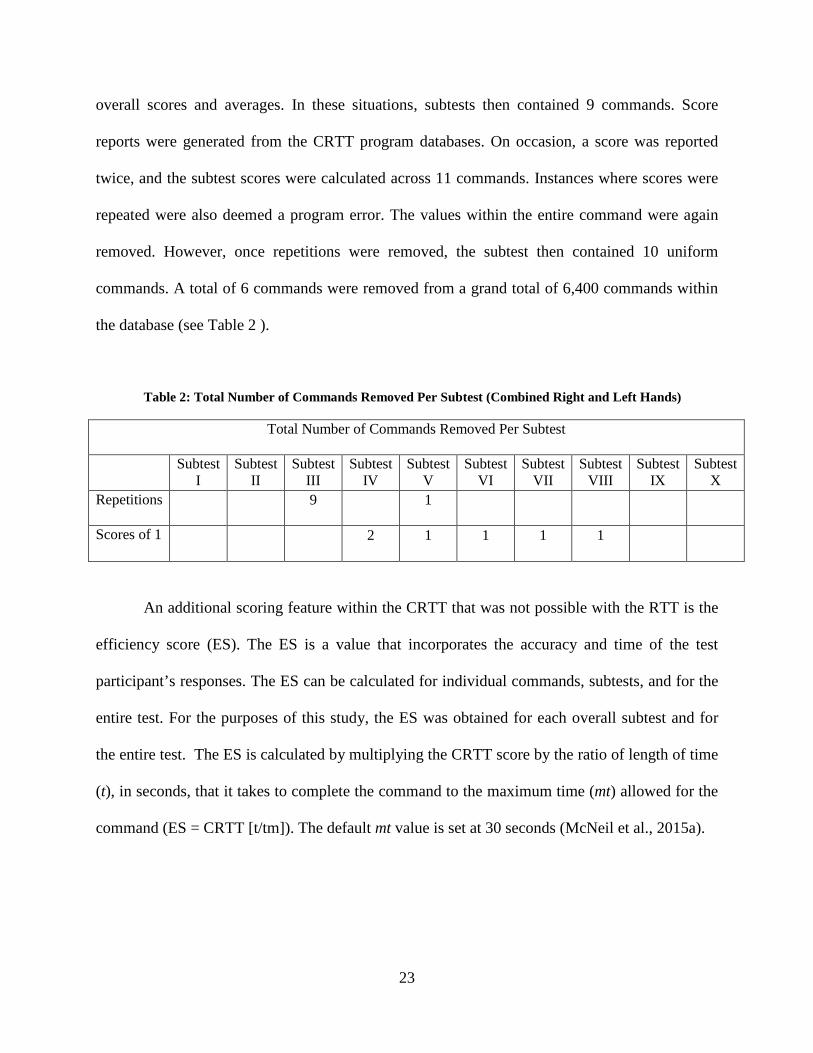
In instances where a “1” appeared in the generated score report, the command was
considered to be a program error as every participant was observed to respond to every
command. The values within the entire command were therefore removed from the subtest and
23
overall scores and averages. In these situations, subtests then contained 9 commands. Score
reports were generated from the CRTT program databases. On occasion, a score was reported
twice, and the subtest scores were calculated across 11 commands. Instances where scores were
repeated were also deemed a program error. The values within the entire command were again
removed. However, once repetitions were removed, the subtest then contained 10 uniform
commands. A total of 6 commands were removed from a grand total of 6,400 commands within
the database (see Table 2 ).
Table 2: Total Number of Commands Removed Per Subtest (Combined Right and Left Hands)
Total Number of Commands Removed Per Subtest
Subtest I
Subtest II
Subtest III
Subtest IV
Subtest V
Subtest VI
Subtest VII
Subtest VIII
Subtest IX
Subtest X
Repetitions 9 1
Scores of 1 2 1 1 1 1
An additional scoring feature within the CRTT that was not possible with the RTT is the
efficiency score (ES). The ES is a value that incorporates the accuracy and time of the test
participant’s responses. The ES can be calculated for individual commands, subtests, and for the
entire test. For the purposes of this study, the ES was obtained for each overall subtest and for
the entire test. The ES is calculated by multiplying the CRTT score by the ratio of length of time
(t), in seconds, that it takes to complete the command to the maximum time (mt) allowed for the
command (ES = CRTT [t/tm]). The default mt value is set at 30 seconds (McNeil et al., 2015a).
24
2.2.2 Computerized Revised Token Test – Reaction Time Battery
As previously stated, participants also completed a battery of simple and choice reaction time
tasks with both their preferred and non-preferred hand. While the CRTT assesses language
processing and comprehension, there are perceptual-motor demands that potentially influence
test scores. The Reaction Time (RT) tasks are designed to assess non-linguistic, perceptual-motor
and cognitive skills at various levels of processing (e.g. motor speed, movement control,
response selection mapping, response inhibition, and vigilance). The difficulty of each task
increases with each subtest. Data collected from the Computerized Revised Token Test –
Reaction Time (CRTT-RT) battery was analyzed in a parallel study by (Hendricks, n.d.) Refer to
Appendix B for a description of each task, and to Table 25 for the combined task totals by age
group and by hand used.
25
3.0 RESULTS
3.1 STATISTICAL ANALYSIS
The mean CRTT-R-WF Scores and CRTT-R-WF Efficiency Scores were analyzed using two
separate 2-way ANOVAs with repetition on hand (group x hand). The test-wise alpha was
controlled at the p = < .05 level. Secondary analyses also were conducted to look at reading plus
response time. It was assessed with a 2-way ANOVA with repetition on hand (group x hand).
The reading plus response times also were displayed on a Brinley plot to illustrate group
reading/response slowing for each hand, across subtests. Additional post-hoc testing was
completed with paired t-tests and univariate ANOVAs.
3.1.1 Mean CRTT-R-WF Scores
The ANOVA for the mean CRTT score data showed a significant within-subjects main effect for
Hand, F(1,62) = 75.520, p = 2.5326-12, partial ƞ2 = .549, with the left hand mean scores
significantly lower than the right hand for both groups. Between group comparisons revealed a
statistically significant effect of Age, F(1,62) = 54.841, p = 4.2615-10, partial ƞ2 = .469, with the
younger group’s mean scores being significantly higher than the scores for the older group. In
addition, a statistically significant interaction was found between Group and Hand, F(1,62)=
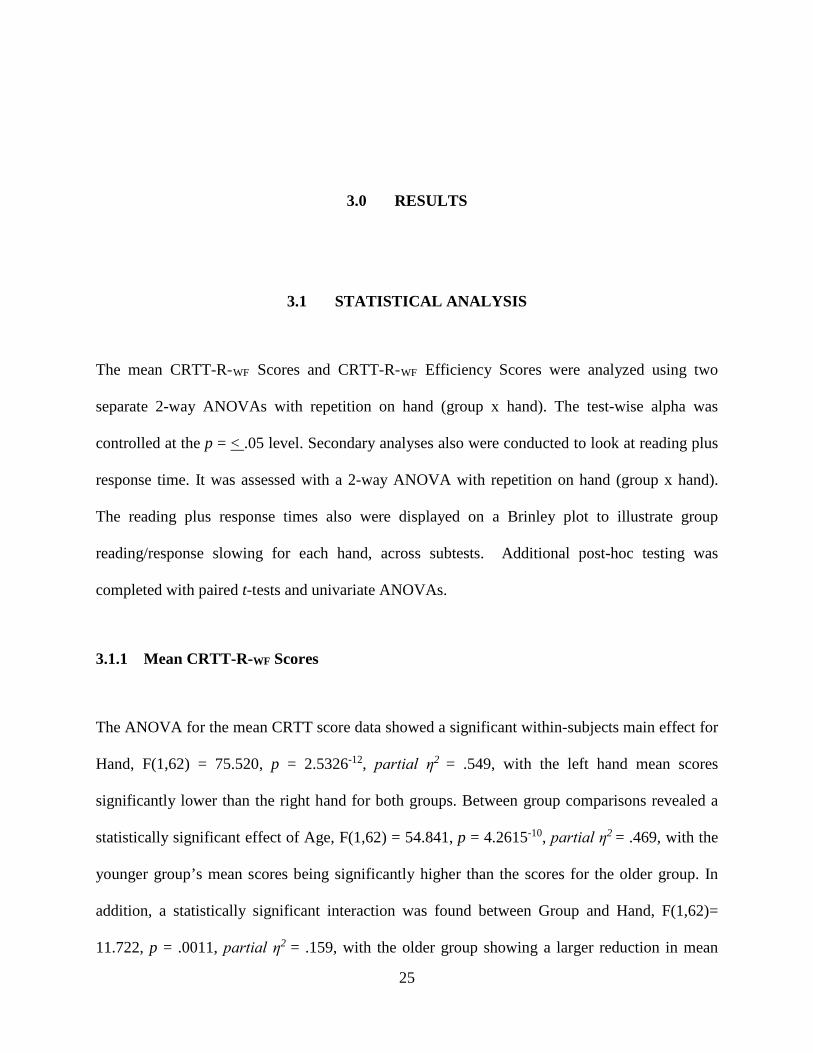
11.722, p = .0011, partial ƞ2 = .159, with the older group showing a larger reduction in mean
26
score with their left hand. Figure 2 depicts the average mean scores and standard deviation by
Age and Hand. Significant differences are illustrated with a bracket above the bars, and the
asterisk represents the source of the significant interaction. The data used to create the graph also
can be found in Table 3 and Table 4.
Figure 2: Overall Mean CRTT-R-WF Scores by Age and Hand
27
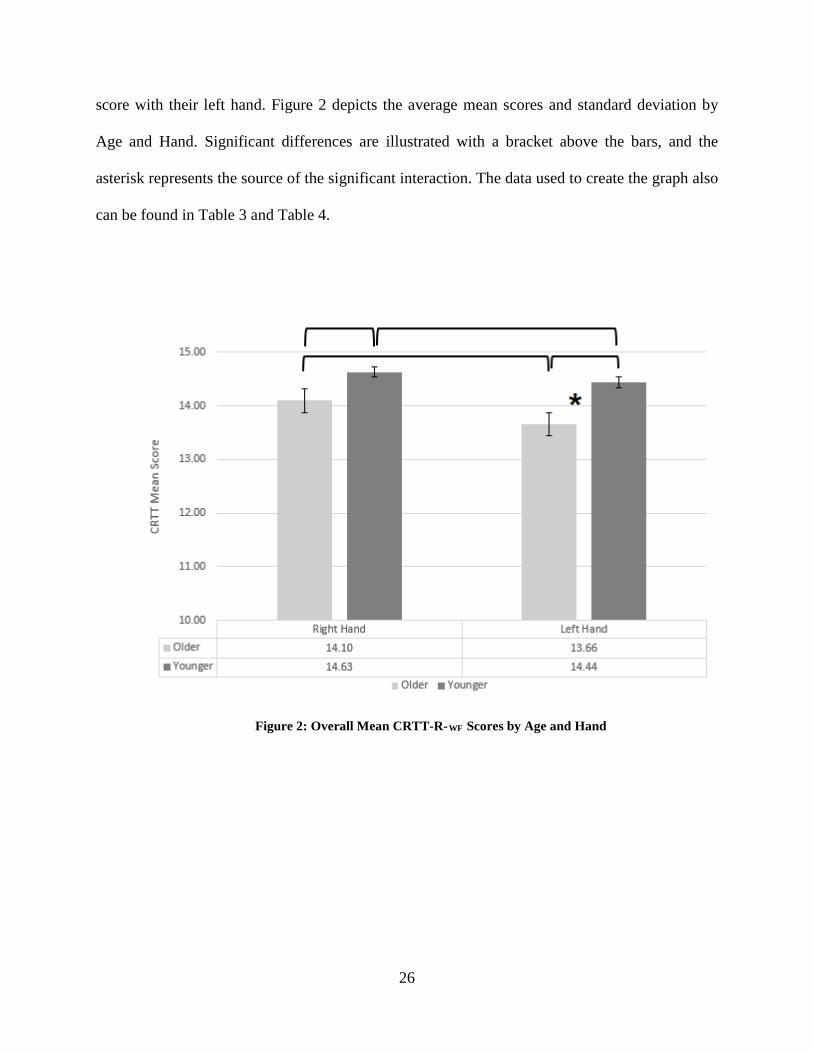
Table 3: Older Group Average Mean CRTT-R-WF Scores and Standard Deviations by Subtest and
Hand
Subtest
I II III IV V VI VII VIII IX X Overall
Right Hand AVE
13.99 14.44 13.98 13.77 13.83 13.96 14.11 13.79 14.48 14.64 14.10
Right Hand SD
0.52 0.54 0.71 0.87 0.77 0.78 0.53 0.71 1.09 0.44 .50
Left Hand AVE
13.19 13.73 13.36 13.47 13.23 13.45 13.58 13.40 13.80 14.64 13.66
Left Hand SD
0.49 0.64 0.96 0.76 0.77 0.97 0.67 0.93 0.51 0.39 0.49
Table 4: Younger Group Average Mean CRTT-R-WF Scores and Standard Deviations by Subtest and
Hand
Subtest
I II III IV V VI VII VIII IX X Overall
Right Hand AVE
14.91 14.93 14.76 14.74 14.28 14.32 14.46 14.31 14.73 14.87 14.63
Right Hand SD
0.15 0.12 0.43 0.48 0.38 0.51 0.36 0.37 0.32 0.24 0.16
Left Hand AVE
14.39 14.80 14.38 14.61 14.01 14.14 14.14 14.26 14.79 14.84 14.44
Left Hand SD
0.47 0.22 0.45 0.43 0.73 0.63 0.53 0.39 0.22 0.26 0.24
28
3.1.2 CRTT-R-WF Efficiency Scores
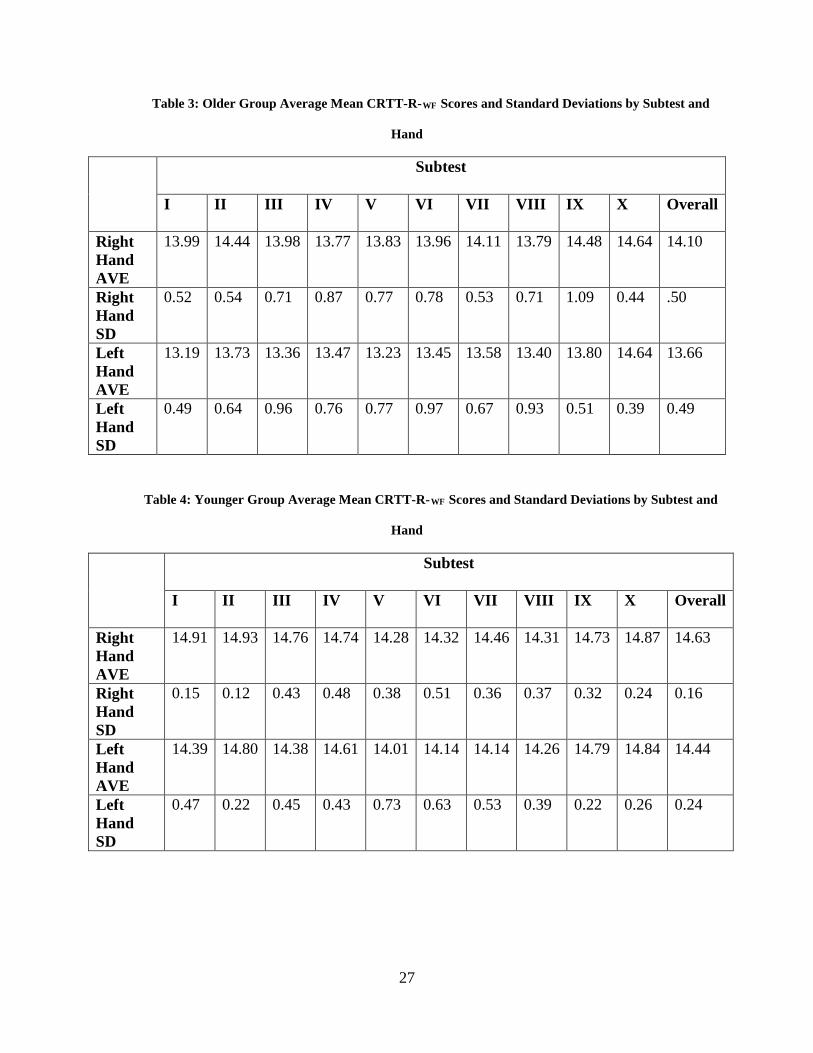
The ANOVA for Efficiency Score showed a significant main effect for Hand, F(1,62) = 113.489,
p = 1.2228-15, partial ƞ2 = .674, with the left hand Efficiency Scores being significant lower than
the right hand for both groups. A significant difference also was observed between Groups, F(1,
62) = 82.319, p = 5.5724-13, partial ƞ2 = .570, with the older group demonstrating significantly
lower efficiency scores than the younger group. In addition, a statistically significant interaction
was found between Group and Hand, F(62, 1) = 6.287, p = .015, partial ƞ2 = .092, with the older
group showing a larger reduction in Efficiency Score with their left hand. Figure 3 depicts the
average efficiency scores and standard deviation by Age and Hand. Significant differences are
again illustrated with a bracket above the bars and the asterisk represents the likely source of the
significant interaction. The data used to create the graph can be found in Table 5 and Table 6.
Figure 3: Overall Efficiency CRTT-R-WF Scores by Age and Hand
29
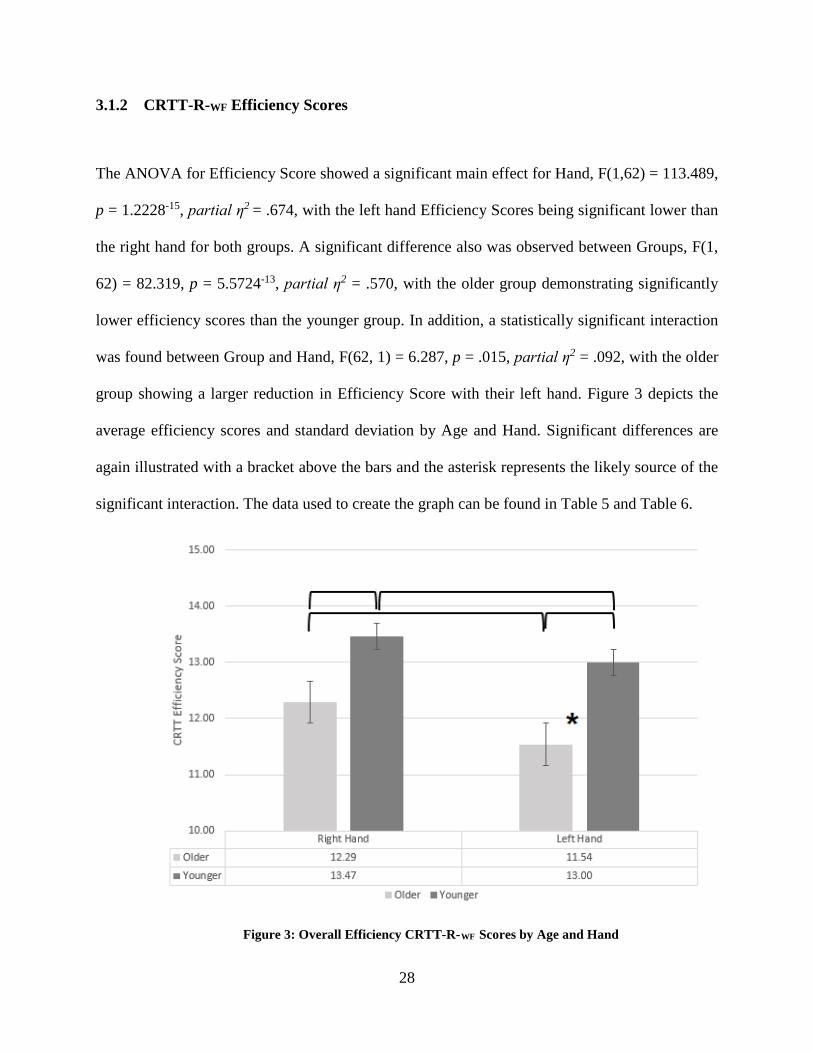
Table 5: Older Group CRTT-R-WF Average Efficiency Scores and Standard Deviations by Subtest
and Hand
Subtest
I II III IV V VI VII VIII IX X Overall
Right Hand AVE
13.06 13.40 12.29 11.80 11.47 11.36 11.78 11.11 13.16 13.48 12.29
Right Hand SD
0.66 0.75 0.93 1.11 1.28 1.19 0.88 1.20 1.32 0.70 0.77
Left Hand AVE
11.85 12.41 11.22 11.05 10.57 10.50 10.94 10.51 13.09 13.28 11.54
Left Hand SD
0.74 0.89 1.09 1.17 1.15 1.32 1.16 1.36 0.81 0.69 0.84
Table 6: Younger Group CRTT-R-WF Average Efficiency Scores and Standard Deviations by Subtest
and Hand
Subtest
I II III IV V VI VII VIII IX X Overall
Right Hand AVE
14.29 14.22 13.67 13.56 12.67 12.62 12.99 21.62 13.89 14.11 13.47
Right Hand SD
0.20 0.19 0.49 0.50 0.57 0.76 0.50 0.52 0.51 0.36 0.28
Left Hand AVE
13.59 13.91 12.98 13.04 12.18 12.04 12.33 12.27 13.79 13.9 13.00
Left Hand SD
0.54 0.28 0.51 0.47 0.78 0.79 0.61 0.57 0.37 0.37 0.36
30
3.2 SECONDARY ANALYSES
3.2.1 Reading Plus Response Times
As a secondary analysis, overall reading plus response times (i.e., the time taken from the onset
of the command signaled by the appearance of a stoplight, to the participant’s selection of a
token on the screen with a mouse click), were investigated. This measure most strongly parallels
the reaction time measures that were examined by Hendricks (n.d.). There was a statistically
significant main effect for Group, F(62,1) = 116.176, p = 7.6053-16, partial ƞ2 = .652, with the
older group performing significantly slower than the younger group. A statistically significant
main effect also was observed for Hand, F(62, 1) = 10.877, p = .002, partial ƞ2 = .149, with the
left hand performing significantly slower than the right hand for both groups. There was no
significant Group by Hand interactions. Figure 4 illustrates the average Reading Plus Response
times (measured in milliseconds) and standard deviations by Age and Hand. Significant
differences are illustrated with a bracket above the bars. The data used to create this figure can be
found in Table 7 and Table 8.
31
Figure 4: Overall CRTT-R-WF Reading Plus Response Times (msec) by Age and Hand
Table 7: Older Group CRTT-R-WF Average Reading Plus Response Times (msec) and Standard
Deviations by Subtest and Hand
Subtest
I II III IV V VI VII VIII IX X Overall
Right Hand AVE 4652 5233 7573 9898 8675 10774 10675 12879 9206 9129 8869
Right Hand SD 1065 1276 2267 3213 2435 2826 2789 3842 3045 2076 2180
Left Hand AVE 6222 5881 8050 10136 9195 11269 11112 13015 9374 9589 9384
Left Hand SD 2041 1571 1966 2777 2527 2706 2321 3325 1775 1919 1920
32
Table 8: Younger Group CRTT-R-WF Average Reading Plus Response Times (msec) and Standard
Deviations by Subtest and Hand
Subtest
I II III IV V VI VII VIII IX X Overall
Right Hand AVE 2460 2923 3868 4995 4760 6209 5389 6680 5311 5452 4805
Right Hand SD 487 614 853 1099 1272 1724 1470 1643 1554 1260 1091
Left Hand AVE 3823 3440 4525 5677 5153 6472 6033 7039 5697 5941 5380
Left Hand SD 3802 659 868 1193 1093 1238 1289 1650 1211 1413 1040
A 3-way ANOVA (Group x Hand x Subtest) was then performed on the Reading Plus
Response Time data. A statistically significant main effect was observed for Hand, F(1,62) =
10.877, p = .002, partial ƞ2 = .149, with the left hand performing significantly slower than the
right hand. A significant main effect for Subtest also was observed, F(1,62) = 449.800, p =
4.1033-30, partial ƞ2 = .879, with all subtest scores differing from one other, except for Subtests 1
and 2, 4 and 9, 4 and 10, and 9 and 10. Additionally, there was a main effect observed by Group,
F(1,62) = 116.176, p = 7.6053-16, partial ƞ2 = .652, with the older group performing significantly
slower than the younger group. Two 2-way interaction was observed of Subtest by Group,
F(1,62) = 28.136, p = .000002, partial ƞ2 = .312, and for Subtest by Hand, F(1,62) = 5.448, p =
.023, partial ƞ2 = .081. There was no 2-way interaction of Hand by Group. There were no 3-way
interactions. These patterns are similar to those seen in the 2-way ANOVAs.
To account for the significant Subtest by Hand interaction, paired t-tests were computed
to test for Hand differences in Reading Plus Response Times per subtest. Significant differences
were found for Subtests I, II, III, VII, and X but not for IV, VI, VIII, and IX. False Discovery
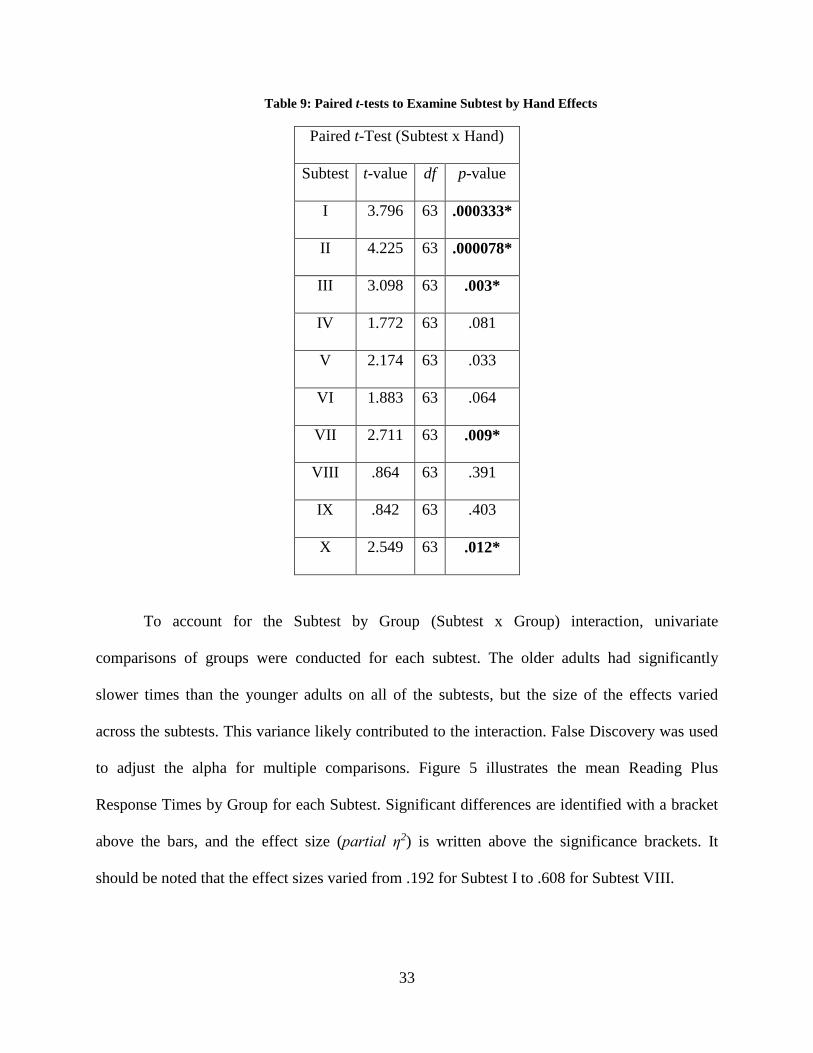
was used to adjust the alpha for multiple comparisons. Refer to Table 9 for t-values and p-
values. Significant values are indicated with a bolded asterisk.
33
Table 9: Paired t-tests to Examine Subtest by Hand Effects
Paired t-Test (Subtest x Hand)
Subtest t-value df p-value
I 3.796 63 .000333*
II 4.225 63 .000078*
III 3.098 63 .003*
IV 1.772 63 .081
V 2.174 63 .033
VI 1.883 63 .064
VII 2.711 63 .009*
VIII .864 63 .391
IX .842 63 .403
X 2.549 63 .012*
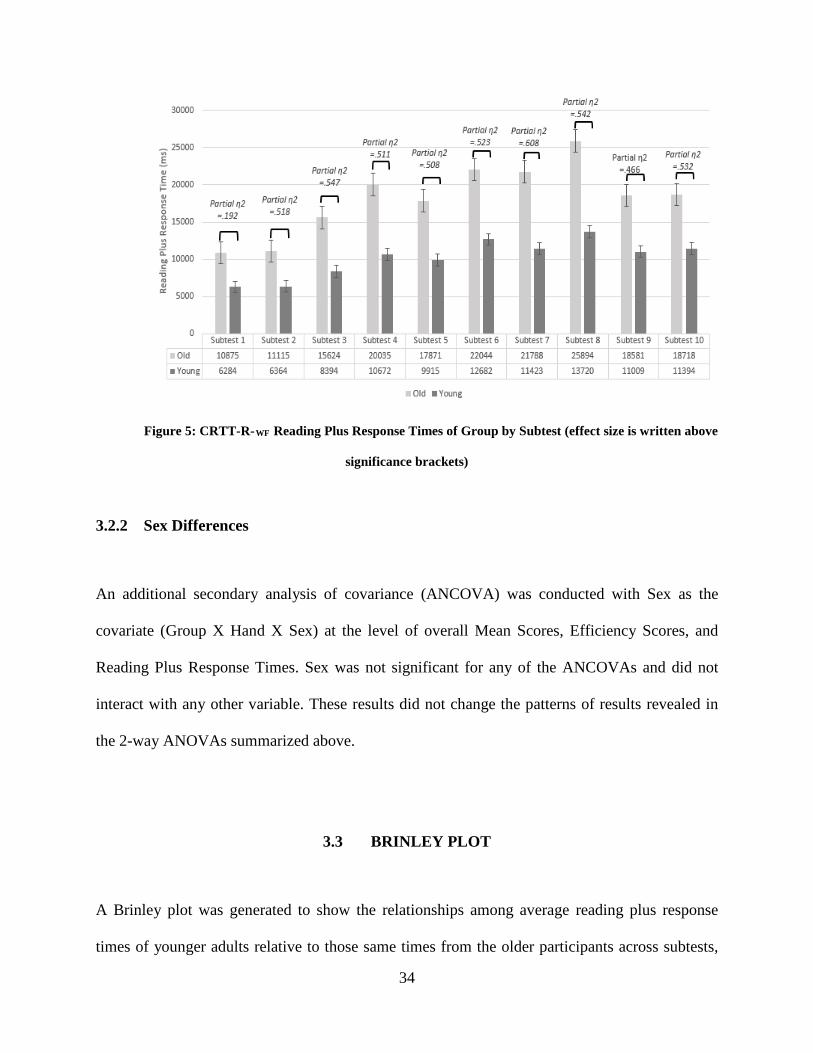
To account for the Subtest by Group (Subtest x Group) interaction, univariate
comparisons of groups were conducted for each subtest. The older adults had significantly
slower times than the younger adults on all of the subtests, but the size of the effects varied
across the subtests. This variance likely contributed to the interaction. False Discovery was used
to adjust the alpha for multiple comparisons. Figure 5 illustrates the mean Reading Plus
Response Times by Group for each Subtest. Significant differences are identified with a bracket
above the bars, and the effect size (partial ƞ2) is written above the significance brackets. It
should be noted that the effect sizes varied from .192 for Subtest I to .608 for Subtest VIII.
34
Figure 5: CRTT-R-WF Reading Plus Response Times of Group by Subtest (effect size is written above
significance brackets)
3.2.2 Sex Differences
An additional secondary analysis of covariance (ANCOVA) was conducted with Sex as the
covariate (Group X Hand X Sex) at the level of overall Mean Scores, Efficiency Scores, and
Reading Plus Response Times. Sex was not significant for any of the ANCOVAs and did not
interact with any other variable. These results did not change the patterns of results revealed in
the 2-way ANOVAs summarized above.
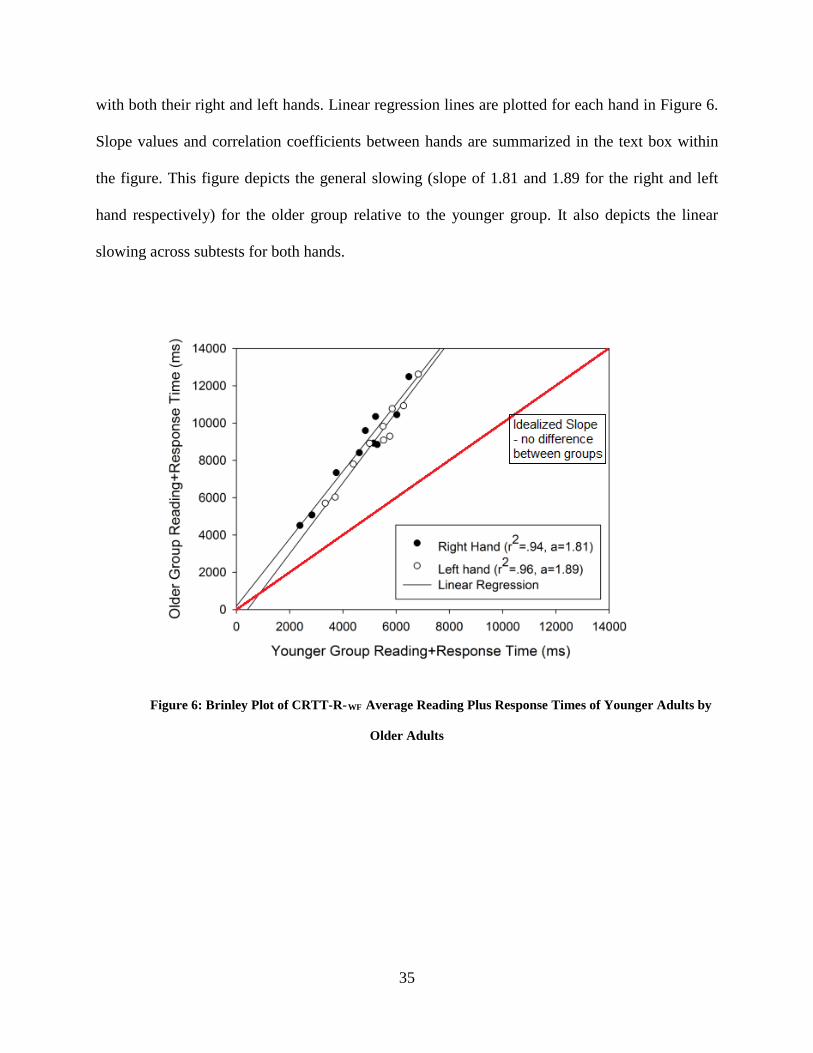
3.3 BRINLEY PLOT
A Brinley plot was generated to show the relationships among average reading plus response
times of younger adults relative to those same times from the older participants across subtests,
35
with both their right and left hands. Linear regression lines are plotted for each hand in Figure 6.
Slope values and correlation coefficients between hands are summarized in the text box within
the figure. This figure depicts the general slowing (slope of 1.81 and 1.89 for the right and left
hand respectively) for the older group relative to the younger group. It also depicts the linear
slowing across subtests for both hands.
Figure 6: Brinley Plot of CRTT-R-WF Average Reading Plus Response Times of Younger Adults by
Older Adults
36
4.0 DISCUSSION
This study examined the CRTT-R-WF mean and efficiency scores as an effect of age and hand
use. The CRTT was originally designed to assess language comprehension and processing, while
limiting the demands on working memory and attention. The CRTT-R-WF, however, may
increase the demands on working memory given its word-by-word presentation format. Theories
of cognitive aging and reaction time studies were referenced to hypothesize how the CRTT-R-WF
mean and efficiency scores would change across age and hand. The hypotheses and results of the
age and hand use effects on CRTT-R-WF performance are discussed below.
4.1 AGING
The first and third experimental questions asked whether or not CRTT-R-WF mean and efficiency
scores would significantly differ as an effect of age. It was hypothesized that both mean and
efficiency scores would show a significant age effect. The older group showed significantly
lower mean and efficiency scores than the younger group. These observations confirmed the
original hypothesis, or failed to reject its null. To explain this finding, it is important to mention
the stimulus presentation format of the CRTT-R-WF. The disappearance of a word with the onset
of a new word prevents individuals from re-reading the command. This structure is more similar
to the presentation of the listening CRTT-L test where spoken words are presented serially, with
37
each word disappearing with the onset of the next word. However, incoming auditory stimuli and
visual information involve difference processing resources. The stimulus presentation format of
the CRTT-R-WF, involving both written language and word-by-word presentation, could increase
demands on working memory more so than other reading and listening versions of the CRTT.
Mean scores represent a measure of response success with accuracy, responsiveness,
promptness and efficiency built into the multidimensional scoring system. Scores are not binarily
based on whether or not the individual selected the correct shape, color, size, etc. Although the
overall CRTT-R-WF scores were relatively high for the older group, scores were still significantly
lower than the younger group. Working memory theories propose that capacity limitations
diminish older adults’ ability to comprehend and produce complex semantic content and
syntactic structure (Burke & Shafto, 2008). However, the sentences within the CRTT constrain
word-level and syntactic forms. Perhaps, then, the decrease in scores seen by older adults could
be explained by a decrease in working memory capacity. These results would then be consistent
with resource theories. Efficiency scores incorporate both response correctness and time, with a
special weighting on time. Significantly lower efficiency scores observed by the older group
could also be accounted for by the resource theory, as some of the “resources” are believed to
include attention and working memory. The significant interaction between hand and age could
also support this theory, hypothesizing that the older group allocated more resources to the left
hand, which diminished mean and efficiency scores. The significant difference in reading plus
response time across groups is consistent with both the generalized slowing theory and resource
theory. It is possible that the older adults, having less efficient processing speeds, requiring more
time to execute the commands. Similarly, older adults have less resources available to ensure that
all of the sentence components were maintained in order to process the sentence as a whole, and
38
then provide an accurate and efficient response. Inhibition deficit theories were discounted as
explanations, as participants were encouraged to take breaks as needed to maintain focus and
attention. Semantic and syntactic constraints within the commands limited the amount of
irrelevant linguistic information. Sensory/perceptual deficit theories were also diminished as
likely explanations for the results achieved due to the vision criterion required for eligibility.
Lastly, transmission deficit theories were not a sufficient explanation for the results of this study,
as these theories depend on the hypothetical structure of the representational models of language.
The linguistic constraints placed in the sentence commands of the CRTT limit the activations
from lexical representations.
4.2 HAND USE
The second and fourth experimental questions sought to determine if the hand used would have a
significant impact on mean and efficiency scores. In this study, the term “hand-preference” was
favored over “hand-dominance.” This was due to the fact that most computer mouses produced
are designed to be used with an individual’s right hand. Most left-handers have thus adapted to
and adopted the right-hand mouse. While a participant may consider themselves left-hand
dominant for fine or gross motor activities, they may prefer to use a computer mouse with their
right hand. It was assumed that unfamiliarity with their non-preferred hand would result in a
slowing performance, while comprehension of the commands would remain the same. It was
therefore hypothesized that the hand used to complete the assessment would only impact the
efficiency scores, not the mean scores. This hypothesis was partially rejected. Left hand
efficiency scores and mean scores were significantly lower than those achieved with the right
39
hand across participants. This was the non-preferred hand for all but two participants. These
findings support the notion that more resources could be devoted to an individual’s non-
dominant or non-automatized hand (Song & Bédard, 2013). This finding again supports the
resource theory. As more resources were allocated to overcoming the unfamiliarity of using their
non-preferred hand, less resources were available to working memory and processing speed. As
a result, mean and efficiency scores were reduced. The statistically significant interactions found
between mean score and hand, as well as efficiency score and hand, again support the
generalized slowing theories. Scores of older adults, when using their left hand, were over
additively slowed compared to the left-hand use for the younger group; whose performance was
also slower with their left hand.
These results are clinically significant for the continued use of the CRTT. These findings
call for the norming of the CRTT-R-WF for both age and hand. Additionally, for any test of
language comprehension that requires a motor response, clinicians should be cognizant of the
hand used. Unless test data demonstrate clearly that no effect of hand was identified, having an
individual complete motor-perceptual tasks with their non-dominant hand may diminish test
scores.
4.3 READING PLUS RESPONSE TIMES
Reading Plus Response Time was used to capture the time taken from the onset of the reading
stimulus, to the participant’s selection of a token on the screen with a mouse click. When
examining the results at an overall level as a secondary analysis, it was observed that the older
group performed significantly slower than the younger group. The older group was almost twice
40
as slow as they younger group. The older group was approximately 46% slower than the younger
group with their right hand, and approximately 43% slower than the younger group with their left
hand. It also was observed that the left hand performed significantly slower than the right hand
for both groups. The younger group was approximately 11% slower with their left hand than
their right, and the older group performed about 5% slower with their left hand than their right.
This trend is further supported by the trends visualized in the Brinley plot (see Figure 6). By
comparing the slope (a-values) of the regression lines across subtests, compared to an idealized
slope of 1.0, indicating no difference between groups, the older group is shown to be nearly
twice as slow as the younger group. The linearity of the Brinley plot suggests a generalized
slowing for the older group in spite of the significant differences across hands and subtests. High
correlation coefficients between hands for both groups provides support for this generalized
slowing interpretation.
Significant interactions also were identified. In an attempt to identify the source of these
significant interactions, additional analyses were conducted. The first interaction revealed that
the left hand Reading Plus Response Times were significantly slower on each subtest, regardless
of Group. Paired t-tests were computed to further analyze this hand by subtest interaction. At the
subtest level, once alpha was controlled for, some subtests (I, II, III, VI, VII, X) remained
significantly different by hand. Others (IV, V, VIII, IX) did not show a significant difference.
This pattern of differences versus no differences is believed to be the source of the interaction.
Univariate analyses were then conducted to further analyze the Subtest by Group interaction,
where, older adults performed significantly slower across subtests than younger adults.
Examination of the effect size for each subtest revealed that Subtest I had an unusually small
effect size (.192), while Subtest VII had a much larger effect size (.608). All other effect sizes
41
were relatively similar, except for that of Subtest IX which was slightly smaller (.466). The
discrepancy in the magnitude of these effect sizes is believed to be the source of this interaction.
This measure most strongly parallels the reaction time measures that were examined by
Hendricks (n.d.). Hendricks (n.d.) found that the reaction time task requiring movement control,
that which is most similar to the underlying sensorimotor and cognitive functions required for
responses to the CRTT-R-WF commands, also showed a statistically significant effect of age and
hand used.
42
5.0 LIMITATIONS AND OBSERVATIONS
5.1 STUDY LIMITATIONS
Several limitations in study design and data collection were identified by the co-investigators,
and should be taken into consideration when determining the overall strength of this study. It is
difficult to identify if and/or to what extent these variables increased the variance or the
variability within or among participants. However, it is important not to overlook the possibility.
First, the CRTT program was run using two computers. These computers were different brands
and had different screen sizes. Secondly, most of the data was collected outside of a university
lab space where environmental differences in lighting and background noises were observed.
Another limitation is that the time of testing varied considerably. The earliest session began at
8am, whereas the latest session concluded at 9pm. Depending on the testing timeframe, personal
factors (fatigue, hunger, boredom) may have influenced performance. A relatively large sample
size (n = 64) and experimental design controls such as randomization were used to control the
impacts of these uncontrolled variables. While the CRTT is a computer-administered and scored
test, inter and intra-judge reliability between researchers should be considered regarding the
administration of the preliminary procedures. It was also observed that participants were more
familiar with expectations the second time they completed the language processing and reaction
time tasks.
43
5.2 OBSERVATIONS FOR FURTURE RESEARCH
By 2050, projections indicate that the population aged 65 and older will be 83.9 million people in
the United States (Ortman, Velkoff, & Hogan, 2014). At this rate, the demand for SLPs who
serve the geriatric population are predicted to rise proportionally. In order to best serve this
population, it is imperative that clinicians gain a better understanding of how normal, age-related
changes impact scores on diagnostic measures and performance on treatment protocols. Like all
research studies conducted, this study requires replication.
The results of this study revealed a significant age effect between two groups of
participants: a younger group (20-32 years) and an older group (65-78 years). Further research
should include the range of ages in-between these two groups (35-64 years). Including the
middle age range could allow for a better understanding of the rate at which CRTT-R-WF mean
and efficiency scores decline with age. Additional studies should both increase and decrease the
age intervals for groups of participants. This could also lead to a more accurate point of optimal
age-related performance as well as the deflection point in the decline from optimal performance.
This study found a significant difference in CRTT-R-WF mean scores, efficiency scores,
and reading plus response times as an effect of hand use. The frequency with which an individual
uses a computer mouse, and with which hand, should also be studied. Likewise, an individual
who is left-hand dominant but prefers to use the computer mouse with their right hand could
score differently than a left-hand dominant individual who also uses a computer mouse with their
left hand.
Normative data should continue to be collected both by age and by hand at least for
healthy individuals, based on the statistically significant main effects and interactions found
between age and hand use on the CRTT-R-WF mean and efficiency scores. Whether these effects
44
will be replicated with pathological populations is another opportunity for further research. This
study should also be replicated using other CRTT listening reading versions to determine if the
observed age and hand effects are also evident in these test protocols. New data is also emerging
that shorter versions of the CRTT (three commands per subtest as opposed to 10) may accurately
predict an individual’s overall performance (Fassbinder et al., 2017). This study could be
replicated using the shorter versions of the CRTT to see if the main effects and interactions of
age and hand use are observed in this test version as well.
This study was conducted simultaneously with a parallel study run by Hendricks (n.d.).
Hendricks compared the CRTT-RT battery performance on the same participants within this
study protocol. By comparing participants’ reaction time data with their performance on the
CRTT-R-WF, researchers may be able to gain a better understanding of how sensori-motor,
perceptual, and cognitive variables impact overall performance on the CRTT.
45
6.0 SUMMARY AND CONCLUSION
This study was conducted in order to investigate the effects of age and hand use on CRTT-R-WF
mean and efficiency scores. There were statistically significant main effects for both age and
hand use on both the mean and efficiency scores. There also were statistically significant
interactions observed for both the mean and efficiency scores, revealing an over-additive slowing
with the left hand for the older group. A secondary analysis showed statistically significant main
effects for both age and hand use on Reading Plus Response Time. However, no statistically
significant interaction was observed for this dependent measure. It is difficult to determine if the
age effect results were due to a decrease in cognitive capabilities supporting language, or due to
a primary decrease in language comprehension. The CRTT is a diagnostic tool used
experimentally and clinically to measure language comprehension and processing in persons
with aphasia. This preliminary study adds to the normative data being collected from healthy,
normal participants. The effects of age and hand present verify that normative data should not
only be collected across the age-span, but also by hand used. This may have special relevance for
the estimates of severity for the diagnosis of aphasia, as they often present with hemiplegia and
may be required to complete this assessment with their non-preferred hand.
These data will eventually be combined with the data analyzed by Hendricks (n.d.). This
research will be used to explore if and/or to what extent an individual’s language comprehension
and processing abilities, as measured by the CRTT-R-WF, are affected by perceptual-motor-
46
cognitive skills required to complete the test, as measured by the CRTT-RT Battery Tasks. This
combination of data will offer insight into the locus of the deficit revealed by performance on the
test.
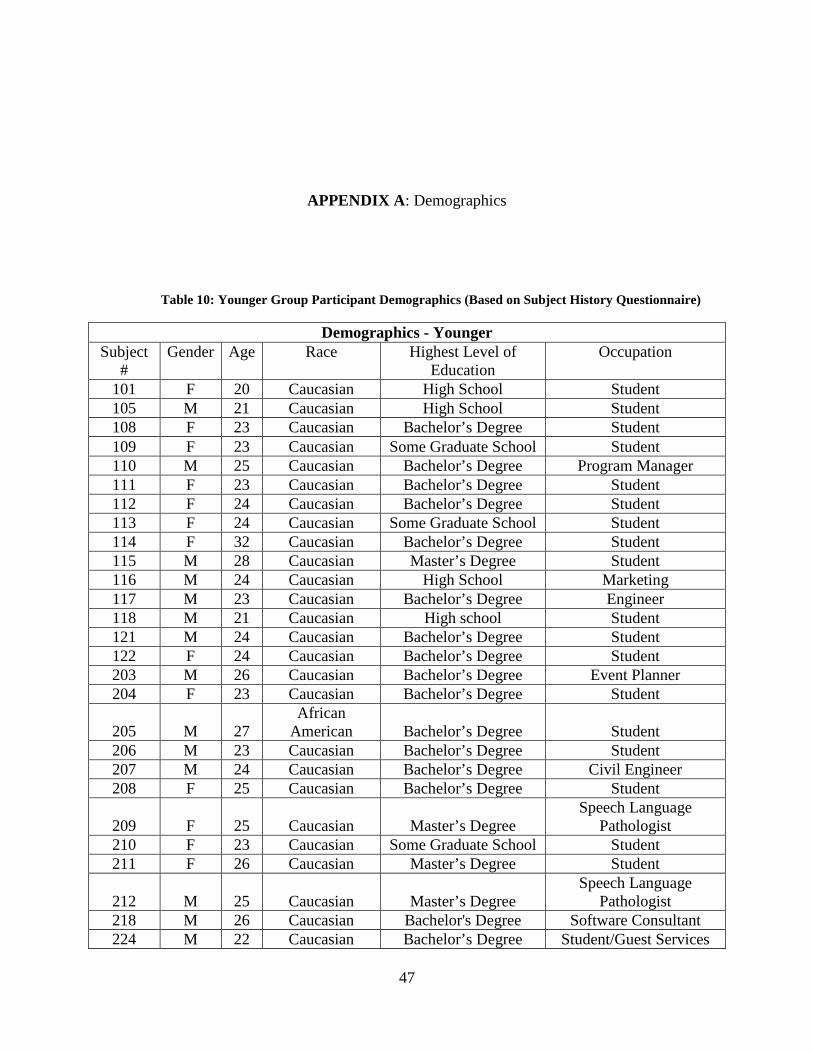
47
APPENDIX A: Demographics
Table 10: Younger Group Participant Demographics (Based on Subject History Questionnaire)
Demographics - Younger Subject
# Gender Age Race Highest Level of
Education Occupation
101 F 20 Caucasian High School Student 105 M 21 Caucasian High School Student 108 F 23 Caucasian Bachelor’s Degree Student 109 F 23 Caucasian Some Graduate School Student 110 M 25 Caucasian Bachelor’s Degree Program Manager 111 F 23 Caucasian Bachelor’s Degree Student 112 F 24 Caucasian Bachelor’s Degree Student 113 F 24 Caucasian Some Graduate School Student 114 F 32 Caucasian Bachelor’s Degree Student 115 M 28 Caucasian Master’s Degree Student 116 M 24 Caucasian High School Marketing 117 M 23 Caucasian Bachelor’s Degree Engineer 118 M 21 Caucasian High school Student 121 M 24 Caucasian Bachelor’s Degree Student 122 F 24 Caucasian Bachelor’s Degree Student 203 M 26 Caucasian Bachelor’s Degree Event Planner 204 F 23 Caucasian Bachelor’s Degree Student
205 M 27 African
American Bachelor’s Degree Student 206 M 23 Caucasian Bachelor’s Degree Student 207 M 24 Caucasian Bachelor’s Degree Civil Engineer 208 F 25 Caucasian Bachelor’s Degree Student
209 F 25 Caucasian Master’s Degree Speech Language
Pathologist 210 F 23 Caucasian Some Graduate School Student 211 F 26 Caucasian Master’s Degree Student
212 M 25 Caucasian Master’s Degree Speech Language
Pathologist 218 M 26 Caucasian Bachelor's Degree Software Consultant 224 M 22 Caucasian Bachelor’s Degree Student/Guest Services
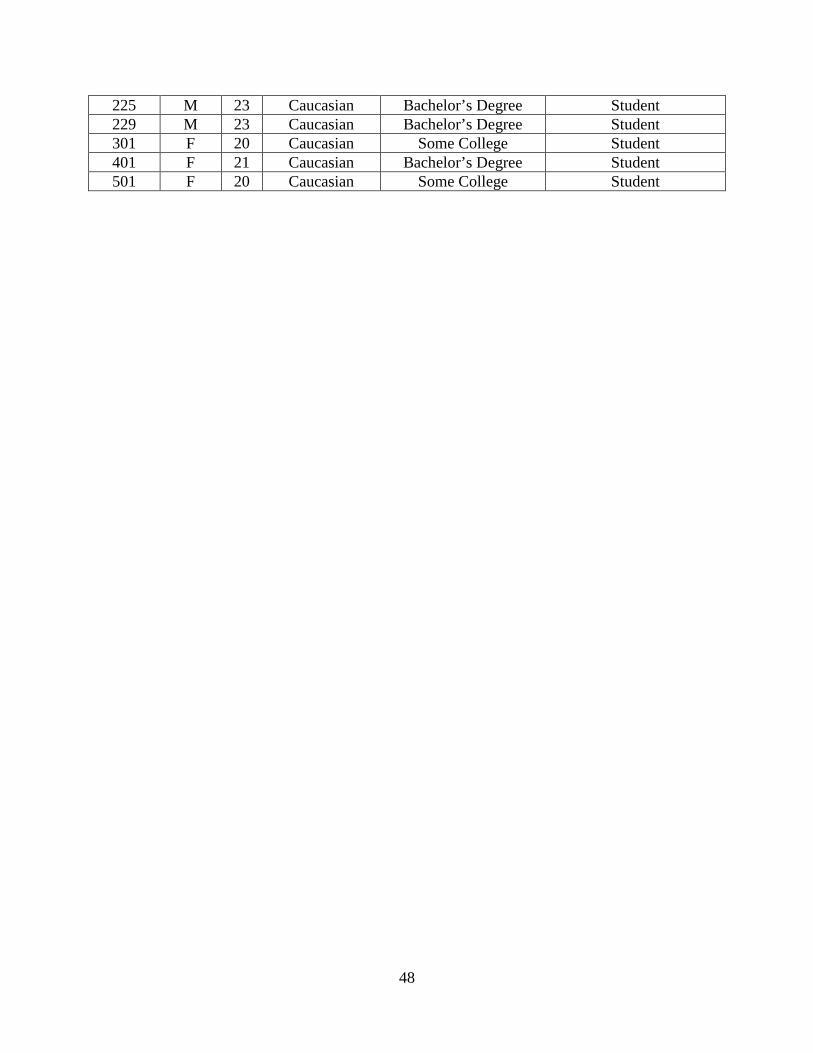
48
225 M 23 Caucasian Bachelor’s Degree Student 229 M 23 Caucasian Bachelor’s Degree Student 301 F 20 Caucasian Some College Student 401 F 21 Caucasian Bachelor’s Degree Student 501 F 20 Caucasian Some College Student
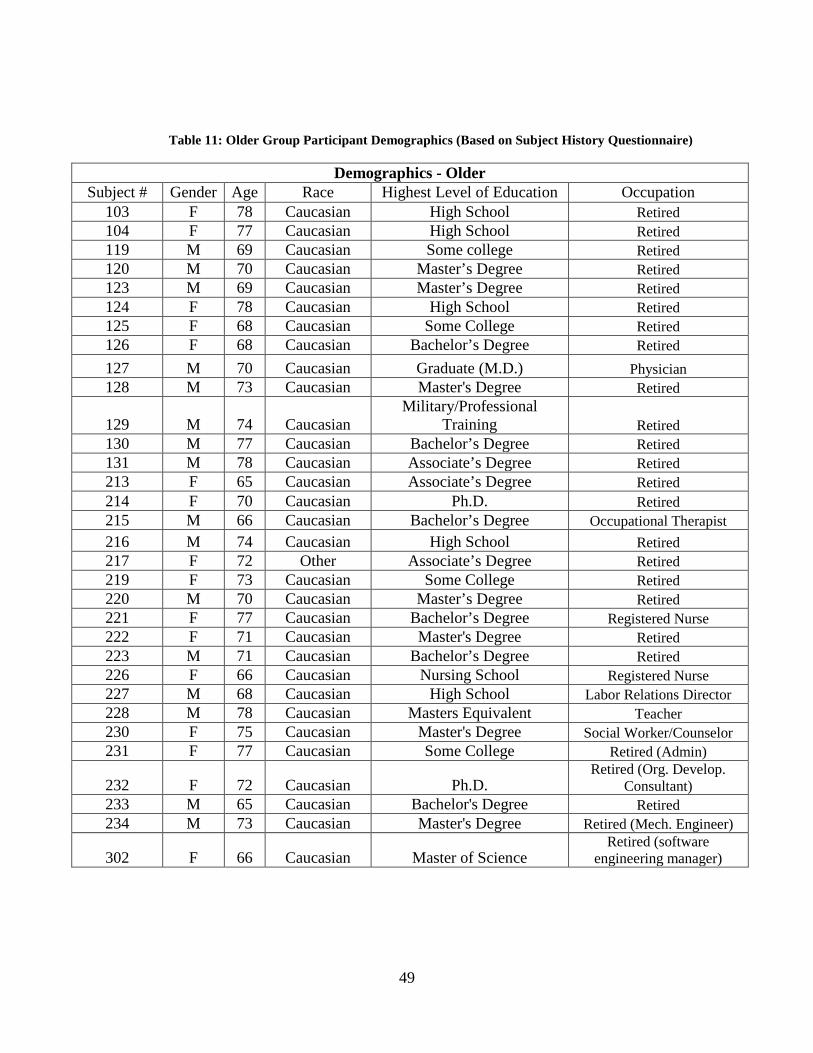
49
Table 11: Older Group Participant Demographics (Based on Subject History Questionnaire)
Demographics - Older Subject # Gender Age Race Highest Level of Education Occupation
103 F 78 Caucasian High School Retired 104 F 77 Caucasian High School Retired 119 M 69 Caucasian Some college Retired 120 M 70 Caucasian Master’s Degree Retired 123 M 69 Caucasian Master’s Degree Retired 124 F 78 Caucasian High School Retired 125 F 68 Caucasian Some College Retired 126 F 68 Caucasian Bachelor’s Degree Retired 127 M 70 Caucasian Graduate (M.D.) Physician 128 M 73 Caucasian Master's Degree Retired
129 M 74 Caucasian Military/Professional
Training Retired 130 M 77 Caucasian Bachelor’s Degree Retired 131 M 78 Caucasian Associate’s Degree Retired 213 F 65 Caucasian Associate’s Degree Retired 214 F 70 Caucasian Ph.D. Retired 215 M 66 Caucasian Bachelor’s Degree Occupational Therapist 216 M 74 Caucasian High School Retired 217 F 72 Other Associate’s Degree Retired 219 F 73 Caucasian Some College Retired 220 M 70 Caucasian Master’s Degree Retired 221 F 77 Caucasian Bachelor’s Degree Registered Nurse 222 F 71 Caucasian Master's Degree Retired 223 M 71 Caucasian Bachelor’s Degree Retired 226 F 66 Caucasian Nursing School Registered Nurse 227 M 68 Caucasian High School Labor Relations Director 228 M 78 Caucasian Masters Equivalent Teacher 230 F 75 Caucasian Master's Degree Social Worker/Counselor 231 F 77 Caucasian Some College Retired (Admin)
232 F 72 Caucasian Ph.D. Retired (Org. Develop.
Consultant) 233 M 65 Caucasian Bachelor's Degree Retired 234 M 73 Caucasian Master's Degree Retired (Mech. Engineer)
302 F 66 Caucasian Master of Science Retired (software
engineering manager)
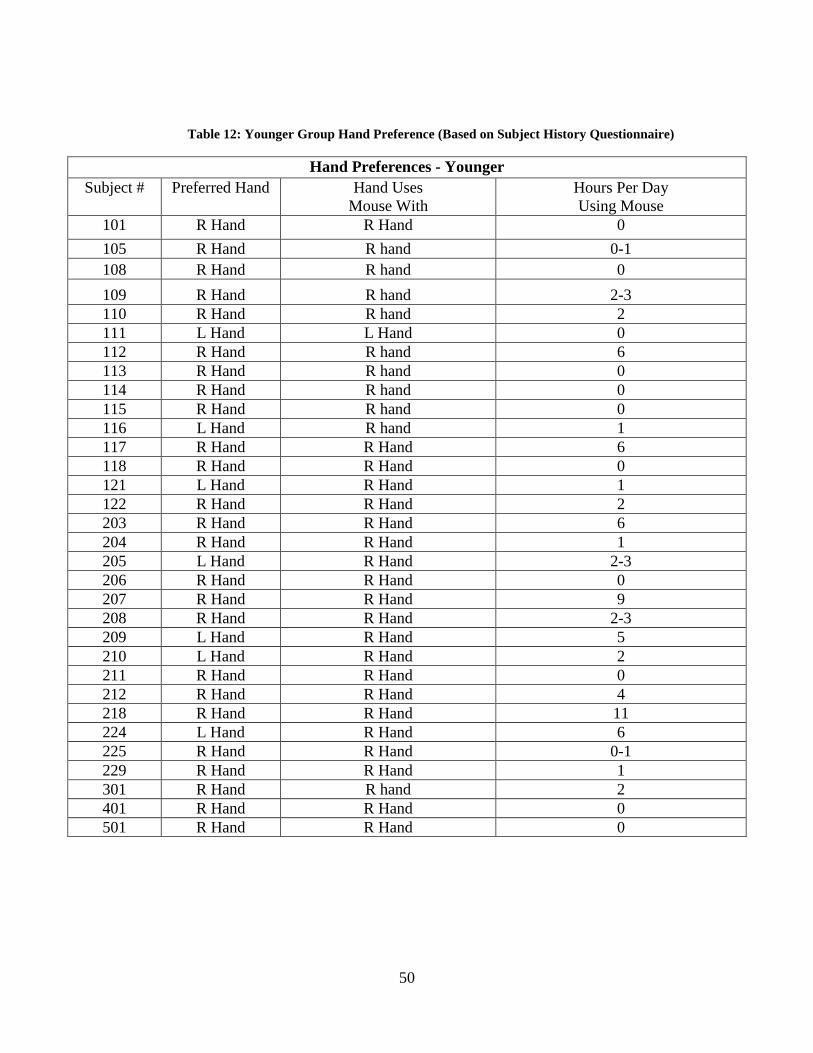
50
Table 12: Younger Group Hand Preference (Based on Subject History Questionnaire)
Hand Preferences - Younger Subject # Preferred Hand Hand Uses
Mouse With Hours Per Day Using Mouse
101 R Hand R Hand 0 105 R Hand R hand 0-1 108 R Hand R hand 0 109 R Hand R hand 2-3 110 R Hand R hand 2 111 L Hand L Hand 0 112 R Hand R hand 6 113 R Hand R hand 0 114 R Hand R hand 0 115 R Hand R hand 0 116 L Hand R hand 1 117 R Hand R Hand 6 118 R Hand R Hand 0 121 L Hand R Hand 1 122 R Hand R Hand 2 203 R Hand R Hand 6 204 R Hand R Hand 1 205 L Hand R Hand 2-3 206 R Hand R Hand 0 207 R Hand R Hand 9 208 R Hand R Hand 2-3 209 L Hand R Hand 5 210 L Hand R Hand 2 211 R Hand R Hand 0 212 R Hand R Hand 4 218 R Hand R Hand 11 224 L Hand R Hand 6 225 R Hand R Hand 0-1 229 R Hand R Hand 1 301 R Hand R hand 2 401 R Hand R Hand 0 501 R Hand R Hand 0
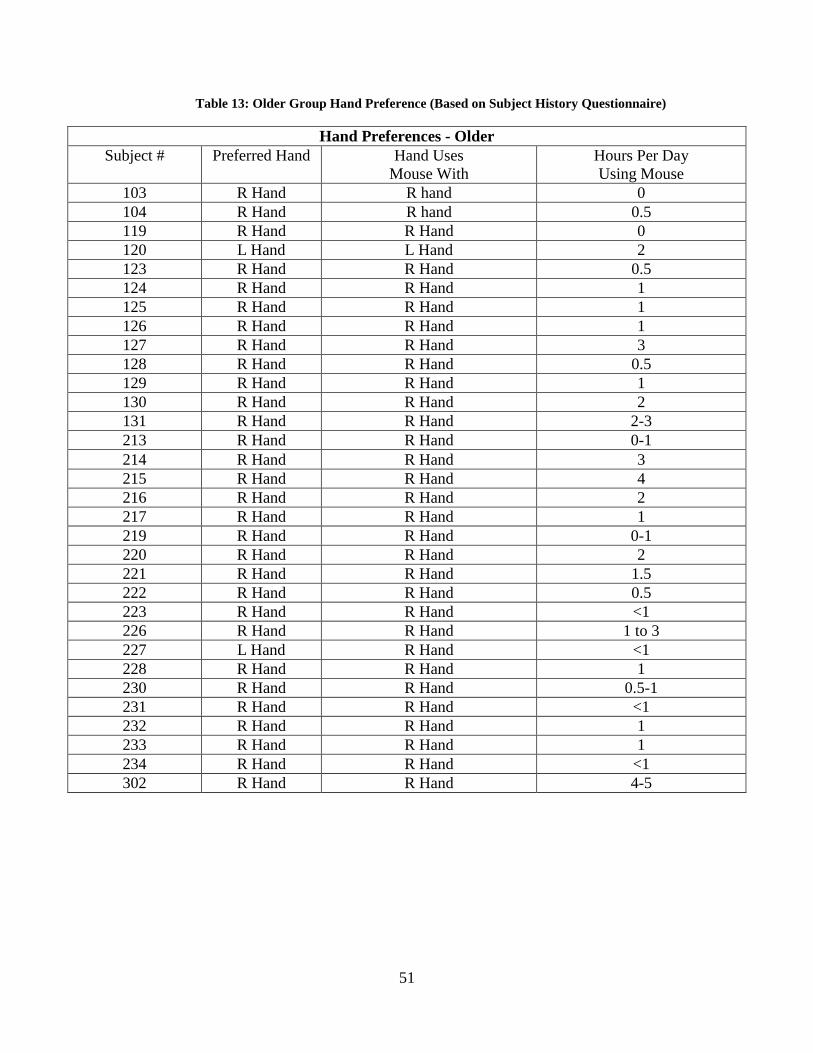
51
Table 13: Older Group Hand Preference (Based on Subject History Questionnaire)
Hand Preferences - Older Subject # Preferred Hand Hand Uses
Mouse With Hours Per Day Using Mouse
103 R Hand R hand 0 104 R Hand R hand 0.5 119 R Hand R Hand 0 120 L Hand L Hand 2 123 R Hand R Hand 0.5 124 R Hand R Hand 1 125 R Hand R Hand 1 126 R Hand R Hand 1 127 R Hand R Hand 3 128 R Hand R Hand 0.5 129 R Hand R Hand 1 130 R Hand R Hand 2 131 R Hand R Hand 2-3213 R Hand R Hand 0-1214 R Hand R Hand 3 215 R Hand R Hand 4 216 R Hand R Hand 2 217 R Hand R Hand 1 219 R Hand R Hand 0-1220 R Hand R Hand 2 221 R Hand R Hand 1.5 222 R Hand R Hand 0.5 223 R Hand R Hand <1 226 R Hand R Hand 1 to 3 227 L Hand R Hand <1 228 R Hand R Hand 1 230 R Hand R Hand 0.5-1 231 R Hand R Hand <1 232 R Hand R Hand 1 233 R Hand R Hand 1 234 R Hand R Hand <1 302 R Hand R Hand 4-5
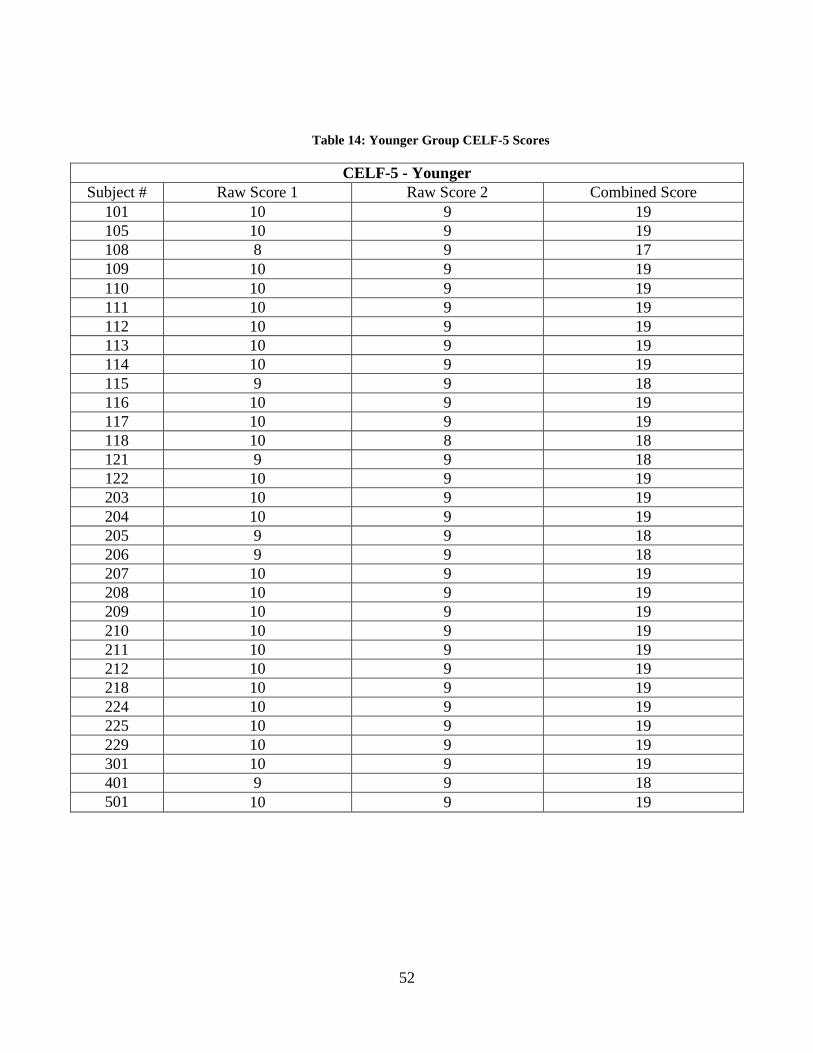
52
Table 14: Younger Group CELF-5 Scores
CELF-5 - Younger Subject # Raw Score 1 Raw Score 2 Combined Score
101 10 9 19 105 10 9 19 108 8 9 17 109 10 9 19 110 10 9 19 111 10 9 19 112 10 9 19 113 10 9 19 114 10 9 19 115 9 9 18 116 10 9 19 117 10 9 19 118 10 8 18 121 9 9 18 122 10 9 19 203 10 9 19 204 10 9 19 205 9 9 18 206 9 9 18 207 10 9 19 208 10 9 19 209 10 9 19 210 10 9 19 211 10 9 19 212 10 9 19 218 10 9 19 224 10 9 19 225 10 9 19 229 10 9 19 301 10 9 19 401 9 9 18 501 10 9 19
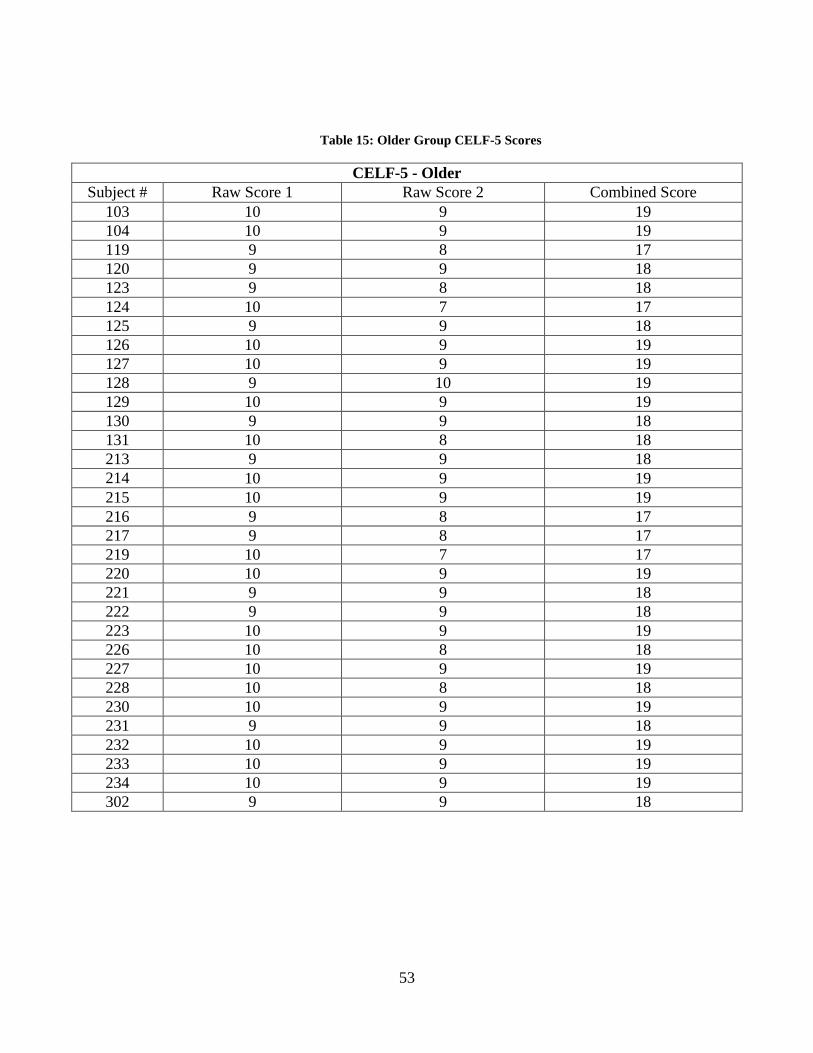
53
Table 15: Older Group CELF-5 Scores
CELF-5 - Older Subject # Raw Score 1 Raw Score 2 Combined Score
103 10 9 19 104 10 9 19 119 9 8 17 120 9 9 18 123 9 8 18 124 10 7 17 125 9 9 18 126 10 9 19 127 10 9 19 128 9 10 19 129 10 9 19 130 9 9 18 131 10 8 18 213 9 9 18 214 10 9 19 215 10 9 19 216 9 8 17 217 9 8 17 219 10 7 17 220 10 9 19 221 9 9 18 222 9 9 18 223 10 9 19 226 10 8 18 227 10 9 19 228 10 8 18 230 10 9 19 231 9 9 18 232 10 9 19 233 10 9 19 234 10 9 19 302 9 9 18
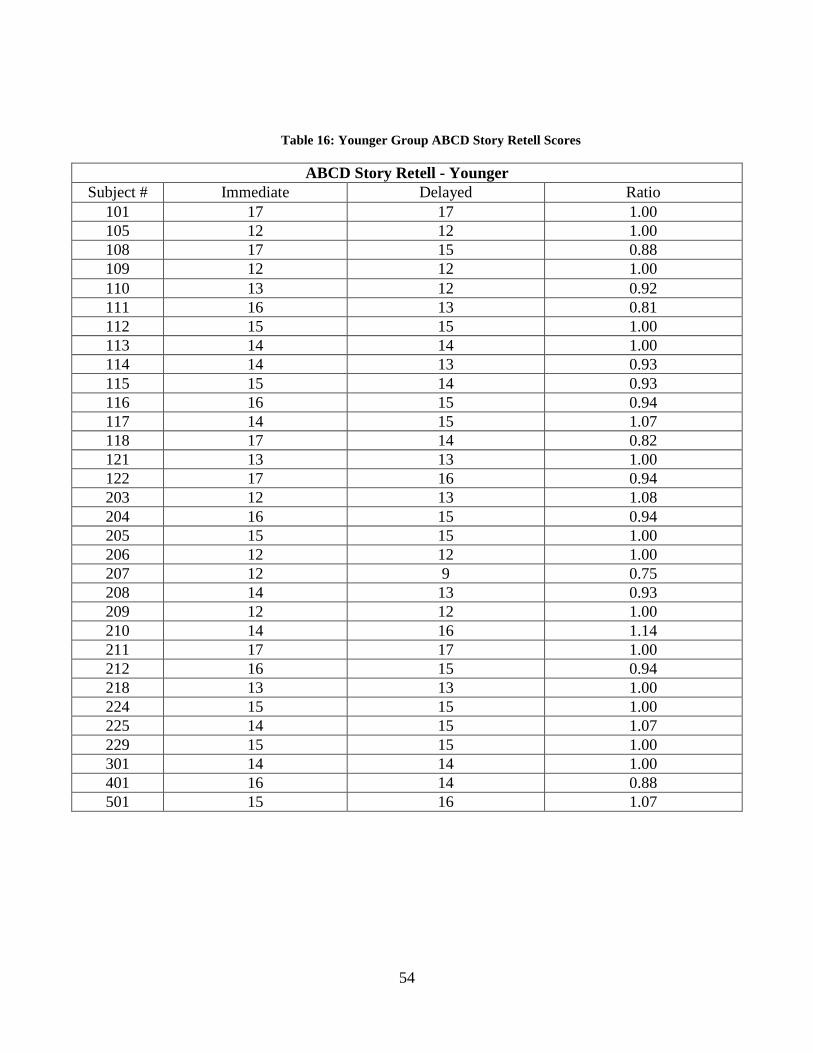
54
Table 16: Younger Group ABCD Story Retell Scores
ABCD Story Retell - Younger Subject # Immediate Delayed Ratio
101 17 17 1.00 105 12 12 1.00 108 17 15 0.88 109 12 12 1.00 110 13 12 0.92 111 16 13 0.81 112 15 15 1.00 113 14 14 1.00 114 14 13 0.93 115 15 14 0.93 116 16 15 0.94 117 14 15 1.07 118 17 14 0.82 121 13 13 1.00 122 17 16 0.94 203 12 13 1.08 204 16 15 0.94 205 15 15 1.00 206 12 12 1.00 207 12 9 0.75 208 14 13 0.93 209 12 12 1.00 210 14 16 1.14 211 17 17 1.00 212 16 15 0.94 218 13 13 1.00 224 15 15 1.00 225 14 15 1.07 229 15 15 1.00 301 14 14 1.00 401 16 14 0.88 501 15 16 1.07
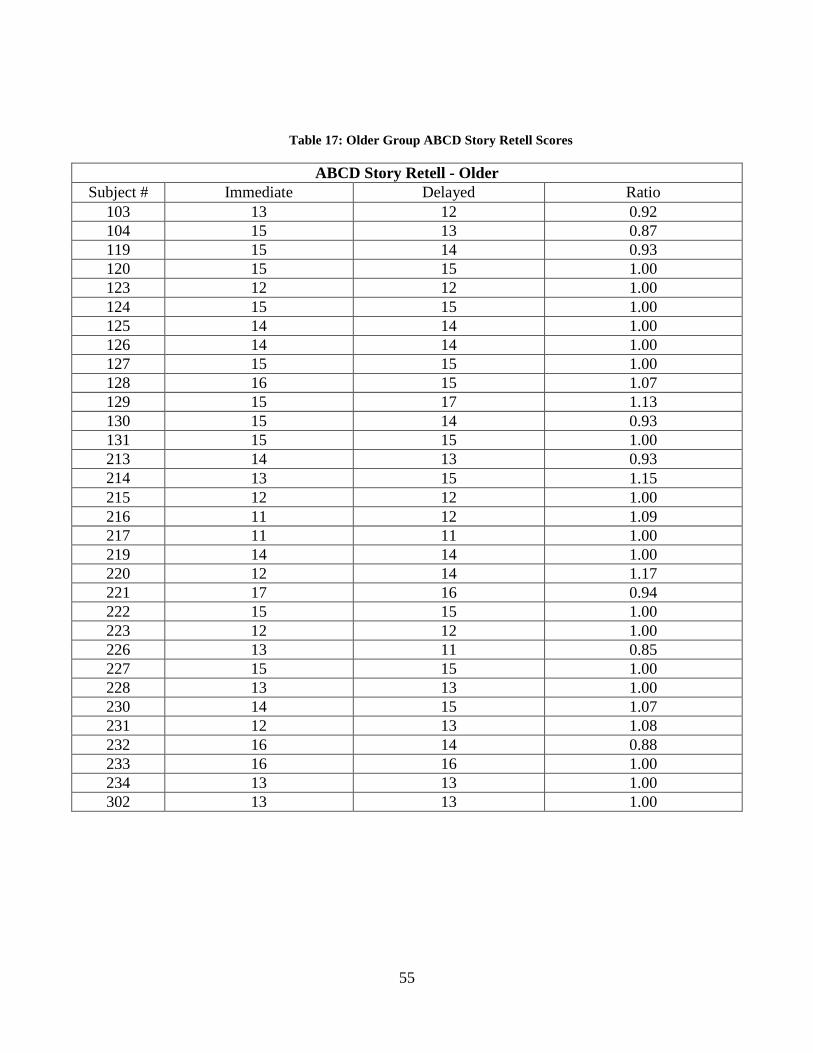
55
Table 17: Older Group ABCD Story Retell Scores
ABCD Story Retell - Older Subject # Immediate Delayed Ratio
103 13 12 0.92 104 15 13 0.87 119 15 14 0.93 120 15 15 1.00 123 12 12 1.00 124 15 15 1.00 125 14 14 1.00 126 14 14 1.00 127 15 15 1.00 128 16 15 1.07 129 15 17 1.13 130 15 14 0.93 131 15 15 1.00 213 14 13 0.93 214 13 15 1.15 215 12 12 1.00 216 11 12 1.09 217 11 11 1.00 219 14 14 1.00 220 12 14 1.17 221 17 16 0.94 222 15 15 1.00 223 12 12 1.00 226 13 11 0.85 227 15 15 1.00 228 13 13 1.00 230 14 15 1.07 231 12 13 1.08 232 16 14 0.88 233 16 16 1.00 234 13 13 1.00 302 13 13 1.00
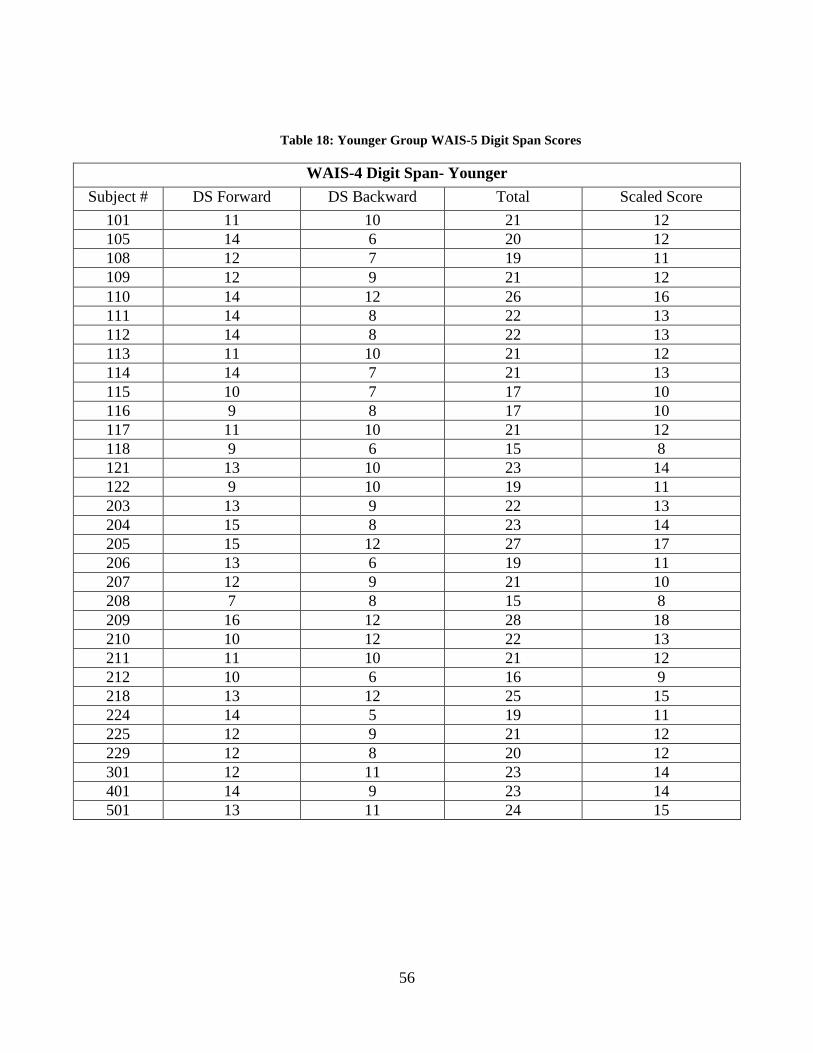
56
Table 18: Younger Group WAIS-5 Digit Span Scores
WAIS-4 Digit Span- Younger Subject # DS Forward DS Backward Total Scaled Score
101 11 10 21 12 105 14 6 20 12 108 12 7 19 11 109 12 9 21 12 110 14 12 26 16 111 14 8 22 13 112 14 8 22 13 113 11 10 21 12 114 14 7 21 13 115 10 7 17 10 116 9 8 17 10 117 11 10 21 12 118 9 6 15 8 121 13 10 23 14 122 9 10 19 11 203 13 9 22 13 204 15 8 23 14 205 15 12 27 17 206 13 6 19 11 207 12 9 21 10 208 7 8 15 8 209 16 12 28 18 210 10 12 22 13 211 11 10 21 12 212 10 6 16 9 218 13 12 25 15 224 14 5 19 11 225 12 9 21 12 229 12 8 20 12 301 12 11 23 14 401 14 9 23 14 501 13 11 24 15
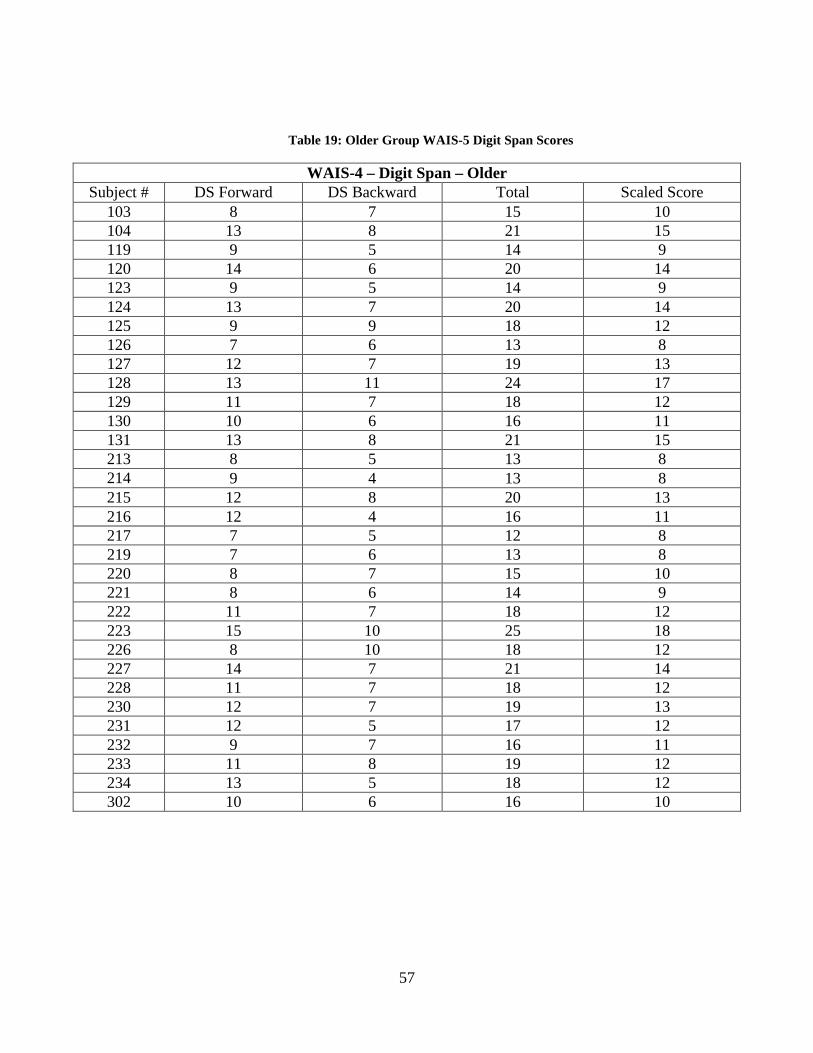
57
Table 19: Older Group WAIS-5 Digit Span Scores
WAIS-4 – Digit Span – Older Subject # DS Forward DS Backward Total Scaled Score
103 8 7 15 10 104 13 8 21 15 119 9 5 14 9 120 14 6 20 14 123 9 5 14 9 124 13 7 20 14 125 9 9 18 12 126 7 6 13 8 127 12 7 19 13 128 13 11 24 17 129 11 7 18 12 130 10 6 16 11 131 13 8 21 15 213 8 5 13 8 214 9 4 13 8 215 12 8 20 13 216 12 4 16 11 217 7 5 12 8 219 7 6 13 8 220 8 7 15 10 221 8 6 14 9 222 11 7 18 12 223 15 10 25 18 226 8 10 18 12 227 14 7 21 14 228 11 7 18 12 230 12 7 19 13 231 12 5 17 12 232 9 7 16 11 233 11 8 19 12 234 13 5 18 12 302 10 6 16 10
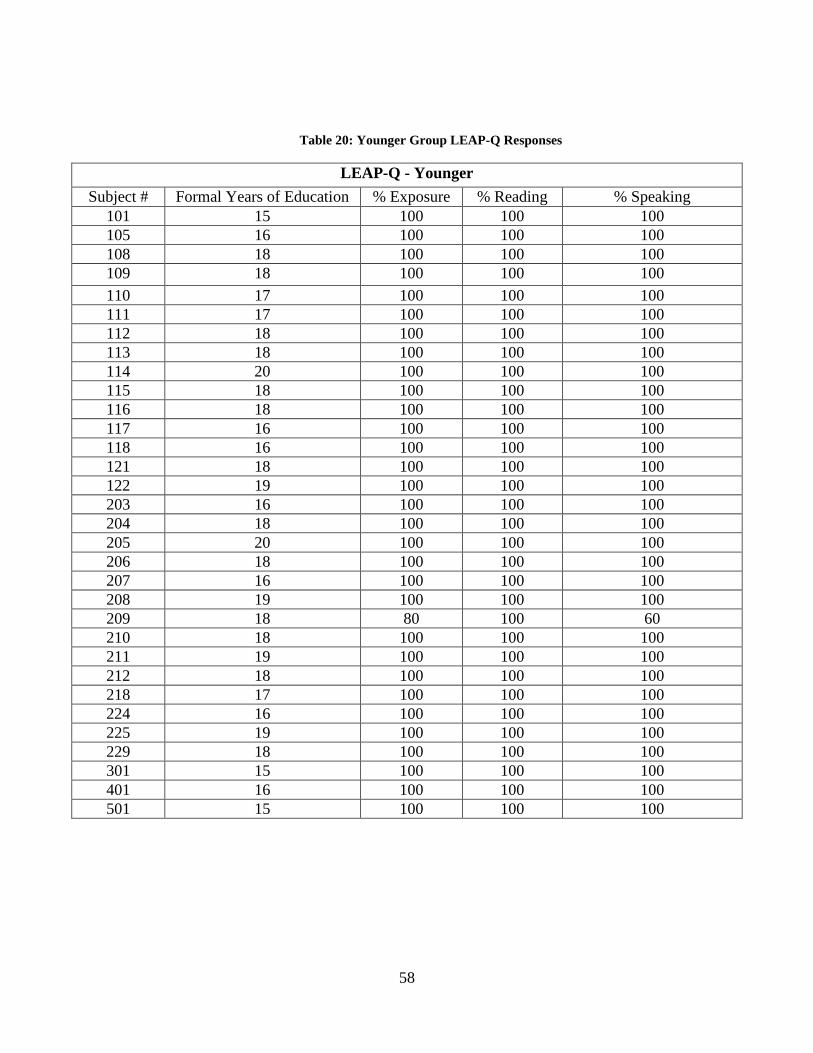
58
Table 20: Younger Group LEAP-Q Responses
LEAP-Q - Younger Subject # Formal Years of Education % Exposure % Reading % Speaking
101 15 100 100 100 105 16 100 100 100 108 18 100 100 100 109 18 100 100 100 110 17 100 100 100 111 17 100 100 100 112 18 100 100 100 113 18 100 100 100 114 20 100 100 100 115 18 100 100 100 116 18 100 100 100 117 16 100 100 100 118 16 100 100 100 121 18 100 100 100 122 19 100 100 100 203 16 100 100 100 204 18 100 100 100 205 20 100 100 100 206 18 100 100 100 207 16 100 100 100 208 19 100 100 100 209 18 80 100 60 210 18 100 100 100 211 19 100 100 100 212 18 100 100 100 218 17 100 100 100 224 16 100 100 100 225 19 100 100 100 229 18 100 100 100 301 15 100 100 100 401 16 100 100 100 501 15 100 100 100
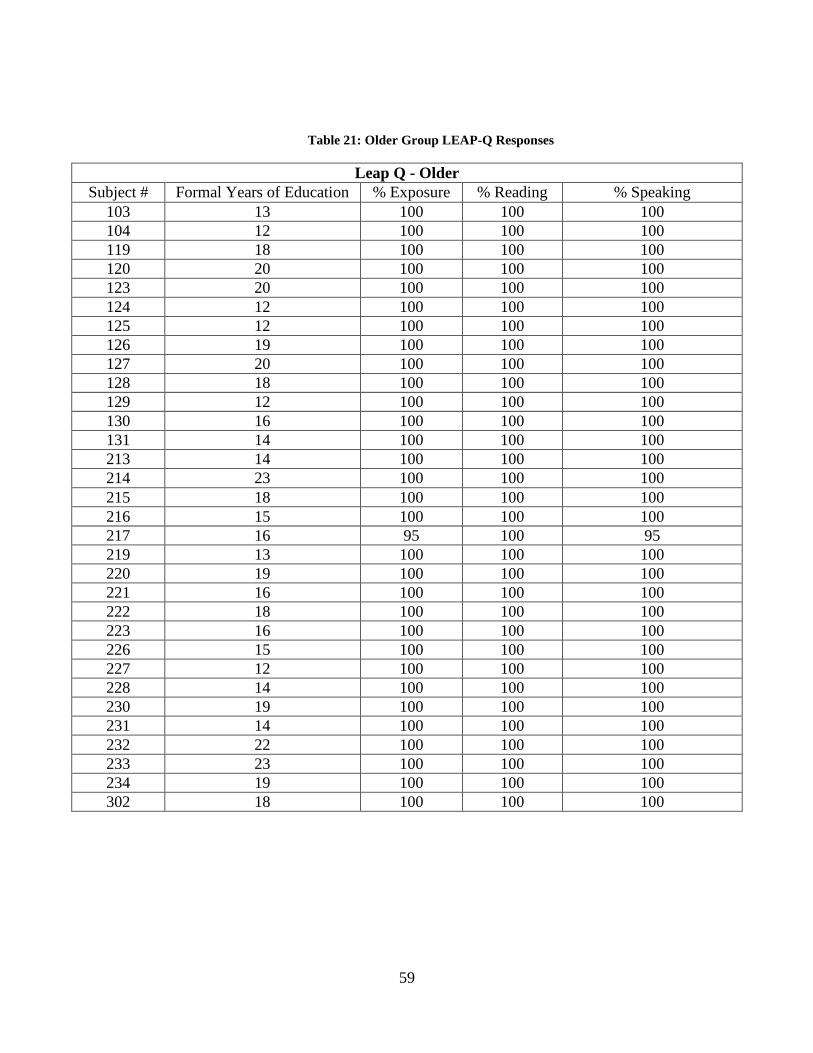
59
Table 21: Older Group LEAP-Q Responses
Leap Q - Older Subject # Formal Years of Education % Exposure % Reading % Speaking
103 13 100 100 100 104 12 100 100 100 119 18 100 100 100 120 20 100 100 100 123 20 100 100 100 124 12 100 100 100 125 12 100 100 100 126 19 100 100 100 127 20 100 100 100 128 18 100 100 100 129 12 100 100 100 130 16 100 100 100 131 14 100 100 100 213 14 100 100 100 214 23 100 100 100 215 18 100 100 100 216 15 100 100 100 217 16 95 100 95 219 13 100 100 100 220 19 100 100 100 221 16 100 100 100 222 18 100 100 100 223 16 100 100 100 226 15 100 100 100 227 12 100 100 100 228 14 100 100 100 230 19 100 100 100 231 14 100 100 100 232 22 100 100 100 233 23 100 100 100 234 19 100 100 100 302 18 100 100 100
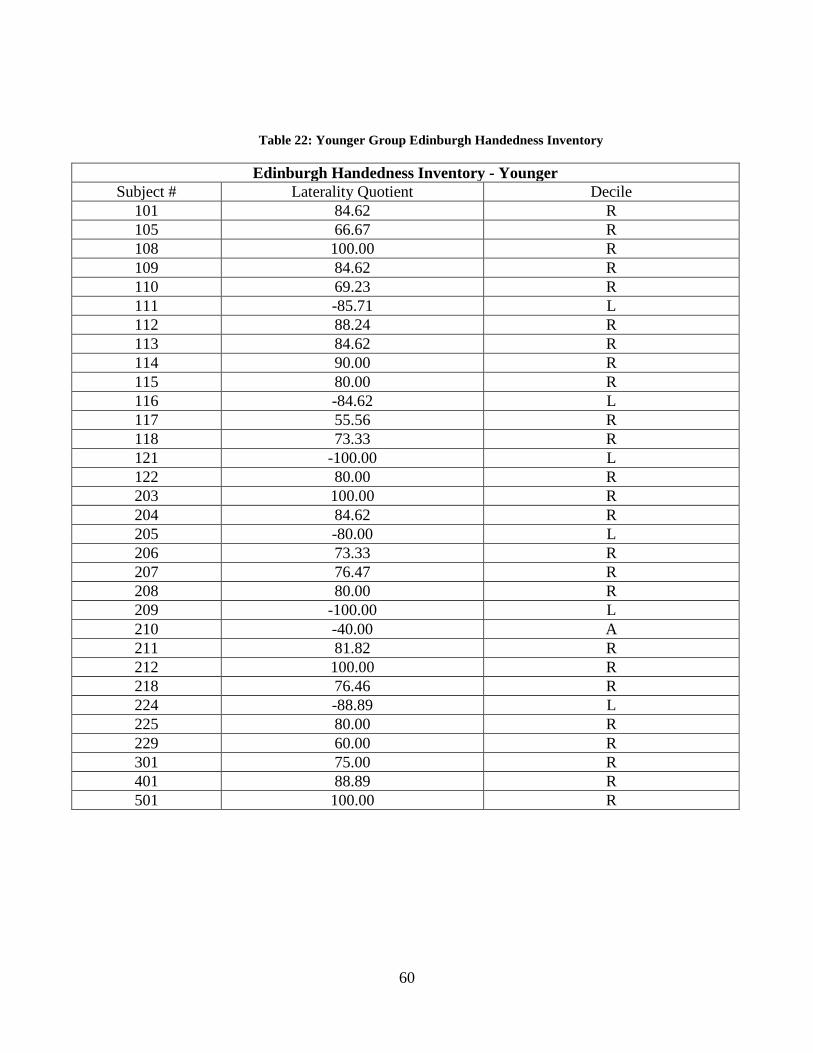
60
Table 22: Younger Group Edinburgh Handedness Inventory
Edinburgh Handedness Inventory - Younger Subject # Laterality Quotient Decile
101 84.62 R 105 66.67 R 108 100.00 R 109 84.62 R 110 69.23 R 111 -85.71 L 112 88.24 R 113 84.62 R 114 90.00 R 115 80.00 R 116 -84.62 L 117 55.56 R 118 73.33 R 121 -100.00 L 122 80.00 R 203 100.00 R 204 84.62 R 205 -80.00 L 206 73.33 R 207 76.47 R 208 80.00 R 209 -100.00 L 210 -40.00 A 211 81.82 R 212 100.00 R 218 76.46 R 224 -88.89 L 225 80.00 R 229 60.00 R 301 75.00 R 401 88.89 R 501 100.00 R
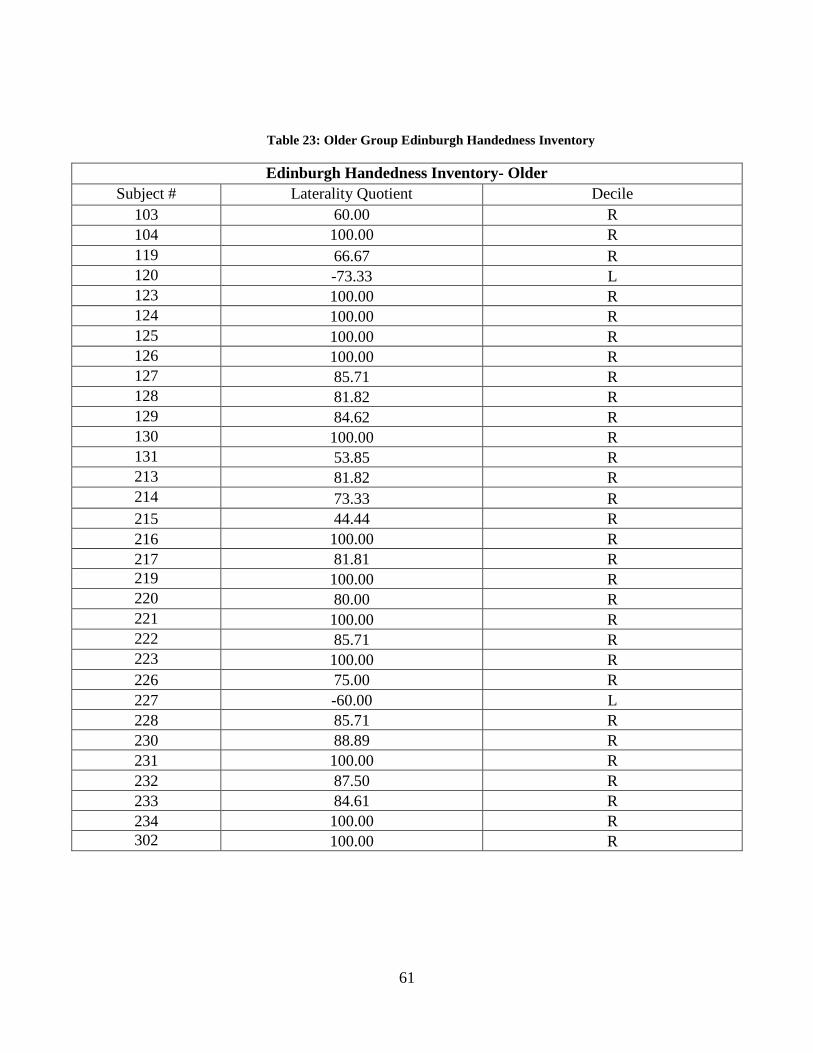
61
Table 23: Older Group Edinburgh Handedness Inventory
Edinburgh Handedness Inventory- Older Subject # Laterality Quotient Decile
103 60.00 R 104 100.00 R 119 66.67 R 120 -73.33 L 123 100.00 R 124 100.00 R 125 100.00 R 126 100.00 R 127 85.71 R 128 81.82 R 129 84.62 R 130 100.00 R 131 53.85 R 213 81.82 R 214 73.33 R 215 44.44 R 216 100.00 R 217 81.81 R 219 100.00 R 220 80.00 R 221 100.00 R 222 85.71 R 223 100.00 R 226 75.00 R 227 -60.00 L 228 85.71 R 230 88.89 R 231 100.00 R 232 87.50 R 233 84.61 R 234 100.00 R 302 100.00 R
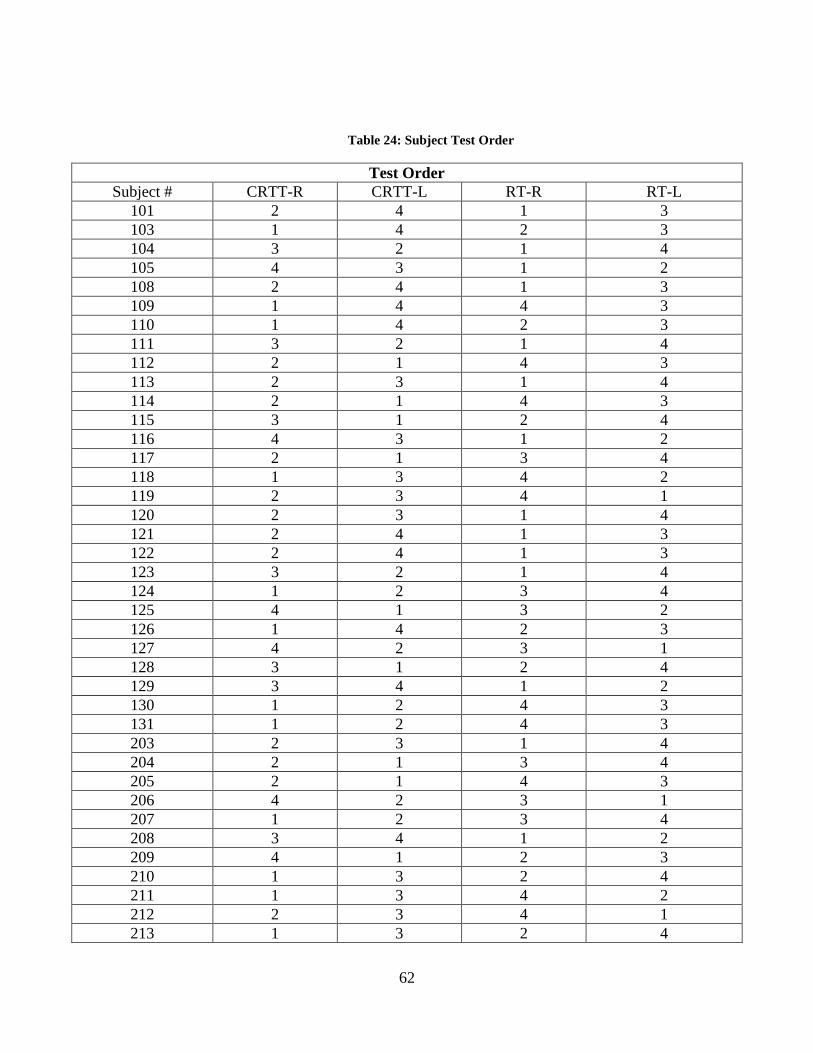
62
Table 24: Subject Test Order
Test Order Subject # CRTT-R CRTT-L RT-R RT-L
101 2 4 1 3 103 1 4 2 3 104 3 2 1 4 105 4 3 1 2 108 2 4 1 3 109 1 4 4 3 110 1 4 2 3 111 3 2 1 4 112 2 1 4 3 113 2 3 1 4 114 2 1 4 3 115 3 1 2 4 116 4 3 1 2 117 2 1 3 4 118 1 3 4 2 119 2 3 4 1 120 2 3 1 4 121 2 4 1 3 122 2 4 1 3 123 3 2 1 4 124 1 2 3 4 125 4 1 3 2 126 1 4 2 3 127 4 2 3 1 128 3 1 2 4 129 3 4 1 2 130 1 2 4 3 131 1 2 4 3 203 2 3 1 4 204 2 1 3 4 205 2 1 4 3 206 4 2 3 1 207 1 2 3 4 208 3 4 1 2 209 4 1 2 3 210 1 3 2 4 211 1 3 4 2 212 2 3 4 1 213 1 3 2 4
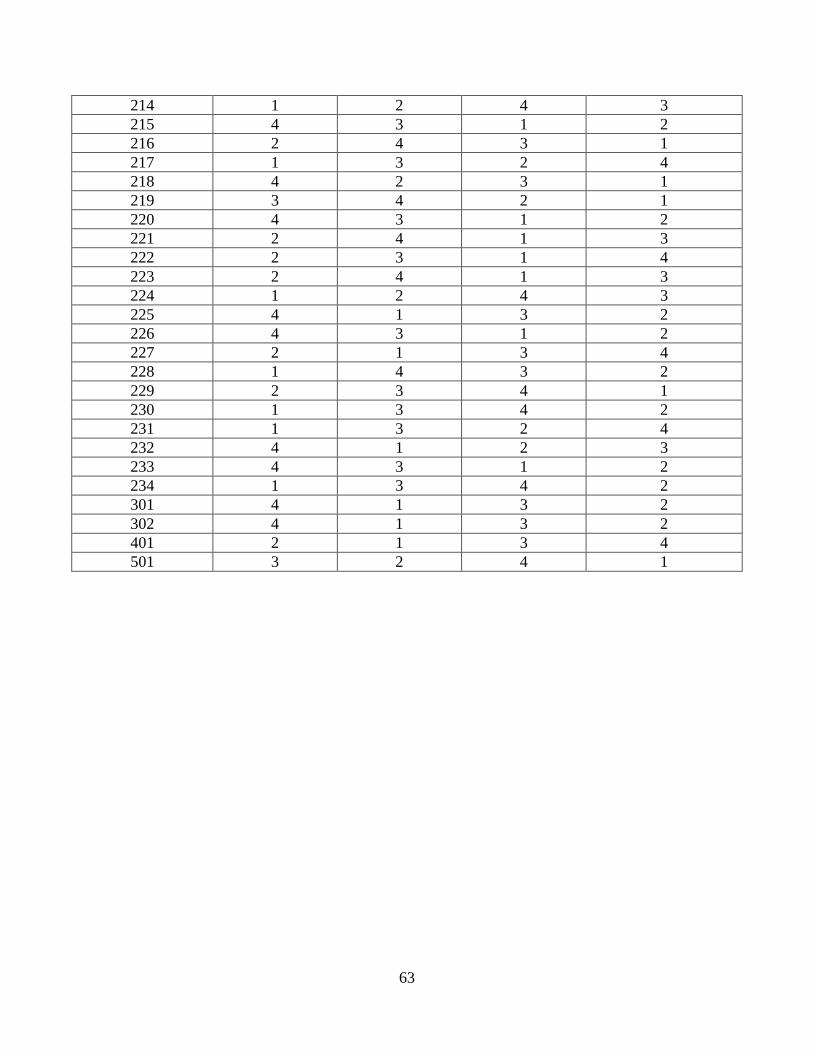
63
214 1 2 4 3 215 4 3 1 2 216 2 4 3 1 217 1 3 2 4 218 4 2 3 1 219 3 4 2 1 220 4 3 1 2 221 2 4 1 3 222 2 3 1 4 223 2 4 1 3 224 1 2 4 3 225 4 1 3 2 226 4 3 1 2 227 2 1 3 4 228 1 4 3 2 229 2 3 4 1 230 1 3 4 2 231 1 3 2 4 232 4 1 2 3 233 4 3 1 2 234 1 3 4 2 301 4 1 3 2 302 4 1 3 2 401 2 1 3 4 501 3 2 4 1
64
APPENDIX B: CRTT-RT Battery Task Descriptions and Data
Of the six RT tasks, Task: 1: Tapping; Task 2: Simple reaction time; and Task 3: Simple reaction
time plus movement are considered simple reaction time tasks. These tasks only require one
motor response to a given stimulus. CRTT-RT Task 1 required participants to tap a computer-
mouse as quickly as possible for a 10-second time period across 3 trials. The average interval
between taps was determined. This data was used to estimate basic motor-related speed across
ages and across hands. CRTT-RT Task 2 required participants to click the mouse as quickly as
possible after a token appeared in the center of the screen. A mix of thirty different tokens
(squares and circles of all 5 colors) were randomly presented, one at a time. measured the
response time required for detecting and responding to a visual stimulus. The time interval
between token presentations varied from 0 to 50ms to reduce the possibility of anticipatory
responses. The average response time across trials was determined. This data was used as a
measure of simple reaction time. CRTT-RT Task 3 added a simple movement to Task 2 in order
to measure movement time plus reaction time. Participants were required to move the cursor
from the bottom of the screen to the token that appeared in the center of the screen, then click the
mouse as quickly as possible. Participants performed this task across 30 trials. The time for each
stimulus/response was recorded. The average time for each stimulus/response was recorded. This
data was used to evaluate the speed at which a participant detected and then motorically
responded to a stimulus.
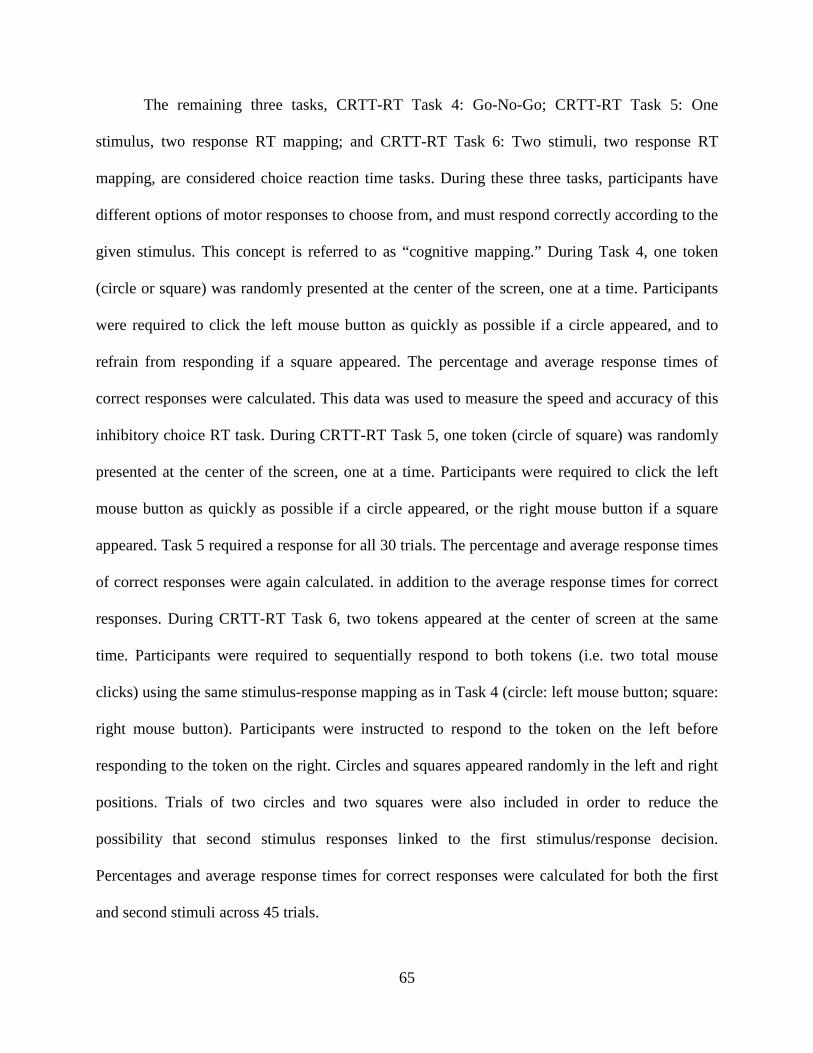
65
The remaining three tasks, CRTT-RT Task 4: Go-No-Go; CRTT-RT Task 5: One
stimulus, two response RT mapping; and CRTT-RT Task 6: Two stimuli, two response RT
mapping, are considered choice reaction time tasks. During these three tasks, participants have
different options of motor responses to choose from, and must respond correctly according to the
given stimulus. This concept is referred to as “cognitive mapping.” During Task 4, one token
(circle or square) was randomly presented at the center of the screen, one at a time. Participants
were required to click the left mouse button as quickly as possible if a circle appeared, and to
refrain from responding if a square appeared. The percentage and average response times of
correct responses were calculated. This data was used to measure the speed and accuracy of this
inhibitory choice RT task. During CRTT-RT Task 5, one token (circle of square) was randomly
presented at the center of the screen, one at a time. Participants were required to click the left
mouse button as quickly as possible if a circle appeared, or the right mouse button if a square
appeared. Task 5 required a response for all 30 trials. The percentage and average response times
of correct responses were again calculated. in addition to the average response times for correct
responses. During CRTT-RT Task 6, two tokens appeared at the center of screen at the same
time. Participants were required to sequentially respond to both tokens (i.e. two total mouse
clicks) using the same stimulus-response mapping as in Task 4 (circle: left mouse button; square:
right mouse button). Participants were instructed to respond to the token on the left before
responding to the token on the right. Circles and squares appeared randomly in the left and right
positions. Trials of two circles and two squares were also included in order to reduce the
possibility that second stimulus responses linked to the first stimulus/response decision.
Percentages and average response times for correct responses were calculated for both the first
and second stimuli across 45 trials.
66
Table 25: Reaction Time Combined Data
Combined RT R-Hand
Tap Simple Movement Go-No-Go Decision Map 1 Decision Map 2
Avg Interval Avg RT Avg RT
Avg RT (Correct)
% Correct
Avg RT (Correct)
% Correct
Avg RT (Correct)
1
% Correct
1
Avg RT (Correct)
2 %
Correct 2 Older Average 233.19 367.47 1355.38 509.33 96.42 698.86 98.44 845.34 98.05 1150.71 98.24 Younger Average 176.72 322.32 936.34 443.39 96.33 525.32 97.07 649.57 96.55 826.7 97.1
Difference 56.47 45.15 419.04 65.94 0.09 173.54 1.37 195.77 1.5 324.01 1.14
Combined RT L-Hand
Tap Simple Movement Go-No-Go Decision Map 1 Decision Map 2
Avg Interval Avg RT Avg RT
Avg RT (Correct)
% Correct
Avg RT (Correct)
% Correct
Avg RT (Correct)
1
% Correct
1
Avg RT (Correct)
2 %
Correct 2 Older Average 282.59 411.49 2075.64 521.14 97.06 756.96 97.71 897.51 97.26 1225.07 97.79 Younger Average 205.8 325.21 1320.16 473.17 95.8 581.89 97.07 708.09 96.29 906.24 96.62
Difference 76.79 86.28 755.48 47.97 1.26 175.07 0.64 189.42 0.97 318.83 1.17
Older RT R-Hand v L-Hand
Tap Simple Movement Go-No-Go Decision Map 1 Decision Map 2
Avg Interval Avg RT Avg RT
Avg RT (Correct)
% Correct
Avg RT (Correct)
% Correct
Avg RT (Correct)
1
% Correct
1
Avg RT (Correct)
2 %
Correct 2 R-Hand Average 233.19 367.47 1355.38 509.33 96.42 698.86 98.44 845.34 98.05 1150.71 98.24 L-Hand Average 282.59 411.49 2075.64 521.14 97.06 756.96 97.71 897.51 97.26 1225.07 97.79
Difference -49.4 -44.02 -720.26 -11.81 -0.64 -58.1 -0.73 -52.17 0.79 -74.36 0.45
Younger RT R-Hand v L-Hand
Tap Simple Movement Go-No-Go Decision Map 1 Decision Map 2
Avg Interval Avg RT Avg RT
Avg RT (Correct)
% Correct
Avg RT (Correct)
% Correct
Avg RT (Correct)
1
% Correct
1
Avg RT (Correct)
2 %
Correct 2 R-Hand Average 176.72 322.32 963.34 443.39 96.33 525.32 97.07 649.57 96.55 826.70 97.10 L-Hand Average 205.8 325.21 1320.16 473.17 95.8 581.89 97.07 708.09 96.29 906.24 96.62
Difference -29.08 -2.89 -356.82 -29.78 0.53 -56.57 0 -58.52 0.26 -79.54 0.48
67
APPENDIX C: Subject History Form
Subject #______________
Birth date: ______________ Age: _______________
Is English your native language? Yes No
Sex: M F
If no, what is the primary language spoken in your home? _________________
Do you wear glasses? Yes No
Do you have difficulty hearing? Yes No
If yes, do you wear a hearing aid? Bilateral/ Right / Left / NA
Have you ever had any kind of speech, language or learning problem? Yes No
If yes, explain:
Did you ever have speech or language treatment? Yes No
If yes, explain:
68
Have you had any medical, psychological, or other conditions that might affect your
ability to communicate or participate in the study (e.g., Stroke, Parkinson’s disease, Alzheimer’s
disease, alcoholism, depression, etc.)? Yes No
If yes, explain:
Race: Caucasian African-American Asian Native-American Other
What is the highest level of education you completed? ____________________________
What is your occupation? (If retired, etc., indicate last occupation): _________________
Which is your dominant hand? Left Right
Which hand do you use a mouse with? Left Right
Which hand do you use a touchscreen with? Left Right
How many hours a day do you use a computer mouse? _____________________
How many hours a day do you use a touch screen? ________________________
Do you have any problems with your hand or wrist (e.g., carpal tunnel syndrome, arthritis)?
Yes No
If yes, what is the problem? __________________________________________
(Adapted from Heilman, 2008)
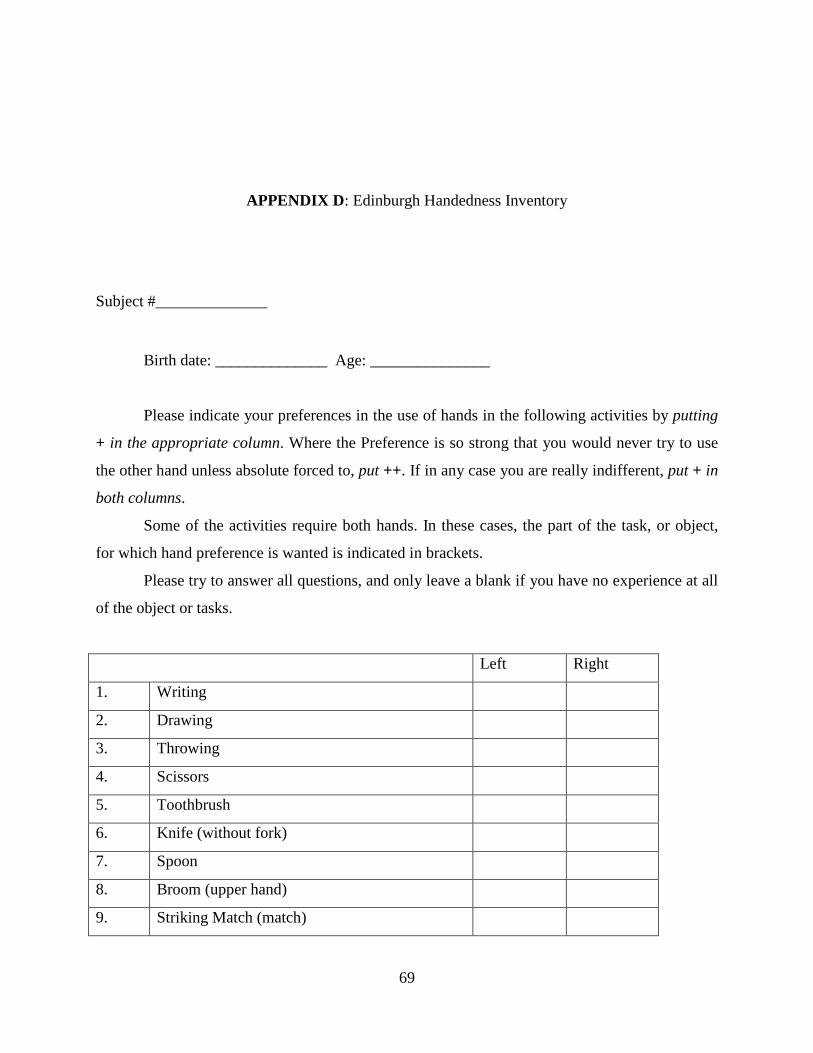
69
APPENDIX D: Edinburgh Handedness Inventory
Subject #______________
Birth date: ______________ Age: _______________
Please indicate your preferences in the use of hands in the following activities by putting
+ in the appropriate column. Where the Preference is so strong that you would never try to use
the other hand unless absolute forced to, put ++. If in any case you are really indifferent, put + in
both columns.
Some of the activities require both hands. In these cases, the part of the task, or object,
for which hand preference is wanted is indicated in brackets.
Please try to answer all questions, and only leave a blank if you have no experience at all
of the object or tasks.
Left Right
1. Writing
2. Drawing
3. Throwing
4. Scissors
5. Toothbrush
6. Knife (without fork)
7. Spoon
8. Broom (upper hand)
9. Striking Match (match)
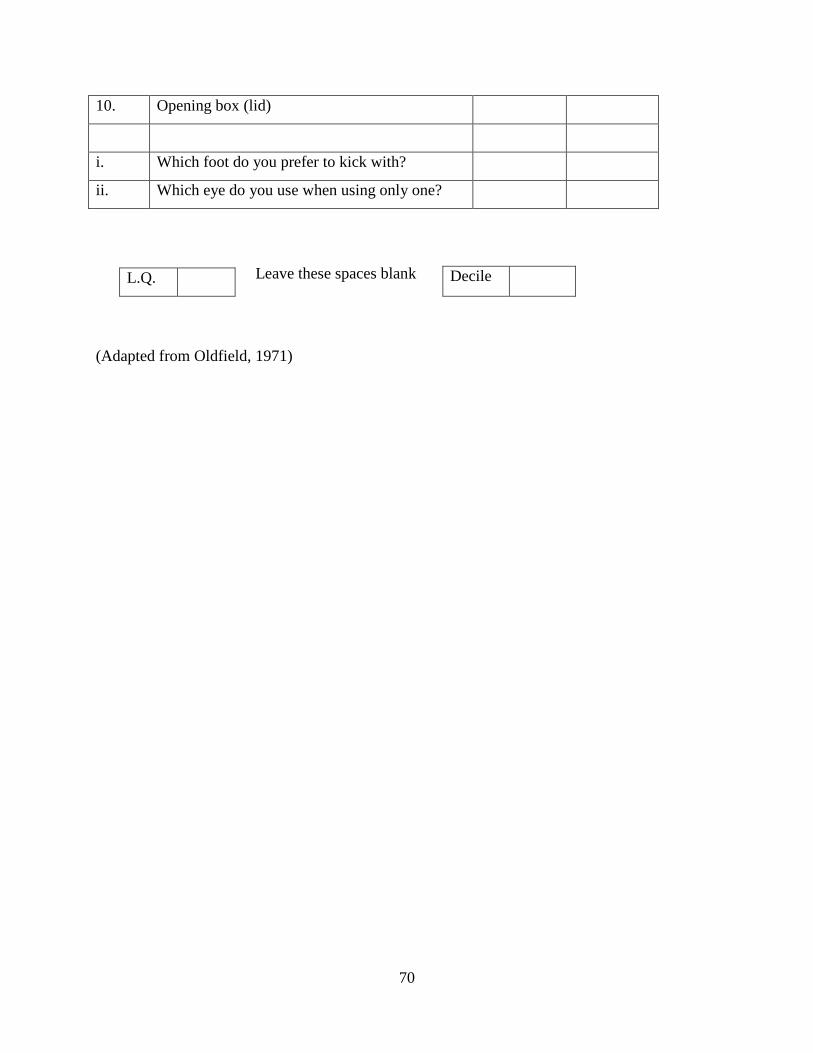
70
10. Opening box (lid)
i. Which foot do you prefer to kick with?
ii. Which eye do you use when using only one?
Leave these spaces blank
(Adapted from Oldfield, 1971)
L.Q. Decile
71
BIBLIOGRAPHY
American Speech-Language-Hearing Assocication. (2005). Roles of speech-language pathologists in the identification, diagnosis, and treatment of individuals with cognitive-communication disorders: position statement. Retrieved from http://www.asha.org/policy/PS2005-00110/
Asphia [Def. 2]. ((n.d.)). Merriam-Webster Online. Retrieved from https://www.merriam-
webster.com/dictionary/aphasia Bayles, K. A., & Tomoeda, C. K. (1993). Arizona Battery for Communication Disorders of
Dementia. Tuscon, Arizona: Canyonlands Publishing, Inc. Birren, J. E., & Woodruff, D. S. (1983). Aging: Past and Future. In J. E. Birren & D. S.
Woodruff (Eds.), Aging: Scientific Perspectives and Social Issues (2nd ed., pp. 1-15). Monterey, California: Brooks/Cole Publishing Company.
Burke, D. M., & Shafto, M. A. (2008). Language and Aging. In F. I. M. Craik & T. A. Salthouse
(Eds.), Handbook of aging and cognition (3rd ed., pp. 373-443). New York: Psychology Press.
Carpenter, P. A., Miyake, A., & Just, M. A. (1994). Working memory constraints in
comprehension: Evidence from individual differences, aphasia, and aging. In M. A. Gernsbacher (Ed.), Handbook of Psycholinguistics (pp. 1075-1122). Sand Diego, CA: Academic Press.
Clark-Cotton, M. R., Williams, R. K., Goral, M., & Obler, L. K. (2007). Language and
communication in aging. In J. E. Birren (Ed.), Encyclopedia of gerontology: Age, aging, and the aged (2nd ed., pp. 1-8). London: Elsevier.
DeDe, G., & Flax, J. K. (2016). Language comprehension in aging. In H. H. Wright (Ed.),
Language, Cognition and Aging (pp. 107-133). Philadelphia, PA: John Bengamins Publishing Company.
Dennis, N. A., & Cabeza, R. (2008). Neruoimaging of Healthy Cognitive Aging. In F. I. M.
Craik & T. A. Salthouse (Eds.), The handbook of aging and cognition (3rd ed., pp. 1-54). New York: Psychology Press.
72
Dykiert, D., Der, G., Starr, J. M., & Deary, I. J. (2012). Sex differences in reaction time mean and intraindividual variability across the life span. Developmental Psychology, 48(5), 1262-1276.
Eberwein, C. A., Pratt, S. R., McNeil, M. R., Szuminsky, N. J., & Doyle, P. J. (2008). Auditory
Performance Characteristics of the Computerized Revised Token Test (CRTT). Journal of Speech, Language, and Hearing Research, 50, 865-877.
Fassbinder, W., Pratt, S. R., Aldhoayan, M., Pompon, R., Patterson, J., Dalziel, K., . . . McNeil,
M. (2017). Validity and Reliability of Shortening the Computerized Revised Token Test: Subtest Item Reduction. Paper presented at the Clinical Aphasiology Conference, Utah, USA. Poster retrieved from
Hannon, B., & Daneman, M. (2009). Age Related Changes in Reading Comprehension: An
individual-Differences Perspective. Experimental Aging Research, 25, 432-456. Hasher, L., & Zacks, R. T. (1988). Working Memory, comprehension and aging: A review and a
new view. Psychology of Learning and Motivation, 22, 193-225. Heilman, L. E. (2008). An Examination of the Effects of Mode of Access on the Computerized
Revised Token Test. ( Master’s of Science), University of Pittsburgh. Hendricks, E. N. (n.d.). Reaction Time Performance in Healthy Adults as an Effect of Age and
Hand Preference. (Manuscript in preparation). Hommel, B., Li, K. Z. H., & Li, S. C. (2004). Visual search across the life span. Developmental
Psychology, 40(545-558). Jorgensen, L. E., Pratt, S. R., McNeil, M. R., Durrant, J. D., Doyle, P. J., Zhang, M., . . .
Szuminsky, N. J. (n.d.). The computerized revised token test (CRTT): Effects of age, hearing, status and signal intensity on auditory sentence-level processing. (Manuscript in preparation).
Just, M. A., & Carpenter, P. A. (1980). A theory of reading: From eye fixations to
comprehension. Psychological Review, 87(4), 329-354. Kemper, S., & Herman, R. E. (2006). Age differences in memory-load intereference effects in
syntactic processing. Journal of Gerontology: Psychological Sciences, 61B(6), P327-P332.
Kourtis, D., & Vingerhoets, G. (2016). Evidence for dissociable effects of handedness and
consistency of hand preference in allocation of attention and movement planning: An EEG investigation. Neuropsychologia, 93, Part B.
Marian, V., Blumenfeld, H. K., & Kaushanskaya, M. (2007). The language experience and
proficiency questionnaire (LEAP-Q): Assessing language profiles in bilinguals and multilinguals. Journal of Speech, Language and Hearing Research, 50, 940-967.
73
McNeil, M. R. (1988). Aphasia in the adults. In N. J. Lass, L. V. McReynolds, J. L. Northern, &
D. E. Yoder (Eds.), Handbook of speech-language pathology and audiology (pp. 738-786). Philadelphia, PA: W.B. Saunders Company.
McNeil, M. R., Kim, A., Sung, J. E., Pratt, S. R., Szuminsky, N., & Doyle, P. J. (2009). A
comparison of left versus right hand, and mouse versus touchscreen access methods on the Computerized Revised Token Test in normal adults and persons with aphasia. Paper presented at the Clinical Aphasiology Conference, Keystone, CO.
McNeil, M. R., Pratt, S. R., Szuminsky, N., Sung, J. E., Fossett, T. R. D., Fassbinder, W., &
Lim, K. Y. (2015a). Online Supplemental Materials to the Reliability and Validity of the Computerized Revised Token Test: Comparison of Reading and Listening Versions in Persons With and Without Aphasia. Journal of Speech, Language, and Hearing Research, 1-14.
McNeil, M. R., Pratt, S. R., Szuminsky, N., Sung, J. E., Fossett, T. R. D., Fassbinder, W., &
Lim, K. Y. (2015b). Reliability and Validity of the Computerized Revised Token Test: Comparison of Reading and Listening Version in Persons With and Without Aphasia. Journal of Speech, Language and Hearing Research, 1-14.
McNeil, M. R., & Prescott, T. (1978). Revised Token Test. Austin, TX: ProEd. Oldfield, R. C. (1971). The assessment and analysis of handedness: The Edinburgh Inventory.
Neuropsychologia, 9, 97-113. Ortman, J. M., Velkoff, V. A., & Hogan, H. (2014). An Aging Nation: The Older Population in
the United States, Current Population Reports. Washington, DC.: U.S. Census Bureau. Peters, M. (1981). Attentional asymmetries during concurrent bimanual performance. Quarterly
Journal of Experimental Psychology, 33, 95-103. Ren, J., Wu, Y. D., Chan, J. S., & Yan, J. H. (2013). Cognitive aging affects motor performance
and learning. Geriatrics & Gerontology International, 13, 19-27. Salthouse, T. A. (1985). A theory of cognitive aging. Amsterdam: North-Holland. Salthouse, T. A. (1996). The Processing-Speech Theory of Adult Age Differences in Cognitition.
Psychological Review, 103(3), 403-428. Salthouse, T. A. (2004). Localizing age-related individual differences in a hierarchical structure.
Intelligence, 32, 541-561. Salthouse, T. A. (2009). When does age-related cognitive decline begin? Neurobiology of Aging,
30(4), 507-514. Siegel, L. S. (1994). Working memory and reading: A life-span perspective. Internation Journal
of Behavioral Developmnt, 17(1), 109-124.
74
Silagi, M. L., Rabelo, C. M., Schochat, E., & Mansur, L. L. (2015). Healthy Aging and Compensation of Sentence Comprehension Auditory Deficits. BioMed Research International, 2015, 8. doi:10.1155/2015/640657
Snellen, H. (1862). Optotypi ad visum determinandum. Utrecht, Netherlands: P.W. van de
Weijer. Snitz, B. E., Unverzagt, F. W., Chang, C. H., Bilt, J. V., Gao, S., Saxton, J., . . . Ganguli, M.
(2009). Effects of age, gender, education and race on two tests of language ability in community-based older adults. International Psychogeriatrics, 21(6), 1051-1062.
Song, J., & Bédard, P. (2013). Allocation of attention for dissociated visual and motor goals.
Experimental Brain Research, 226, 206-219 Stine, E. L. (1990). On-line processing of written text by younger and older adults. Psychology
and Aging, 5(1), 68-78. Thomas, A. K., Dave, J. B., & Bonura, B. M. (2010). Theoretical Perspectives on Cognitive
Aging. In C. L. Armstrong & L. Morrow (Eds.), Handbook of Medical Neuropsychology (pp. 297-313). NY, USA: Springer.
Triggs, W. J., Calvanio, R., Levine, M., Heaton, R. K., & Heilman, K. M. (2000). Predicting
hand preference with performance on motor tasks. Cortex, 36, 679–689. Unverzagt, F. W. (1999). Clinical Utility of CERAD neuropsychological battery in eldery
Jamaicans. Journal of the International Neuropsychological Society, 5, 255-259. Wechsler, D. (2008). Manual for the Wechsler Adult Intelligence Scale-Fourth Edition (WAIS-
IV). San Antonio, TX: The Psychological Corporation. Wiig, E. H., Semel, E., & Secord, W. A. (2013). Clinical Evaluation of Language
Fundamentals-Fifth Edition (CELF-5) Bloomington, MN.: NCS Pearson. Wingfield, A. (1996). Cognitive factors in auditory performance: context, speed of processing,
and constraints of memory. Journal of the American Academy of Audiology, 7, 175-182. Yan, J. H., Aberneth, B., & Li, X. (2009). The effects of ageing and cognitive impairment on on-
line and off-line motor learning. Applied Cognitive Psychology, 24, 200-212.


![Welcome [chongfu.moe.edu.sg] · 2019-03-01 · Listening Comprehension (Abt 35 min) Listening Comprehension MCQ 20 10% 3 Listening Comprehension (Abt 35 min) Listening Comprehension](https://img.pdfslide.us/doc/110x75/5f540e2f88cbf0034723ba34/welcome-2019-03-01-listening-comprehension-abt-35-min-listening-comprehension.jpg)