Embed Size (px)
Citation preview
1
Language and Social Class: Linguistic Capital in Singapore
By
Viniti Vaish and Teck Kiang Tan
ABSTRACT
This paper analyzes the relationship between ethnic group, language use and social class
in Singapore in light of implications for performance in the national school system. Using
a Bourdieusian theoretical framework we argue that though Singapore equitably
distributes the linguistic capital of English through its bilingual language in education
policy, children from low income homes are disadvantaged. For the Chinese and Malay
ethnic groups there is a correlation between dominant home language and social class
though this is not the case for the Indians. Correspondence analysis shows that SES is
correlated to English test scores. Multilevel analysis shows that SES is related to aspects
of linguistic capital like language choice in reading, watching TV, choosing types of
friends and learning about religion. Data for these claims come from The Sociolinguistic
Survey of Singapore 2006 (SSS 2006).
Total no. of words: 6819
Keywords: Singapore, Socioeconomic Status (SES), linguistic capital, ethnic groups,
Achievement in English tests
2
Introduction
Medium of instruction is an aspect of schooling which is inextricably linked with social
class. Schools which offer majority languages with global and instrumental power, like
standard English, tend to service children from advantaged homes. Thus disadvantaged
communities value a national school system that provides the linguistic capital of a
powerful language at subsidized rates. However such schooling remains a challenge for
children who come from disadvantaged homes where the dominant home language is not
the medium of instruction. In fact Fishman has commented that what is important to
notice within the process of the spread of global English is that “…regardless of location,
the spread of English is closely linked to social class, age, gender, and profession”
(Fishman, p. 28). Thus in those societies where the spread of English is palpable, this is
likely to happen within the elite classes.
In Singapore English has been the medium of instruction in the national school system
since 1987. Prior to this schools chose various mother tongues as media of instruction.
These mother tongue medium schools, however, closed down due to low enrollment and
stiff competition from English medium schools (Gopinathan, 2003). Singapore has four
official languages: Mandarin, English, Malay and Tamil, all of which are taught in the
national schools. Singaporean children undergo English medium education and learn one
other language, which is their mother tongue, from a choice of Mandarin, Malay or
Tamil. The national school system is highly subsidized. As such Singapore‟s bilingual
language in education policy attempts to equitably distribute the linguistic capital of
English to students of all races and income groups.
3
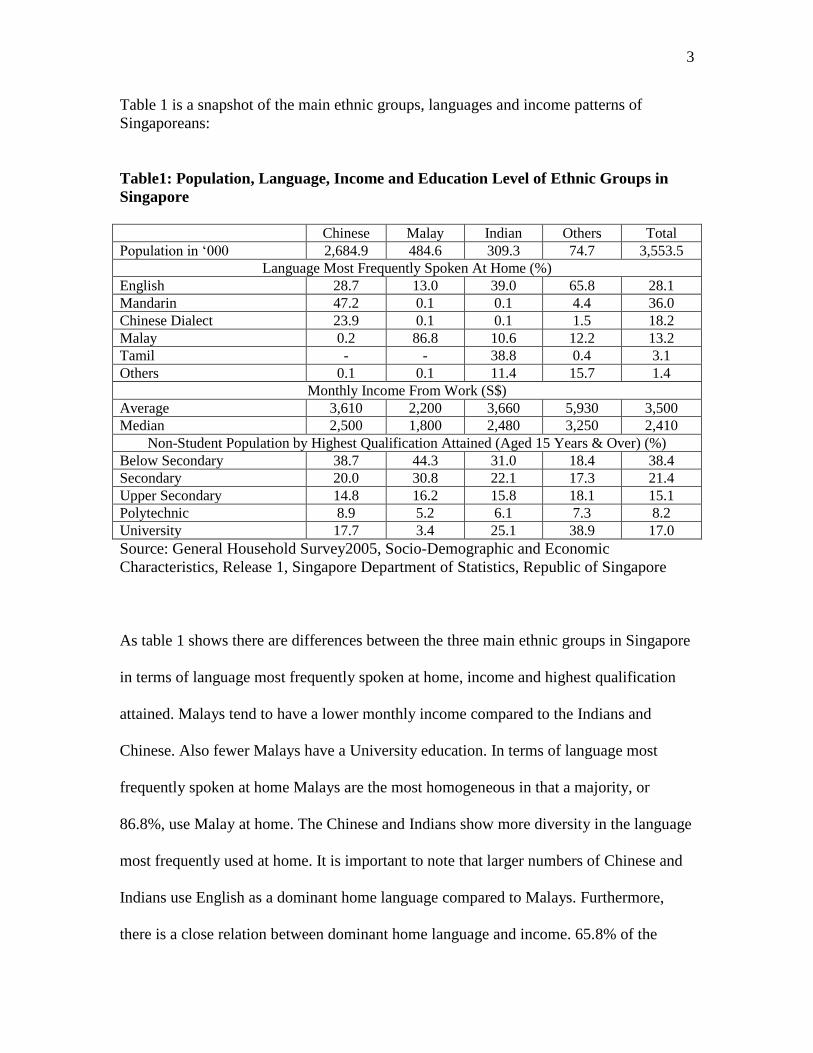
Table 1 is a snapshot of the main ethnic groups, languages and income patterns of
Singaporeans:
Table1: Population, Language, Income and Education Level of Ethnic Groups in
Singapore
Chinese Malay Indian Others Total
Population in „000 2,684.9 484.6 309.3 74.7 3,553.5
Language Most Frequently Spoken At Home (%)
English 28.7 13.0 39.0 65.8 28.1
Mandarin 47.2 0.1 0.1 4.4 36.0
Chinese Dialect 23.9 0.1 0.1 1.5 18.2
Malay 0.2 86.8 10.6 12.2 13.2
Tamil - - 38.8 0.4 3.1
Others 0.1 0.1 11.4 15.7 1.4
Monthly Income From Work (S$)
Average 3,610 2,200 3,660 5,930 3,500
Median 2,500 1,800 2,480 3,250 2,410
Non-Student Population by Highest Qualification Attained (Aged 15 Years & Over) (%)
Below Secondary 38.7 44.3 31.0 18.4 38.4
Secondary 20.0 30.8 22.1 17.3 21.4
Upper Secondary 14.8 16.2 15.8 18.1 15.1
Polytechnic 8.9 5.2 6.1 7.3 8.2
University 17.7 3.4 25.1 38.9 17.0
Source: General Household Survey2005, Socio-Demographic and Economic
Characteristics, Release 1, Singapore Department of Statistics, Republic of Singapore
As table 1 shows there are differences between the three main ethnic groups in Singapore
in terms of language most frequently spoken at home, income and highest qualification
attained. Malays tend to have a lower monthly income compared to the Indians and
Chinese. Also fewer Malays have a University education. In terms of language most
frequently spoken at home Malays are the most homogeneous in that a majority, or
86.8%, use Malay at home. The Chinese and Indians show more diversity in the language
most frequently used at home. It is important to note that larger numbers of Chinese and
Indians use English as a dominant home language compared to Malays. Furthermore,
there is a close relation between dominant home language and income. 65.8% of the
4
„Other‟ ethnic group speaks English at home and has the highest average monthly income
of SD 5930.0 along with the highest percentage of people with University degrees
(38.9%). The same pattern is discernable in the other races. The Malays have the lowest
percentage of people who speak English as a dominant home language (13%), along with
the lowest monthly income (SD 2,200.00) and the lowest percentage of people with
University degrees (3.4%).
Theoretical Framework
The use of Bourdieu‟s theories in educational research tends to revolve around specific
terminologies some of which are more extensively used as theoretical foci than others.
Dika, Sandra L., & Singh, K., (2002) and Stanton-Salazar, R.D. (1997) show through
comprehensive reviews that Bourdieu‟s most used concept is „social capital‟, a concept
that we have explored in Vaish, et. al.(forthcoming). In Vaish et. al (forthcoming) we
show that except in the domain of religion there is no significant difference in the social
capital of Malays, Indians and Chinese. However the dense and multiplex ties of the
Malays in a homogeneous religion contribute to language maintenance in this ethnic
group.
Another of Bourdieu‟s concepts, habitus, has been used extensively by Reay, D. (2004)
and Pahl, K. (2005). Lareau and Horvat (1999) use Bourdieu‟s „cultural capital‟ to show
how some black parents, especially those from the working class, feel excluded from the
national school system. Cultural capital is a concept that can include the linguistic
resources of a family. For instance Driessen (2001) reports on the English and Math test
5
scores of Dutch, Surinamese, Turkish and Moroccan children in the Netherlands on the
basis of what he calls „social milieu‟ or cultural capital, which includes linguistic
resources. Driessen‟s key finding as it impacts our paper is that “Across groups, one can
speak of a mediating effect of resources with respect to the prediction of language score
as a result of the higher correlations between social milieu and resources” (p. 534).
In this paper our interest is in Bordieu‟s „linguistic capital‟ which is not as widely used in
the literature as social and cultural capital. Silver (2004) has started a conversation about
linguistic capital in the context of Singapore. Others like Wee (2003) and Gupta (1997)
have discussed Singapore‟s instrumental attitude towards language but without the
theoretical framework of Bourdieu. The central problem regarding linguistic capital has
been stated well by Hampshire (1986): “…No matter what evidence is adduced to claim
that the children of working-class homes are exposed to just as rich a linguistic
background before school as their middle-class contemporaries they are seriously
disadvantaged in fact” (p. 52). Hampshire situates this comment within the debate
between Bernstein and Labov regarding whether or not working class children live in a
language deficit environment, which is not the focus of our paper. In similar research
Nafstad (1982) reviews the efficacy of pre-school programs like Project Headstart, to
comment on how children from low income homes can be made ready for school.
In more recent research Li (2007) analyzes how physical, human and social capital
impact the English language acquisition and concomitant school performance of Chinese
immigrant children in Canada. He finds that physical capital, or what we in our paper call
SES, does not determine language acquisition but the way physical capital is used does.
6
Regarding human capital, which refers to educational level of parents, Li writes:
“Although the parents were supportive of their children‟s education, they were unable to
initiate reading and writing in English at home. Because they could not read English
letters from their children‟s school, they did not understand their children‟s school
performance or school activities or attend parent-teacher conferences” (p. 292). Li‟s point
is also important for the Singapore context as parents who do not speak English at home
can feel alienated from the national school system.
Bourdieu’ s ‘linguistic capital’
Bourdieu writes that “It is in the process of state formation that the conditions are created
for the constitution of a unified linguistic market, dominated by the official language”
(1991, p. 45). In the case of Singapore, though there are four official languages, power is
not equitably distributed between them. English is first among equals in the line up of
official languages because the unified linguistic market in Singapore demands mainly
English for employment in a highly globalized economy. The goal of the subsidized
national school system is to provide a level playing field through English medium
education for all ethnic groups and social classes. As such the school system “creates the
conditions for an objective competition in and though which the legitimate competence
can function as linguistic capital” (Bourdieu, 1991, p. 55).
At the same time the school is also an agent of cultural reproduction in that it privileges
students who come from English dominant homes and perpetuates their success while
disenfrachizing those who come from mother tongue dominant homes. “The problems
posed by situations of early bilingualism or biculturalism give only a faint idea of the
7
insurmountable contradictions faced by a PA [pedagogic action] claiming to take as its
practical didactic principle the theoretical affirmation of the arbitrariness of linguistic or
cultural codes” (Bourdieu & Passeron, 1977, p 12). We take this to mean that the
practical or instrumental nature of choosing English as medium of instruction affirms that
this choice of language is objective. Singaporeans firmly believe in the objective nature
of this language in education policy and are convinced that mother tongue is not an
appropriate medium of instruction (Gupta, 1997).
Research Questions
In keeping with this theoretical framework we explore answers to the following
questions:
What is the relationship between ethnic group, dominant home language and
social class in Singapore?
Do the three main ethnic groups in Singapore: Chinese, Malay and Indian, show
the same relationship between social class and dominant home language?
What is the relationship between SES and achievement in English and Mother
Tongue tests?
How are aspects of linguistic capital, like reading in English, watching TV in
English and learning about religion in English, related to SES?
What are the implications of these relationships for the English medium national
school system?
Methodology
This paper is based on a project called The Sociolinguistic Survey of Singapore, 2006
(henceforth SSS 2006), undertaken by The Centre for Research in Pedagogy and Practice in
Singapore. The research question for SSS 2006 is: “Who speaks what language to whom in
what context with what attitude with what level of fluency and to what end?” The survey,
8
which has a sample size of 716 students from the Grade 5 cohort of Singaporean schools, is
stratified by race (Chinese, Malay and Indian) and socioeconomic status (SES).
This survey, which takes about an hour to administer, is divided into five domains:
school, family and friends, religion, public space and media. It also has sections on
language attitudes/ ideology and finally proficiency. There are 40 items in the entire
questionnaire with sub parts for each item. A bilingual research assistant administers
most of the survey on the computer in a face to face session in the languages of comfort
of the child and in the home of the child. This part of the questionnaire is in soft copy on
an excel file with a pull down menu for options. For some items there are up to 50
options of language combinations. The demographic questions, which include all the
items on the basis of which we have calculated SES, are given in paper form, to the
parent to fill out. These demographic questions are written in both English and mother
tongue.
SSS 2006 has a funnel shaped design with the large scale quantitative survey described
above leading to follow up studies that have been described and analyzed in Vaish
(2007a. and b.). This paper only uses the quantitative data from SSS 2006.
Figure 1: Quantitative Framework
9
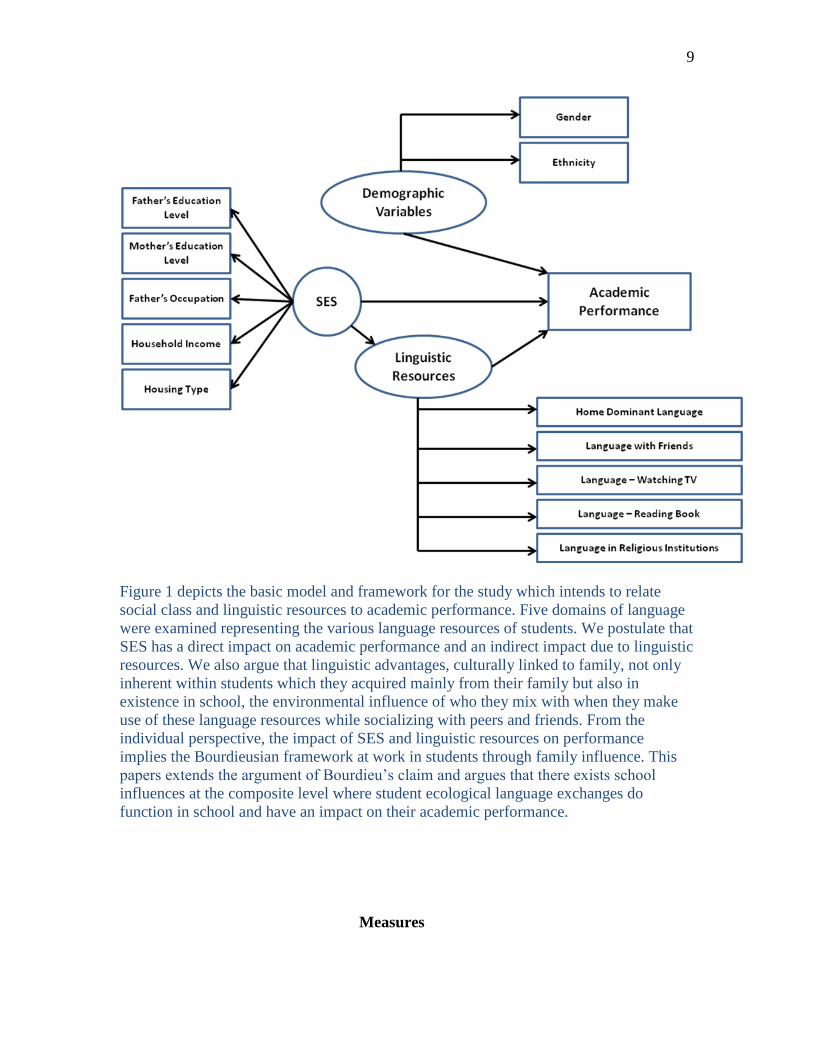
Figure 1 depicts the basic model and framework for the study which intends to relate
social class and linguistic resources to academic performance. Five domains of language
were examined representing the various language resources of students. We postulate that
SES has a direct impact on academic performance and an indirect impact due to linguistic
resources. We also argue that linguistic advantages, culturally linked to family, not only
inherent within students which they acquired mainly from their family but also in
existence in school, the environmental influence of who they mix with when they make
use of these language resources while socializing with peers and friends. From the
individual perspective, the impact of SES and linguistic resources on performance
implies the Bourdieusian framework at work in students through family influence. This
papers extends the argument of Bourdieu‟s claim and argues that there exists school
influences at the composite level where student ecological language exchanges do
function in school and have an impact on their academic performance.
Measures
10
Measures of Socio-economic Status
As shown in Figure 1 SES was measured as a principal component score derived from
five indicators: father‟s educational level, mother‟s educational level, household income,
father‟s occupation, and housing type. Father‟s and mother‟s education level were coded
as a six point scale with the lowest score for „no formal education‟ and highest score for
„post graduate degree‟. The scale to measure housing type, taken from a scale used by the
Housing Development Board of Singapore, ranged from a 1or 2 bedroom flat to a
bungalow. Father‟s occupation was classified according to Singapore Standard
Occupational Classification, Department of Statistics. Household income was coded a six
point scale. SES composite factor score was derived using principal component analysis.
The total variance accounted for by the 5 variables was 58.3%. The communalities of
household income, residence type, father‟s education level, mother‟s education level, and
father occupation were .72, .54, .64, .53 and .47 respectively. Multilevel exploratory
factor analysis gave an eigenvalue of 2.58 and 4.84 at the student and school level,
indicating a strong factor solution at the school level.
Measures of Language Use
During fieldwork, dominant home language was recorded from 40 options which
represent the variety and complexity of language usage in family. This was summarized
into five main groups during data analyses, namely, English, Mother Tongue, English-
Mother Tongue, English-Mother Tongue-Dialect and others. The first two groups
represent the single dominant language used at home whereas the next two groups
represent multilingualism at home with English as the main language of communication.
11
Similarly, language learning in religious institutions has the same coding scheme. Most
comfortable language with friends was coded into 3 groups: English, Mother Tongue and
the mixed group. A Likert scale was used to assess the frequency of reading books and
watching TV in English and Mother Tongue. This Likert ranges from 1 (never) to 4 (very
often).
Compositional variables at school level include percentage of English as dominant home
language, percentage of English as the language most comfortable with friends, mean
score of watching English TV programs, mean score of reading books in Mother Tongue,
and percentage of Mother Tongue as the main language in learning about religion.
Although there were other language combinations at the student level, only selective
languages at the school level was used, mainly English and Mother Tongue. The main
reason is that the share variances among the composite language variables at the school
level was high, thus including various language indicators would cause difficulty in
interpretation. As such, only one of the composite variables from each language domain
which had the highest correlation with the dependent variables was used for multilevel
analyses purposes. School level variables were standardized to mean zero and SD 1.
Analytic Approach
We start with a table of the descriptive statistics in our dataset. Thereafter is a pictorial
presentation, laying out SES, ethnicity and home language usage and academic
performance in a two dimensional space by means of a correspondence analysis. We then
proceed to carry out multilevel analysis on SES by partitioning SES into within and
between schools and relating them to language use at these two levels. Two multilevel
12
structural equation models were built to further examine the relationship of SES,
language use and academic performance. The major contribution of this paper is that it
uses a multilevel analysis that allows researchers to locate sources of variability in SES at
student, and school levels and links them to language use. It recognizes that individuals
inhabit multiple institutional and organizational sets and belong to numerous social
groups based on gender, race, type of friends, neighborhoods, and communities.
Early studies using traditional regression techniques have been criticized on the grounds
that student membership of the school operates at different levels and that observations at
different levels are not independent of each other. This violates one of the assumptions of
traditional multiple regression. (Maas & Hox, 2004). Consequently, educational research
on academic performance is now generally modeled as a function of combination of
individual student, class, and school characteristics.
This paper however, stresses that SES distribution at student and school level is a
function of student demographic and language background. The standard assumption of
independent and identically distributed observations is generally not valid even if
analyses are carried out at the lowest level. Multilevel regression analysis, on the other
hand, has the advantage of incorporating heteroscedasticity directly into the model
(Goldstein, 1995). In effect, multi-level analysis helps protect researchers from
committing the ecological fallacy-- the phenomenon of drawing inferences at the
individual level based on group level data. The consequences of not using multilevel
modeling are well documented: the parameter estimates are unbiased but inefficient, and
the standard errors are biased which results in spuriously significant result when in fact
13
they do not, hence, inflated Type 1 error rates (Raudenbush & Bryk, 2002; Goldstein,
1995).
Results
Descriptive Statistics
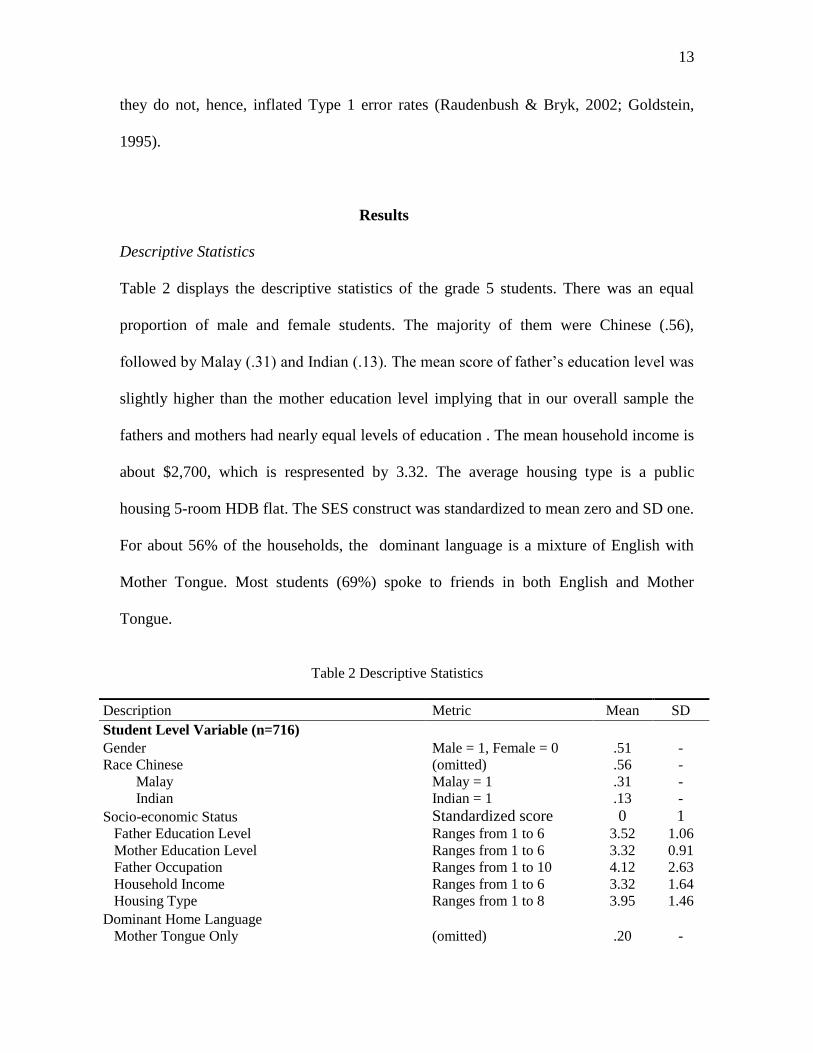
Table 2 displays the descriptive statistics of the grade 5 students. There was an equal
proportion of male and female students. The majority of them were Chinese (.56),
followed by Malay (.31) and Indian (.13). The mean score of father‟s education level was
slightly higher than the mother education level implying that in our overall sample the
fathers and mothers had nearly equal levels of education . The mean household income is
about $2,700, which is respresented by 3.32. The average housing type is a public
housing 5-room HDB flat. The SES construct was standardized to mean zero and SD one.
For about 56% of the households, the dominant language is a mixture of English with
Mother Tongue. Most students (69%) spoke to friends in both English and Mother
Tongue.
Table 2 Descriptive Statistics
Description Metric Mean SD
Student Level Variable (n=716) Gender Male = 1, Female = 0 .51 - Race Chinese (omitted) .56 - Malay Malay = 1 .31 - Indian Indian = 1 .13 -
Socio-economic Status Standardized score 0 1 Father Education Level Ranges from 1 to 6 3.52 1.06 Mother Education Level Ranges from 1 to 6 3.32 0.91 Father Occupation Ranges from 1 to 10 4.12 2.63 Household Income Ranges from 1 to 6 3.32 1.64 Housing Type Ranges from 1 to 8 3.95 1.46
Dominant Home Language Mother Tongue Only (omitted) .20 -
14
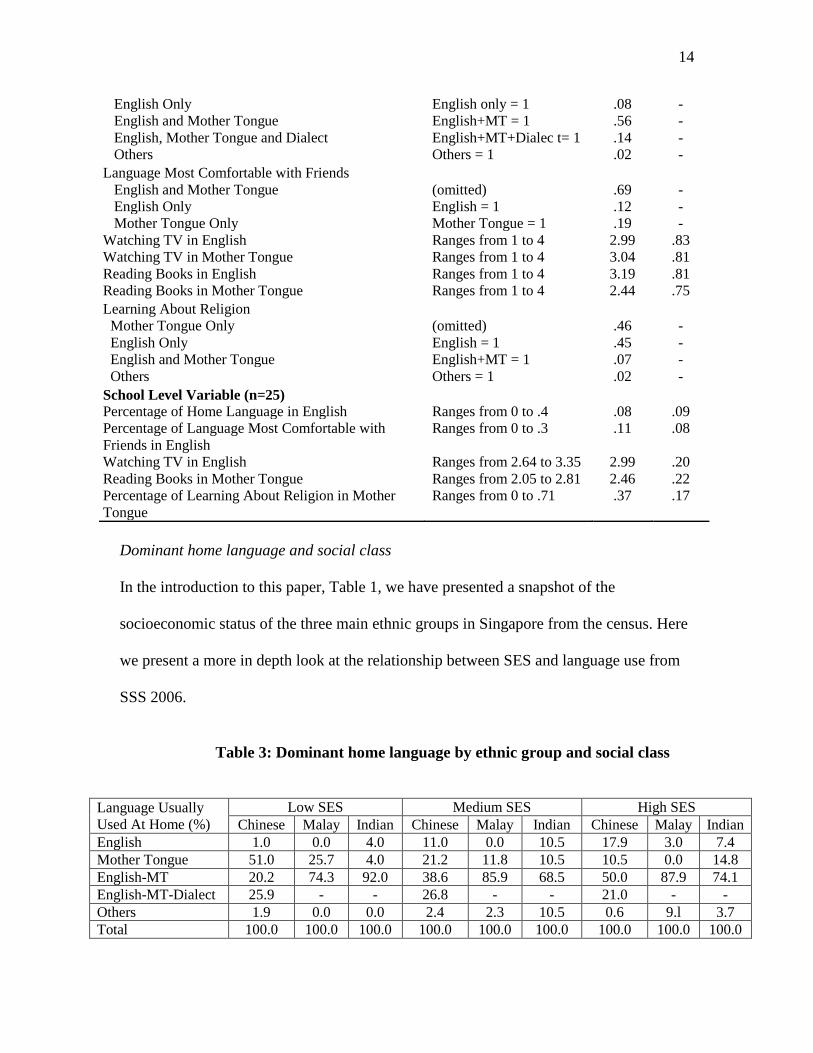
Dominant home language and social class
In the introduction to this paper, Table 1, we have presented a snapshot of the
socioeconomic status of the three main ethnic groups in Singapore from the census. Here
we present a more in depth look at the relationship between SES and language use from
SSS 2006.
Table 3: Dominant home language by ethnic group and social class
Language Usually
Used At Home (%)
Low SES Medium SES High SES
Chinese Malay Indian Chinese Malay Indian Chinese Malay Indian
English 1.0 0.0 4.0 11.0 0.0 10.5 17.9 3.0 7.4
Mother Tongue 51.0 25.7 4.0 21.2 11.8 10.5 10.5 0.0 14.8
English-MT 20.2 74.3 92.0 38.6 85.9 68.5 50.0 87.9 74.1
English-MT-Dialect 25.9 - - 26.8 - - 21.0 - -
Others 1.9 0.0 0.0 2.4 2.3 10.5 0.6 9.l 3.7
Total 100.0 100.0 100.0 100.0 100.0 100.0 100.0 100.0 100.0
English Only English only = 1 .08 - English and Mother Tongue English+MT = 1 .56 - English, Mother Tongue and Dialect English+MT+Dialec t= 1 .14 - Others Others = 1 .02 -
Language Most Comfortable with Friends English and Mother Tongue (omitted) .69 - English Only English = 1 .12 - Mother Tongue Only Mother Tongue = 1 .19 - Watching TV in English Ranges from 1 to 4 2.99 .83 Watching TV in Mother Tongue Ranges from 1 to 4 3.04 .81 Reading Books in English Ranges from 1 to 4 3.19 .81 Reading Books in Mother Tongue Ranges from 1 to 4 2.44 .75
Learning About Religion Mother Tongue Only (omitted) .46 - English Only English = 1 .45 - English and Mother Tongue English+MT = 1 .07 - Others Others = 1 .02 -
School Level Variable (n=25) Percentage of Home Language in English Ranges from 0 to .4 .08 .09 Percentage of Language Most Comfortable with
Friends in English Ranges from 0 to .3 .11 .08
Watching TV in English Ranges from 2.64 to 3.35 2.99 .20 Reading Books in Mother Tongue Ranges from 2.05 to 2.81 2.46 .22 Percentage of Learning About Religion in Mother
Tongue Ranges from 0 to .71 .37 .17
15
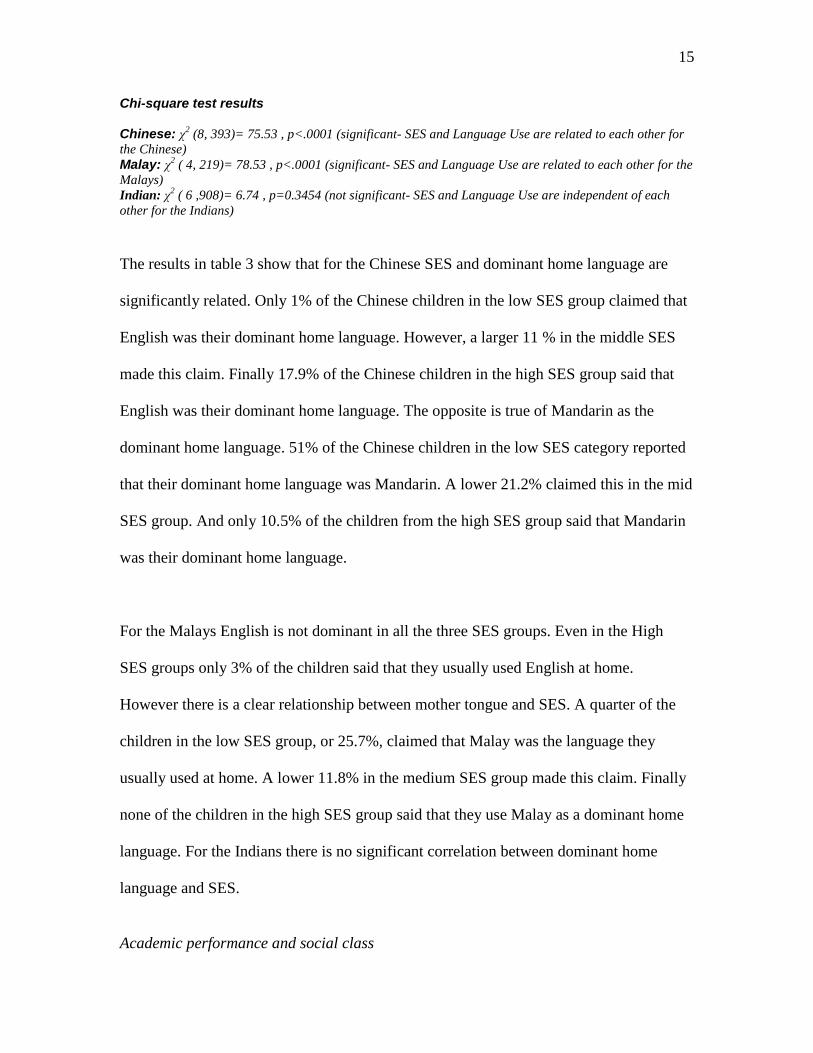
Chi-square test results Chinese: χ2
(8, 393)= 75.53 , p<.0001 (significant- SES and Language Use are related to each other for
the Chinese)
Malay: χ2 ( 4, 219)= 78.53 , p<.0001 (significant- SES and Language Use are related to each other for the
Malays)
Indian: χ2 ( 6 ,908)= 6.74 , p=0.3454 (not significant- SES and Language Use are independent of each
other for the Indians)
The results in table 3 show that for the Chinese SES and dominant home language are
significantly related. Only 1% of the Chinese children in the low SES group claimed that
English was their dominant home language. However, a larger 11 % in the middle SES
made this claim. Finally 17.9% of the Chinese children in the high SES group said that
English was their dominant home language. The opposite is true of Mandarin as the
dominant home language. 51% of the Chinese children in the low SES category reported
that their dominant home language was Mandarin. A lower 21.2% claimed this in the mid
SES group. And only 10.5% of the children from the high SES group said that Mandarin
was their dominant home language.
For the Malays English is not dominant in all the three SES groups. Even in the High
SES groups only 3% of the children said that they usually used English at home.
However there is a clear relationship between mother tongue and SES. A quarter of the
children in the low SES group, or 25.7%, claimed that Malay was the language they
usually used at home. A lower 11.8% in the medium SES group made this claim. Finally
none of the children in the high SES group said that they use Malay as a dominant home
language. For the Indians there is no significant correlation between dominant home
language and SES.
Academic performance and social class
16
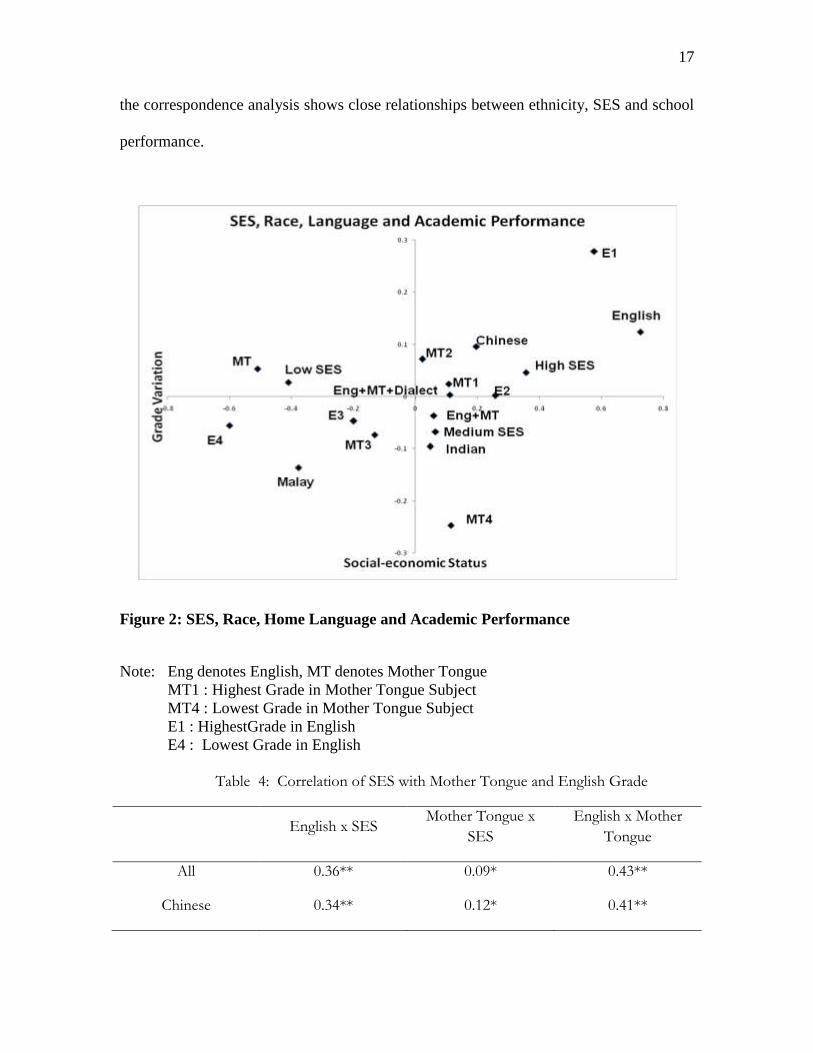
Figure 2 depicts the relationships between soico-economic status, dominant home
language, ethnicity and English grade/Mother Tongue grade in a two diemensional space.
Correspondence analysis was carried out to produce the output. First, we divided the SES
principal component scale into three groups: the high SES, medium SES and low SES.
Then the SES group was cross tabulated with dominant home language and ethnicity.
English grade and Mother Tongue grade were used as supplmentary variables to aid
interpretation. Two dimensional solution was deemed sufficient to sieve out valuable
information about the relationships among these variables under study as the first
dimension (97.5%) explained almost all the variation.
The first dimension, on the x-axis, was named socio-economic status, and represents the
family social and economic standings of the students. The positioning of the three SES
groups on the x-axis depcits this dimension: high SES group is located at the right hand
side, medium SES on the middle and low SES group on the left hand side of the graph.
The second dimension measures the variability of students‟ grades. The top right hand
corner represents the domain of high SES and high grades. The high SES group with
good grades in English (E3 and E4) and Mother Tongue (MT3 and MT4) fall in this
region. The Chinese, being the highest in mean SES and academic performance in
English, also fall within this social space. On the other hand, the left corner represents the
low SES domain. The low SES group for whom Mother Tongue is the dominant home
language fall within this region. Also, the Malay ethnic group is in this social space. Thus
17
the correspondence analysis shows close relationships between ethnicity, SES and school
performance.
Figure 2: SES, Race, Home Language and Academic Performance
Note: Eng denotes English, MT denotes Mother Tongue
MT1 : Highest Grade in Mother Tongue Subject
MT4 : Lowest Grade in Mother Tongue Subject
E1 : HighestGrade in English
E4 : Lowest Grade in English
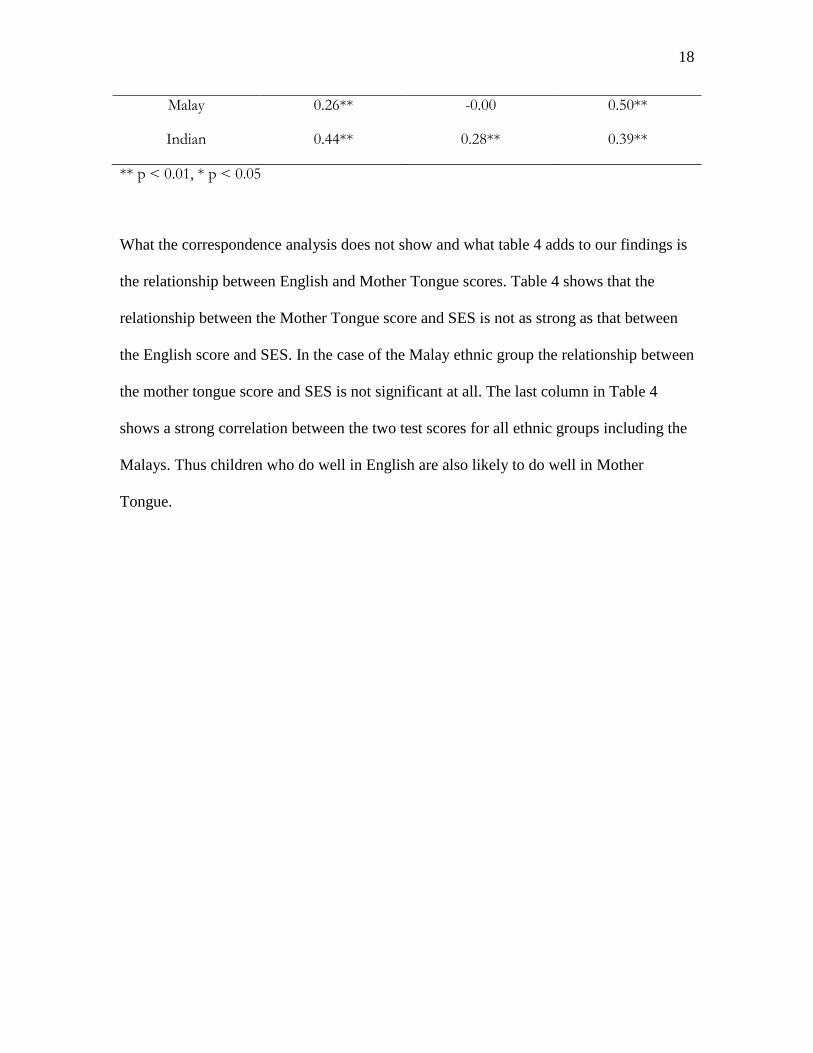
Table 4: Correlation of SES with Mother Tongue and English Grade
English x SES Mother Tongue x
SES
English x Mother
Tongue
All 0.36** 0.09* 0.43**
Chinese 0.34** 0.12* 0.41**
18
Malay 0.26** -0.00 0.50**
Indian 0.44** 0.28** 0.39**
** p < 0.01, * p < 0.05
What the correspondence analysis does not show and what table 4 adds to our findings is
the relationship between English and Mother Tongue scores. Table 4 shows that the
relationship between the Mother Tongue score and SES is not as strong as that between
the English score and SES. In the case of the Malay ethnic group the relationship between
the mother tongue score and SES is not significant at all. The last column in Table 4
shows a strong correlation between the two test scores for all ethnic groups including the
Malays. Thus children who do well in English are also likely to do well in Mother
Tongue.
19
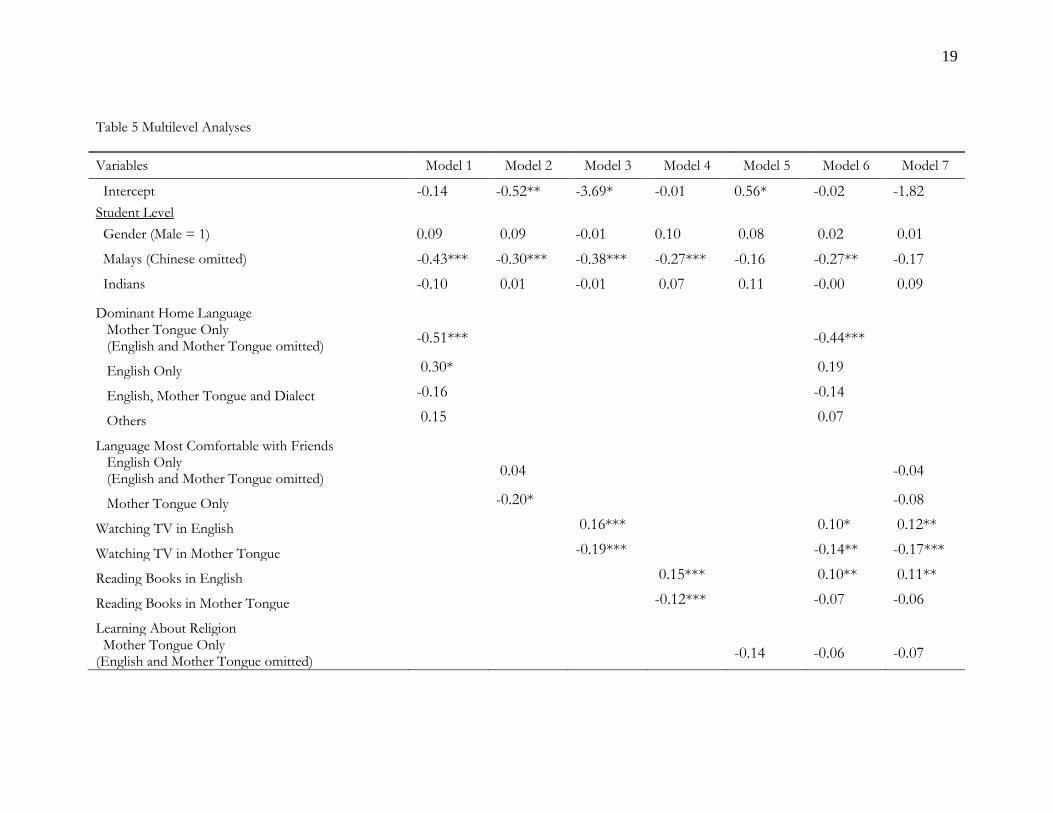
Table 5 Multilevel Analyses
Variables Model 1 Model 2 Model 3 Model 4 Model 5 Model 6 Model 7
Intercept -0.14 -0.52** -3.69* -0.01 0.56* -0.02 -1.82
Student Level
Gender (Male = 1) 0.09 0.09 -0.01 0.10 0.08 0.02 0.01
Malays (Chinese omitted) -0.43*** -0.30*** -0.38*** -0.27*** -0.16 -0.27** -0.17
Indians -0.10 0.01 -0.01 0.07 0.11 -0.00 0.09
Dominant Home Language
Mother Tongue Only (English and Mother Tongue omitted)
-0.51*** -0.44***
English Only 0.30* 0.19
English, Mother Tongue and Dialect -0.16 -0.14
Others 0.15 0.07
Language Most Comfortable with Friends
English Only (English and Mother Tongue omitted)
0.04 -0.04
Mother Tongue Only -0.20* -0.08
Watching TV in English 0.16*** 0.10* 0.12**
Watching TV in Mother Tongue -0.19*** -0.14** -0.17***
Reading Books in English 0.15*** 0.10** 0.11**
Reading Books in Mother Tongue -0.12*** -0.07 -0.06
Learning About Religion
Mother Tongue Only (English and Mother Tongue omitted)
-0.14 -0.06 -0.07
20
Variables Model 1 Model 2 Model 3 Model 4 Model 5 Model 6 Model 7
English Only 0.14 0.09 0.14
Others 0.16 0.15 0.19
School Level
Percentage of Home Language in English 3.96*** 2.98**
Percentage of Language Most Comfortable with
Friends in English 4.91*** 3.49**
Watching TV in English 1.29** 0.05 0.57
Reading Books in Mother Tongue -0.26** -0.03 0.03
Percentage of Learning About Religion in Mother
Tongue -1.75** -0.34 -0.58
Variance Component
School 0.0647 0.1079 0.1575 0.1677 0.1773 0.0639 0.0860
Student 0.6753 0.7153 0.6785 0.6927 0.7120 0.6379 0.6651
Percentage of Variance Explained
School Level 78.5 64.1 47.5 44.1 40.9 78.8 71.4
Student Level 8.7 3.3 8.3 6.4 3.7 13.8 10.1
All Two Levels 28.8 20.8 19.6 17.3 14.5 32.5 27.8
* p<0.05 ** p<0.01 *** p<0.001
21
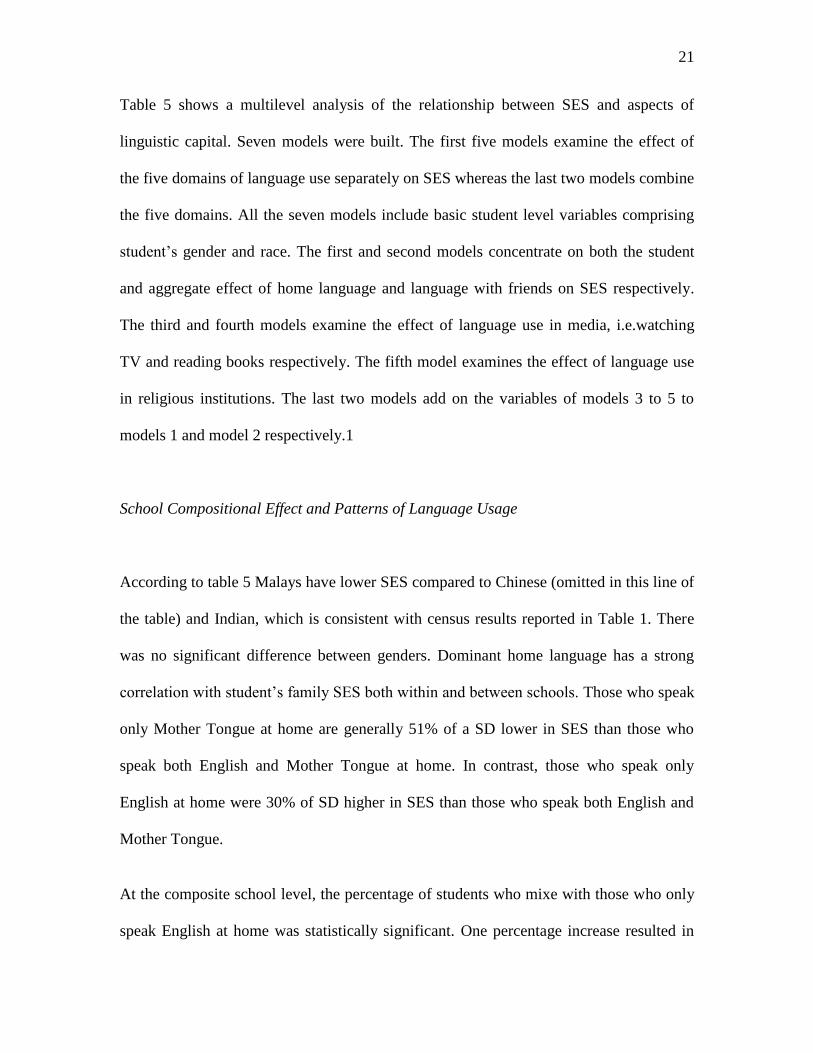
Table 5 shows a multilevel analysis of the relationship between SES and aspects of
linguistic capital. Seven models were built. The first five models examine the effect of
the five domains of language use separately on SES whereas the last two models combine
the five domains. All the seven models include basic student level variables comprising
student‟s gender and race. The first and second models concentrate on both the student
and aggregate effect of home language and language with friends on SES respectively.
The third and fourth models examine the effect of language use in media, i.e.watching
TV and reading books respectively. The fifth model examines the effect of language use
in religious institutions. The last two models add on the variables of models 3 to 5 to
models 1 and model 2 respectively.1
School Compositional Effect and Patterns of Language Usage
According to table 5 Malays have lower SES compared to Chinese (omitted in this line of
the table) and Indian, which is consistent with census results reported in Table 1. There
was no significant difference between genders. Dominant home language has a strong
correlation with student‟s family SES both within and between schools. Those who speak
only Mother Tongue at home are generally 51% of a SD lower in SES than those who
speak both English and Mother Tongue at home. In contrast, those who speak only
English at home were 30% of SD higher in SES than those who speak both English and
Mother Tongue.
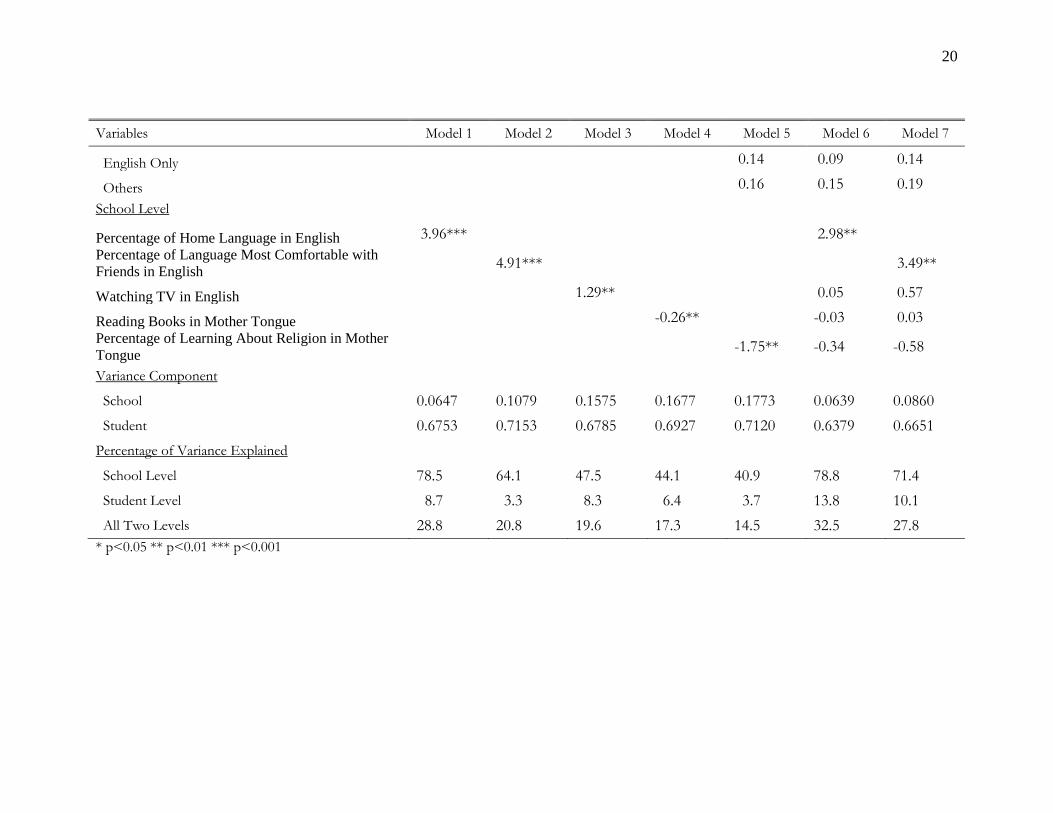
At the composite school level, the percentage of students who mixe with those who only
speak English at home was statistically significant. One percentage increase resulted in
22
.04 SD a positive effect in SES. Similarly, a negative effect was found between usage of
Mother Tongue with friends and SES: 20% of a SD lower compared to those who spoke
both Mother Tongue and English to friends. The percentage of children who are most
comfortable with friends who speak only English at the school level conveyed the same
message. One percentage increase goes with a .05 SD positive effect in SES.
Models 3, 4 and 5 convey a similar idea about the relationships between language use and
SES. At the student level, watching TV in English and reading books in English has a
positive relationship with SES. At the school level, watching TV in English has a positive
relationship whereas reading books in Mother Tongue and percentage of learning about
religion in Mother Tongue has a negative relationship with SES.
Models 5 and 6 display the aggregate effect of putting all the language variables together.
At the school level, only percentage of home language in English (Model 6) and
percentage of language most comfortable with friends in English (Model 7) were
statistically significant, whereas the rest of the language variables at school level were
not. This may imply that the variances of these two variables dominate the variance
partition whereas the rest of the language variables were absorbed into it. However, at the
student level, watching TV in English and Mother Tongue and reading books in English
remained statistically significant.
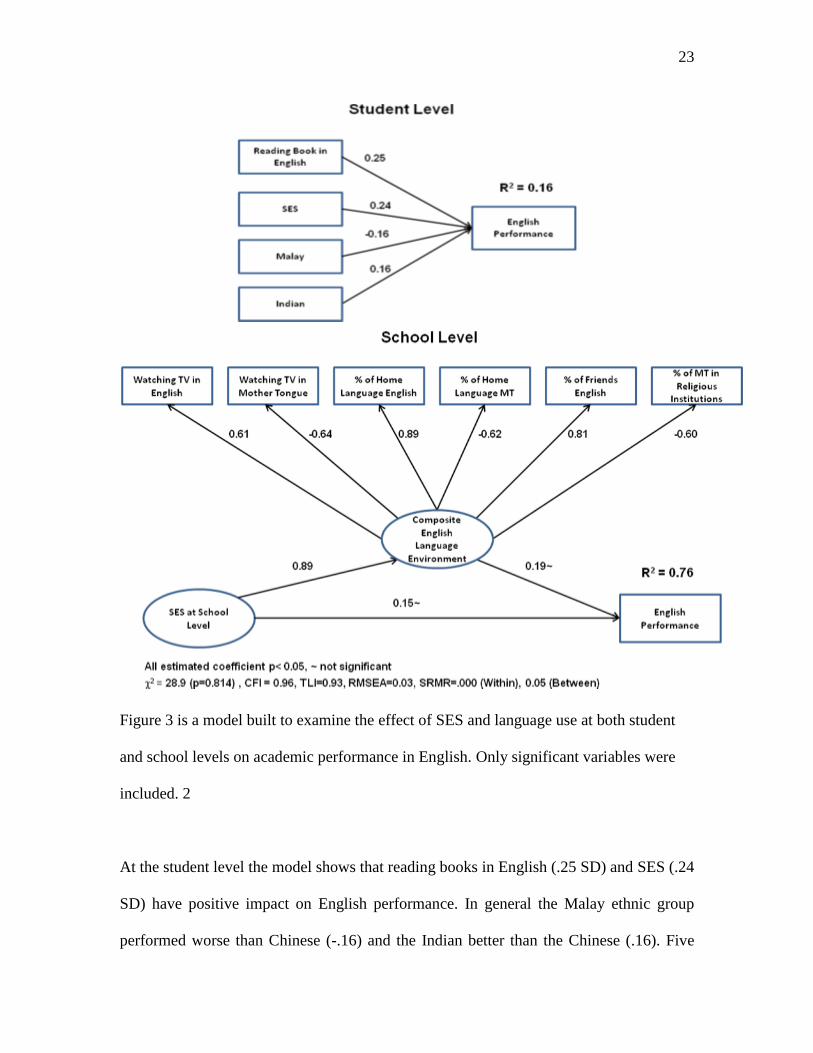
Figure 3: Multilevel SEM – English Performance, SES and Language Usage
23
Figure 3 is a model built to examine the effect of SES and language use at both student
and school levels on academic performance in English. Only significant variables were
included. 2
At the student level the model shows that reading books in English (.25 SD) and SES (.24
SD) have positive impact on English performance. In general the Malay ethnic group
performed worse than Chinese (-.16) and the Indian better than the Chinese (.16). Five
24
language variables at the school level were grouped to form a construct named as
composite English language environment. This factor represents the school language
environment where the students are located. As expected, variables associated with
English language have positive loadings. All loading coefficients were above .6. Mean
SES has a positive and large impact on composite language environment. The indirect
influences of SES on academic performance (0.19~ and 0.15~) were not significant
though they are still positive.
Discussion: Implications for the national school system
The relationships shown in the previous section between dominant home language, ethnic
group and class has serious implications for children entering an English medium school
system as the combination of low income with a non-English speaking home, can place
the child „at –risk‟. Such children find it challenging to cope with the demands of the
curriculum. As pointed out in the review of literature (Li, 2007; Lareau and Horvat,
1999), the parents of children who do not speak English feel alienated from the school
and are unable to participate in school activities or help their children with homework. In
the Singapore context this is likely to be the case with low income Chinese and Malay
families who tend not to speak English at home.
Furthermore the linguistic capital of disadvantaged homes does not include literacy
practices in English. As shown in table 5 children from low income homes tend not to
25
read in English and watch TV in English. In school they tend not to mix with children
who speak only English preferring the company of those who are, like them, mother
tongue dominant. In terms of social practice religious instruction for children from low
income homes tends to be in mother tongue. Their experience of socialization is thus
different from that of, for instance, Chinese children from high SES homes who speak
mainly English and frequent churches where services are conducted in English. As such
an English medium school system can be both a challenging and alienating experience
for Malay and Chinese children from low income homes.
The relationship between SES and the English grades that the children get in school is
noteworthy. Table 4 shows a significant correlation between SES and English grades.
This relationship is repeated in Figure 3 at the student level. Though in figure 3 at the
school level SES is not significantly effect academic performance in English there is still
a positive indirect influence. All these results reinforce Bourdieu‟s idea of social
reproduction in that children from social classes which are already privileged tend to
outperform their disadvantaged peers in school.
The Ministry of Education, Singapore, is aware of this sociolinguistic feature and offers
various support programs to help children who enter school from non-English speaking
homes. For instance the Learning Support Program (LSP) was set up in 1990/91 with the
purpose of locating at-risk children entering grade 1 and providing them with intervention
so that they can cope with mainstream education. At-risk children are identified using the
School Readiness Test, also known as the Primary 1 Screening Test. Every year
26
approximately 12,000 pupils or 20% of the cohort in a school are identified as being at
risk, though the percentage varies between schools (Menon, 2004).
However, researchers like Nafstad (1982) prefer that the problem be dealt with at the pre-
school level itself. As most children in Singapore attend pre-school we think this site
offers many opportunities for intervention in English language and literacy. Also, though
LSP has done well in acknowledging the gap between home and school it has some
shortcomings. LSP does not leverage on the „funds of knowledge‟ literature from the UK
and USA (Martin-Jones, M. and Saxena, M., 2003, Moll et. al., 1992) in which large
scale intervention was conducted with similarly at risk children. The main contributions
of the funds of knowledge projects, use of bilingual teaching aides, home visits and
instruction in the mainstream classroom through new interactional patterns instead of
pulling the child out into a remedial environment, are not part of LSP.
Conclusion
This paper has shown links between dominant home language and social class for the
Chinese and Malay ethnic groups in Singapore but not for the Indians. Using a
Bourdieusian framework we explore issues in the equitable distribution of the linguistic
capital of English to create a level playing field. Our key finding is that though
Singapore‟s bilingual language in education policy has been providing the linguistic
capital of English since 1987 the uptake of the English language in along class lines.
Those in the higher SES groups are more likely to be the ones who read in English, watch
TV in English and take religious instruction in English. These are also those whose
27
dominant home language is English in a bi/multilingual home. Children from such high
SES, English dominant homes do better in their English tests in school. They are thus
advantaged in an English medium national school system.
Notes:
1. The main reason of separating models 6 and 7 is that dominant home language
and language with friends at the school level was highly correlated. If the
variables are placed in the same model, it causes instability in the estimated
coefficient, a statistical phenomenon called multicollinearity. Besides the
statistical reasoning, the separation of these compositional variables into different
models allows us to examine separately the impact of these variables in relation to
SES.
2. Several fit indices are reported at the bottom of the model. Overall, the fit
statistics were reasonably good. The root mean square error of approximation
(RMSEA) was at .03. RMSEA with values less than .05 demonstrating good fit
(Browne & Cudeck, 1993; Brown, 2006). The standardized root mean square
(RSMS) is the average of the standardized residuals computed between the
estimated and observed elements in the variance-covariance matrices. A good fit
shows that the value should be less than .05. Both the between and within RSMS
were less than .03. The comparative fit index (CFI) and Tucker-Lewis index (TLI)
have a range of possible values from 0 to 1, with values closer to 1 implying good
model fit. The conventional threshold for the two indices is .90, with values
exceeding .95 indicative of good fit (Hu & Bentler, 1999). The model has .96 and
.93 for CFI and TLI. The χ2 statistics also showed a good fit.
3.
28
REFERENCES
Bourdieu, P. (1991) Language & Symbolic Power (….,Polity Press).
Bourdieu, P. & Passeron, J.C. (1977) Reproduction in education, society and culture
(Beverly Hills, CA, Sage).
Dika, S. L & Singh, K. (2002) Applications of Social Capital in Educational Literature: A
Critical Synthesis, Review of Educational Research, 72 ( 1), 31-60.
Driessen, Geert W.J.M. (2001) Ethnicity, Forms of Capital, and Educational
Achievement, International Review of Education, 47 (6), 513-538.
Fishman, J.A. (1998-1999) The New Linguistic Order, Foreign Policy, 113, 26-40.
Gupta, A. F. (1997) When Mother-tongue Education is not Preferred. Journal of
Multilingual and Multicultural Development, 18 (6), 496-506.
Goldstein, H. (1995) Multilevel Statistical Models (London, Edward Arnold).
Gopinathan, S., Pakir, A., Ho Wah Kam & Saravanan, V. (2003) Language, Society and
Education in Singapore: Issues and Trends (Singapore, Marshall Cavendish).
Hampshire, J. (1986) Language use, social class and educational achievement: a
discussion of the possible relationships, Early Child Development and Care, 26 (1), 51-
63.
Lareau, A. and Horvat, Erin McNamara (1999) Moments of Social Inclusion and
Exclusion Race, Class, and Cultural Capital in Family-School Relationships, Sociology of
Education, 72 (1), 37-53.
Li, G. (2007) Home environment and second-language acquisition: the importance of
family capital, British Journal of the Sociology of Education, 28 ( 3), 285-299.
Maas, C. J. M. and Hox, J. J. (2004) The influence of violations of assumptions on
multilevel parameter estimates and their standard errors, Computational Statistics and
Data Analysis, 46, 427-440.
Menon Sharma M. (2004). A study of the learning support programme (English) in
assisting identified pupils cope with the literacy demands of the mainstream curriculum:
A case study of the LSP in one school. Singapore:Nanyang Technological University,
National Institute of Education. Unpublished Thesis.
29
Martin-Jones, M. and Saxena, M. (2003) Bilingual Resources and „Funds of Knowledge‟
for Teaching and Learning in Multi-ethnic Classrooms in Britain, in Creese, A. (ed.)
Multilingual Classroom Ecologies (Clevedon, Multilingual Matters), 107-121.
Moll, L, A,, C., Neff, D. and Gozalez, N. (1992) Funds of knowledge for teaching: Using
a qualitative approach to connect homes and classrooms, Theory into Practice 31 (2),
132-141.
Nafstad, H. E. (1982) Preschool Children: Inquiry into Interconnections between Social
Class, Language and Training Programs, Scandinavian Journal of Educational Research,
26 (3), 121-139.
Pahl, K. (2005). Tracing habitus in texts: narratives of loss displacement and migration in
homes, in: Albright, J & Luke, A (Eds.) Bourdieu and Literacy Education, (Mahwah,
New Jersey, Lawrence Earlbaum), Pp.
Raudenbush, S. W. and Bryk, A. S. (2002) Hierarchical Linear Models: Applications and
Data Analysis Methods, Second Edition (London, Sage Publications).
Reay, D. (2004) „It‟s all becoming a habitus‟: beyond the habitual use of habitus in
educational research, British Journal of Sociology of Education,, 25, 431-444.
Silver, R. (2004) The Discourse of Linguistic Capital: Language and Economic Policy
Planning in Singapore, Language Policy, 4 (4), 47-66.
Stanton-Salazar, R. (1997) A Social Capital Framework for Understanding the
Socialization of Racial Minority Children and Youths, Harvard Educational Review 67
(1), 1-40.
Vaish, V, Tan, Teck Kiang & Bokhorst-Heng, W., Hogan, David & Kang, Travina
(forthcoming) Social Capital and Language in Singapore, in: Wee, Lionel and Pakir,
Anne (eds.) English in Singapore: Unity and Utilities (Hong Kong, Bolton).
Wee, L. (2003) Linguistic Instrumentalism in Singapore, Journal of Multicultural and
Multilingual Development, 24 (3), 211-224.