Embed Size (px)
Citation preview
LANDSLIDE OCCURRENCES IN THE HILLY AREAS OF BUDUDA DISTRICT IN EASTERN UGANDA AND
THEIR CAUSES
BY
KITUTU KIMONO MARY GORETTI
Bsc MUK, Msc. (ITC, Netherlands)
A THESIS SUBMITTED TO THE GRADUATE SCHOOL FOR THE AWARD OF THE DEGREE OF
DOCTOR OF PHILOSOPHY OF MAKERERE UNIVERSITY
DECEMBER 2010

i
DECLARATION
This thesis is my original work and has never been presented for the award of any degree in any
University.
Signed…………………………………….Date ……………………………..
Kitutu Kimono Mary Goretti
This thesis has been submitted for examination with my approval as the University Supervisor:
Dr. Andrew Muwanga,
Department of Geology, Makerere University.
Signed…………………………………….Date ……………………………..

ii
DEDICATION
To God be the glory for the good life and blessing given to me during the time of writing this
thesis. To my husband and family who have always inspired and prayed for me to succeed.
iii
ACKNOWLEDGEMENT
Thanks go to all my promoters Professor Poesen Jean, Professor Seppe Deckers and Dr.
Muwanga Andrew who supervised this research. Their guidance was very useful in the
finalization of this thesis. International Union of Conservation of Nature is also acknowledged
for providing the initial support in field surveys. The Belgian Technical Cooperation is
appreciated for patially funding the travel to Belgium to access literature and also funding the
acquisition of some field equipment. More thanks goes to the students I worked with at the
Catholic University of Leuven, Dr. Anke Knapen and Wendy Breugelmans for their
contribution in data collection. Also Dr. Claessens Lieven is appreciated for work on the
LAPSUS-LS model. Appreciation goes to Mr. Ssali Clement a soil scientist at Namalere
Agricultural Station for the technical support during the soil surveys. More appreciation goes to
Dr. Isabirye Moses and Mr Sendiwanyo of National Agricultural Research Laboratories
(NARL) and Dr. Mwanjalulu Mwajaliwa of Makerere University for the assistance during the
laboratory soil analysis and general discussions. Appreciation goes to Professor Dr.Dranzoa
Christine at the Graduate School and Dr. Barifaijo Erasmus the Head of Department Geology
of Makerere University then, for their support during the transfer of the thesis from the Catholic
University of Leuven to Makerere University. I highly appreciate the support from Doctoral
committee which guided the final stages of the thesis.
More appreciation goes to Mr and Mrs Walimbwa Johnson of Bududa Secondary School for
their support in the rainfall data collection. Also the people of Bududa District are thanked for
their support during interviews and fieldwork.
iv
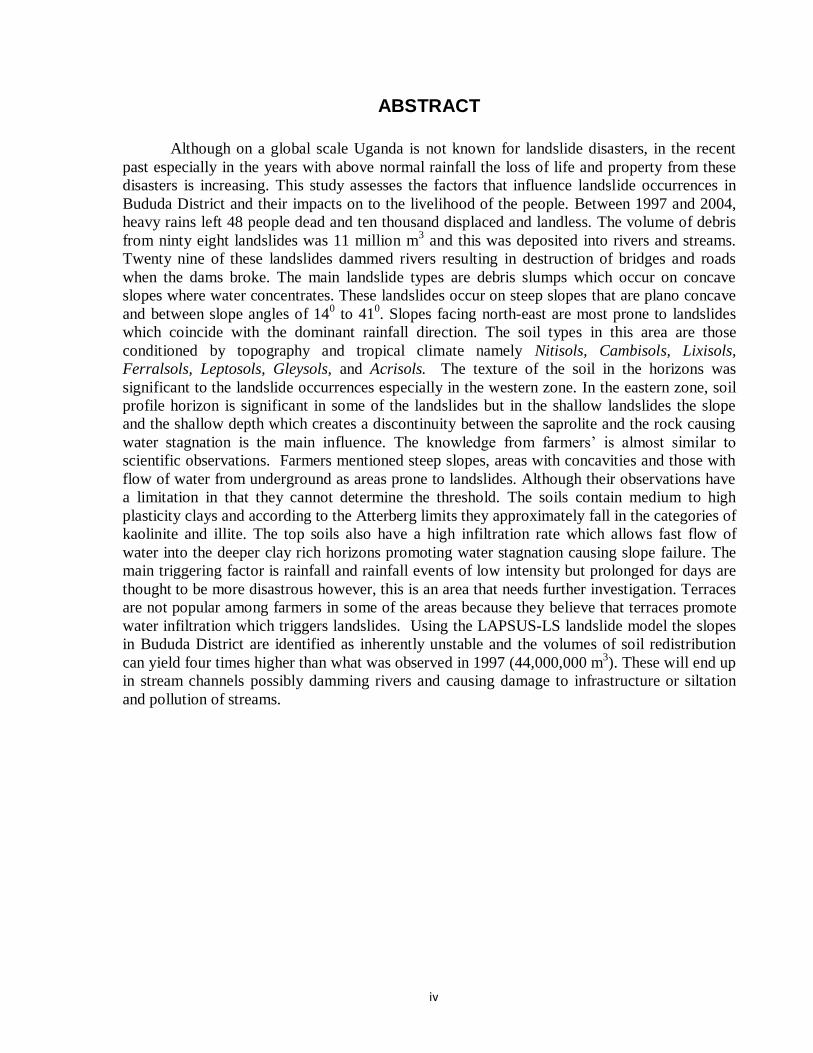
ABSTRACT
Although on a global scale Uganda is not known for landslide disasters, in the recent
past especially in the years with above normal rainfall the loss of life and property from these
disasters is increasing. This study assesses the factors that influence landslide occurrences in
Bududa District and their impacts on to the livelihood of the people. Between 1997 and 2004,
heavy rains left 48 people dead and ten thousand displaced and landless. The volume of debris
from ninty eight landslides was 11 million m3 and this was deposited into rivers and streams.
Twenty nine of these landslides dammed rivers resulting in destruction of bridges and roads
when the dams broke. The main landslide types are debris slumps which occur on concave
slopes where water concentrates. These landslides occur on steep slopes that are plano concave
and between slope angles of 140 to 41
0. Slopes facing north-east are most prone to landslides
which coincide with the dominant rainfall direction. The soil types in this area are those
conditioned by topography and tropical climate namely Nitisols, Cambisols, Lixisols,
Ferralsols, Leptosols, Gleysols, and Acrisols. The texture of the soil in the horizons was
significant to the landslide occurrences especially in the western zone. In the eastern zone, soil
profile horizon is significant in some of the landslides but in the shallow landslides the slope
and the shallow depth which creates a discontinuity between the saprolite and the rock causing
water stagnation is the main influence. The knowledge from farmers‟ is almost similar to
scientific observations. Farmers mentioned steep slopes, areas with concavities and those with
flow of water from underground as areas prone to landslides. Although their observations have
a limitation in that they cannot determine the threshold. The soils contain medium to high
plasticity clays and according to the Atterberg limits they approximately fall in the categories of
kaolinite and illite. The top soils also have a high infiltration rate which allows fast flow of
water into the deeper clay rich horizons promoting water stagnation causing slope failure. The
main triggering factor is rainfall and rainfall events of low intensity but prolonged for days are
thought to be more disastrous however, this is an area that needs further investigation. Terraces
are not popular among farmers in some of the areas because they believe that terraces promote
water infiltration which triggers landslides. Using the LAPSUS-LS landslide model the slopes
in Bududa District are identified as inherently unstable and the volumes of soil redistribution
can yield four times higher than what was observed in 1997 (44,000,000 m3). These will end up
in stream channels possibly damming rivers and causing damage to infrastructure or siltation
and pollution of streams.
v
CONTENTS ACKNOWLEDGEMENT ....................................................................................................................... iii ABSTRACT ......................................................................................................................................... iv LIST OF FIGURES .................................................................................................................................. viii LIST OF TABLES ..................................................................................................................................... ix CHAPTER ONE .................................................................................................................................... 1 INTRODUCTION ................................................................................................................................... 1 1.1 BACKGROUND ........................................................................................................................ 1 1.2 THE PROBLEM STATEMENT .................................................................................................. 3 1.3 RESEARCH OBJECTIVES ....................................................................................................... 3 1.4 RESEARCH HYPOTHESES ............................................................................................................. 4 1.5 JUSTIFICATION OF THE STUDY ............................................................................................ 4 1.6 STUDY AREA .......................................................................................................................... 5 1.7 STRUCTURE OF THE THESIS ......................................................................................................... 5
References .................................................................................................................................. 8
CHAPTER TWO .................................................................................................................................. 10 LITERATURE REVIEW ....................................................................................................................... 10 2.1 INTRODUCTION ......................................................................................................................... 10 2.2 POPULATION DYNAMICS ON MOUNT ELGON ................................................................................ 13 2.3 CLASSIFICATION OF LANDSLIDES ..................................................................................... 14
2.3.1 SLUMPS .................................................................................................................... 14
2.3.2 SLIDES ...................................................................................................................... 14
2.3.3 TOPPLES .................................................................................................................. 15
2.3.4. FALLS....................................................................................................................... 16
2.4 CAUSES OF LANDSLIDES .................................................................................................... 17
2.4.1. CAUSAL FACTORS .................................................................................................. 17
2.4.1.1 INFLUENCE OF SOIL PROPERTIES ................................................................ 17
2.4.1.2 INFLUENCE OF SLOPE STEEPNESS.............................................................. 19
2.4.1.3 INFLUENCE OF UNDERCUTTING OF SLOPES ............................................. 21
2.4.1.4 INFLUENCE OF THE GEOLOGICAL FACTORS ............................................. 21 2.4.2 TRIGGERING FACTORS ........................................................................................... 23
2.4.2.1 INFLUENCE OF RAINFALL ................................................................................ 23 2.5 INDIGENOUS KNOWLEDGE AND FARMERS PERCEPTION ON LANDSLIDE
OCCURRENCES .................................................................................................................... 26
References ............................................................................................................................. 27
CHAPTER THREE .............................................................................................................................. 32 A paper published in the journal Geomorphology 73, (2006) 149–165. .......................................... 32 CHAPTER FOUR ................................................................................................................................ 33 A paper published in the journal Geomorphology 90 (2007) 23–35 ................................................ 33 CHAPTER FIVE .................................................................................................................................. 34 A paper published in the African Journal of Agricultural Research Vol. 4 (7), pp. 611-620, July
2009.Available online at http://www.academicjournals.org/AJAR ISSN 1991-637X © 2009
Academic Journals ............................................................................................................... 34
vi
CHAPTER SIX .................................................................................................................................... 35 Under review (Africa Journal of Agricultural Research) Ms Number: AJAR-09-158 ..................... 35 CHAPTER SEVEN .............................................................................................................................. 36 Mountain Ecosystems, Resources and Development in Uganda Department of Geography,
Makerere University, (2004), Pages 94-98. ISBN 9970-05-017-6 ......................................... 36 CHAPTER EIGHT ............................................................................................................................... 37 8.1 EFFECTS OF EL NIÑO .......................................................................................................... 37 8.2 EFFECT OF RAINFALL ......................................................................................................... 37 8.3 INFLUENCE OF LITHOLOGY AND SLOPE ........................................................................... 41 8.4 INFLUENCE OF FENITIZATION ON THE WEATHERING OF GRANITES ............................ 42 8.5. INFLUENCE OF JOINTS AND LINEAMENTS ....................................................................... 45 8.6 INFLUENCE OF DYKES ............................................................................................................... 46
8.6.1 NUSU RIDGE DYKE .................................................................................................. 47
8.6.2. KITSAWA RIDGE DYKE ........................................................................................ 47
8.7 INFLUENCE OF SOIL PERMEABILITY................................................................................. 48 8.8 CONCLUSIONS .................................................................................................................... 50 References ......................................................................................................................................... 50 CHAPTER NINE.................................................................................................................................. 52 GENERAL CONCLUSIONS AND RECOMMENDATIONS .................................................................. 52 9.1 GEOMORPHIC FACTORS SUCH AS GEOLOGY, TOPOGRAPHY AND RELIEF HAVE A
HIGH INFLUENCE ON LANDSLIDE TYPES AND OCCURRENCES IN THIS REGION. ......... 52 9.2 SOIL PROPERTIES SUCH AS PARTICLE SIZE AND PORE DISTRIBUTION OF THE SOIL
MATRIX ARE A CONDITIONING FACTOR TO LANDSLIDE OCCURRENCES ..................... 52 9.3 FARMERS’ KNOWLEDGE AND PERCEPTION ON THE CONTROLLING FACTORS HAS NO
STRONG LINKAGE TO THE SCIENTIFIC OBSERVATIONS ................................................. 53 9.4 LANDSLIDE HAZARD CAN BE PREDICTED AND CLASSIFIED USING THE LAPSUS – LS
MODEL................................................................................................................................... 53 9.5 RAINFALL IS THE MAIN TRIGGERING FACTOR FOR LANDSLIDE OCCURRENCES IN
BUDUDA. ............................................................................................................................... 53 9.6 SCOPE OF FUTURE RESEARCH ........................................................................................ 54 9.7 RECOMMENDATIONS .......................................................................................................... 55 References ......................................................................................................................................... 56 APPENDIX A ...................................................................................................................................... 57
SOIL PROFILE DESCRIPTION ....................................................................................................... 57
APPENDIX B ...................................................................................................................................... 72
SOIL PROFILE EXAMINATION IN BUKIGAI AND BULUCHEKE SUBCOUNTIES ............... 72
APPENDIX C ...................................................................................................................................... 73
STRUCTURED - INTERVIEW SHEET FOR BUDUDA DISTRICT. MAY 2004 ...................... 73
APPENDIX D ...................................................................................................................................... 76
ORIENTATION OF JOINTS FROM BUGOBERO ROCKSLIDE ............................................. 76
APPENDIX E: ..................................................................................................................................... 77
LANDSLIDE FIELD ASSESSMENT ....................................................................................... 77
APPENDIX F:...................................................................................................................................... 81
PERMEABILITY TESTS ......................................................................................................... 81
APPENDIX G ...................................................................................................................................... 86
vii
MAP FOR SAMPLE AREAS ................................................................................................... 86
APPENDIX H: ..................................................................................................................................... 87
INFLTRATION RATE MEASUREMENTS ............................................................................... 87
APPENDIX I ........................................................................................................................................ 95
WEATHERING INDEX FOR THE SAMPLES ......................................................................... 95
APPENDIX J: ...................................................................................................................................... 96
DAILY RAINFALL DATA COLLECTED FROM LOCAL RAINGAUGES BY FARMERS AT
BUDUDA S.S FROM 2001 -2003. .......................................................................................... 96
viii
LIST OF FIGURES
Figure 1b: Location of the study area in Uganda ....................................................................... 6
Figure 2: Manjiya County as originally under Mbale District. .................................................. 7
Figure 3: Location of houses in Bududa District. .................................................................... 16
Figure 4: Schematic representation of landslide types ..................................................................... 18
Figure 5: Rainfall distribution for the Mount Elgon Climatic Zone ......................................... 24
Figure 6: Monthly rainfall for 2002 - 2003 at Bulucheke (1350 a.s.l) .. ................................... 25
Figure 7: Correlation of rainfall data for Bududa with Buginyanya rainfall station ................................. 39
Figure 8: Correlation of rainfall data collected for Bududa with Mutufu rainfall station ........................... 39
Figure 9: Rainfall data from a local rain gauge monitored by farmers in Bulucheke .............................. 40
Figure 10: Stability of minerals to dissolution and chemical weathering (Selby 1993) ........................... 44
Figure 11: The map of Bugobero rockslide and surrounding areas .................................................... 46
Figure 12: Nusu ridge dyke ......................................................................................................... 47
Figure 13: Fractured rocks at the tip of Nusu dyke .......................................................................... 48
Figure 14: Kitsawa ridge dyke ..................................................................................................... 48
ix
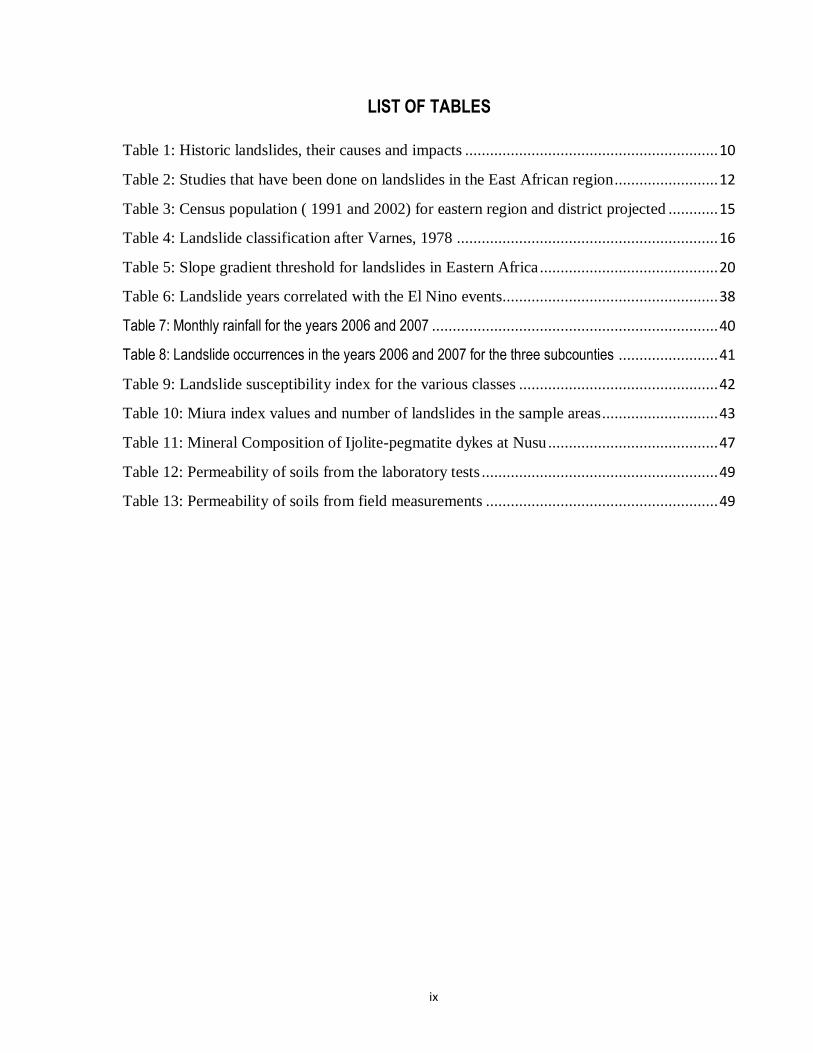
LIST OF TABLES
Table 1: Historic landslides, their causes and impacts ............................................................. 10
Table 2: Studies that have been done on landslides in the East African region ......................... 12
Table 3: Census population ( 1991 and 2002) for eastern region and district projected ............ 15
Table 4: Landslide classification after Varnes, 1978 ............................................................... 16
Table 5: Slope gradient threshold for landslides in Eastern Africa ........................................... 20
Table 6: Landslide years correlated with the El Nino events.................................................... 38
Table 7: Monthly rainfall for the years 2006 and 2007 ..................................................................... 40
Table 8: Landslide occurrences in the years 2006 and 2007 for the three subcounties ........................ 41
Table 9: Landslide susceptibility index for the various classes ................................................ 42
Table 10: Miura index values and number of landslides in the sample areas ............................ 43
Table 11: Mineral Composition of Ijolite-pegmatite dykes at Nusu ......................................... 47
Table 12: Permeability of soils from the laboratory tests ......................................................... 49
Table 13: Permeability of soils from field measurements ........................................................ 49
1
CHAPTER ONE
INTRODUCTION
1.1 BACKGROUND
Landslide occurrence is on the increase worldwide the consequences of which can
be loss of life, loss of livestock, damaging or destroying residential and industrial
developments, villages or even entire towns, destroying agricultural and forest land and
negatively influencing the quality of water in rivers and streams (UNESCO/UNEP,
1988). The worldwide increased population and economic pressures in mountainous areas
have forced human activities to shift to practices such as deforestation, urban
development and agriculture into potentially hazardous regions (Guthrie, 2002). In
Uganda it is reported that all mountainous areas are either vulnerable to or currently
facing serious soil erosion (NEMA, 1997). It is also reported that farmers do not have
incentives to undertake conservation measures in mountainous areas of Uganda (NEMA,
1997). Due to these shortcomings mountain disasters such as landslides have had
significant impacts but limited interventions exist to minimize them. Landslides are
caused by a combination of both natural and human related causes (Tanya, 2001). For
example, between 1830 and 1950 the steep slopes northeast of Puerto Rico were cleared
for agriculture resulting in gullies and landslides (Clark and Wilcock, 2000). Further
still, Inganga et al, in 2001 reported that many landslides that occurred in Nyeri district in
central Kenya were caused by human activities which included cultivation, deforestation
and terracing of steep slopes. They further report that the soils also have high clay
content and probably the swelling clays are another important factor in triggering
landslides. In addition Bagoora 1988, in the assessment of massmovements in Rukiga
area South Western Uganda observed that landslides occur during peak rainy seasons of
March and April. Geologic factors have also been found to cause mass movements on
slopes and these include shallow soils over hard impermeable rocks or glacial till, soft,
clay-rich rocks that produce thick plastic soil mantles, alignment of lineaments parallel to
the ground slope and planar rock structures, unconsolidated or weakly consolidated
deposits (Sidle et al., 1985). A landslide occurs when the average shear stress of the
2
hillslope material becomes greater than the average shear resistance (Larsen and Torres-
Sanchez, 1998). Favorable conditions for sliding may exist or accumulate for a long
period of time without any movement taking place (Scharpe 1938). Nevertheless, the
right impulse can develop a number of slides that happen simultaneously or within a short
period of time. These are normally referred to as triggering factors. These causes can be
divided into internal and external factors. The internal factors include pore water
pressure, decrease in the cohesion of the slope material, steeply dipping beds and
steepness of the cliff faces. Meanwhile the external factors include rainfall, earthquakes,
vibrations from heavy machinery, artificial increase of slope angle and removal of lateral
support (Inganga et al., 2001). Rainfall is a common triggering factor. Tsereteli (in
UNESCO/UNEP, 1988), stated that a close relationship exists between landslide activity
and the amount of precipitation. The amount of rainfall has considerable influence on the
moisture content and the pore water pressure in soils. Landslides are more likely to occur
if high amounts of intense rainfall are preceded by a period of light but incessant
precipitation. This is because saturation of soils needs a much longer period and, that is
why there are higher numbers of landslides during September than July in the Ethiopian
highlands. The high rainfall in July is absorbed by dry soils and towards September the
soils become saturated resulting in higher possibility of slope failure (Ayalew, 1999). In
the Aberdare ranges in Kenya, many landslides occur at the beginning of the rainy season
(Inganga et al, 2001) and this is because of deep cracks in the soils which allow water
infiltration into the soil to deep levels causing landslides.
Slope steepness is also a significant factor and the greater the height, steepness
and concavity of slopes, the greater the volumes of the landslides (UNESCO/UNEP,
1988). In tropical areas, slope failures are most common on slopes between 30° and 60°.
Landslides in the Aberdare ranges in Kenya are confined to slopes 20° and more (Ngecu
and Mathu, 1999). Slope failure is more common in concave landscape parts due to the
long-term accumulation of sediment transported from adjacent slopes resulting in thicker
soils and the convergence of subsurface flow leading to higher pore pressures (Gabet and
Duune, 2002).
Chenery in 1960, in the major soil surveys done in the country, mentioned the risk
of soil slips in Bududa. He mentions the presence of cracks in the soils and recent scars of
3
landslips in that year. As these disasters continue to take their toll, there is need for an in-
depth study that will provide information to minimize on the risk.
1.2 THE PROBLEM STATEMENT
Although it is clear that landslides have caused damage in the mountainous areas
of Bududa District, (NEMA, 1998) their causes and factors that influence them in the
Bududa areas are still not well understood. The challenge of some of the hilly areas not
affected as compared to others heavily devastated leaves more questions to be answered
on what the actual causes are. Available information indicates that the heavy rains
experienced between October 1997 to January 1998 caused landslides, which killed 48
people and displaced 10,000 from the slopes of Bududa. Further still, the heavy rains in
August and September 2007 left five people dead, crops and a lot of property damaged.
80% of Bududa is a fragile ecosystem because of its extreme steepness and at the same
time it has an average population density of 952 people per km2 (UBOS 2002) making it
one of highly populated areas in Uganda. The estimated land holding per person is at 32
m2 (Knapen et al., 2006) which creates extreme pressure on land probably leading to the
high landslides incidences. Government had proposed resettlement of some of the
affected people to safer areas in Mbale District. This was hampered when Bududa was
made a district. The situation is likely to become worse because the sediment from
landslide will cause siltation of river channels and wetlands downstream resulting into
floods and affecting more communities.
1.3 RESEARCH OBJECTIVES
The main objective of this study was to provide decision makers in Uganda with
the landslide hazards and risk assessment methodology for proper management and
planning of development in mountainous and hilly areas.
The specific objectives were to:
1. Assess and identify the geological and topographic factors that cause landslides.
In addition assess the chemical and physical properties that influence landslides in
Bududa.
2. Locate the landslide potential areas and generate landslide hazard maps.
4
3. Test the farmers understanding on landslides and promote community
involvement in landslide management.
4. Assess the influence of rainfall.
1.4 RESEARCH HYPOTHESES
Objective 1:
Geomorphic factors such as geology, topography and relief have a high influence on
landslide types and occurrences in this region.
Soil properties such as particle size and pore distribution of the soil matrix are a
conditioning factor to landslide occurrences.
Objective 2:
Landslide hazards can be predicted and classified using the LAPSUS – LS model.
Objective 3:
Farmers‟ knowledge and perception on the controlling factors has no strong linkage to the
scientific observations.
Objective 4:
Rainfall is the main triggering factor for landslide occurrences in Bududa.
1.5 JUSTIFICATION OF THE STUDY
This study will provide more information and data on what already exists globally
in understanding landslide processes and their impacts in Bududa. Bududa was selected
as a study area because of the high number of landslide incidences in the country. The
findings can be applied to other areas of the country with similar problems. Landslides
occurrences are associated with decrease in crop yields, damage to property and
infrastructure. Factors that cause landslides in the world are generally known, however
no specific research has been made done in Uganda which creates a gap on information
on this processes. Other areas in Uganda suffer from landslides and most policies
concentrate more on soil erosion. The findings from this research can be used to improve
5
on the existing policies on the management of mountainous areas in Uganda, reduce on
their occurrence in order to minimize losses from these disasters.
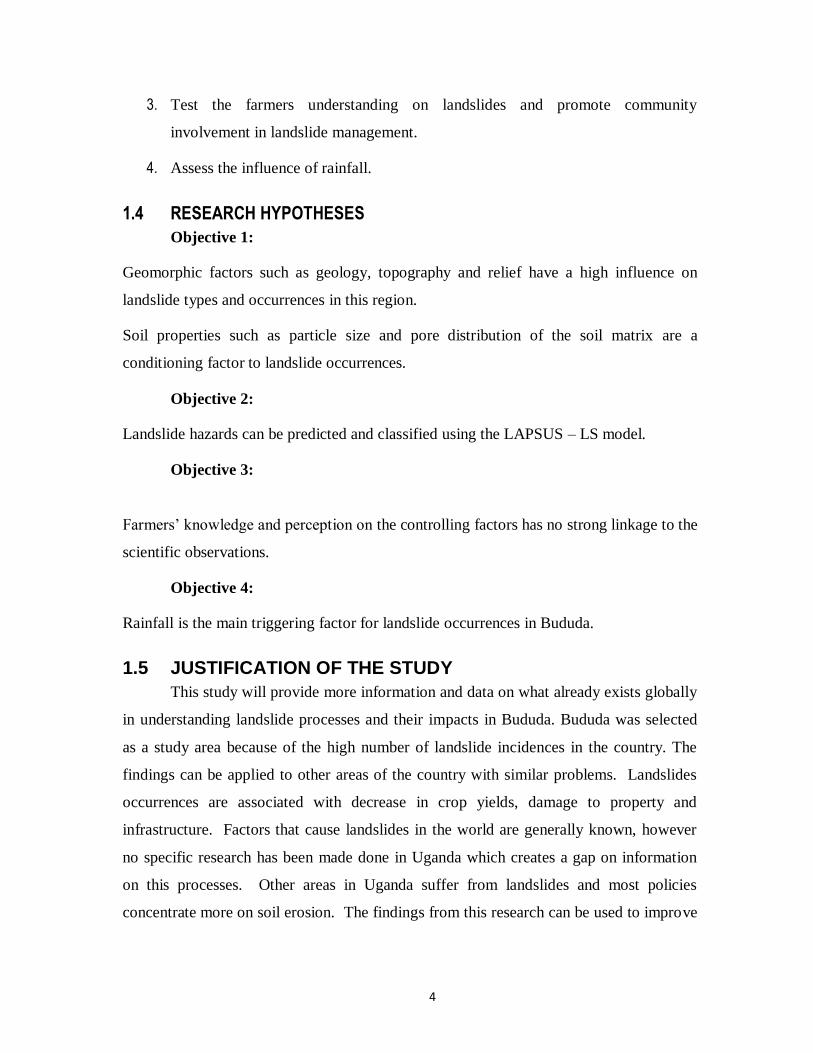
1.6 STUDY AREA
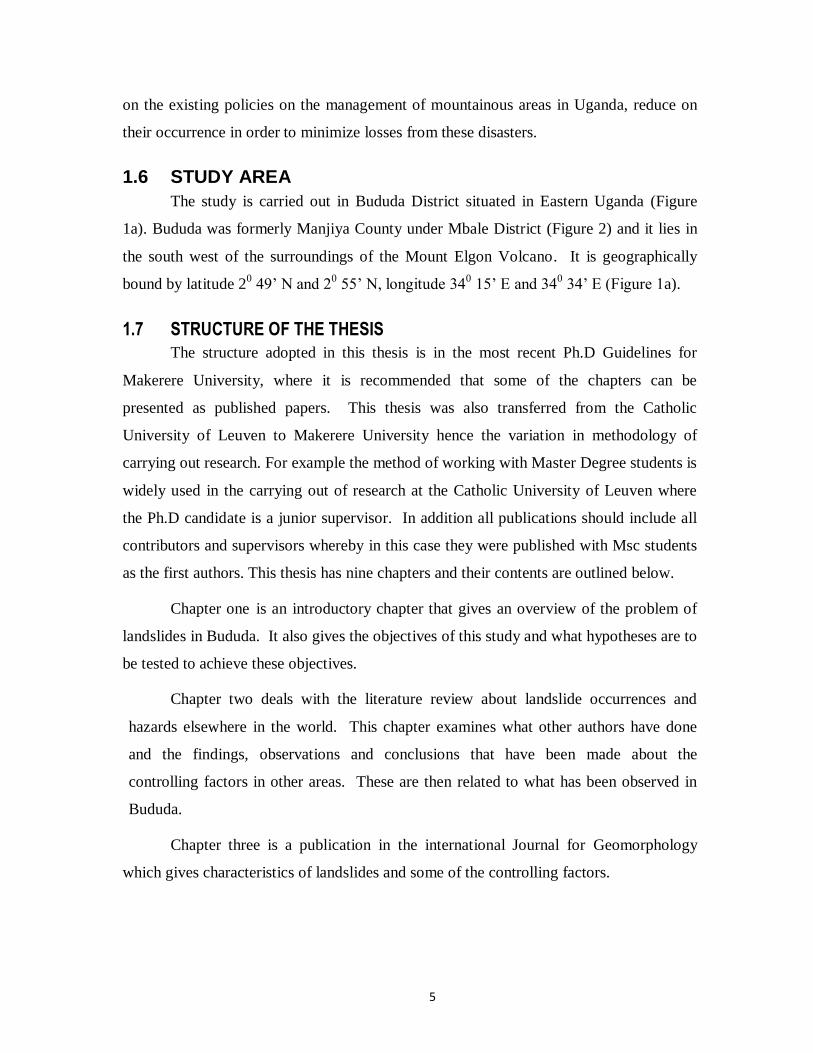
The study is carried out in Bududa District situated in Eastern Uganda (Figure
1a). Bududa was formerly Manjiya County under Mbale District (Figure 2) and it lies in
the south west of the surroundings of the Mount Elgon Volcano. It is geographically
bound by latitude 20 49‟ N and 2
0 55‟ N, longitude 34
0 15‟ E and 34
0 34‟ E (Figure 1a).
1.7 STRUCTURE OF THE THESIS
The structure adopted in this thesis is in the most recent Ph.D Guidelines for
Makerere University, where it is recommended that some of the chapters can be
presented as published papers. This thesis was also transferred from the Catholic
University of Leuven to Makerere University hence the variation in methodology of
carrying out research. For example the method of working with Master Degree students is
widely used in the carrying out of research at the Catholic University of Leuven where
the Ph.D candidate is a junior supervisor. In addition all publications should include all
contributors and supervisors whereby in this case they were published with Msc students
as the first authors. This thesis has nine chapters and their contents are outlined below.
Chapter one is an introductory chapter that gives an overview of the problem of
landslides in Bududa. It also gives the objectives of this study and what hypotheses are to
be tested to achieve these objectives.
Chapter two deals with the literature review about landslide occurrences and
hazards elsewhere in the world. This chapter examines what other authors have done
and the findings, observations and conclusions that have been made about the
controlling factors in other areas. These are then related to what has been observed in
Bududa.
Chapter three is a publication in the international Journal for Geomorphology
which gives characteristics of landslides and some of the controlling factors.
6
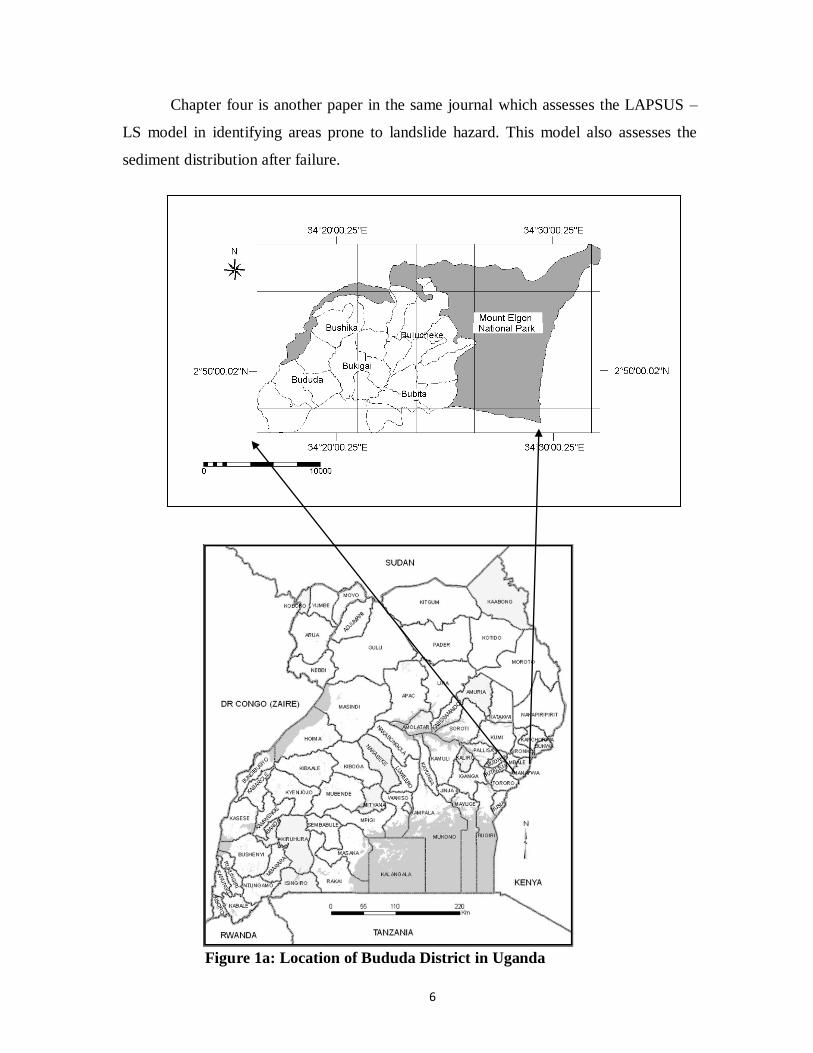
Chapter four is another paper in the same journal which assesses the LAPSUS –
LS model in identifying areas prone to landslide hazard. This model also assesses the
sediment distribution after failure.
Figure 1a: Location of Bududa District in Uganda
7
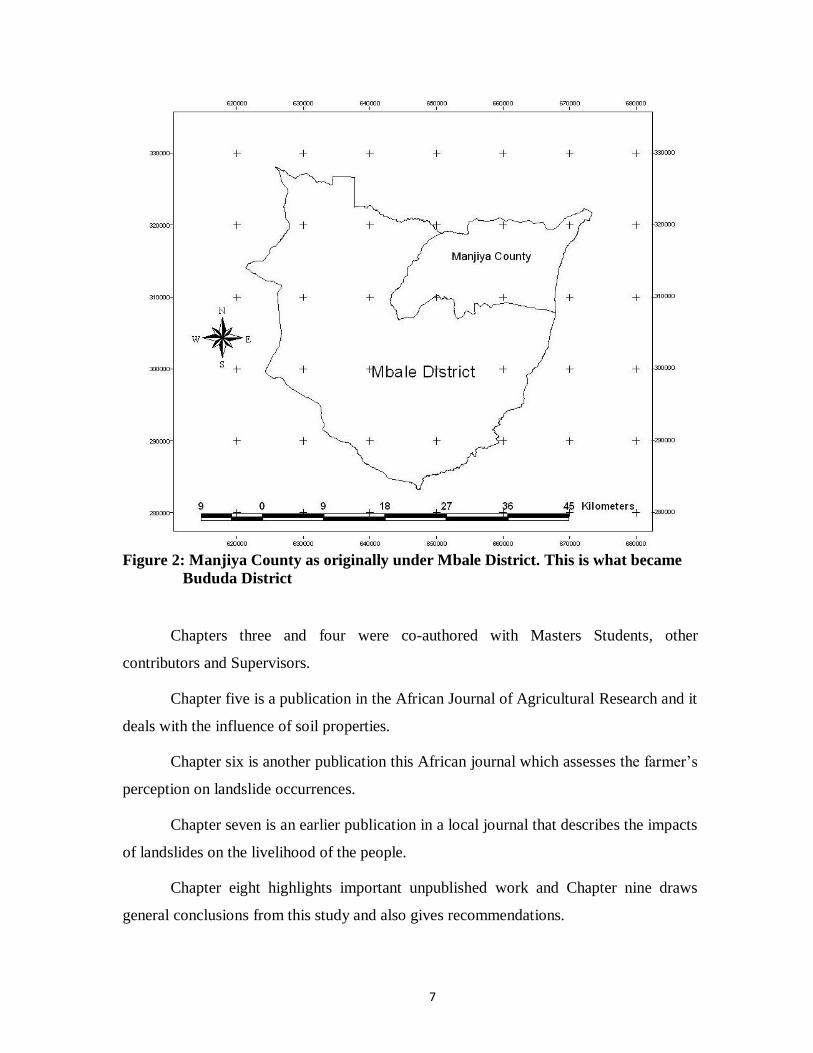
Figure 2: Manjiya County as originally under Mbale District. This is what became
Bududa District
Chapters three and four were co-authored with Masters Students, other
contributors and Supervisors.
Chapter five is a publication in the African Journal of Agricultural Research and it
deals with the influence of soil properties.
Chapter six is another publication this African journal which assesses the farmer‟s
perception on landslide occurrences.
Chapter seven is an earlier publication in a local journal that describes the impacts
of landslides on the livelihood of the people.
Chapter eight highlights important unpublished work and Chapter nine draws
general conclusions from this study and also gives recommendations.
8
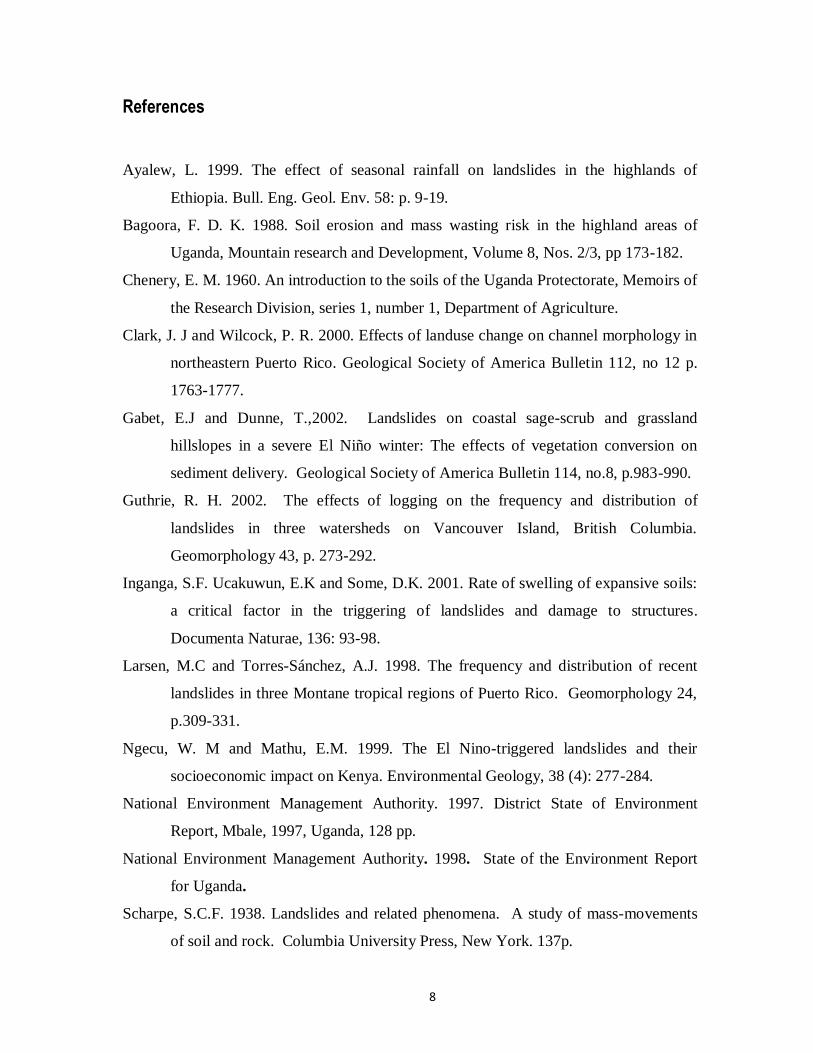
References
Ayalew, L. 1999. The effect of seasonal rainfall on landslides in the highlands of
Ethiopia. Bull. Eng. Geol. Env. 58: p. 9-19.
Bagoora, F. D. K. 1988. Soil erosion and mass wasting risk in the highland areas of
Uganda, Mountain research and Development, Volume 8, Nos. 2/3, pp 173-182.
Chenery, E. M. 1960. An introduction to the soils of the Uganda Protectorate, Memoirs of
the Research Division, series 1, number 1, Department of Agriculture.
Clark, J. J and Wilcock, P. R. 2000. Effects of landuse change on channel morphology in
northeastern Puerto Rico. Geological Society of America Bulletin 112, no 12 p.
1763-1777.
Gabet, E.J and Dunne, T.,2002. Landslides on coastal sage-scrub and grassland
hillslopes in a severe El Niño winter: The effects of vegetation conversion on
sediment delivery. Geological Society of America Bulletin 114, no.8, p.983-990.
Guthrie, R. H. 2002. The effects of logging on the frequency and distribution of
landslides in three watersheds on Vancouver Island, British Columbia.
Geomorphology 43, p. 273-292.
Inganga, S.F. Ucakuwun, E.K and Some, D.K. 2001. Rate of swelling of expansive soils:
a critical factor in the triggering of landslides and damage to structures.
Documenta Naturae, 136: 93-98.
Larsen, M.C and Torres-Sánchez, A.J. 1998. The frequency and distribution of recent
landslides in three Montane tropical regions of Puerto Rico. Geomorphology 24,
p.309-331.
Ngecu, W. M and Mathu, E.M. 1999. The El Nino-triggered landslides and their
socioeconomic impact on Kenya. Environmental Geology, 38 (4): 277-284.
National Environment Management Authority. 1997. District State of Environment
Report, Mbale, 1997, Uganda, 128 pp.
National Environment Management Authority. 1998. State of the Environment Report
for Uganda.
Scharpe, S.C.F. 1938. Landslides and related phenomena. A study of mass-movements
of soil and rock. Columbia University Press, New York. 137p.
9
Sidle, R. C. Pearce, A. J and O‟ Loughlin, C. L. 1985. Hillslope stability and landuse.
American Geophysical Union, Washington DC, USA, 125 pp.
Uganda Bureau of Statistics, 2004. The 2002 Uganda Population and Housing Census.
(http://www.ubos.org/2002census.html)
UNESCO / UNEP, 1988. Landslides and mudflows Volume 1. UNEP/UNESCO,
Moscow. 236p
Tanya, P. 2001. http://www.mtnforum.org/oldocs/621.pdf).
10
CHAPTER TWO
LITERATURE REVIEW
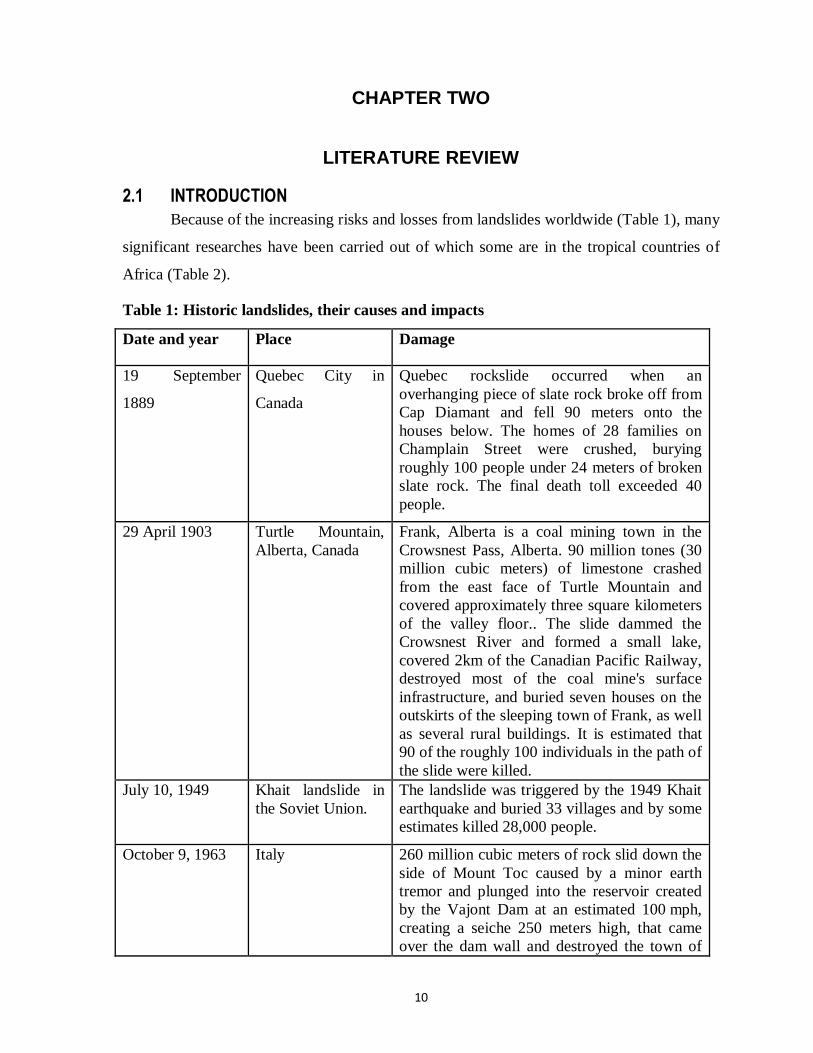
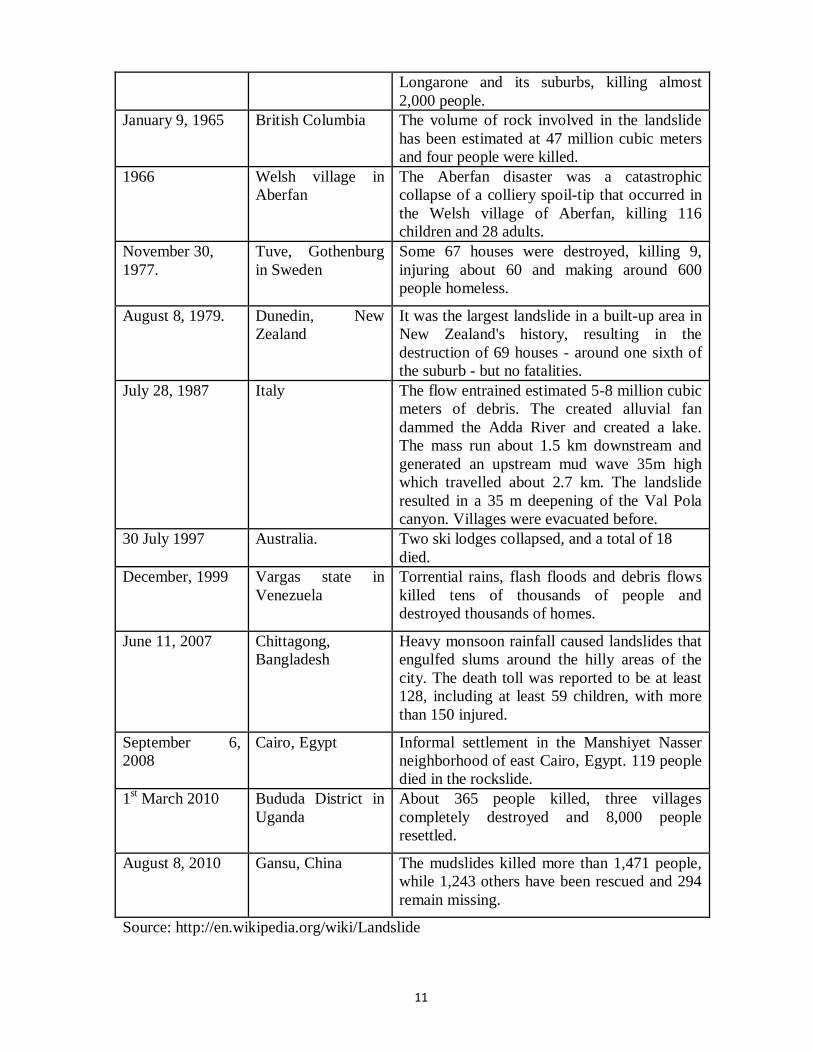
2.1 INTRODUCTION
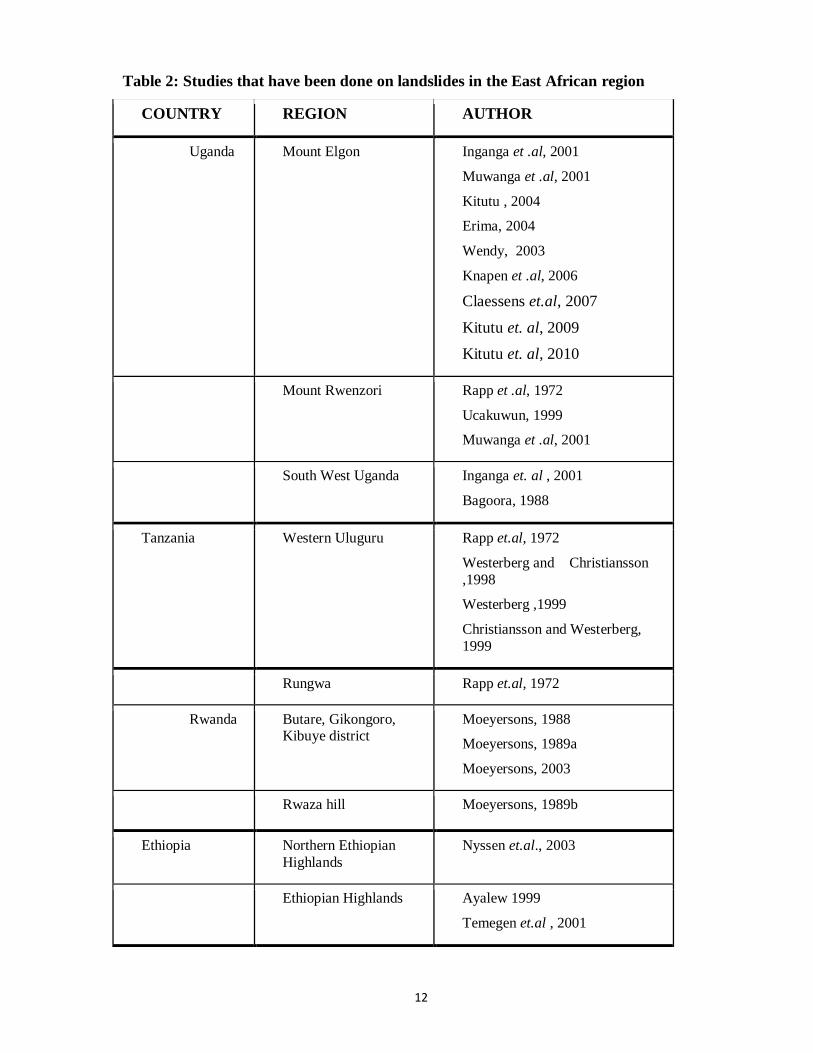
Because of the increasing risks and losses from landslides worldwide (Table 1), many
significant researches have been carried out of which some are in the tropical countries of
Africa (Table 2).
Table 1: Historic landslides, their causes and impacts
Date and year Place Damage
19 September
1889
Quebec City in
Canada
Quebec rockslide occurred when an
overhanging piece of slate rock broke off from
Cap Diamant and fell 90 meters onto the
houses below. The homes of 28 families on
Champlain Street were crushed, burying
roughly 100 people under 24 meters of broken
slate rock. The final death toll exceeded 40
people.
29 April 1903 Turtle Mountain,
Alberta, Canada
Frank, Alberta is a coal mining town in the
Crowsnest Pass, Alberta. 90 million tones (30
million cubic meters) of limestone crashed
from the east face of Turtle Mountain and
covered approximately three square kilometers
of the valley floor.. The slide dammed the
Crowsnest River and formed a small lake,
covered 2km of the Canadian Pacific Railway,
destroyed most of the coal mine's surface
infrastructure, and buried seven houses on the
outskirts of the sleeping town of Frank, as well
as several rural buildings. It is estimated that
90 of the roughly 100 individuals in the path of
the slide were killed.
July 10, 1949 Khait landslide in
the Soviet Union.
The landslide was triggered by the 1949 Khait
earthquake and buried 33 villages and by some
estimates killed 28,000 people.
October 9, 1963
Italy 260 million cubic meters of rock slid down the
side of Mount Toc caused by a minor earth
tremor and plunged into the reservoir created
by the Vajont Dam at an estimated 100 mph,
creating a seiche 250 meters high, that came
over the dam wall and destroyed the town of
11
Longarone and its suburbs, killing almost
2,000 people.
January 9, 1965 British Columbia The volume of rock involved in the landslide
has been estimated at 47 million cubic meters
and four people were killed.
1966 Welsh village in
Aberfan
The Aberfan disaster was a catastrophic
collapse of a colliery spoil-tip that occurred in
the Welsh village of Aberfan, killing 116
children and 28 adults.
November 30,
1977.
Tuve, Gothenburg
in Sweden
Some 67 houses were destroyed, killing 9,
injuring about 60 and making around 600
people homeless.
August 8, 1979.
Dunedin, New
Zealand
It was the largest landslide in a built-up area in
New Zealand's history, resulting in the
destruction of 69 houses - around one sixth of
the suburb - but no fatalities.
July 28, 1987 Italy The flow entrained estimated 5-8 million cubic
meters of debris. The created alluvial fan
dammed the Adda River and created a lake.
The mass run about 1.5 km downstream and
generated an upstream mud wave 35m high
which travelled about 2.7 km. The landslide
resulted in a 35 m deepening of the Val Pola
canyon. Villages were evacuated before.
30 July 1997 Australia. Two ski lodges collapsed, and a total of 18
died.
December, 1999 Vargas state in
Venezuela
Torrential rains, flash floods and debris flows
killed tens of thousands of people and
destroyed thousands of homes.
June 11, 2007 Chittagong,
Bangladesh
Heavy monsoon rainfall caused landslides that
engulfed slums around the hilly areas of the
city. The death toll was reported to be at least
128, including at least 59 children, with more
than 150 injured.
September 6,
2008
Cairo, Egypt Informal settlement in the Manshiyet Nasser
neighborhood of east Cairo, Egypt. 119 people
died in the rockslide.
1st March 2010 Bududa District in
Uganda
About 365 people killed, three villages
completely destroyed and 8,000 people
resettled.
August 8, 2010 Gansu, China The mudslides killed more than 1,471 people,
while 1,243 others have been rescued and 294
remain missing.
Source: http://en.wikipedia.org/wiki/Landslide
12
Table 2: Studies that have been done on landslides in the East African region
COUNTRY REGION AUTHOR
Uganda Mount Elgon Inganga et .al, 2001
Muwanga et .al, 2001
Kitutu , 2004
Erima, 2004
Wendy, 2003
Knapen et .al, 2006
Claessens et.al, 2007
Kitutu et. al, 2009
Kitutu et. al, 2010
Mount Rwenzori Rapp et .al, 1972
Ucakuwun, 1999
Muwanga et .al, 2001
South West Uganda Inganga et. al , 2001
Bagoora, 1988
Tanzania Western Uluguru Rapp et.al, 1972
Westerberg and Christiansson
,1998
Westerberg ,1999
Christiansson and Westerberg,
1999
Rungwa Rapp et.al, 1972
Rwanda Butare, Gikongoro, Kibuye district
Moeyersons, 1988
Moeyersons, 1989a
Moeyersons, 2003
Rwaza hill Moeyersons, 1989b
Ethiopia Northern Ethiopian
Highlands Nyssen et.al., 2003
Ethiopian Highlands Ayalew 1999
Temegen et.al , 2001
13
Kenya Aberdare Range Davies, 1996
Ngecu and Ichangi, 1998
Westerberg and Christiansson, 1998
Ngecu and Mathu 1999
Westerberg, 1999
Ucakuwun, 1999
Inganga et .al, 2001
Mau Hills Ngecu and Mathu, 1999
Mount Kenya Ngecu and Mathu, 1999
Chyulu range Ngecu and Mathu, 1999
Source: Compiled from Literature.
2.2 POPULATION DYNAMICS ON MOUNT ELGON
The East African highlands are heavily populated because of their medium to high
agricultural potential and their suitability for human habitation (Michael et.al, 2003). Mount
Elgon, locally known as Masaba after the legendary father of the Bagisu, has a long history
of human occupation. The first settlers on the southern and southwestern slopes were the
Bagisu who came from the Kenyan side at around the 14th century and presently they live in
Bududa, Mbale, Sironko and Manafwa Districts in eastern Uganda. A Nilo-Cushtic tribe, the
Sebei, settled on the northern slopes of the Ugandan side of the mountain. Originally these
pastoralists lived in the forest zone between 2500 and 3000m where they grazed their cattle,
goats and sheep. In 1983 and 1990 two resettlement programmes allocated these people
outside the park, where they now adopt commercial maize and wheat cultivation. All these
people have strong bounds with the mountain and its resources such as medicinal plants,
vegetables, honey, bamboo and water (http://www.visituganda.com).
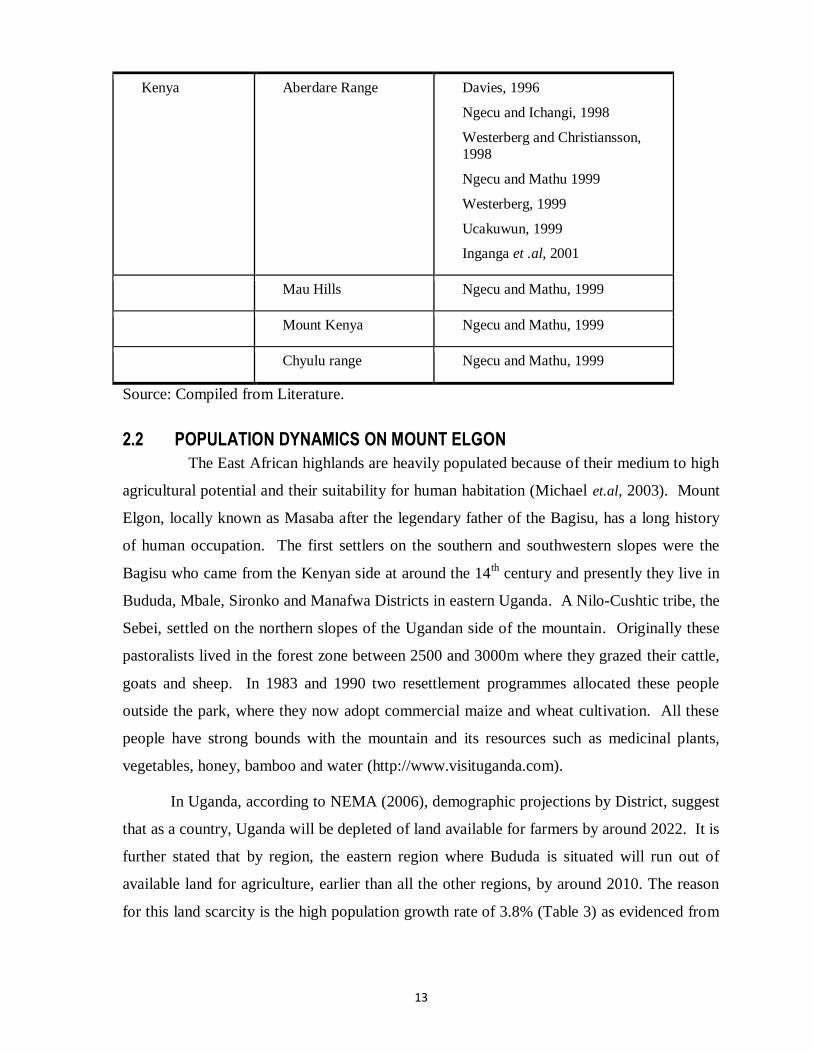
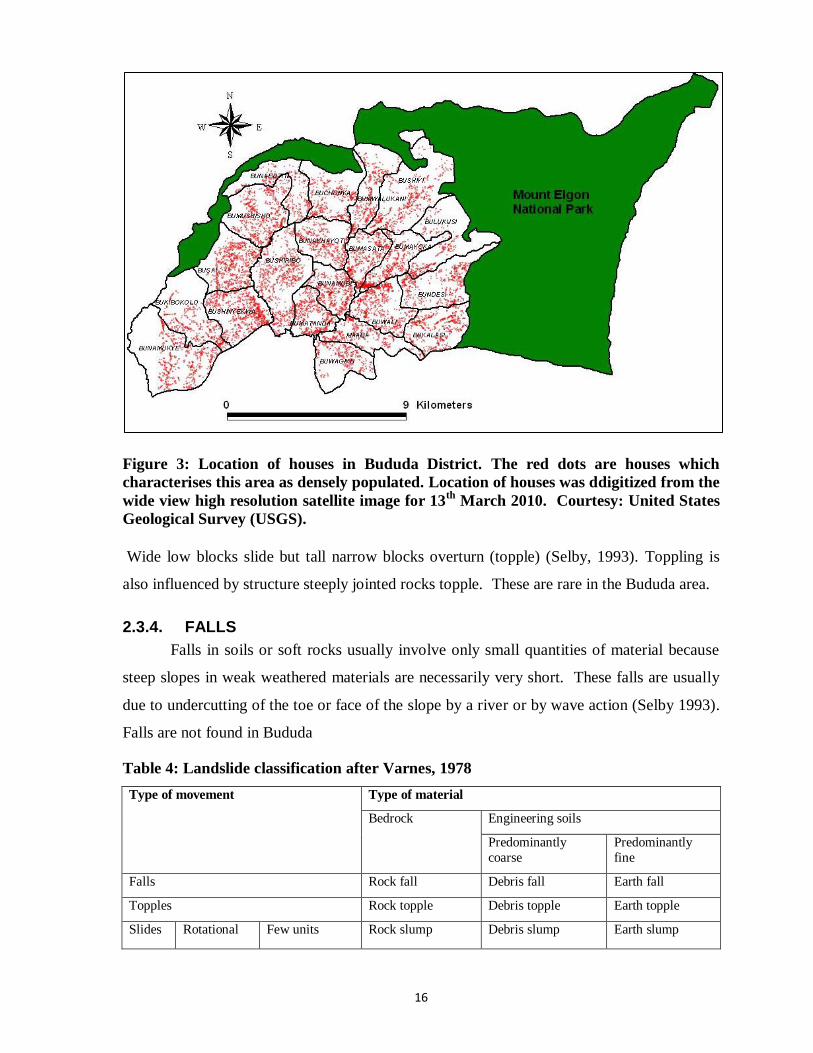
In Uganda, according to NEMA (2006), demographic projections by District, suggest
that as a country, Uganda will be depleted of land available for farmers by around 2022. It is
further stated that by region, the eastern region where Bududa is situated will run out of
available land for agriculture, earlier than all the other regions, by around 2010. The reason
for this land scarcity is the high population growth rate of 3.8% (Table 3) as evidenced from
14
the high number of houses (Figure 3) which forces people to inhabit areas prone to landslide
hazards.
2.3 CLASSIFICATION OF LANDSLIDES
Many definitions have been applied to the term landslide and they all vary depending
on the objective of the author. Cruden, (1991), defined a landslide as a movement of a rock,
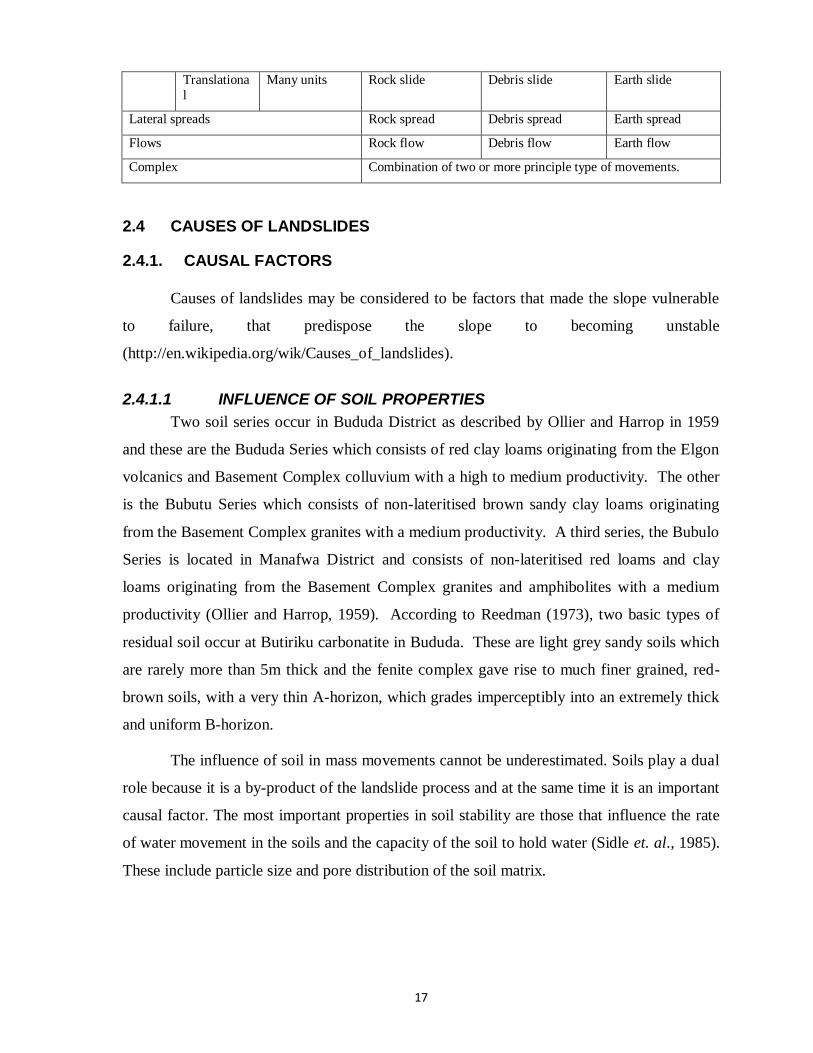
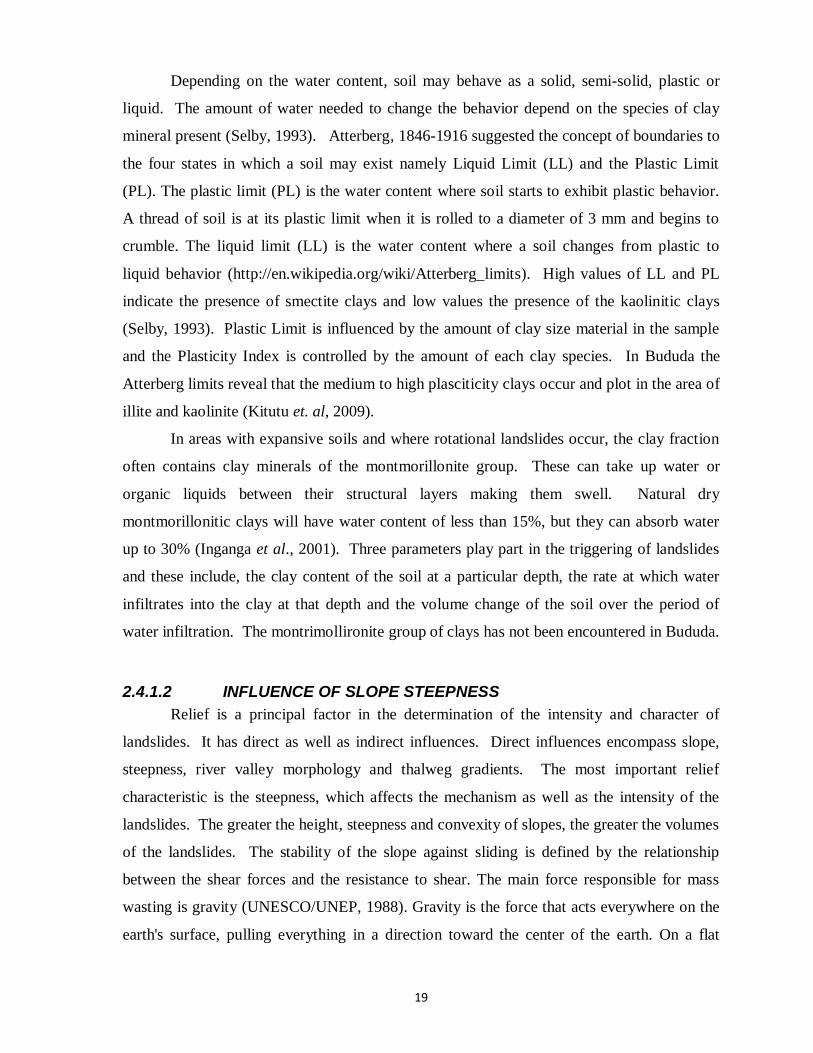
earth or debris down a slope. The most accepted classification is that proposed by Varnes,
(1978). He distinguishes five types of movements namely falls, topples, slides, flows and
spreads and also subdivides the type of material into bedrock, debris and earth. This is
illustrated in Table 4 and Figure 4. These materials may move by falling, toppling,
slumping, sliding, spreading or flowing. The various types of landslides can be
differentiated by the kinds of material involved and the mode of movement.
2.3.1 SLUMPS
A slump is the form of slide most common in thick, homogenous, cohesive materials
such as clay (Selby, 1993). The surface of failure beneath a slump block is spoon-shaped,
concave upward or outward. Slumps may be caused by currents in water undercutting the
foot of a slope. They are also common if faulty engineering design of cut embankments.
Slumps have curved failure planes and involve rotational movement. In Bududa the
dominant type movement is rotational which mostly occurs on concave slopes and at a large
distance from the water divide where runoff and subsurface water concentrates (Knapen et.
al, 2006).
2.3.2 SLIDES
Mass wasting where a mass of rock or weathered debris moves downhill along
discrete shear surfaces is defined as a slide (Selby 1993). Subcategories of slide in various
classifications include rock slide, block glide, mudslide, and debris slide. Rock slides or
block glides are slides where material remains largely unreformed as it moves over a planar
slide plane. These have no specified size, but thickness is normally only about 10% of their
down slope length. Translational slides occur in Bududa at a shorter distance from the water
divide because they require a less increase in pore water pressure to occur. Furthermore, they
occur on rectilinear slopes with shallow soils (Knapen et. al, 2006).
15
Table 3: Census population ( 1991 and 2002) for eastern region and district projected
(2010 and 2011) mid-year population
District Census Population
Growth
Rate 2002
%
Mid-Year Projected
population
1991 2002 2010 2011 Amuria 69,353 180,022 8.2 344,200 374,000
Budaka 100,348 136,489 2.6 169,300 174,000
Bududa 79,218 123,103 3.8 167,000 173,700
Bugiri 239,307 412,395 4.7 599,000 628,500
Bukedea 75,272 122,433 4.2 171,100 178,600
Bukwa 30,692 48,952 4 67,500 70,400
Busia 163,597 225,008 2.7 281,200 289,300
Butaleja 106,678 157,489 3.3 206,300 213,600
Iganga 365,756 540,999 3.4 709,600 734,900
Jinja 289,476 387,573 2.5 475,700 488,400
Kaberamaido 81,535 131,650 4.1 183,100 191,000
Kaliro 105,122 154,667 3.3 202,200 209,300
Kamuli 380,092 552,665 3.2 716,700 741,100
Kapchorwa 86,010 141,439 4.3 199,200 208,100
Katakwi 75,244 118,928 3.9 163,100 169,800
Kumi 161,422 267,232 4.3 377,900 395,100
Manafwa 178,528 262,566 3.3 343.2 355.2
Mayuge 216,849 324,674 3.5 429,400 445,100
Mbale 240,929 332,571 2.8 416,600 428,800
Namutumba 123,871 167,691 2.6 207,300 213,100
Pallisa 257,308 384,089 3.4 506,900 525,300
Sironko 212,305 283,092 2.5 346,600 355,800
Soroti 204,258 369,789 5.1 555,100 584,900
Tororo 285,299 379,399 2.4 463,600 475,700
Sub Total 4,128,469 6,204,915 3.5 8,301,800 8,623,700
Source: Uganda Bureau of Statistics, 2010.
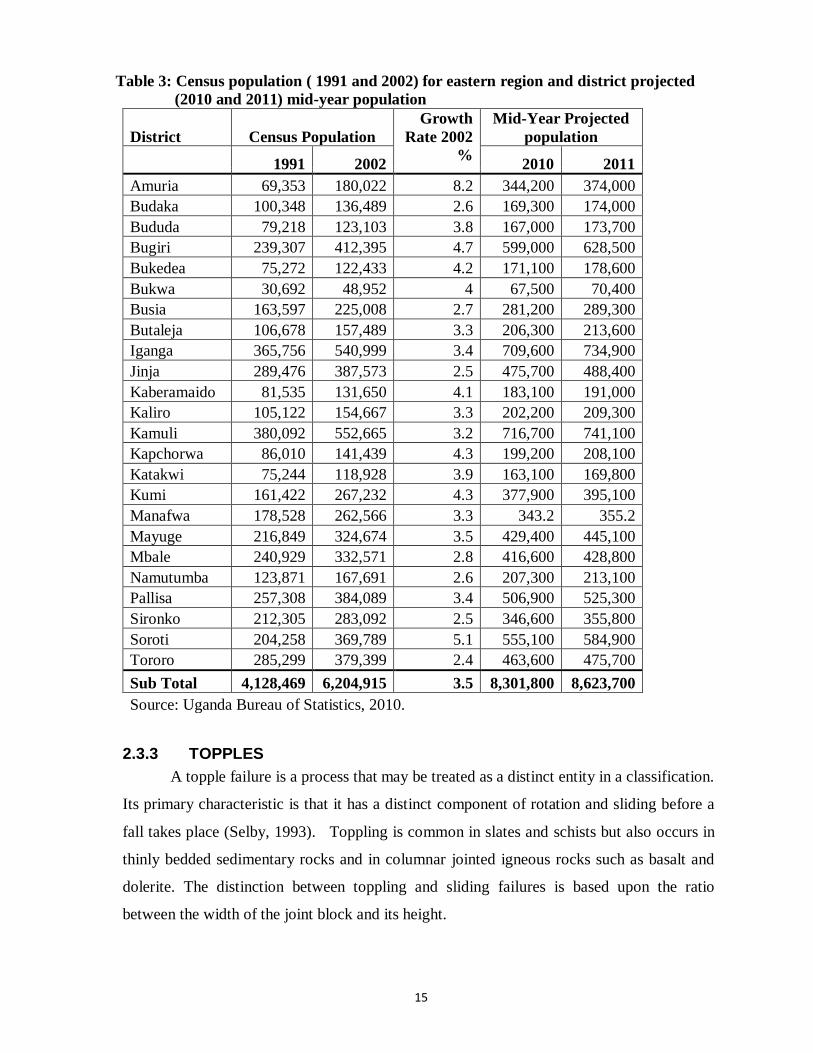
2.3.3 TOPPLES
A topple failure is a process that may be treated as a distinct entity in a classification.
Its primary characteristic is that it has a distinct component of rotation and sliding before a
fall takes place (Selby, 1993). Toppling is common in slates and schists but also occurs in
thinly bedded sedimentary rocks and in columnar jointed igneous rocks such as basalt and
dolerite. The distinction between toppling and sliding failures is based upon the ratio
between the width of the joint block and its height.
16
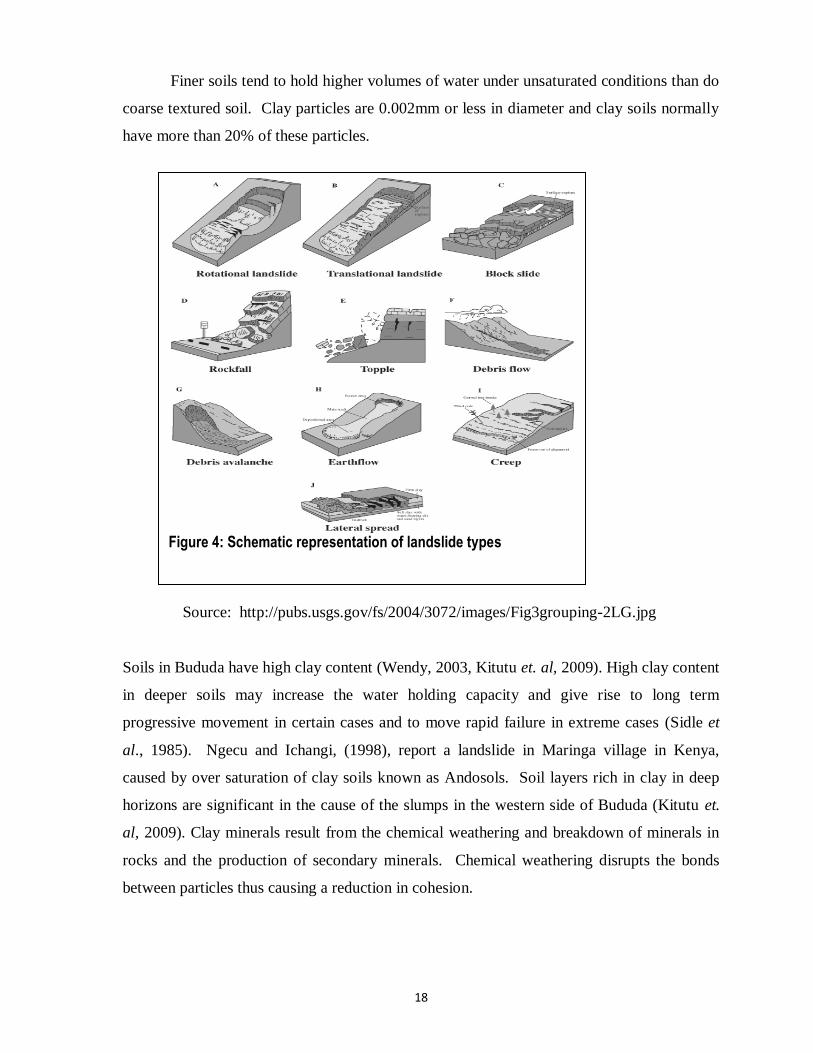
Figure 3: Location of houses in Bududa District. The red dots are houses which
characterises this area as densely populated. Location of houses was ddigitized from the
wide view high resolution satellite image for 13th
March 2010. Courtesy: United States
Geological Survey (USGS).
Wide low blocks slide but tall narrow blocks overturn (topple) (Selby, 1993). Toppling is
also influenced by structure steeply jointed rocks topple. These are rare in the Bududa area.
2.3.4. FALLS
Falls in soils or soft rocks usually involve only small quantities of material because
steep slopes in weak weathered materials are necessarily very short. These falls are usually
due to undercutting of the toe or face of the slope by a river or by wave action (Selby 1993).
Falls are not found in Bududa
Table 4: Landslide classification after Varnes, 1978
Type of movement Type of material
Bedrock Engineering soils
Predominantly
coarse
Predominantly
fine
Falls Rock fall Debris fall Earth fall
Topples Rock topple Debris topple Earth topple
Slides Rotational Few units Rock slump Debris slump Earth slump
17
Translationa
l
Many units Rock slide Debris slide Earth slide
Lateral spreads Rock spread Debris spread Earth spread
Flows Rock flow Debris flow Earth flow
Complex Combination of two or more principle type of movements.
2.4 CAUSES OF LANDSLIDES
2.4.1. CAUSAL FACTORS
Causes of landslides may be considered to be factors that made the slope vulnerable
to failure, that predispose the slope to becoming unstable
(http://en.wikipedia.org/wik/Causes_of_landslides).
2.4.1.1 INFLUENCE OF SOIL PROPERTIES
Two soil series occur in Bududa District as described by Ollier and Harrop in 1959
and these are the Bududa Series which consists of red clay loams originating from the Elgon
volcanics and Basement Complex colluvium with a high to medium productivity. The other
is the Bubutu Series which consists of non-lateritised brown sandy clay loams originating
from the Basement Complex granites with a medium productivity. A third series, the Bubulo
Series is located in Manafwa District and consists of non-lateritised red loams and clay
loams originating from the Basement Complex granites and amphibolites with a medium
productivity (Ollier and Harrop, 1959). According to Reedman (1973), two basic types of
residual soil occur at Butiriku carbonatite in Bududa. These are light grey sandy soils which
are rarely more than 5m thick and the fenite complex gave rise to much finer grained, red-
brown soils, with a very thin A-horizon, which grades imperceptibly into an extremely thick
and uniform B-horizon.
The influence of soil in mass movements cannot be underestimated. Soils play a dual
role because it is a by-product of the landslide process and at the same time it is an important
causal factor. The most important properties in soil stability are those that influence the rate
of water movement in the soils and the capacity of the soil to hold water (Sidle et. al., 1985).
These include particle size and pore distribution of the soil matrix.
18
Finer soils tend to hold higher volumes of water under unsaturated conditions than do
coarse textured soil. Clay particles are 0.002mm or less in diameter and clay soils normally
have more than 20% of these particles.
Source: http://pubs.usgs.gov/fs/2004/3072/images/Fig3grouping-2LG.jpg
Soils in Bududa have high clay content (Wendy, 2003, Kitutu et. al, 2009). High clay content
in deeper soils may increase the water holding capacity and give rise to long term
progressive movement in certain cases and to move rapid failure in extreme cases (Sidle et
al., 1985). Ngecu and Ichangi, (1998), report a landslide in Maringa village in Kenya,
caused by over saturation of clay soils known as Andosols. Soil layers rich in clay in deep
horizons are significant in the cause of the slumps in the western side of Bududa (Kitutu et.
al, 2009). Clay minerals result from the chemical weathering and breakdown of minerals in
rocks and the production of secondary minerals. Chemical weathering disrupts the bonds
between particles thus causing a reduction in cohesion.
Figure 4: Schematic representation of landslide types
19
Depending on the water content, soil may behave as a solid, semi-solid, plastic or
liquid. The amount of water needed to change the behavior depend on the species of clay
mineral present (Selby, 1993). Atterberg, 1846-1916 suggested the concept of boundaries to
the four states in which a soil may exist namely Liquid Limit (LL) and the Plastic Limit
(PL). The plastic limit (PL) is the water content where soil starts to exhibit plastic behavior.
A thread of soil is at its plastic limit when it is rolled to a diameter of 3 mm and begins to
crumble. The liquid limit (LL) is the water content where a soil changes from plastic to
liquid behavior (http://en.wikipedia.org/wiki/Atterberg_limits). High values of LL and PL
indicate the presence of smectite clays and low values the presence of the kaolinitic clays
(Selby, 1993). Plastic Limit is influenced by the amount of clay size material in the sample
and the Plasticity Index is controlled by the amount of each clay species. In Bududa the
Atterberg limits reveal that the medium to high plasciticity clays occur and plot in the area of
illite and kaolinite (Kitutu et. al, 2009).
In areas with expansive soils and where rotational landslides occur, the clay fraction
often contains clay minerals of the montmorillonite group. These can take up water or
organic liquids between their structural layers making them swell. Natural dry
montmorillonitic clays will have water content of less than 15%, but they can absorb water
up to 30% (Inganga et al., 2001). Three parameters play part in the triggering of landslides
and these include, the clay content of the soil at a particular depth, the rate at which water
infiltrates into the clay at that depth and the volume change of the soil over the period of
water infiltration. The montrimollironite group of clays has not been encountered in Bududa.
2.4.1.2 INFLUENCE OF SLOPE STEEPNESS
Relief is a principal factor in the determination of the intensity and character of
landslides. It has direct as well as indirect influences. Direct influences encompass slope,
steepness, river valley morphology and thalweg gradients. The most important relief
characteristic is the steepness, which affects the mechanism as well as the intensity of the
landslides. The greater the height, steepness and convexity of slopes, the greater the volumes
of the landslides. The stability of the slope against sliding is defined by the relationship
between the shear forces and the resistance to shear. The main force responsible for mass
wasting is gravity (UNESCO/UNEP, 1988). Gravity is the force that acts everywhere on the
earth's surface, pulling everything in a direction toward the center of the earth. On a flat
20
surface the force of gravity acts downward and so long as the material remains on the flat
surface it will not move under the force of gravity. On a slope, the force of gravity can be
resolved into two components, one acting perpendicular to the slope and another acting
tangential to the slope.
The perpendicular component of gravity helps to hold the object in place on the
slope. The tangential component of gravity causes a shear stress parallel to the slope that
pulls the object in the down-slope direction parallel to the slope. On a steeper slope, the shear
stress or tangential component of gravity increases and the perpendicular component of
gravity decreases. The forces resisting movement down the slope are grouped under the term
shear strength which includes frictional resistance and cohesion among the particles that
make up the object. When the shear stress becomes greater than the shear strength then the
slope fails.
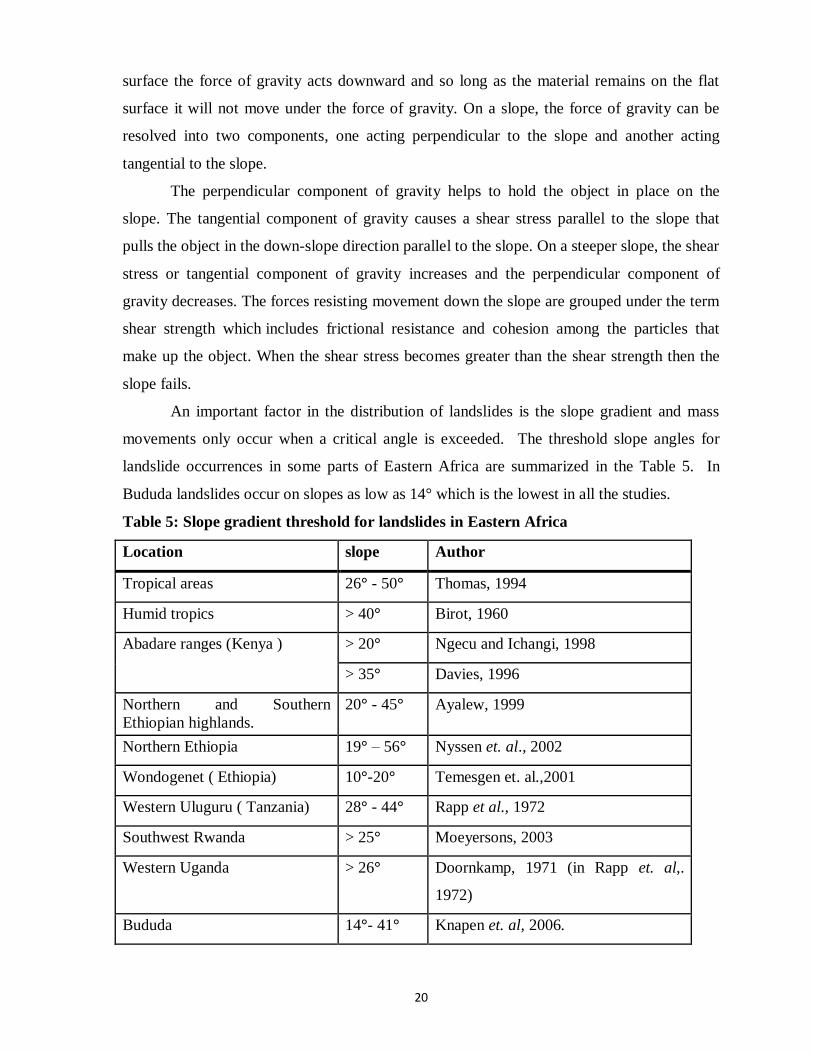
An important factor in the distribution of landslides is the slope gradient and mass
movements only occur when a critical angle is exceeded. The threshold slope angles for
landslide occurrences in some parts of Eastern Africa are summarized in the Table 5. In
Bududa landslides occur on slopes as low as 14° which is the lowest in all the studies.
Table 5: Slope gradient threshold for landslides in Eastern Africa
Location slope Author
Tropical areas 26° - 50° Thomas, 1994
Humid tropics > 40° Birot, 1960
Abadare ranges (Kenya ) > 20° Ngecu and Ichangi, 1998
> 35° Davies, 1996
Northern and Southern
Ethiopian highlands.
20° - 45° Ayalew, 1999
Northern Ethiopia 19° – 56° Nyssen et. al., 2002
Wondogenet ( Ethiopia) 10°-20° Temesgen et. al.,2001
Western Uluguru ( Tanzania) 28° - 44° Rapp et al., 1972
Southwest Rwanda > 25° Moeyersons, 2003
Western Uganda > 26° Doornkamp, 1971 (in Rapp et. al,.
1972)
Bududa 14°- 41° Knapen et. al, 2006.
21
Source: Knapen et. al, 2006.
Slope failure is more common in concave landscape parts due to the long-term
accumulation of sediment transported from adjacent slopes resulting in thicker soils and the
convergence of subsurface flow leading to higher pore pressures (Gabet and Duune, 2002).
This phenomenon was similarly observed in most of the slumps in Bududa (Knapen et. al,
2006).
In the tropics, the slope aspect does not cause large differences in soil temperature
because of the low latitude. But it is most relevant in relation to prevailing winds and the
resulting rainfall and soil moisture conditions (Larsen and Torres-Sanchez, 1998). In Bududa
landslides were common on slopes oriented in the east and north direction which coincides
with the dominant direction in which rain falls (Knapen et. al, 2006).
2.4.1.3 INFLUENCE OF UNDERCUTTING OF SLOPES
Rockslides resulting from human activities such as undercutting by roads or railroad
excavations are more widespread than rockslides resulting from natural causes (Scharpe,
1938). Human activities such as construction of roads, building developments, mines and
quarries, dams and reservoirs, canals, increase of groundwater levels, changes in vegetative
cover, tunnels and communication systems have a great impact on the stability of the area
and are seen as the major factors causing slope failures in the twentieth century
(UNESCO/UNEP, 1988). These human modifications fundamentally alter hill slope stability
(Larsen and Torres-Sanchez, 1998). Slope undercutting due to house construction and also
foot paths cause concentrated flows which trigger landslides mostly in the western part of
Bududa (Knapen et. al, 2006).
2.4.1.4 INFLUENCE OF THE GEOLOGICAL FACTORS
It is believed that Mount Elgon may have been higher than Mount Kilimanjaro but
the summit of Elgon collapsed into the chamber from which volcanic material had been
expelled resulting in a caldera of 8 Km in diameter. It differs from the other Rift Valley
volcanoes by its age, which is estimated to be at least 24 million years (Davies 1956). In
Bududa District three main lithologies can be distinguished and these are the Butiriku
carbonatite covering the central part which corresponds with the sub county of Bukigai, a
zone of fenitised basement rocks of Precambrian age surrounding this central carbonatite
outcrop and the third zone with Mount Elgon agglomerates and tuffs situated in the north
22
east of Bududa District and falling within the borders of Mount Elgon National Park. These
highly weathered rocks are composed of extremely fine pyroclasts of potash feldspar and are
referred to as potash ultra-fenites (Reedman, 1973).
There are many associations of mass movements with certain rock types (Sidle et al.,
1985, UNESCO/UNEP, 1988). Hard intact rocks have strengths controlled by their internal
cohesive and frictional properties. Existence of areas of weakness such as faults and joints
may lead to rock failures and these are more common in granites and sandstone (Selby
1993). Fault zones often contain fractured and crushed rocks. The inherent weakness of
these zones increases the deep percolation of water into bedrock and subsequent weathering
of crushed rocks into clay rich soil susceptible to failures. This phenomenon was observed
at the Bugobero rockslide where joints in a dyke act as water infiltration points causing water
to accumulation at the discontinuity between the main rock and the dyke. The water acting
as lubricant then triggered a huge rockslide (Kitutu, 2010, unpublished). This weakness can
be enlarged by deep percolating water into the bedrock and subsequent chemical weathering
of the rocks. The existence of a relatively impermeable layer in the bedrock promotes the
formation of a perched water table during storms or heavy rainfall, increasing the risk for
slope failures (Sidle et al., 1985). The susceptibility of the whole mass to sliding is
determined by the weakest link, for example a layer of clayey in between massive rocks
(UNESCO/UNEP, 1988). Down slope dipping planes separating rocks of different
competence, as well as planar discontinuities orientated parallel to the slope, may impede
vertical drainage and root penetration. In addition they can act as a potential failure plane.
Beddings with a horizontal or cross-dipping orientation may act as natural buttresses
increasing the stability of slopes (Sidle et al., 1985). In some areas of Bududa, especially the
eastern zone the parent rock is nearer to the surface and the porous saprolite forms an abrupt
discontinuity with the coherent basement complex granite. In here the conditioning factors
are soil horizon differ-rentiation and the saprolite forming a discontinuity with the parent
rockgranite. During rains, drainage of water through the soil profile is stopped at the point of
discontinuity thereby causing water to accumulate. These phenomena results in a semi-solid
sub soil material that will easily flow or slump under pressure from the top soil (Kitutu et. al,
2009).
Seismicity has caused slope failures in areas such as Alaska 1964 (McSaveney 1978).
Although mass movements due to seismic activity have been very common, little attention
23
has been paid to documenting the intensity and geomorphic, ecological and socio-economic
significance of such events (Sidle et al., 1985). Even though situated in the East African Rift
zone, the Elgon region rarely experiences earthquakes (Hollnack, 2001). Therefore,
seismicity cannot be considered to be a main triggering factor in Bududa, contrasting with
some regions in southwestern Uganda and Kenya (Inganga et al., 2001) where earthquakes
were responsible for a few landslides ( Knapen et. a,l 2006).
2.4.2 TRIGGERING FACTORS
A triggering factor is an external stimulus that triggers the movement and one of the
renowned triggering factor is rainfall. Rainfall is an important factor in triggering landslides.
Precipitation conditions determine infiltration and run-off. Prolonged rains with a lower
intensity result in a higher and deeper infiltration and lower run-off in sloping areas. On the
other hand, in these regions, torrential rains increase run-off and result in a lower amount of
infiltration. Nevertheless they promote the wetting of soil along fissures which serve as
natural rainwater collectors (UNESCO/UNEP, 1988; Smedema et al., 1983). The amount of
rainfall has a considerable influence on the moisture content and the pore pressure in the
soils (Ayalew, 1999). A higher moisture content can increase the specific mass of rocks by
20 to 30% and at the same time lower their shear resistance by 50% and even more, due to
increased pore-water pressure (UNESCO/UNEP, 1988). This greatly reduces shear strength
and hence slope failure.
2.4.2.1 INFLUENCE OF RAINFALL
The climate of Mount Elgon varies a lot from its surroundings in view of
geomorphologic settings. The climate is determined by the alternating moist south-westerly
and dry north-easterly airstreams. The mountain area experiences a bimodal rainfall pattern
(Figure 5). The wettest period of the year is from March till October, while the dry season
occurs from November till February with a short dry period around July. Rainfall is higher
at the southern and western slopes (1500-2000 mm/yr) than at the eastern and northern
slopes (1000-1500 mm/yr). Information from old rainfall data reveals that Bududa receives
an average rainfall of 1588 mm while Bulucheke receives 1615 mm which indicates local
variations. In the year 2001 six rain gauges were installed in various schools throughout the
district with the aim of collecting rainfall at various locations in Bududa. However, four of
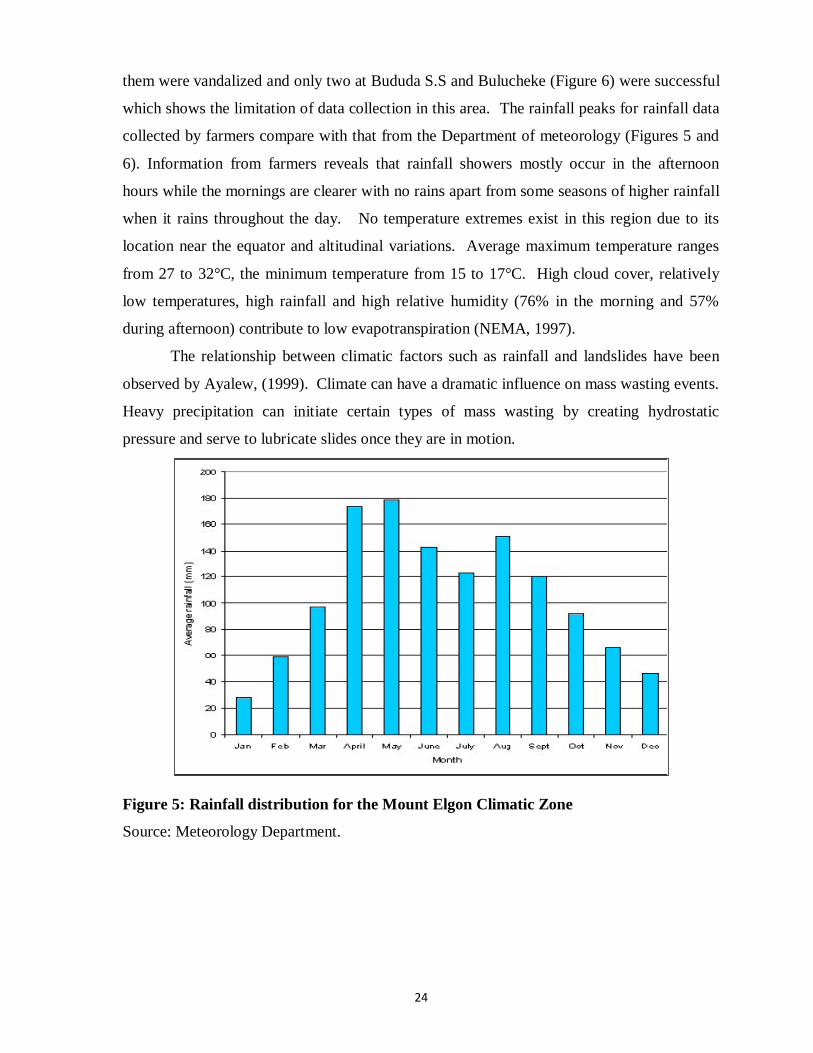
24
them were vandalized and only two at Bududa S.S and Bulucheke (Figure 6) were successful
which shows the limitation of data collection in this area. The rainfall peaks for rainfall data
collected by farmers compare with that from the Department of meteorology (Figures 5 and
6). Information from farmers reveals that rainfall showers mostly occur in the afternoon
hours while the mornings are clearer with no rains apart from some seasons of higher rainfall
when it rains throughout the day. No temperature extremes exist in this region due to its
location near the equator and altitudinal variations. Average maximum temperature ranges
from 27 to 32°C, the minimum temperature from 15 to 17°C. High cloud cover, relatively
low temperatures, high rainfall and high relative humidity (76% in the morning and 57%
during afternoon) contribute to low evapotranspiration (NEMA, 1997).
The relationship between climatic factors such as rainfall and landslides have been
observed by Ayalew, (1999). Climate can have a dramatic influence on mass wasting events.
Heavy precipitation can initiate certain types of mass wasting by creating hydrostatic
pressure and serve to lubricate slides once they are in motion.
Figure 5: Rainfall distribution for the Mount Elgon Climatic Zone
Source: Meteorology Department.
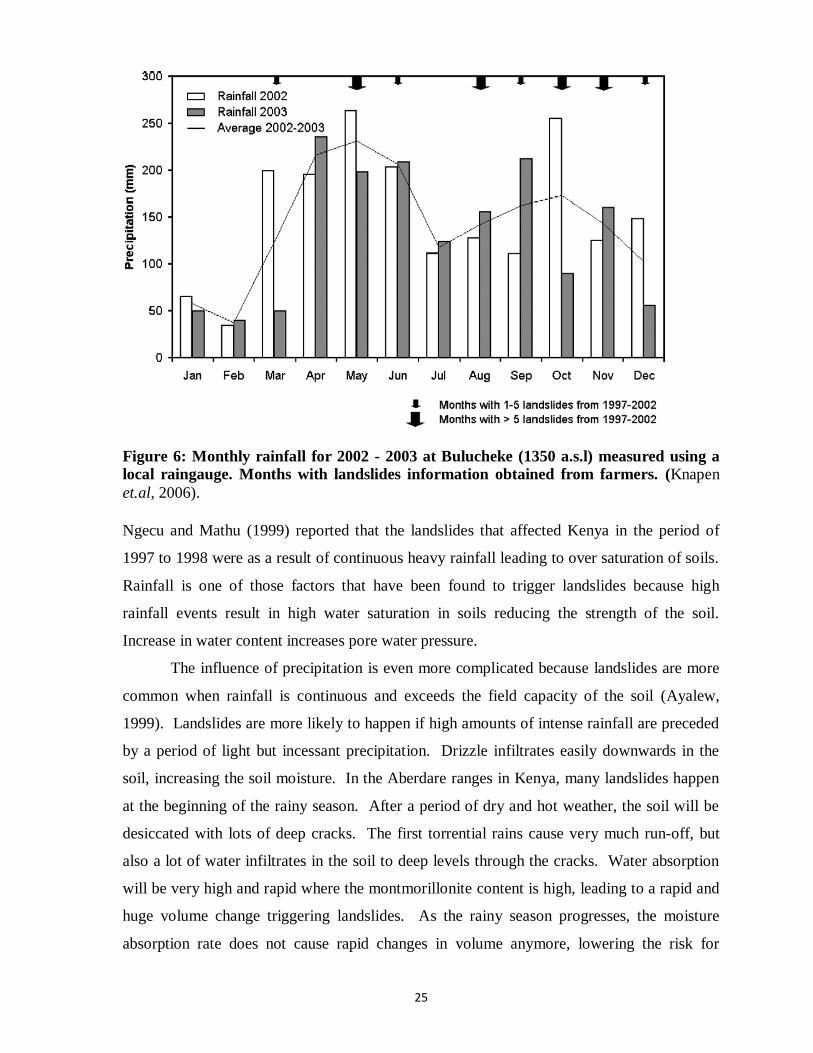
25
Figure 6: Monthly rainfall for 2002 - 2003 at Bulucheke (1350 a.s.l) measured using a
local raingauge. Months with landslides information obtained from farmers. (Knapen
et.al, 2006).
Ngecu and Mathu (1999) reported that the landslides that affected Kenya in the period of
1997 to 1998 were as a result of continuous heavy rainfall leading to over saturation of soils.
Rainfall is one of those factors that have been found to trigger landslides because high
rainfall events result in high water saturation in soils reducing the strength of the soil.
Increase in water content increases pore water pressure.
The influence of precipitation is even more complicated because landslides are more
common when rainfall is continuous and exceeds the field capacity of the soil (Ayalew,
1999). Landslides are more likely to happen if high amounts of intense rainfall are preceded
by a period of light but incessant precipitation. Drizzle infiltrates easily downwards in the
soil, increasing the soil moisture. In the Aberdare ranges in Kenya, many landslides happen
at the beginning of the rainy season. After a period of dry and hot weather, the soil will be
desiccated with lots of deep cracks. The first torrential rains cause very much run-off, but
also a lot of water infiltrates in the soil to deep levels through the cracks. Water absorption
will be very high and rapid where the montmorillonite content is high, leading to a rapid and
huge volume change triggering landslides. As the rainy season progresses, the moisture
absorption rate does not cause rapid changes in volume anymore, lowering the risk for
26
landslides (Inganga et al., 2001). During intermittent rainfall, soils lose their moisture and
regain their strength within a few days. Saturation of the soils needs a much longer period,
explaining the higher number of landslides in the Ethiopian highlands during September than
in July. The higher precipitation amount during July is absorbed by the dry soil. Towards
September these soils become saturated resulting in a higher possibility of slope failures
(Ayalew, 1999). A distinct rainfall threshold for the initiation of landslides is difficult to
assess for Bududa District because of the range of landslide types and dimensions, the
heterogeneity of the study area and the lack of known landslide dates and rainfall data
(Knapen et. al, 2006). Landslide events most frequently take place in years with
exceptionally high rainfall, such as 1998, especially at the end of the rainy season when the
soil saturation is maximized. Based on the few landslides for which the date of occurrence
could be traced (Figure 6), it is difficult to demonstrate this (Knapen et. al, 2006).
2.5 INDIGENOUS KNOWLEDGE AND FARMERS PERCEPTION ON LANDSLIDE OCCURRENCES
Use of indigenous Knowledge captured through farmer participatory methods could
be of use if found to be in line with the scientific explanations. Farmer participatory methods
have been used in natural resource management in Uganda (Nicoliene and Adrienne, 2003).
According to Nathalie, 2003, through experiences often going back for generations, farmers
have developed local systems for appraising land resources, which are surprisingly accurate.
In many ways their knowledge is obtained by approaches that are similar to those of
scientists‟ observation and experimentation. Several participatory approaches have been
developed to involve farmers in an interdisciplinary approach to agricultural research
(Nicoliene and Adrienne, 2003). These give greater attention to actual farming practices,
farmers‟ needs and knowledge. However, despite recognition in principle that local
knowledge is a valuable source, its contribution is often limited due to a general lack of
understanding of what local knowledge actually is and how it can be explored.
There is a growing interest in involving the local population in technology
development. Farmers‟ participation has been used to identify improved rice varieties in
South- East Tanzania (Kafiriti et.al 2003). Using a participatory method on farmers, plots
they were able to identify rice varieties and also show that soil bunds can appreciably
increase the production of rain-fed lowland rice.
27
Similarly these approaches can be used to involve farmers in landslide hazard
assessment and management. Farmers‟ observations on land characteristics, climate patterns
and landslide occurrence can lead to cheaper evaluation techniques especially in situations of
limited financial support. According to Kirsten et al., 1990, there was close connection
between farmers‟ assessment of landslide hazard and their landuse decisions in Kathmandu
valley in Nepal. The farmers in Kathmandu chose not to make terraces on steep slopes
because they promote landslides. Farmers are often good observers and integration of their
knowledge in land management may be essential in sustainable development. However
some authors have questioned the comparison of local knowledge with scientific knowledge.
Considerable debate has been ongoing about the most appropriate terminology for local
knowledge systems, whether they should be labeled as local, indigenous, folk or traditional.
Societies and people are not isolated from each other; changes in knowledge are generated
by interactions between and within societies and people‟s adaptations to changes in their
environment (Nicoliene and Adrienne, 2003). In Bududa farmers were able to identify areas
vulnerable to landslides and also the factors that influence the landslide occurrences. In
addition the farmers in Bududa especially in the eastern zone do not encourage making of
terraces on steep slopes because they act as water concentration points and trigger landslides
(Kitutu et. al, 2010). However, there is a limitation in their observation especially
determining the threshold on slope and rainfall that causes landslides (Kitutu et. al, 2010).
This then calls for an integrated approach to combine both knowledge.
References
Ayalew, L., 1999. The effect of seasonal rainfall on landslides in the highlands of Ethiopia.
Bull. Eng. Geol. Env. 58: p. 9-19.
Atterberg, A.M., 1846-1916. Geotechnique, 3(1), pp. 17-19.
Bagoora, F.D.K., 1988. Soil erosion and mass wasting risk in the highland area of Uganda,
Mountain Research and Development, Volume 8, N0s. 2/3, pp 173-182.
Birot, P., 1960. Le Cycle d‟Erosion sous les Differents Climats.Batsford, London.
Christiansson, C and Westerberg, L.O., 1999. Highlands in East Africa. Unstable slopes,
unstable environments. Ambio, 18: 419-429.
28
Claessens, L., Knapen, A., Kitutu, M.G., Poesen , J and Seppe, D., 2007. Modeling landslide
hazard, soil redistribution and sediment yield of landslides on the Ugandan footslopes
of Mount Elgon, Geomorphology 90 (2007) 23–35.
Cruden, D. 1991. A simple definition of a landslide. Bulletin IAEG. 43: 27-29.
Davies, K.A., 1956. The building of Mount Elgon (East Africa). The geological Survey of Uganda,
68 pp.
Davies, T.C., 1996. Landslide Research in Kenya. Journal of African Earth Sciences, 23 (4):
541-549.
Erima, G, 2004. An Engineering geological evaluation of landslides and their socio-
economic impact in Bubita sub-county, mbale district, eastern Uganda, Master of
Science Thesis (Unpublished), Makerere University, Department of Geology.
Gabet, E.J and Dunne, T., 2002. Landslides on coastal sage-scrub and grassland hillslopes in
a severe El Niño winter: The effects of vegetation conversion on sediment delivery.
Geological Society of America Bulletin 114, no.8, p.983-990.
Hollnack, D., 2001. Some aspects on the seismic risk in East Africa. Documenta Naturae
136, 85– 92.
Inganga, S.F., Ucakuwun, E.K and Some, D.K., 2001. Rate of swelling of expansive soils: a
critical factor in the triggering of landslides and damage to structures. Documenta
Naturae, 136: 93-98.
Kafiriti, E, 2003. Coming to grips with farmers variety selection the case of new improved
rice varieties under irrigation in South East Tanzania, Tropicultura Journal, 21 (4),
211-217.
Kirsten, J, Elizabeth A. O and Sumitra, M., 1982. Environmental knowledge and response to
natural hazards in mountainous Nepal, Mountain Research and development journal,
2 (2).
Kitutu, K.M.G, 2004, Local perception of landslide problems in Manjiya County, Mbale
District, Eastern Uganda, mountain ecosystems, resources and development in
Uganda, a publication of Mountain Resource Centre, Department of Geography ,
Makerere University, pages 94-98. isbn 9970-05-017-6.
Kitutu, M.G., Muwanga, A., Poesen, J and Deckers J. A., 2009. Influence of soil properties
on landslide occurrences in Bududa district, Eastern Uganda, African Journal of
Agricultural Research Vol. 4 (7), pp. 611-620, Available online at
29
http://www.academicjournals.org/AJAR ISSN 1991-637X © 2009 Academic
Journals
Kitutu, M.G., Muwanga, A., Poesen, J and Deckers J. A., 2010. Farmers‟ perception on
landslide occurrences in Bududa District, eastern Uganda, African Journal of
Agricultural Research (In press)
Knapen, A., Kitutu, M.G., Poesen, J., Breugelmans, W., Deckers, J and Muwanga, A., 2006.
Landslides in a densely populated county at the footslopes of Mount Elgon (Uganda):
characteristics and causal factors. Geomorphology 73, 149–165.
Larsen, M.C and Torres-Sánchez, A.J. 1998. the frequency and distribution of recent
landslides in three Montane tropical regions of Puerto Rico. Geomorphology 24,
p.309-331.
McSaveney, M. J. 1978. The magnitude of erosion across the Southern Alps. Proceedings of
the Conference on Erosion Assessment and Control in New Zealand, Christchurch,
NZ Association of Soil Conservators, p 7-24.
Michael, H., Elke D and Greg Agola., 2003. International Centre for Research in
Agroforestry Kenya.
Muwanga, A., Schuman, A., Biryabarema, M., 2001. Landslides in Uganda - Documentation
of a Natural Hazard. Documenta naturae, 136: 111-115.
Moeyersons, J., 1988. The complex nature of creep movements on steep sloping ground in
Southern Rwanda. Earth Surface Processes and Landforms, 13: 511-524.
Moeyersons, J., 1989a. La nature de l‟erosion des versants au Rwanda. Ann. Royal Museum
Centr. Africa Tervuren, Series Economische wetenschappen, 19: 396 pp.
Moeyersons, J., 1989b. A possible causal relationship between creep and sliding on Rwaza
hill, Southern Rwanda. Earth Surface Processes and Landforms, 14: 597-614.
Moeyersons, J., 2003. The topographic tresholds of hillslope incisions in southwestern
Rwanda. Catena, 50: 381-400.
Nathalie C., 2003. Multiscale participatory Land resource Assessment in Northwest Syria.
PhD Thesis 559, Catholic University, Leuven, Department of Land Management,
Belgium.
National Environment Management Authority, 1997. District State of Environment Report,
Mbale, 1997, Uganda, 128 pp.
30
National Environment Management Authority, 2006. State of Environment Report for
Uganda.
Nicoliene O., and Adrienne M., 2003. Methods and issues in exploring local knowledge on
soils, Geoderma 111 387-401.
Ngecu, W.M., and Ichangi, D.W., 1998. The environmental impact of landslides on the
population living on the eastern footslopes of the Aberdare ranges in Kenya: a case
study of Maringa village landslide. Environmental Geology, 38 (3): 259-264.
Ngecu, W.M., and Mathu, E.M., 1999. The El Nino-triggered landslides and their
socioeconomic impact on Kenya. Environmental Geology, 38 (4): 277-284.
Nyssen, J., Moeyersons, J., Poesen, J., Deckers, J and Mitiku H., 2003, The environmental
significance of the remobilization of ancient mass movements in the Atbara-Tekeze
headwaters near Hagere Selam, Tigray, Northern Ethiopia, Geomorphology.
Ollier, C.D. and Harrop, J.F., 1959. Memoirs of the research division, series 1 – soils,
number 2. The soil of the eastern province of Uganda. Kawanda Research Station,
Kampala, 55 pp.
Rapp, A., Berry, L and Temple, P., 1972. Landslides in the Mgeta area, western Uluguru
mountains, Tanzania. Studies of soil erosion and sedimentation in Tanzania, Bureau
of resource assessment and landuse planning, University of Dar es Salaam,
Department of Physical Geography, University of Uppsala, Sweden, 19 pp.
Reedman, J.H., (1973). Potash Ultra-fenites at the Butiriku carbonatite complex in south-east
Uganda. Univ. Leeds Res. Inst. African Geol. 17th Ann. Rep., 78-81.
Scharpe, S.C.F., 1938. Landslides and related phenomena. A study of mass-movements of
soil and rock. Columbia University Press, New York. 137p.
Selby, M.G.,1993. Hillslope materials and processes, Oxford University Press. New York.
Sidle, R.C., Pearce, A.J and O‟ Loughlin, C.L., 1985. Hillslope stability and landuse.
American geophysical union, Washington DC, USA, 125 pp.
Smedema, 1983. Land drainage. Batsford academic and education Ltd, London. P. 174-194.
Temesgen, B., Mohammed, M.U and Korne, T., 2001. Natural hazard assessment using GIS
and Remote Sensing methods, with particular reference tot the landslides in the
Wondogenet area,Ethiopia. Physics and Chemistry of the Earth, Part C: Solar,
Terrestrial and Planetary Science 26 (9), 665–675.
31
Ucakuwun, E.K., 1999. Rate of swelling of expansive soils-a critical factor in the triggering
of landslides and the destruction of structural features. A paper presented at the
workshop on Challenges and perspectives of Interdisciplinary GEO-Networks in
East-Africa, DAAD,Uganda, 8 pp.
Statistical Abstract, 2010, Uganda Bureau of Statistics.
Thomas, F.T., 1994. Landsliding and other mass movement. In: Geomorphology in the
tropics: A study of weathering and denudation in Low Latitudes, John Wiley & sons
Ltd., Chichester, UK: 165-189.
UNESCO/UNEP, 1988. Landslides and mudflows UNEP/Unesco, Moscow. 236p.
Varnes, D. J., 1978. Slope movement types and processes: In: Landslide Analysis and
Control: In Schuster, R. L., Krizak, eds. Transportation Research Board Special
Report No. 176, National Academy of Sciences, Washington, D. C., P. 11-33.
Wendy,B., 2003. Influence of soil properties, landuse and deforestation on the occurrence of
landslides in Manjiya county, Mount Elgon area, East Uganda, Master of Science
thesis (Unpublished) Catholic University of Leuven.
Westerberg, L.O and Christiansson, C., 1998. Landslides in East African Highlands. Slope
instability and its interrelations with landscape charactyeristics and land use.
Advances in GeoEcology, 31: 317-325.
Westerberg, L.O., 1999. Mass Movement in East African Highlands: Processes, Effects and
Scar Recovery. Dissertation 14, Dept of Physical Geography, Stockholm University,
Sweden.147 pp.
http://www.visituganda.com
http://en.wikipedia.org/wiki/Landslide
http://en.wikipedia.org/wiki/Causes_of_landslides
http://en.wikipedia.org/wiki/Atterberg_limits
32
CHAPTER THREE
A paper published in the journal Geomorphology 73, (2006) 149–165.
LANDSLIDES IN A DENSELY POPULATED COUNTY AT THE
FOOTSLOPES OF MOUNT ELGON (UGANDA): CHARACTERISTICS AND CAUSAL FACTORS.
33
CHAPTER FOUR
A paper published in the journal Geomorphology 90 (2007) 23–35
MODELLING LANDSLIDE HAZARD, SOIL REDISTRIBUTION AND SEDIMENT YIELD OF LANDSLIDES ON THE UGANDAN
FOOTSLOPES OF MOUNT ELGON.
34
CHAPTER FIVE
A paper published in the African Journal of Agricultural Research Vol. 4 (7), pp. 611-620, July 2009.Available online at http://www.academicjournals.org/AJAR
ISSN 1991-637X © 2009 Academic Journals
INFLUENCE OF SOIL PROPERTIES ON LANDSLIDE OCCURRENCES IN BUDUDA DISTRICT, EASTERN UGANDA
35
CHAPTER SIX
Under review (Africa Journal of Agricultural Research) Ms Number: AJAR-09-158
FARMER’S PERCEPTION ON LANDSLIDE OCCURRENCES IN BUDUDA DISTRICT, EASTERN UGANDA
36
CHAPTER SEVEN
Mountain Ecosystems, Resources and Development in Uganda Department of Geography, Makerere University, (2004), Pages 94-98. ISBN 9970-05-017-6
LOCAL PERCEPTION OF LANDSLIDE PROBLEMS IN MANJIYA COUNTY, MBALE DISTRICT, EASTERN UGANDA
37
CHAPTER EIGHT
INFLUENCE OF CLIMATIC FACTORS AND GEOLOGY ON LANDSLIDE OCCURRENCES IN BUDUDA DISTRICT
8.1 EFFECTS OF EL NIÑO
In the recent years, scientists have observed that sometimes there is increased rainfall
in Eastern Africa due to the El Niño phenomena. El Niño is an oscillation of the ocean-
atmosphere system in the tropical Pacific having important consequences for weather around
the globe. El Niño was originally recognized by fisherman off the coast of South America as
the appearance of unusually warm water in the Pacific Ocean, occurring near the beginning
of the year (http://www.enotes.com/earth-science/el-nino-la-nina-phenomena). El Niño
means the little boy or Christ child in Spanish. This name was used for the tendency of the
phenomenon to arrive around Christmas. The known El Niño years are 1957-1958, 1965-
1966, 1977-1978, 1987-1988, 1992–1993, 1994–1995, 2002-2003 and 2006 for weak and
moderate El Niño (http://apollo.lsc.vsc.edu/classes/met130/notes/chapter10/elnino.html).
The strong El Niño years are 1972-1973, 1982–1983, 1991–1992, and 1997–1998.
Seventy two landslides whose years of occurrence are known were correlated with the
known El Niño years (Table 6). Seventy nine percent of the landslide mapped occurred in El
Niño years with the highest number in 1997 leading to a conclusion that El Niño has an
influence on landslide occurrences. However, some landslides occurred during normal years
reason being that this is a high rainfall area and landslides can still occur in a normal year if
other conditioning factors are favorable.
8.2 EFFECT OF RAINFALL
Most farmers revealed that all landslides occur during rainfall seasons. To
investigate this factor six local rain gauges that had been calibrated by technical officers
from the Department of Meteorology were spread out in various secondary schools namely
Bulucheke, Bududa SS, Bushika S.S, Bulucheke S.S, Bukalasi S.S and on at Busayi in
Bududa District. Some teachers and students were trained to collect this data daily and
unfortunately all the rain gauges were vandalized except for the two at Bududa S.S and
Bulucheke.
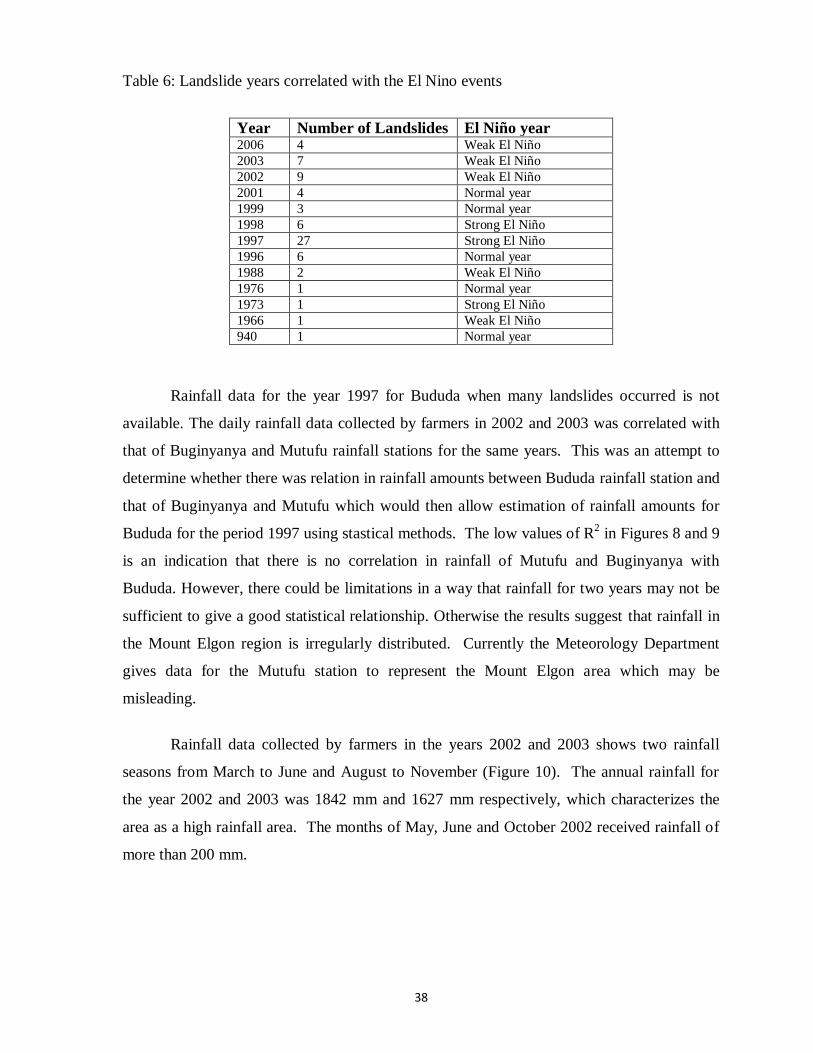
38
Table 6: Landslide years correlated with the El Nino events
Year Number of Landslides El Niño year 2006 4 Weak El Niño
2003 7 Weak El Niño
2002 9 Weak El Niño
2001 4 Normal year
1999 3 Normal year
1998 6 Strong El Niño
1997 27 Strong El Niño
1996 6 Normal year
1988 2 Weak El Niño
1976 1 Normal year
1973 1 Strong El Niño
1966 1 Weak El Niño
940 1 Normal year
Rainfall data for the year 1997 for Bududa when many landslides occurred is not
available. The daily rainfall data collected by farmers in 2002 and 2003 was correlated with
that of Buginyanya and Mutufu rainfall stations for the same years. This was an attempt to
determine whether there was relation in rainfall amounts between Bududa rainfall station and
that of Buginyanya and Mutufu which would then allow estimation of rainfall amounts for
Bududa for the period 1997 using stastical methods. The low values of R2 in Figures 8 and 9
is an indication that there is no correlation in rainfall of Mutufu and Buginyanya with
Bududa. However, there could be limitations in a way that rainfall for two years may not be
sufficient to give a good statistical relationship. Otherwise the results suggest that rainfall in
the Mount Elgon region is irregularly distributed. Currently the Meteorology Department
gives data for the Mutufu station to represent the Mount Elgon area which may be
misleading.
Rainfall data collected by farmers in the years 2002 and 2003 shows two rainfall
seasons from March to June and August to November (Figure 10). The annual rainfall for
the year 2002 and 2003 was 1842 mm and 1627 mm respectively, which characterizes the
area as a high rainfall area. The months of May, June and October 2002 received rainfall of
more than 200 mm.
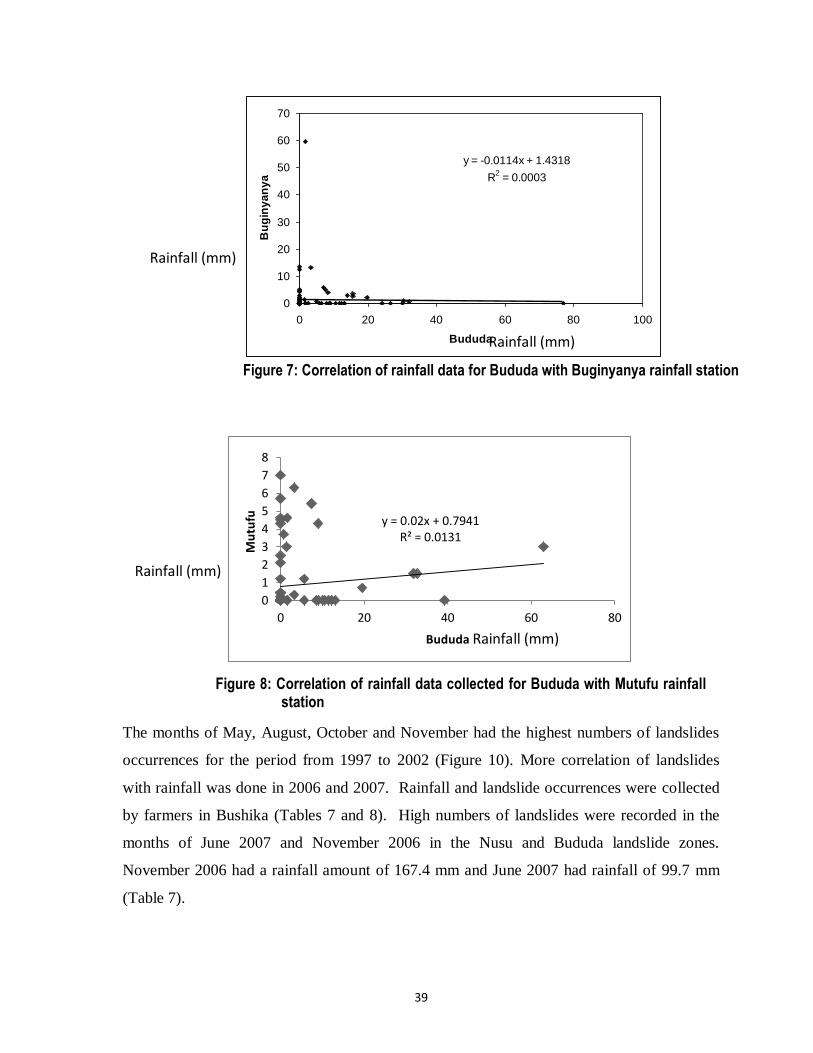
39
The months of May, August, October and November had the highest numbers of landslides
occurrences for the period from 1997 to 2002 (Figure 10). More correlation of landslides
with rainfall was done in 2006 and 2007. Rainfall and landslide occurrences were collected
by farmers in Bushika (Tables 7 and 8). High numbers of landslides were recorded in the
months of June 2007 and November 2006 in the Nusu and Bududa landslide zones.
November 2006 had a rainfall amount of 167.4 mm and June 2007 had rainfall of 99.7 mm
(Table 7).
y = 0.02x + 0.7941 R² = 0.0131
0
1
2
3
4
5
6
7
8
0 20 40 60 80
Mu
tufu
Bududa
y = -0.0114x + 1.4318
R2 = 0.0003
0
10
20
30
40
50
60
70
0 20 40 60 80 100
Bududa
Bu
gin
ya
ny
a
Figure 7: Correlation of rainfall data for Bududa with Buginyanya rainfall station
Rainfall (mm)
Rainfall (mm)
Rainfall (mm)
Rainfall (mm)
Figure 8: Correlation of rainfall data collected for Bududa with Mutufu rainfall station
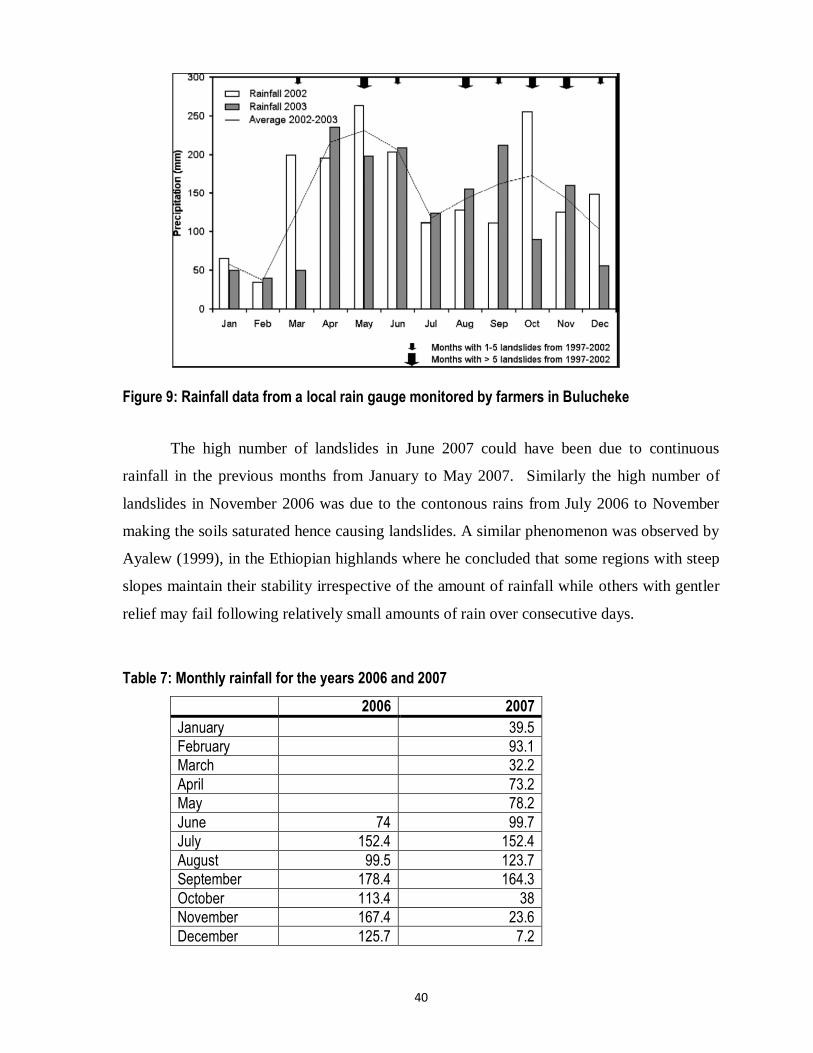
40
Figure 9: Rainfall data from a local rain gauge monitored by farmers in Bulucheke
The high number of landslides in June 2007 could have been due to continuous
rainfall in the previous months from January to May 2007. Similarly the high number of
landslides in November 2006 was due to the contonous rains from July 2006 to November
making the soils saturated hence causing landslides. A similar phenomenon was observed by
Ayalew (1999), in the Ethiopian highlands where he concluded that some regions with steep
slopes maintain their stability irrespective of the amount of rainfall while others with gentler
relief may fail following relatively small amounts of rain over consecutive days.
Table 7: Monthly rainfall for the years 2006 and 2007
2006 2007
January 39.5
February 93.1
March 32.2
April 73.2
May 78.2
June 74 99.7
July 152.4 152.4
August 99.5 123.7
September 178.4 164.3
October 113.4 38
November 167.4 23.6
December 125.7 7.2
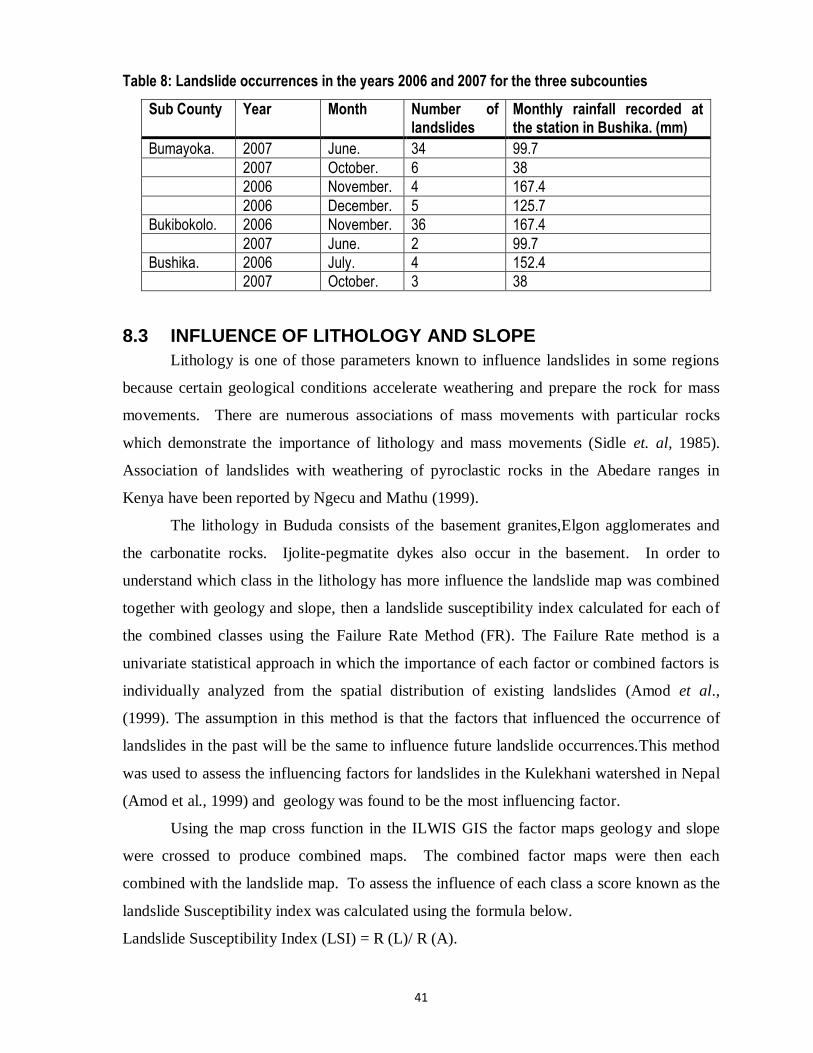
41
Table 8: Landslide occurrences in the years 2006 and 2007 for the three subcounties
Sub County Year Month Number of landslides
Monthly rainfall recorded at the station in Bushika. (mm)
Bumayoka. 2007 June. 34 99.7
2007 October. 6 38
2006 November. 4 167.4
2006 December. 5 125.7
Bukibokolo. 2006 November. 36 167.4
2007 June. 2 99.7
Bushika. 2006 July. 4 152.4
2007 October. 3 38
8.3 INFLUENCE OF LITHOLOGY AND SLOPE
Lithology is one of those parameters known to influence landslides in some regions
because certain geological conditions accelerate weathering and prepare the rock for mass
movements. There are numerous associations of mass movements with particular rocks
which demonstrate the importance of lithology and mass movements (Sidle et. al, 1985).
Association of landslides with weathering of pyroclastic rocks in the Abedare ranges in
Kenya have been reported by Ngecu and Mathu (1999).
The lithology in Bududa consists of the basement granites,Elgon agglomerates and
the carbonatite rocks. Ijolite-pegmatite dykes also occur in the basement. In order to
understand which class in the lithology has more influence the landslide map was combined
together with geology and slope, then a landslide susceptibility index calculated for each of
the combined classes using the Failure Rate Method (FR). The Failure Rate method is a
univariate statistical approach in which the importance of each factor or combined factors is
individually analyzed from the spatial distribution of existing landslides (Amod et al.,
(1999). The assumption in this method is that the factors that influenced the occurrence of
landslides in the past will be the same to influence future landslide occurrences.This method
was used to assess the influencing factors for landslides in the Kulekhani watershed in Nepal
(Amod et al., 1999) and geology was found to be the most influencing factor.
Using the map cross function in the ILWIS GIS the factor maps geology and slope
were crossed to produce combined maps. The combined factor maps were then each
combined with the landslide map. To assess the influence of each class a score known as the
landslide Susceptibility index was calculated using the formula below.
Landslide Susceptibility Index (LSI) = R (L)/ R (A).
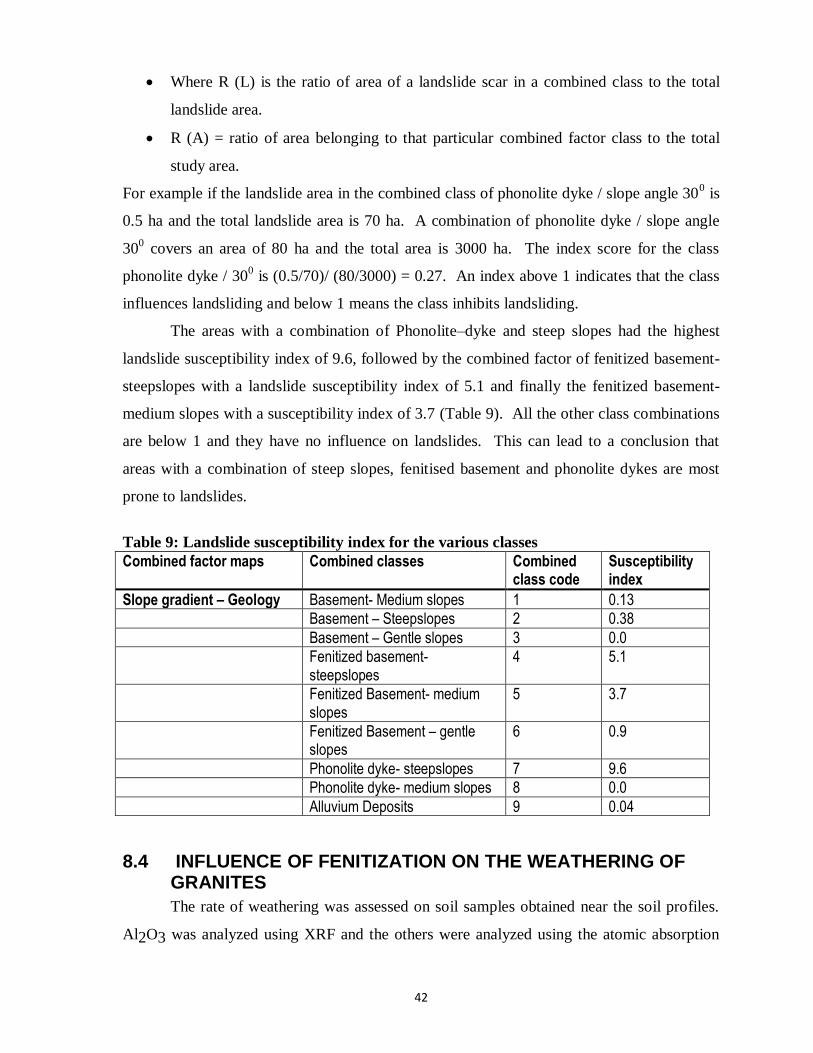
42
Where R (L) is the ratio of area of a landslide scar in a combined class to the total
landslide area.
R (A) = ratio of area belonging to that particular combined factor class to the total
study area.
For example if the landslide area in the combined class of phonolite dyke / slope angle 300 is
0.5 ha and the total landslide area is 70 ha. A combination of phonolite dyke / slope angle
300 covers an area of 80 ha and the total area is 3000 ha. The index score for the class
phonolite dyke / 300 is (0.5/70)/ (80/3000) = 0.27. An index above 1 indicates that the class
influences landsliding and below 1 means the class inhibits landsliding.
The areas with a combination of Phonolite–dyke and steep slopes had the highest
landslide susceptibility index of 9.6, followed by the combined factor of fenitized basement-
steepslopes with a landslide susceptibility index of 5.1 and finally the fenitized basement-
medium slopes with a susceptibility index of 3.7 (Table 9). All the other class combinations
are below 1 and they have no influence on landslides. This can lead to a conclusion that
areas with a combination of steep slopes, fenitised basement and phonolite dykes are most
prone to landslides.
Table 9: Landslide susceptibility index for the various classes
Combined factor maps Combined classes Combined class code
Susceptibility index
Slope gradient – Geology Basement- Medium slopes 1 0.13
Basement – Steepslopes 2 0.38
Basement – Gentle slopes 3 0.0
Fenitized basement- steepslopes
4 5.1
Fenitized Basement- medium slopes
5 3.7
Fenitized Basement – gentle slopes
6 0.9
Phonolite dyke- steepslopes 7 9.6
Phonolite dyke- medium slopes 8 0.0
Alluvium Deposits 9 0.04
8.4 INFLUENCE OF FENITIZATION ON THE WEATHERING OF GRANITES
The rate of weathering was assessed on soil samples obtained near the soil profiles.
Al2O3 was analyzed using XRF and the others were analyzed using the atomic absorption
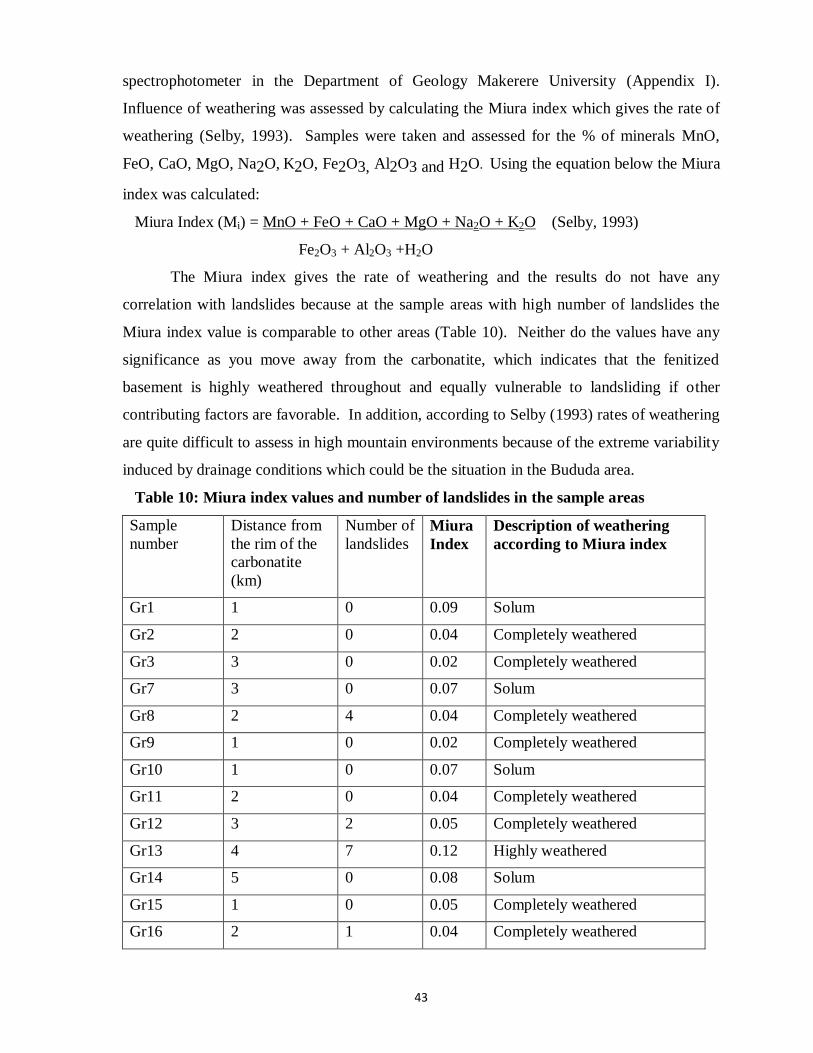
43
spectrophotometer in the Department of Geology Makerere University (Appendix I).
Influence of weathering was assessed by calculating the Miura index which gives the rate of
weathering (Selby, 1993). Samples were taken and assessed for the % of minerals MnO,
FeO, CaO, MgO, Na2O, K2O, Fe2O3, Al2O3 and H2O. Using the equation below the Miura
index was calculated:
Miura Index (Mi) = MnO + FeO + CaO + MgO + Na2O + K2O (Selby, 1993)
Fe2O3 + Al2O3 +H2O
The Miura index gives the rate of weathering and the results do not have any
correlation with landslides because at the sample areas with high number of landslides the
Miura index value is comparable to other areas (Table 10). Neither do the values have any
significance as you move away from the carbonatite, which indicates that the fenitized
basement is highly weathered throughout and equally vulnerable to landsliding if other
contributing factors are favorable. In addition, according to Selby (1993) rates of weathering
are quite difficult to assess in high mountain environments because of the extreme variability
induced by drainage conditions which could be the situation in the Bududa area.
Table 10: Miura index values and number of landslides in the sample areas
Sample
number
Distance from
the rim of the
carbonatite
(km)
Number of
landslides
Miura
Index
Description of weathering
according to Miura index
Gr1 1 0 0.09 Solum
Gr2 2 0 0.04 Completely weathered
Gr3 3 0 0.02 Completely weathered
Gr7 3 0 0.07 Solum
Gr8 2 4 0.04 Completely weathered
Gr9 1 0 0.02 Completely weathered
Gr10 1 0 0.07 Solum
Gr11 2 0 0.04 Completely weathered
Gr12 3 2 0.05 Completely weathered
Gr13 4 7 0.12 Highly weathered
Gr14 5 0 0.08 Solum
Gr15 1 0 0.05 Completely weathered
Gr16 2 1 0.04 Completely weathered
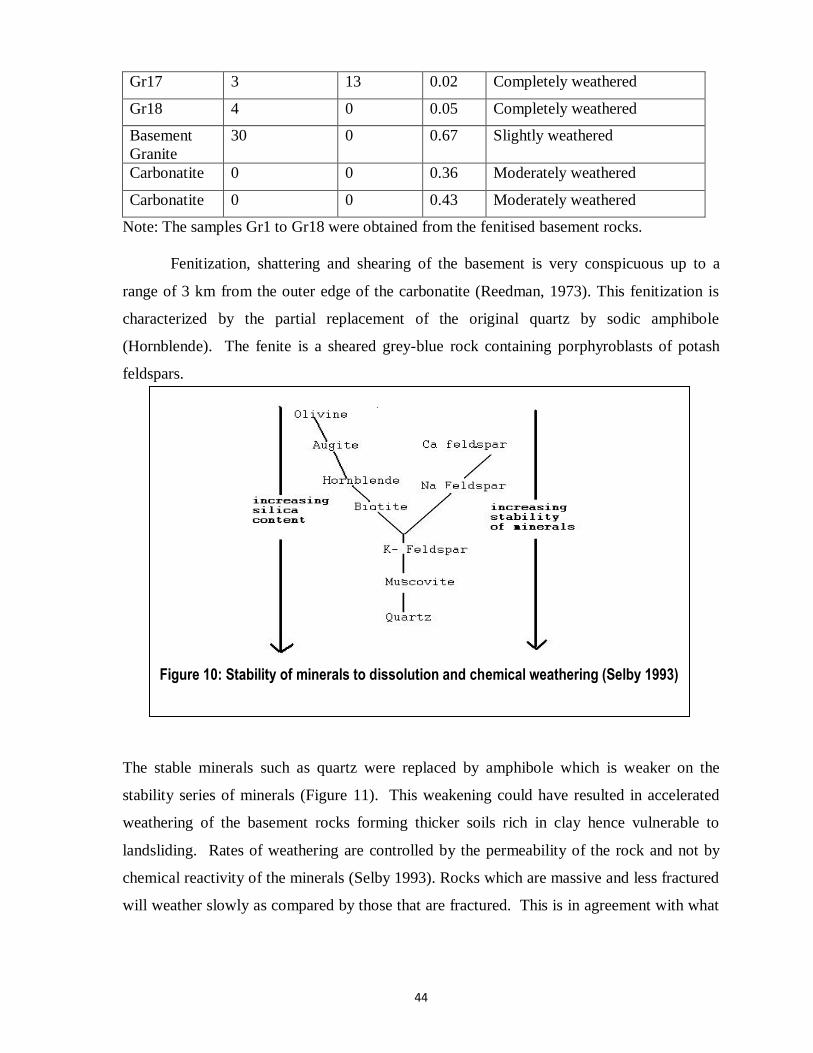
44
Gr17 3 13 0.02 Completely weathered
Gr18 4 0 0.05 Completely weathered
Basement
Granite
30 0 0.67 Slightly weathered
Carbonatite 0 0 0.36 Moderately weathered
Carbonatite 0 0 0.43 Moderately weathered
Note: The samples Gr1 to Gr18 were obtained from the fenitised basement rocks.
Fenitization, shattering and shearing of the basement is very conspicuous up to a
range of 3 km from the outer edge of the carbonatite (Reedman, 1973). This fenitization is
characterized by the partial replacement of the original quartz by sodic amphibole
(Hornblende). The fenite is a sheared grey-blue rock containing porphyroblasts of potash
feldspars.
The stable minerals such as quartz were replaced by amphibole which is weaker on the
stability series of minerals (Figure 11). This weakening could have resulted in accelerated
weathering of the basement rocks forming thicker soils rich in clay hence vulnerable to
landsliding. Rates of weathering are controlled by the permeability of the rock and not by
chemical reactivity of the minerals (Selby 1993). Rocks which are massive and less fractured
will weather slowly as compared by those that are fractured. This is in agreement with what
Figure 10: Stability of minerals to dissolution and chemical weathering (Selby 1993)
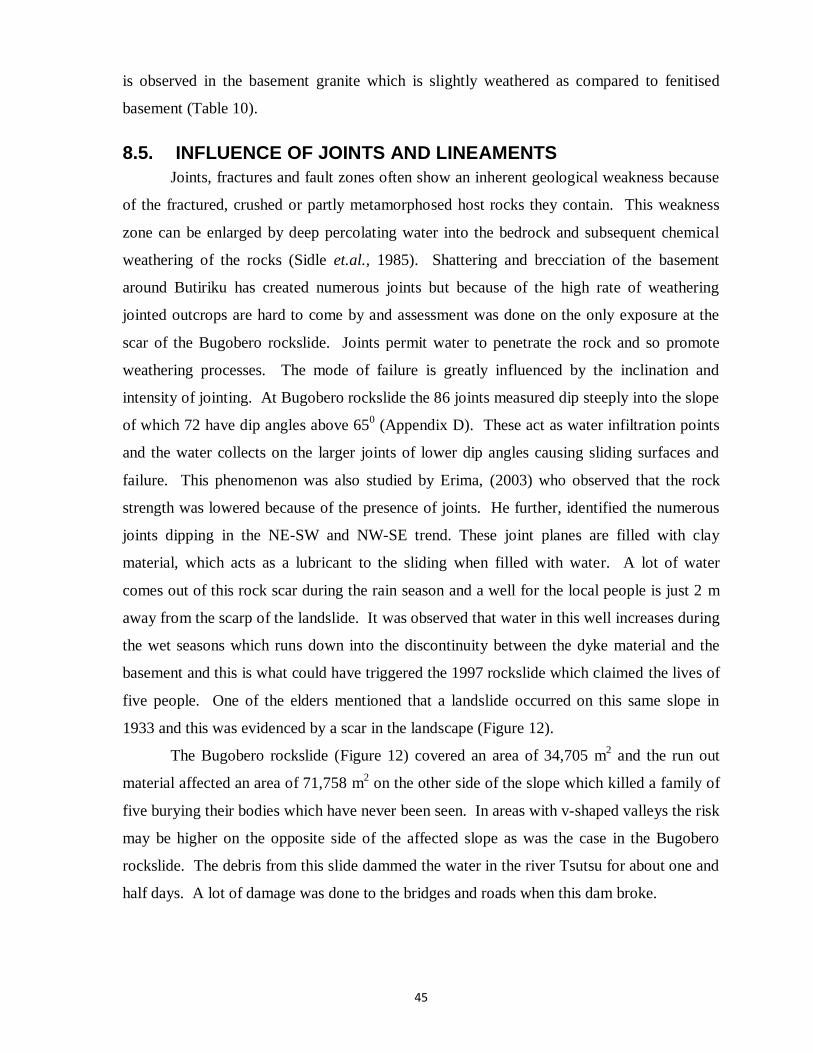
45
is observed in the basement granite which is slightly weathered as compared to fenitised
basement (Table 10).
8.5. INFLUENCE OF JOINTS AND LINEAMENTS
Joints, fractures and fault zones often show an inherent geological weakness because
of the fractured, crushed or partly metamorphosed host rocks they contain. This weakness
zone can be enlarged by deep percolating water into the bedrock and subsequent chemical
weathering of the rocks (Sidle et.al., 1985). Shattering and brecciation of the basement
around Butiriku has created numerous joints but because of the high rate of weathering
jointed outcrops are hard to come by and assessment was done on the only exposure at the
scar of the Bugobero rockslide. Joints permit water to penetrate the rock and so promote
weathering processes. The mode of failure is greatly influenced by the inclination and
intensity of jointing. At Bugobero rockslide the 86 joints measured dip steeply into the slope
of which 72 have dip angles above 650 (Appendix D). These act as water infiltration points
and the water collects on the larger joints of lower dip angles causing sliding surfaces and
failure. This phenomenon was also studied by Erima, (2003) who observed that the rock
strength was lowered because of the presence of joints. He further, identified the numerous
joints dipping in the NE-SW and NW-SE trend. These joint planes are filled with clay
material, which acts as a lubricant to the sliding when filled with water. A lot of water
comes out of this rock scar during the rain season and a well for the local people is just 2 m
away from the scarp of the landslide. It was observed that water in this well increases during
the wet seasons which runs down into the discontinuity between the dyke material and the
basement and this is what could have triggered the 1997 rockslide which claimed the lives of
five people. One of the elders mentioned that a landslide occurred on this same slope in
1933 and this was evidenced by a scar in the landscape (Figure 12).
The Bugobero rockslide (Figure 12) covered an area of 34,705 m2 and the run out
material affected an area of 71,758 m2 on the other side of the slope which killed a family of
five burying their bodies which have never been seen. In areas with v-shaped valleys the risk
may be higher on the opposite side of the affected slope as was the case in the Bugobero
rockslide. The debris from this slide dammed the water in the river Tsutsu for about one and
half days. A lot of damage was done to the bridges and roads when this dam broke.
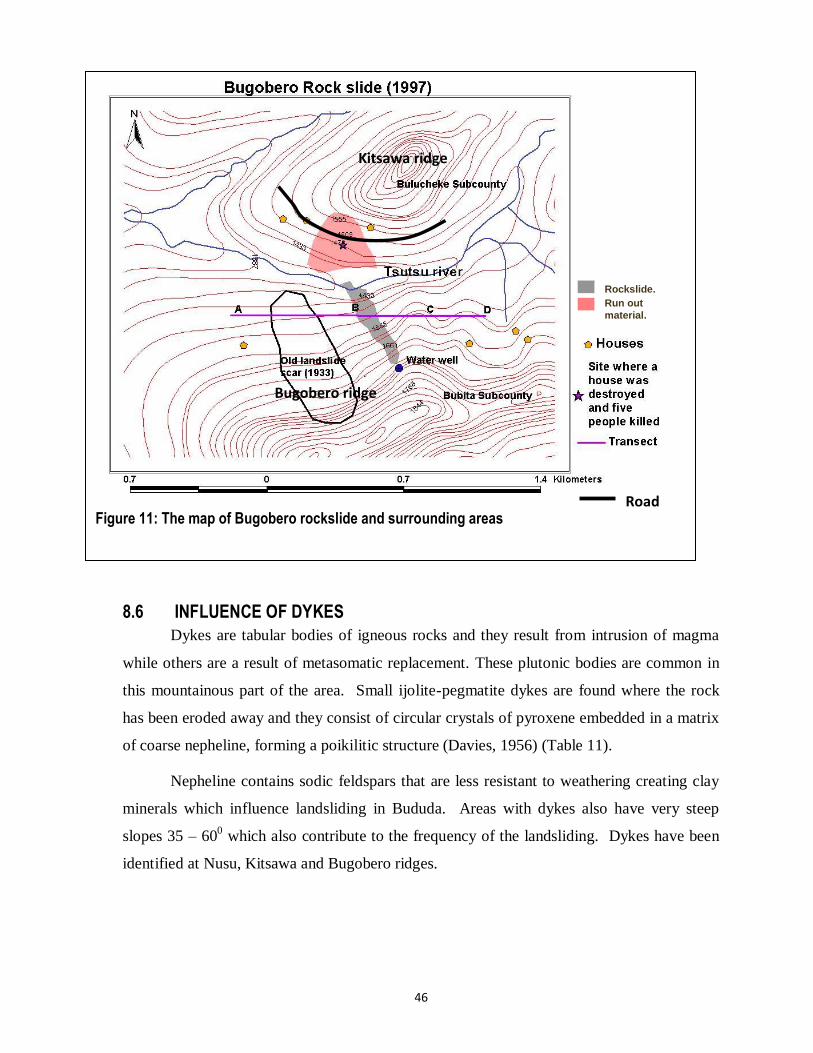
46
8.6 INFLUENCE OF DYKES
Dykes are tabular bodies of igneous rocks and they result from intrusion of magma
while others are a result of metasomatic replacement. These plutonic bodies are common in
this mountainous part of the area. Small ijolite-pegmatite dykes are found where the rock
has been eroded away and they consist of circular crystals of pyroxene embedded in a matrix
of coarse nepheline, forming a poikilitic structure (Davies, 1956) (Table 11).
Nepheline contains sodic feldspars that are less resistant to weathering creating clay
minerals which influence landsliding in Bududa. Areas with dykes also have very steep
slopes 35 – 600 which also contribute to the frequency of the landsliding. Dykes have been
identified at Nusu, Kitsawa and Bugobero ridges.
Figure 11: The map of Bugobero rockslide and surrounding areas
Kitsawa ridge
Bugobero ridge
Rockslide.
Run out
material.
Road
47
Table 11: Mineral Composition of Ijolite-pegmatite dykes at Nusu
Mineral % composition
Nepheline 79.9
Pyroxene 15.8
Apatite 1.4
Sphene and Peroskite 1.2
Iron ore 1.7
Source: The Geology of Mount Elgon (Davies 1956).
8.6.1 NUSU RIDGE DYKE
The Nusu ridge (Figure 13) is very steep and has frequent landslide occurrences. The
rock material is very soft and fractured as seen in Figure 14. The rocks are fractured and
jointed. This makes the plants and shrub roots grow into the joints widening them allowing
in more water infiltration and later the rock fails, given the steepness of the slope.
8.6.2. KITSAWA RIDGE DYKE
The Kitsawa hill (Figure 15) is very steep and farmers indicate that they hear
vibrations like the ground is hollow when they walk at the top of this hill. The soils are like
dark ash and soft. No water or streams exist on this hill indicating that water does not
infiltrate or if it does then there are no openings for it to come out. The Kitsawa ridge has
stabilized landforms with evidence of past landslide activity. The types of landslides are the
surfical which appear to be caused by water saturation between the soils and rock
Figure 12: Nusu ridge dyke
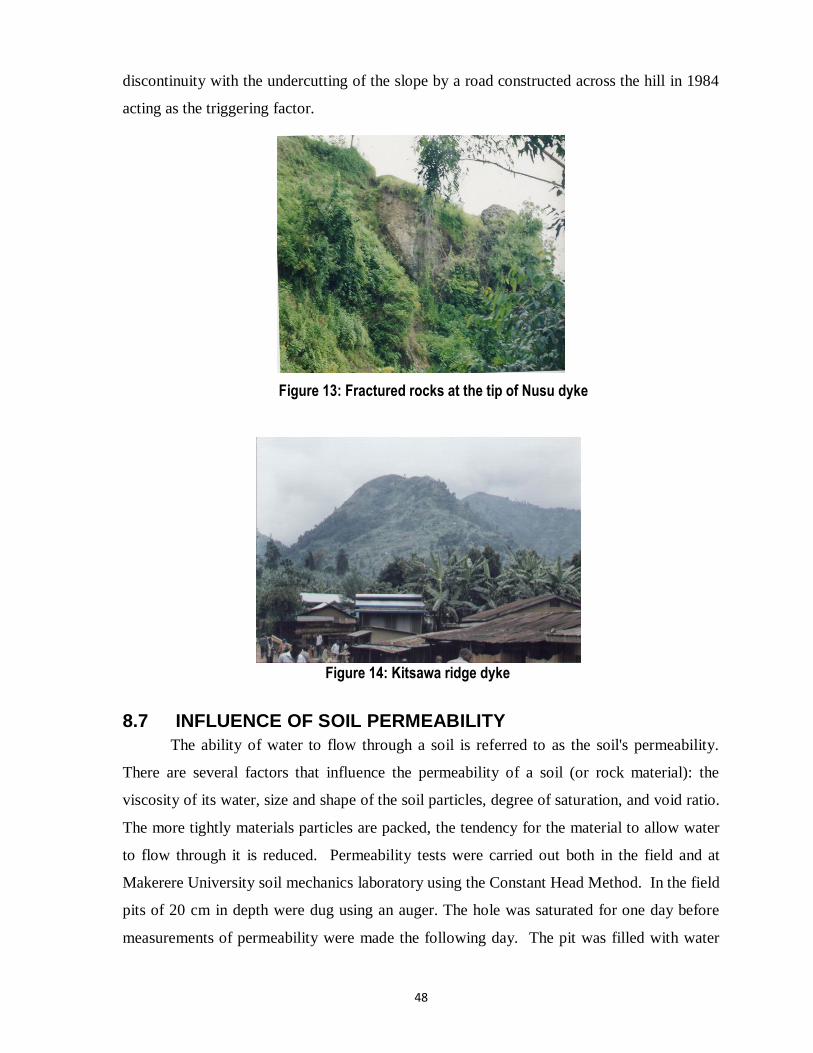
48
discontinuity with the undercutting of the slope by a road constructed across the hill in 1984
acting as the triggering factor.
Figure 13: Fractured rocks at the tip of Nusu dyke
8.7 INFLUENCE OF SOIL PERMEABILITY The ability of water to flow through a soil is referred to as the soil's permeability.
There are several factors that influence the permeability of a soil (or rock material): the
viscosity of its water, size and shape of the soil particles, degree of saturation, and void ratio.
The more tightly materials particles are packed, the tendency for the material to allow water
to flow through it is reduced. Permeability tests were carried out both in the field and at
Makerere University soil mechanics laboratory using the Constant Head Method. In the field
pits of 20 cm in depth were dug using an auger. The hole was saturated for one day before
measurements of permeability were made the following day. The pit was filled with water
Figure 14: Kitsawa ridge dyke
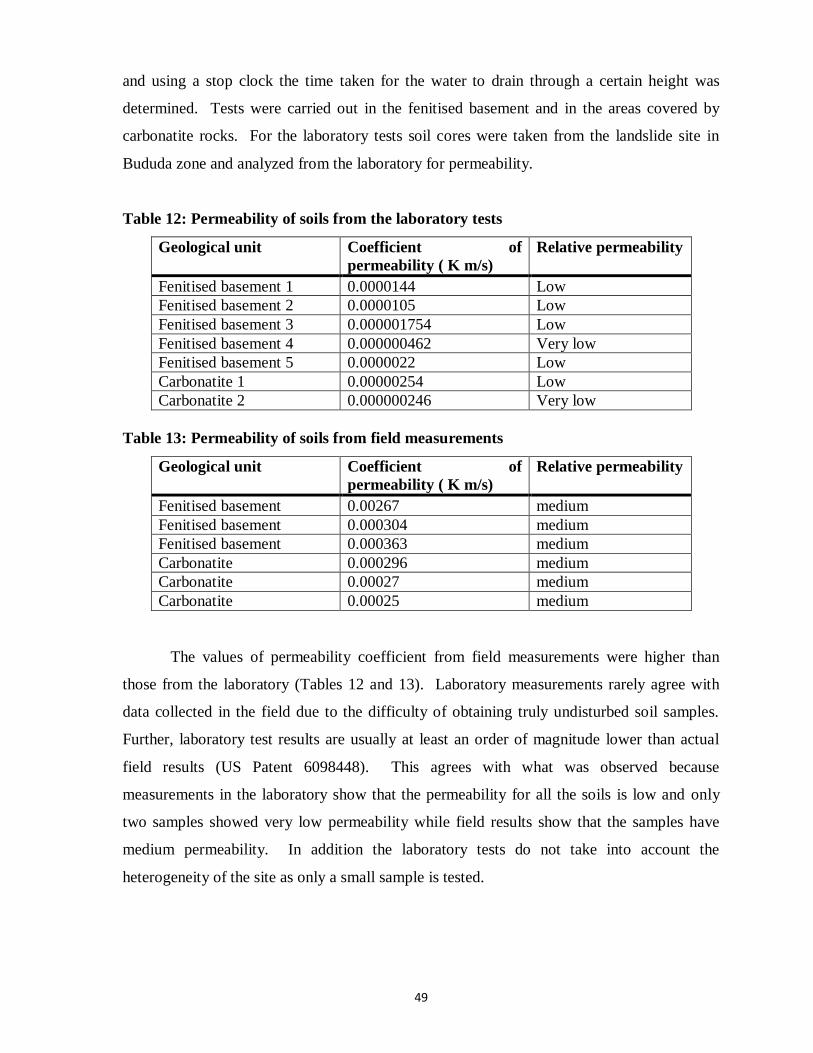
49
and using a stop clock the time taken for the water to drain through a certain height was
determined. Tests were carried out in the fenitised basement and in the areas covered by
carbonatite rocks. For the laboratory tests soil cores were taken from the landslide site in
Bududa zone and analyzed from the laboratory for permeability.
Table 12: Permeability of soils from the laboratory tests
Geological unit Coefficient of
permeability ( K m/s)
Relative permeability
Fenitised basement 1 0.0000144 Low
Fenitised basement 2 0.0000105 Low
Fenitised basement 3 0.000001754 Low
Fenitised basement 4 0.000000462 Very low
Fenitised basement 5 0.0000022 Low
Carbonatite 1 0.00000254 Low
Carbonatite 2 0.000000246 Very low
Table 13: Permeability of soils from field measurements
Geological unit Coefficient of
permeability ( K m/s)
Relative permeability
Fenitised basement 0.00267 medium
Fenitised basement 0.000304 medium
Fenitised basement 0.000363 medium
Carbonatite 0.000296 medium
Carbonatite 0.00027 medium
Carbonatite 0.00025 medium
The values of permeability coefficient from field measurements were higher than
those from the laboratory (Tables 12 and 13). Laboratory measurements rarely agree with
data collected in the field due to the difficulty of obtaining truly undisturbed soil samples.
Further, laboratory test results are usually at least an order of magnitude lower than actual
field results (US Patent 6098448). This agrees with what was observed because
measurements in the laboratory show that the permeability for all the soils is low and only
two samples showed very low permeability while field results show that the samples have
medium permeability. In addition the laboratory tests do not take into account the
heterogeneity of the site as only a small sample is tested.
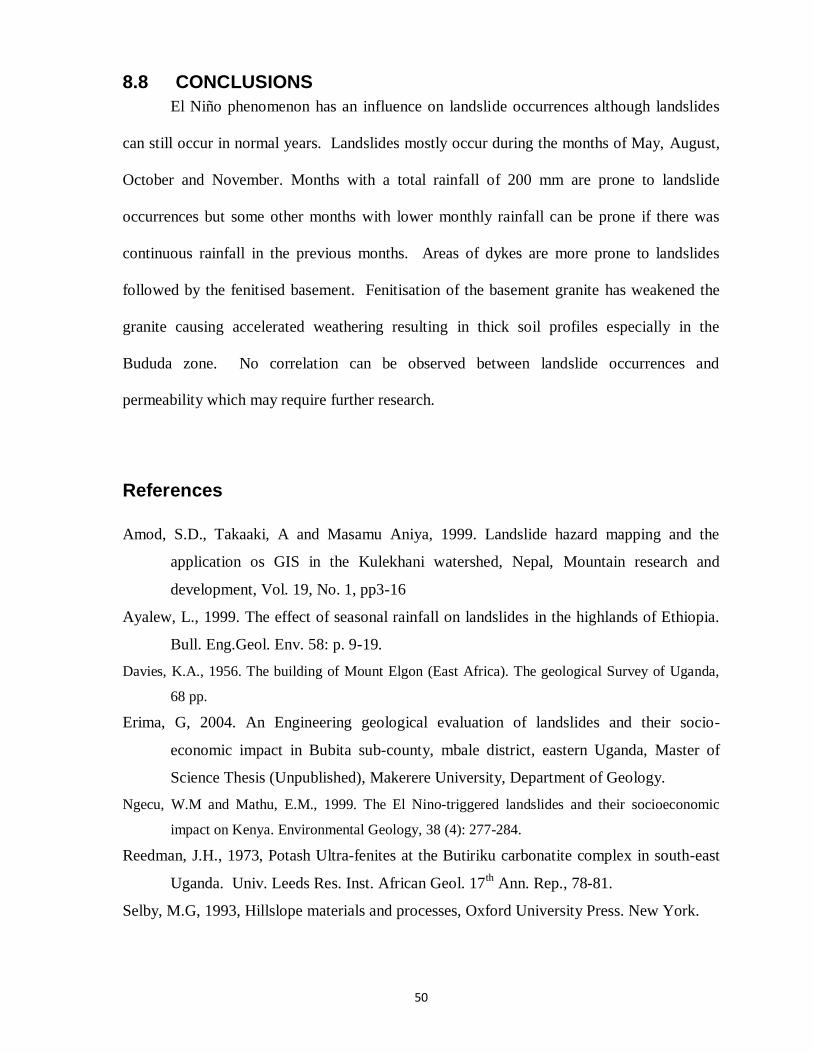
50
8.8 CONCLUSIONS
El Niño phenomenon has an influence on landslide occurrences although landslides
can still occur in normal years. Landslides mostly occur during the months of May, August,
October and November. Months with a total rainfall of 200 mm are prone to landslide
occurrences but some other months with lower monthly rainfall can be prone if there was
continuous rainfall in the previous months. Areas of dykes are more prone to landslides
followed by the fenitised basement. Fenitisation of the basement granite has weakened the
granite causing accelerated weathering resulting in thick soil profiles especially in the
Bududa zone. No correlation can be observed between landslide occurrences and
permeability which may require further research.
References
Amod, S.D., Takaaki, A and Masamu Aniya, 1999. Landslide hazard mapping and the
application os GIS in the Kulekhani watershed, Nepal, Mountain research and
development, Vol. 19, No. 1, pp3-16
Ayalew, L., 1999. The effect of seasonal rainfall on landslides in the highlands of Ethiopia.
Bull. Eng.Geol. Env. 58: p. 9-19.
Davies, K.A., 1956. The building of Mount Elgon (East Africa). The geological Survey of Uganda,
68 pp.
Erima, G, 2004. An Engineering geological evaluation of landslides and their socio-
economic impact in Bubita sub-county, mbale district, eastern Uganda, Master of
Science Thesis (Unpublished), Makerere University, Department of Geology.
Ngecu, W.M and Mathu, E.M., 1999. The El Nino-triggered landslides and their socioeconomic
impact on Kenya. Environmental Geology, 38 (4): 277-284.
Reedman, J.H., 1973, Potash Ultra-fenites at the Butiriku carbonatite complex in south-east
Uganda. Univ. Leeds Res. Inst. African Geol. 17th
Ann. Rep., 78-81.
Selby, M.G, 1993, Hillslope materials and processes, Oxford University Press. New York.
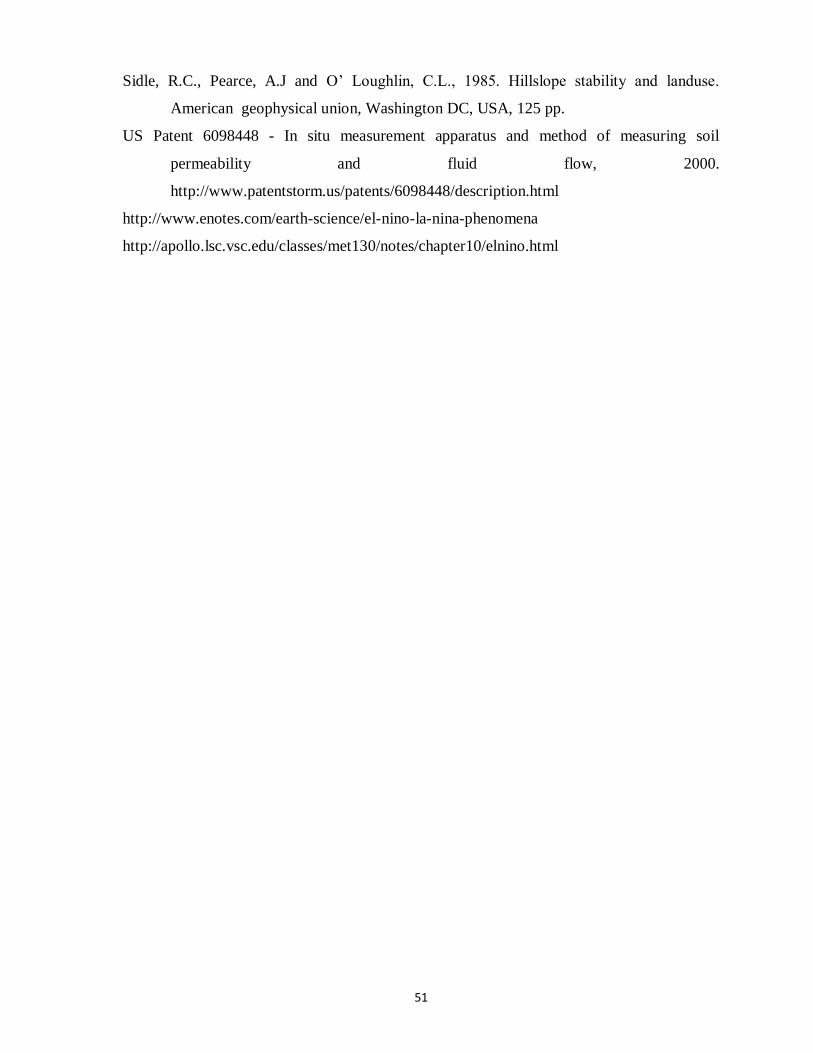
51
Sidle, R.C., Pearce, A.J and O‟ Loughlin, C.L., 1985. Hillslope stability and landuse.
American geophysical union, Washington DC, USA, 125 pp.
US Patent 6098448 - In situ measurement apparatus and method of measuring soil
permeability and fluid flow, 2000.
http://www.patentstorm.us/patents/6098448/description.html
http://www.enotes.com/earth-science/el-nino-la-nina-phenomena
http://apollo.lsc.vsc.edu/classes/met130/notes/chapter10/elnino.html
52
CHAPTER NINE
GENERAL CONCLUSIONS AND RECOMMENDATIONS
The conclusive examination of the hypotheses below shows that many factors control
landslide processes in Bududa District. These landslides are likely to continue occurring
given that the population and demand for land is growing which leads to settlements in areas
prone to landslide hazard.
9.1 GEOMORPHIC FACTORS SUCH AS GEOLOGY, TOPOGRAPHY AND RELIEF HAVE A HIGH INFLUENCE ON LANDSLIDE TYPES AND OCCURRENCES IN THIS REGION.
Verification of this hypothesis involved the mapping and classification of landslides,
assessment of slope, aspect and distance to the water divide. The areas most sensitive to
landslides are between slope angles of 140 to 41
0, plan concave in form and oriented to the
north and north-east directions. The depth of the landslide scar controls the volume of
material displaced from the erosional area of the landslide. The width and length have no
relationship with the volume of material displaced. Variation in type of movement as
rotational or translational is topographically controlled. The brecciation and shattering of the
basement granite caused accelerated weathering resulting into thick soil profiles rich in clay.
The areas with dykes and fenitised basement are most vulnerable to landslides.
The hypothesis that “Geomorphic factors such as geology and relief factors have a
major control on the landslide processes in this region” is accepted on the basis that slope,
slope shape, aspect and lithology contribute to landslide processes in Bududa area.
9.2 SOIL PROPERTIES SUCH AS PARTICLE SIZE AND PORE DISTRIBUTION OF THE SOIL MATRIX ARE A CONDITIONING FACTOR TO LANDSLIDE OCCURRENCES
Verification of this hypothesis involved carrying out soil profile description. The soil
types on the carbonatite dome are Rhodic Nitisols and those around the dome are mainly
those conditioned by topography and wet tropical climate namely Cambisols, Lixisols,
Ferralsols, Leptosols, Gleysols, Nitisols and Acrisols. The soils have high clay content and
the clay minerals present are Kaolinite and illite as derived from Atterberg limits.
Landslides in western zone are due to soil horizon stratification that favors water stagnation
in the lower horizons and they are only confined to places where there is water stagnation in
the lower soil horizons. The landslides in the eastern zone are dependent on several factors
53
which include soil texture, depth to the bedrock, landuse and slope shape. The study
highlights that soils stratification is linked to landslide occurrences in Bududa which
supports the hypothesis that soil properties are a conditioning factor to landslide occurrences.
9.3 FARMERS’ KNOWLEDGE AND PERCEPTION ON THE CONTROLLING FACTORS HAS NO STRONG LINKAGE TO THE SCIENTIFIC OBSERVATIONS
Open- ended questions were used in assessing farmers understanding of the main
causes of landslides. Farmer‟s listed steep slopes, slope shape and continuous rainfall as
factors that influence landslide occurrences. Knowledge from farmers‟ is similar to the
scientific findings on the landslide causes in this area and so the hypothesis that farmers‟
knowledge and perception on the controlling factors has no strong linkage to the scientific
observations is rejected. Only farmers were used for this survey because they are the
affected group. Future research can focus on other stakeholders such as regulatory
institutions and policy makers.
9.4 LANDSLIDE HAZARD CAN BE PREDICTED AND CLASSIFIED USING THE LAPSUS – LS MODEL
11,000,000m3 of soil was lost from 98 landslides investigated. Only shallow
landslides that occur mainly in the eastern part of the study area could be predicted and
classified correctly by the LAPSUS –LS model. The deeper rotational landslides in the
western part could not be „captured‟ by the model as only shallow, topographically
controlled landslides can be simulated using the equations. According to the LAPSUS-LS
model, the volume of soil material displaced could be four times higher than that observed in
the 2002 field survey (44,099,994 m3). In addition, more than half of this volume is predicted
to end up in the stream network and so contribute to the catchment sediment yield which will
end up damming rivers causing damage to property and also causing siltation of stream
channels and wetlands. These findings support the hypothesis that “zoning of landslide risk
can assist planners in curbing landslide related disasters”.
9.5 RAINFALL IS THE MAIN TRIGGERING FACTOR FOR LANDSLIDE OCCURRENCES IN BUDUDA.
Although farmers mention rainfall as one of the triggering factors for landslides in
Bududa there are limitations in its measurement in the field because unknown people
vandalize the local rain gauges. Despite this limitation it is very evident from the little
information collected that extreme rainfall events have lead to landslides occurrences.
54
Therefore, the hypothesis rainfall is the main triggering factor is could be accepted but
further research is recommended especially to understand the rainfall intensity and
distribution in the area in relation to landslides.
9.6 SCOPE OF FUTURE RESEARCH
Mention of rainfall as a triggering factor by farmers has identified some gaps in this
research and there is need to formulate more hypotheses to examine this factor critically.
Association of rainfall with landslides has been investigated by several authors (Ayalew
(1999), Ngecu and Mathu (1999), Inganga et al., (2001). Further still the Elnino occurrences
are becoming more frequent in the recent years and their influence on landslide occurrences
needs to be well understood.
Farmers‟ mentioned losses from landslides which requires a detailed study on the
socio-economic impacts and also the downstream impacts on the communities downstream
and also the impacts on the siltation of wetlands which may lead to flooding.
Rainfall induced soil erosion and shallow landslides are the main sources of sediment
supply in hilly catchments. These processes are generally modeled separately. Erosion
models are used to predict soil loss and landslide models are used to assess slope failures and
mass movements. However, an integrated model is desirable because it would permit the
chronological simulation of pre-failure sediment yield, the prediction of landslide
occurrences, and post-failure sediment yield. This is an area of potential research.
Population has been identified as one of the main drivers to land pressure which
results in settlements in areas of high hazard. There is need to carry out in-depth studies to
understand the main factors that contribute to this increased population growth.
According to Mattia et.al, (2005), vegetation and slope stability are interrelated by
the ability of the plant life growing on slopes to both promote and hinder the stability of the
slope. The relationship is a combination of the type of soil, the rainfall regime, the plant
species present, the slope aspect, and the steepness of the slope. Knowledge of the
underlying slope stability as a function of the soil type, its age, horizon development,
compaction, and other impacts is a major underlying aspect of understanding how vegetation
can alter the stability of the slope. Information on vegetation changes in Bududa is scanty but
could be obtained from old remotely sensed data. This is another area of potential research.
55
9.7 RECOMMENDATIONS
1. High population in Bududa is the main driver to land pressure which consequently
results in the environmental disasters and encroachment on the fragile ecosystems.
Therefore, population control should be taken as a critical intervention if the proposed
restoration activities are to succeed.
2. To strengthen programmes that target education of the youth and enhance their
vocational skills so that they can get alternative activities to occupy them. This will reduce
the pressure on land.
3. Although this research did not investigate the influence of vegetation and trees on
landslide occurrences several researches have shown that landslides are likely to reduce
when trees are planted. Roots from trees reinforce the soil through growing across failure
planes, root columns acting as piles, and through limiting surface erosion (Cammeraat et al.,
2005; Morgan 2007; Perry et al. 2003). When roots grow across the plane of potential failure
there is an increase in shear strength by binding particles. The roots anchor the unstable
surficial soil into the deeper stable layers or bedrock (Mattia et al., 2005). This most readily
occurs when there is rapid deep growth (1.5 m deep) of roots which last for more than two
years. However it is important to note that the strength exerted by roots generally only
extends down to 1m while most failures occur between 1.2 – 1.5 m soil depth (Perry et al.
2003).
4. Farmers should avoid settling in areas of high hazard. The landslide hazard map
developed in this study should guide the resettlement plan.
5. Local governments should promote integrated watershed management.
6. Development and enforcement of by- laws in the management of this mountainous
area should be strengthened.
7. Although rainfall was not fully investigated it is believed that it is the main trigger
therefore collection of rainfall data to enhance more research.
8. The findings of this research can be applied in other areas which suffer from
landslides in Uganda. For example areas with soil horizon differentiation may be prone to
landslides and so mitigation measures such as agro-forestry should be highly encouraged. In
56
addition slopes above 140 in areas with high rainfall should to be cultivated or inhabited with
caution.
9. The use of terraces as conservation measures can only be done after a detailed study.
References
Ayalew, L., 1999. The effect of seasonal rainfall on landslides in the highlands of Ethiopia.
Bull. Eng. Geol. Env. 58: p. 9-19.
Cammeraat, C. Van Beek, R and Kooijman, A. 2005, „Vegetation succession and its
consequences for slope stability in SE Spain‟, Plant and Soil, vol. 278, no.1, pp.135-
147.
Inganga, S.F., Ucakuwun, E.K and Some, D.K., 2001. Rate of swelling of expansive soils: a
critical factor in the triggering of landslides and damage to structures. Documenta
Naturae 136, 93– 98.
Mattia, C. Bishetti, G. and Gentile, F. 2005, „Biotechnical characteristics of root systems of
typical Mediterranean species‟, Plant and Soil, vol. 278, no.1, pp. 23-32.
Morgan, R. 2007, „Vegetative-based technologies for erosion control‟, in Stokes, A. (eds),
Eco- and Ground Bioengineering: The use of vegetation to Improve Slope Stability,
Dordrecht, London, pp. 265 -272.
Ngecu, W.M and Mathu, E.M. 1999. The El Nino-triggered landslides and their
socioeconomic impact on Kenya. Environmental Geology, 38 (4): 277-284.
Perry, J., Pedley, M and Reid, M. 2003, Infrastructure embankments condition appraisal and
remedial treatment, MWL Digital, Pontypool, South Wales.
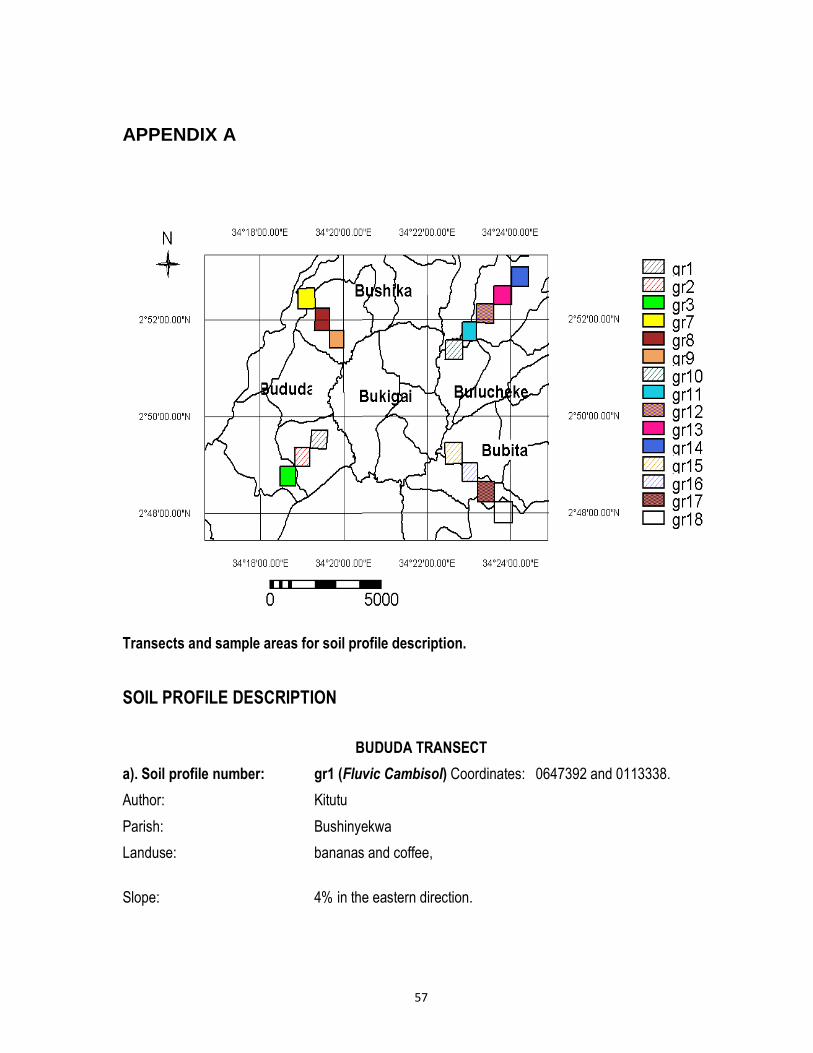
57
APPENDIX A
Transects and sample areas for soil profile description.
SOIL PROFILE DESCRIPTION
BUDUDA TRANSECT
a). Soil profile number: gr1 (Fluvic Cambisol) Coordinates: 0647392 and 0113338.
Author: Kitutu
Parish: Bushinyekwa
Landuse: bananas and coffee,
Slope: 4% in the eastern direction.
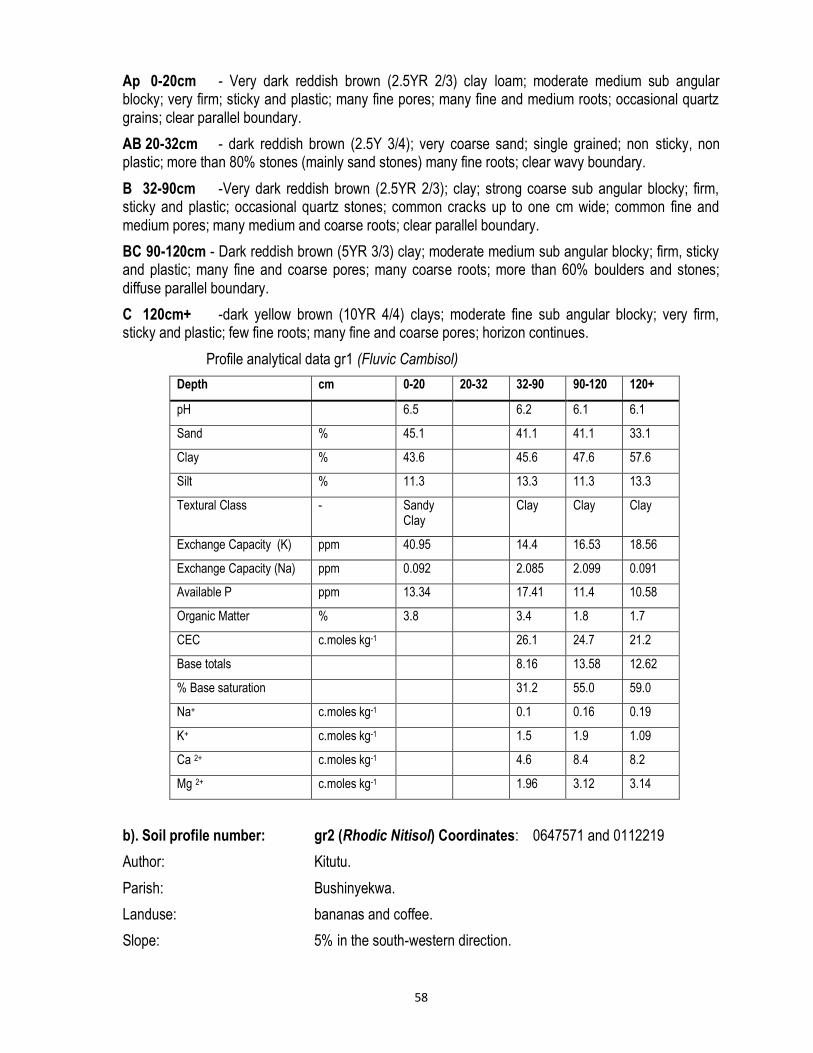
58
Ap 0-20cm - Very dark reddish brown (2.5YR 2/3) clay loam; moderate medium sub angular blocky; very firm; sticky and plastic; many fine pores; many fine and medium roots; occasional quartz grains; clear parallel boundary.
AB 20-32cm - dark reddish brown (2.5Y 3/4); very coarse sand; single grained; non sticky, non plastic; more than 80% stones (mainly sand stones) many fine roots; clear wavy boundary.
B 32-90cm -Very dark reddish brown (2.5YR 2/3); clay; strong coarse sub angular blocky; firm, sticky and plastic; occasional quartz stones; common cracks up to one cm wide; common fine and medium pores; many medium and coarse roots; clear parallel boundary.
BC 90-120cm - Dark reddish brown (5YR 3/3) clay; moderate medium sub angular blocky; firm, sticky and plastic; many fine and coarse pores; many coarse roots; more than 60% boulders and stones; diffuse parallel boundary.
C 120cm+ -dark yellow brown (10YR 4/4) clays; moderate fine sub angular blocky; very firm, sticky and plastic; few fine roots; many fine and coarse pores; horizon continues.
Profile analytical data gr1 (Fluvic Cambisol)
Depth cm 0-20 20-32 32-90 90-120 120+
pH 6.5 6.2 6.1 6.1
Sand % 45.1 41.1 41.1 33.1
Clay % 43.6 45.6 47.6 57.6
Silt % 11.3 13.3 11.3 13.3
Textural Class - Sandy Clay
Clay Clay Clay
Exchange Capacity (K) ppm 40.95 14.4 16.53 18.56
Exchange Capacity (Na) ppm 0.092 2.085 2.099 0.091
Available P ppm 13.34 17.41 11.4 10.58
Organic Matter % 3.8 3.4 1.8 1.7
CEC c.moles kg-1 26.1 24.7 21.2
Base totals 8.16 13.58 12.62
% Base saturation 31.2 55.0 59.0
Na+ c.moles kg-1 0.1 0.16 0.19
K+ c.moles kg-1 1.5 1.9 1.09
Ca 2+ c.moles kg-1 4.6 8.4 8.2
Mg 2+ c.moles kg-1 1.96 3.12 3.14
b). Soil profile number: gr2 (Rhodic Nitisol) Coordinates: 0647571 and 0112219
Author: Kitutu.
Parish: Bushinyekwa.
Landuse: bananas and coffee.
Slope: 5% in the south-western direction.
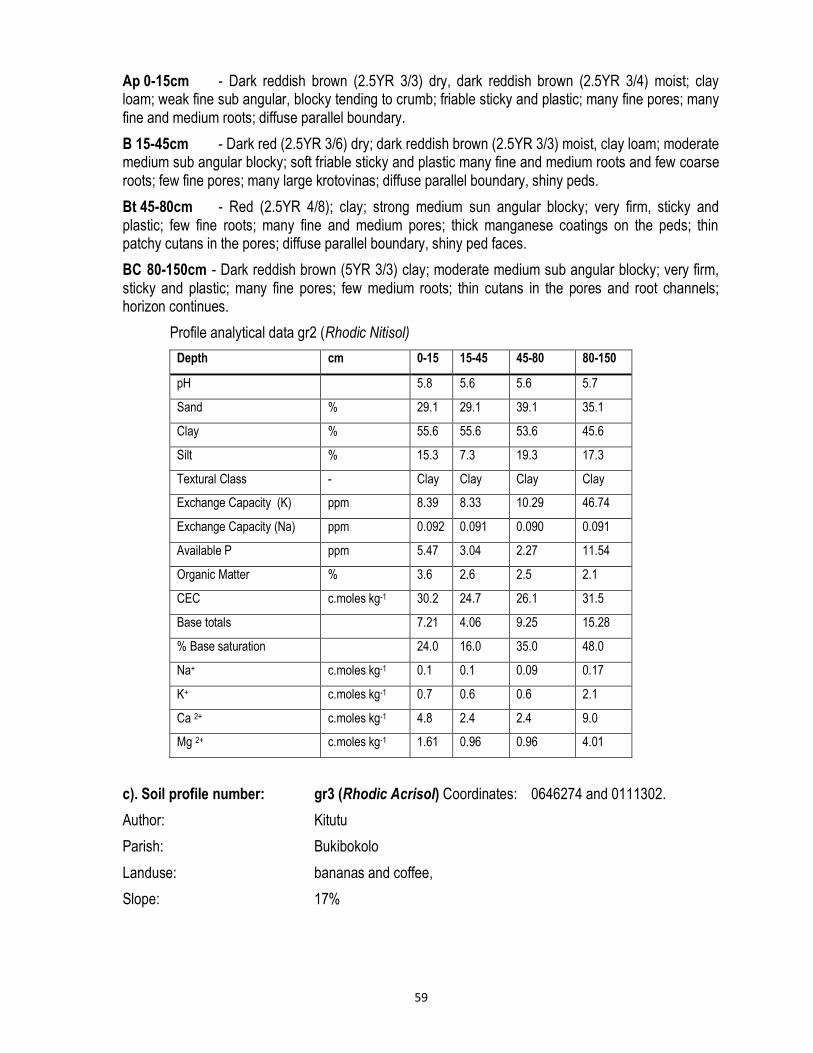
59
Ap 0-15cm - Dark reddish brown (2.5YR 3/3) dry, dark reddish brown (2.5YR 3/4) moist; clay loam; weak fine sub angular, blocky tending to crumb; friable sticky and plastic; many fine pores; many fine and medium roots; diffuse parallel boundary.
B 15-45cm - Dark red (2.5YR 3/6) dry; dark reddish brown (2.5YR 3/3) moist, clay loam; moderate medium sub angular blocky; soft friable sticky and plastic many fine and medium roots and few coarse roots; few fine pores; many large krotovinas; diffuse parallel boundary, shiny peds.
Bt 45-80cm - Red (2.5YR 4/8); clay; strong medium sun angular blocky; very firm, sticky and plastic; few fine roots; many fine and medium pores; thick manganese coatings on the peds; thin patchy cutans in the pores; diffuse parallel boundary, shiny ped faces.
BC 80-150cm - Dark reddish brown (5YR 3/3) clay; moderate medium sub angular blocky; very firm, sticky and plastic; many fine pores; few medium roots; thin cutans in the pores and root channels; horizon continues.
Profile analytical data gr2 (Rhodic Nitisol)
Depth cm 0-15 15-45 45-80 80-150
pH 5.8 5.6 5.6 5.7
Sand % 29.1 29.1 39.1 35.1
Clay % 55.6 55.6 53.6 45.6
Silt % 15.3 7.3 19.3 17.3
Textural Class - Clay Clay Clay Clay
Exchange Capacity (K) ppm 8.39 8.33 10.29 46.74
Exchange Capacity (Na) ppm 0.092 0.091 0.090 0.091
Available P ppm 5.47 3.04 2.27 11.54
Organic Matter % 3.6 2.6 2.5 2.1
CEC c.moles kg-1 30.2 24.7 26.1 31.5
Base totals 7.21 4.06 9.25 15.28
% Base saturation 24.0 16.0 35.0 48.0
Na+ c.moles kg-1 0.1 0.1 0.09 0.17
K+ c.moles kg-1 0.7 0.6 0.6 2.1
Ca 2+ c.moles kg-1 4.8 2.4 2.4 9.0
Mg 2+ c.moles kg-1 1.61 0.96 0.96 4.01
c). Soil profile number: gr3 (Rhodic Acrisol) Coordinates: 0646274 and 0111302.
Author: Kitutu
Parish: Bukibokolo
Landuse: bananas and coffee,
Slope: 17%
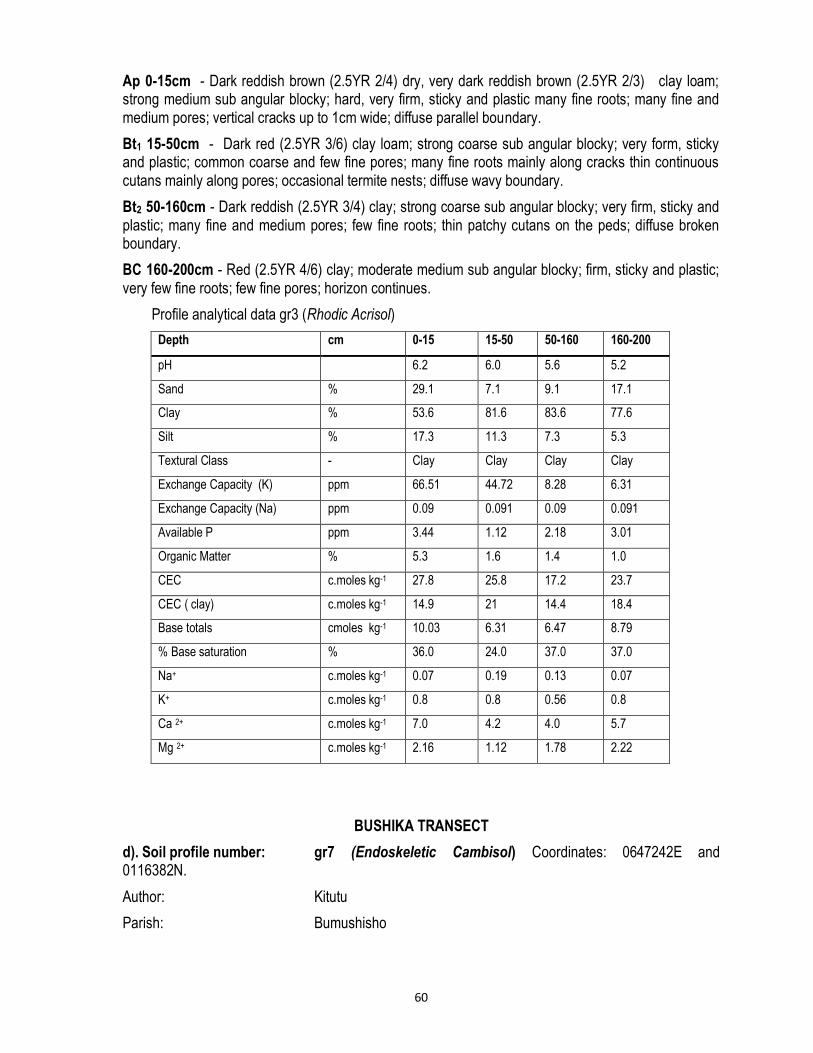
60
Ap 0-15cm - Dark reddish brown (2.5YR 2/4) dry, very dark reddish brown (2.5YR 2/3) clay loam; strong medium sub angular blocky; hard, very firm, sticky and plastic many fine roots; many fine and medium pores; vertical cracks up to 1cm wide; diffuse parallel boundary.
Bt1 15-50cm - Dark red (2.5YR 3/6) clay loam; strong coarse sub angular blocky; very form, sticky and plastic; common coarse and few fine pores; many fine roots mainly along cracks thin continuous cutans mainly along pores; occasional termite nests; diffuse wavy boundary.
Bt2 50-160cm - Dark reddish (2.5YR 3/4) clay; strong coarse sub angular blocky; very firm, sticky and plastic; many fine and medium pores; few fine roots; thin patchy cutans on the peds; diffuse broken boundary.
BC 160-200cm - Red (2.5YR 4/6) clay; moderate medium sub angular blocky; firm, sticky and plastic; very few fine roots; few fine pores; horizon continues.
Profile analytical data gr3 (Rhodic Acrisol)
Depth cm 0-15 15-50 50-160 160-200
pH 6.2 6.0 5.6 5.2
Sand % 29.1 7.1 9.1 17.1
Clay % 53.6 81.6 83.6 77.6
Silt % 17.3 11.3 7.3 5.3
Textural Class - Clay Clay Clay Clay
Exchange Capacity (K) ppm 66.51 44.72 8.28 6.31
Exchange Capacity (Na) ppm 0.09 0.091 0.09 0.091
Available P ppm 3.44 1.12 2.18 3.01
Organic Matter % 5.3 1.6 1.4 1.0
CEC c.moles kg-1 27.8 25.8 17.2 23.7
CEC ( clay) c.moles kg-1 14.9 21 14.4 18.4
Base totals cmoles kg-1 10.03 6.31 6.47 8.79
% Base saturation % 36.0 24.0 37.0 37.0
Na+ c.moles kg-1 0.07 0.19 0.13 0.07
K+ c.moles kg-1 0.8 0.8 0.56 0.8
Ca 2+ c.moles kg-1 7.0 4.2 4.0 5.7
Mg 2+ c.moles kg-1 2.16 1.12 1.78 2.22
BUSHIKA TRANSECT
d). Soil profile number: gr7 (Endoskeletic Cambisol) Coordinates: 0647242E and 0116382N.
Author: Kitutu
Parish: Bumushisho
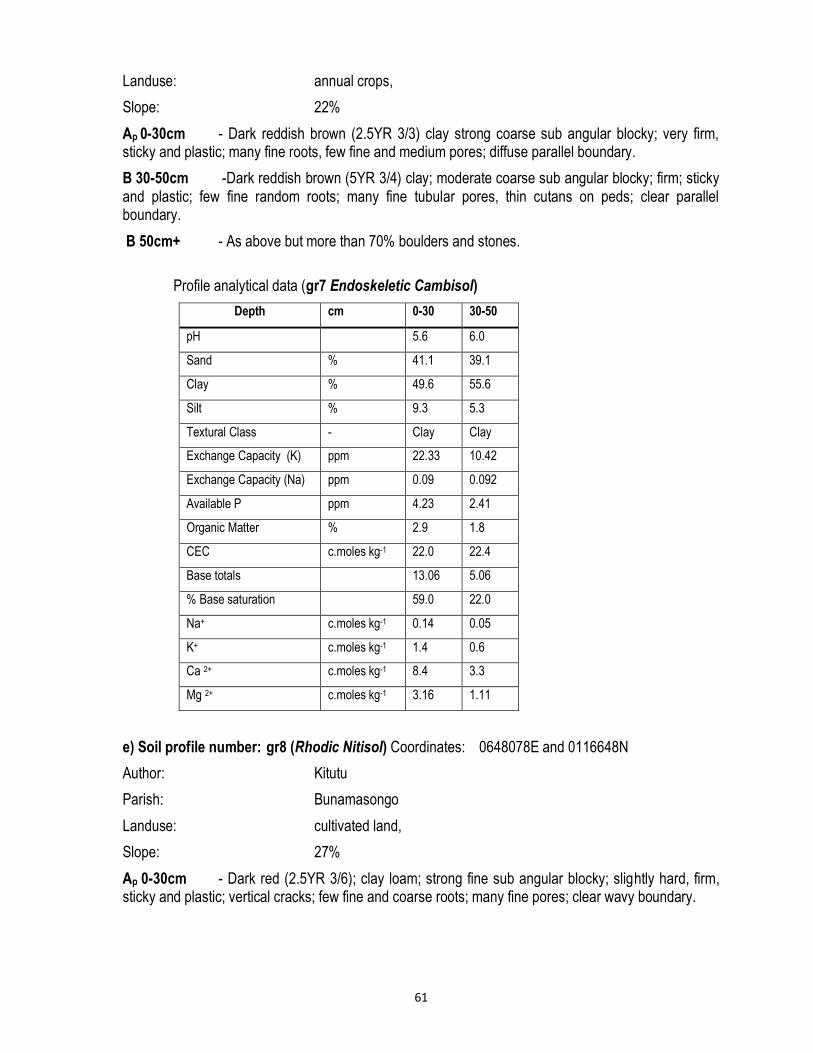
61
Landuse: annual crops,
Slope: 22%
Ap 0-30cm - Dark reddish brown (2.5YR 3/3) clay strong coarse sub angular blocky; very firm, sticky and plastic; many fine roots, few fine and medium pores; diffuse parallel boundary.
B 30-50cm -Dark reddish brown (5YR 3/4) clay; moderate coarse sub angular blocky; firm; sticky and plastic; few fine random roots; many fine tubular pores, thin cutans on peds; clear parallel boundary.
B 50cm+ - As above but more than 70% boulders and stones.
Profile analytical data (gr7 Endoskeletic Cambisol)
Depth cm 0-30 30-50
pH 5.6 6.0
Sand % 41.1 39.1
Clay % 49.6 55.6
Silt % 9.3 5.3
Textural Class - Clay Clay
Exchange Capacity (K) ppm 22.33 10.42
Exchange Capacity (Na) ppm 0.09 0.092
Available P ppm 4.23 2.41
Organic Matter % 2.9 1.8
CEC c.moles kg-1 22.0 22.4
Base totals 13.06 5.06
% Base saturation 59.0 22.0
Na+ c.moles kg-1 0.14 0.05
K+ c.moles kg-1 1.4 0.6
Ca 2+ c.moles kg-1 8.4 3.3
Mg 2+ c.moles kg-1 3.16 1.11
e) Soil profile number: gr8 (Rhodic Nitisol) Coordinates: 0648078E and 0116648N
Author: Kitutu
Parish: Bunamasongo
Landuse: cultivated land,
Slope: 27%
Ap 0-30cm - Dark red (2.5YR 3/6); clay loam; strong fine sub angular blocky; slightly hard, firm, sticky and plastic; vertical cracks; few fine and coarse roots; many fine pores; clear wavy boundary.
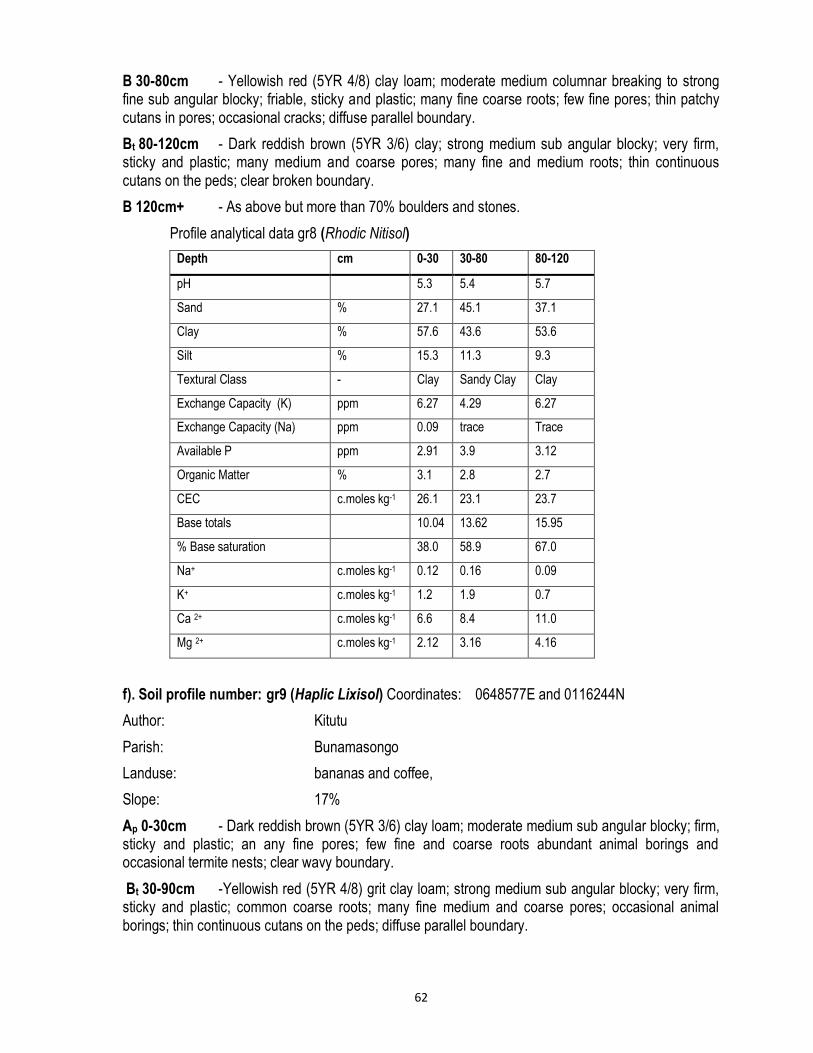
62
B 30-80cm - Yellowish red (5YR 4/8) clay loam; moderate medium columnar breaking to strong fine sub angular blocky; friable, sticky and plastic; many fine coarse roots; few fine pores; thin patchy cutans in pores; occasional cracks; diffuse parallel boundary.
Bt 80-120cm - Dark reddish brown (5YR 3/6) clay; strong medium sub angular blocky; very firm, sticky and plastic; many medium and coarse pores; many fine and medium roots; thin continuous cutans on the peds; clear broken boundary.
B 120cm+ - As above but more than 70% boulders and stones.
Profile analytical data gr8 (Rhodic Nitisol)
Depth cm 0-30 30-80 80-120
pH 5.3 5.4 5.7
Sand % 27.1 45.1 37.1
Clay % 57.6 43.6 53.6
Silt % 15.3 11.3 9.3
Textural Class - Clay Sandy Clay Clay
Exchange Capacity (K) ppm 6.27 4.29 6.27
Exchange Capacity (Na) ppm 0.09 trace Trace
Available P ppm 2.91 3.9 3.12
Organic Matter % 3.1 2.8 2.7
CEC c.moles kg-1 26.1 23.1 23.7
Base totals 10.04 13.62 15.95
% Base saturation 38.0 58.9 67.0
Na+ c.moles kg-1 0.12 0.16 0.09
K+ c.moles kg-1 1.2 1.9 0.7
Ca 2+ c.moles kg-1 6.6 8.4 11.0
Mg 2+ c.moles kg-1 2.12 3.16 4.16
f). Soil profile number: gr9 (Haplic Lixisol) Coordinates: 0648577E and 0116244N
Author: Kitutu
Parish: Bunamasongo
Landuse: bananas and coffee,
Slope: 17%
Ap 0-30cm - Dark reddish brown (5YR 3/6) clay loam; moderate medium sub angular blocky; firm, sticky and plastic; an any fine pores; few fine and coarse roots abundant animal borings and occasional termite nests; clear wavy boundary.
Bt 30-90cm -Yellowish red (5YR 4/8) grit clay loam; strong medium sub angular blocky; very firm, sticky and plastic; common coarse roots; many fine medium and coarse pores; occasional animal borings; thin continuous cutans on the peds; diffuse parallel boundary.
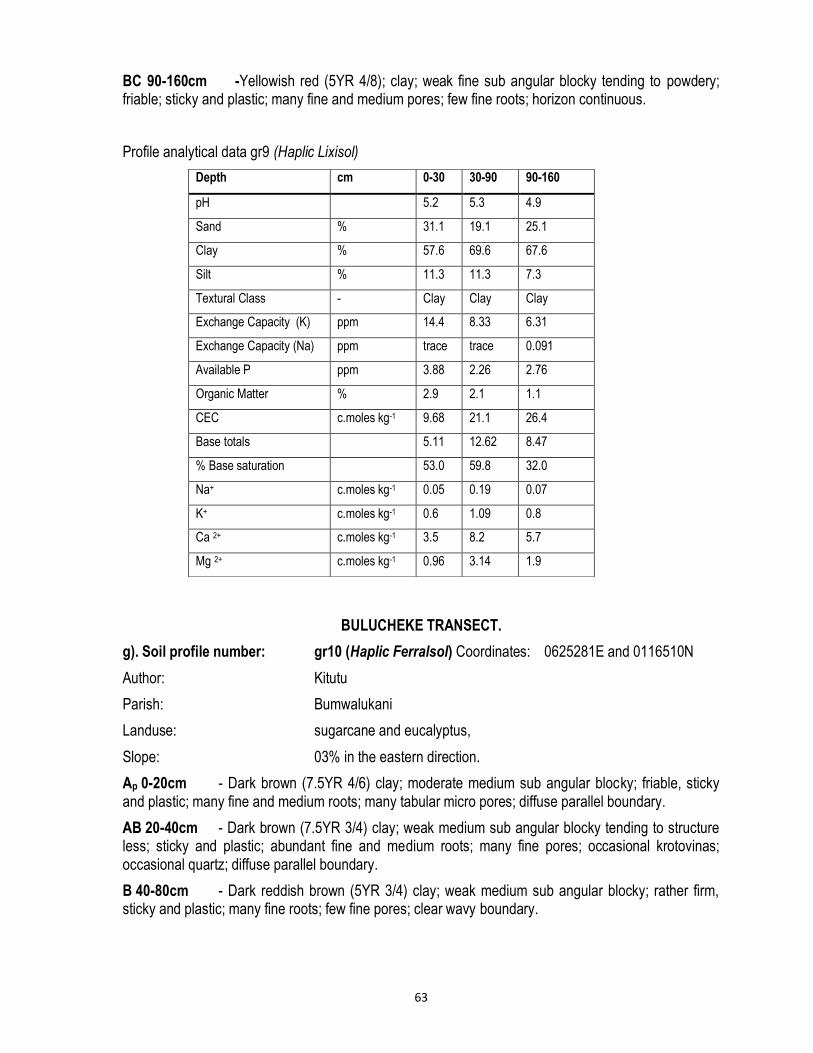
63
BC 90-160cm -Yellowish red (5YR 4/8); clay; weak fine sub angular blocky tending to powdery; friable; sticky and plastic; many fine and medium pores; few fine roots; horizon continuous.
Profile analytical data gr9 (Haplic Lixisol)
BULUCHEKE TRANSECT.
g). Soil profile number: gr10 (Haplic Ferralsol) Coordinates: 0625281E and 0116510N
Author: Kitutu
Parish: Bumwalukani
Landuse: sugarcane and eucalyptus,
Slope: 03% in the eastern direction.
Ap 0-20cm - Dark brown (7.5YR 4/6) clay; moderate medium sub angular blocky; friable, sticky and plastic; many fine and medium roots; many tabular micro pores; diffuse parallel boundary.
AB 20-40cm - Dark brown (7.5YR 3/4) clay; weak medium sub angular blocky tending to structure less; sticky and plastic; abundant fine and medium roots; many fine pores; occasional krotovinas; occasional quartz; diffuse parallel boundary.
B 40-80cm - Dark reddish brown (5YR 3/4) clay; weak medium sub angular blocky; rather firm, sticky and plastic; many fine roots; few fine pores; clear wavy boundary.
Depth cm 0-30 30-90 90-160
pH 5.2 5.3 4.9
Sand % 31.1 19.1 25.1
Clay % 57.6 69.6 67.6
Silt % 11.3 11.3 7.3
Textural Class - Clay Clay Clay
Exchange Capacity (K) ppm 14.4 8.33 6.31
Exchange Capacity (Na) ppm trace trace 0.091
Available P ppm 3.88 2.26 2.76
Organic Matter % 2.9 2.1 1.1
CEC c.moles kg-1 9.68 21.1 26.4
Base totals 5.11 12.62 8.47
% Base saturation 53.0 59.8 32.0
Na+ c.moles kg-1 0.05 0.19 0.07
K+ c.moles kg-1 0.6 1.09 0.8
Ca 2+ c.moles kg-1 3.5 8.2 5.7
Mg 2+ c.moles kg-1 0.96 3.14 1.9
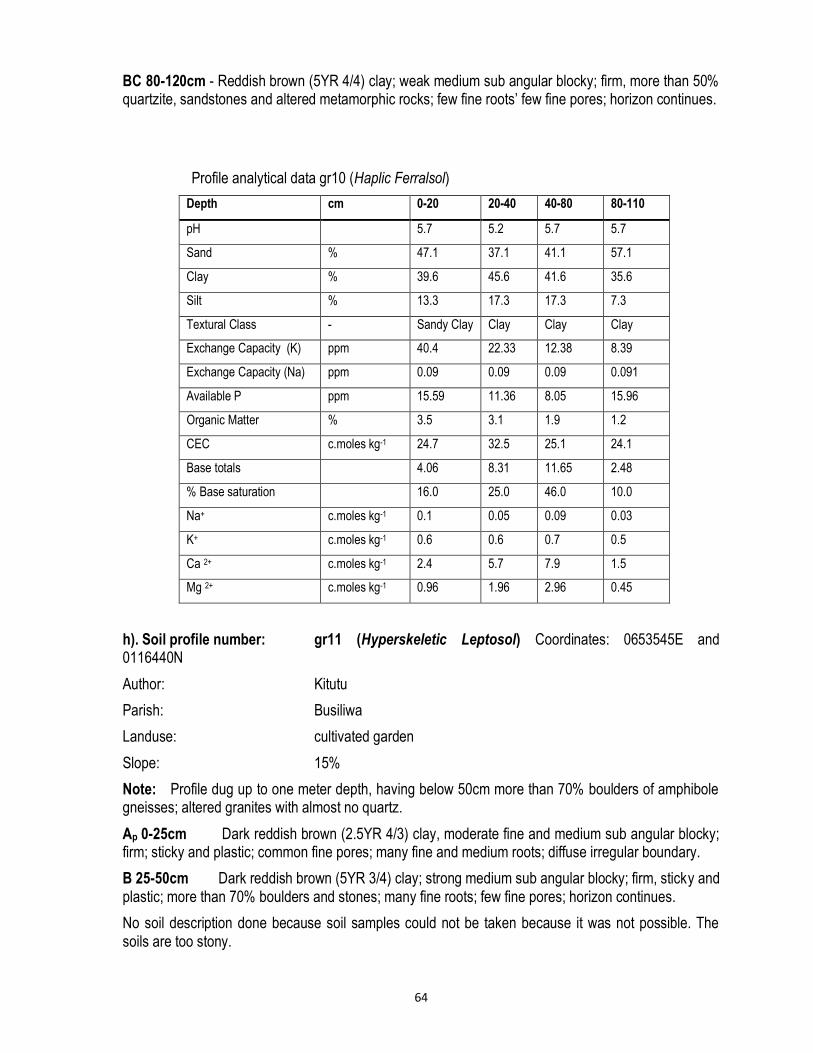
64
BC 80-120cm - Reddish brown (5YR 4/4) clay; weak medium sub angular blocky; firm, more than 50% quartzite, sandstones and altered metamorphic rocks; few fine roots’ few fine pores; horizon continues.
Profile analytical data gr10 (Haplic Ferralsol)
Depth cm 0-20 20-40 40-80 80-110
pH 5.7 5.2 5.7 5.7
Sand % 47.1 37.1 41.1 57.1
Clay % 39.6 45.6 41.6 35.6
Silt % 13.3 17.3 17.3 7.3
Textural Class - Sandy Clay Clay Clay Clay
Exchange Capacity (K) ppm 40.4 22.33 12.38 8.39
Exchange Capacity (Na) ppm 0.09 0.09 0.09 0.091
Available P ppm 15.59 11.36 8.05 15.96
Organic Matter % 3.5 3.1 1.9 1.2
CEC c.moles kg-1 24.7 32.5 25.1 24.1
Base totals 4.06 8.31 11.65 2.48
% Base saturation 16.0 25.0 46.0 10.0
Na+ c.moles kg-1 0.1 0.05 0.09 0.03
K+ c.moles kg-1 0.6 0.6 0.7 0.5
Ca 2+ c.moles kg-1 2.4 5.7 7.9 1.5
Mg 2+ c.moles kg-1 0.96 1.96 2.96 0.45
h). Soil profile number: gr11 (Hyperskeletic Leptosol) Coordinates: 0653545E and 0116440N
Author: Kitutu
Parish: Busiliwa
Landuse: cultivated garden
Slope: 15%
Note: Profile dug up to one meter depth, having below 50cm more than 70% boulders of amphibole gneisses; altered granites with almost no quartz.
Ap 0-25cm Dark reddish brown (2.5YR 4/3) clay, moderate fine and medium sub angular blocky; firm; sticky and plastic; common fine pores; many fine and medium roots; diffuse irregular boundary.
B 25-50cm Dark reddish brown (5YR 3/4) clay; strong medium sub angular blocky; firm, sticky and plastic; more than 70% boulders and stones; many fine roots; few fine pores; horizon continues.
No soil description done because soil samples could not be taken because it was not possible. The soils are too stony.
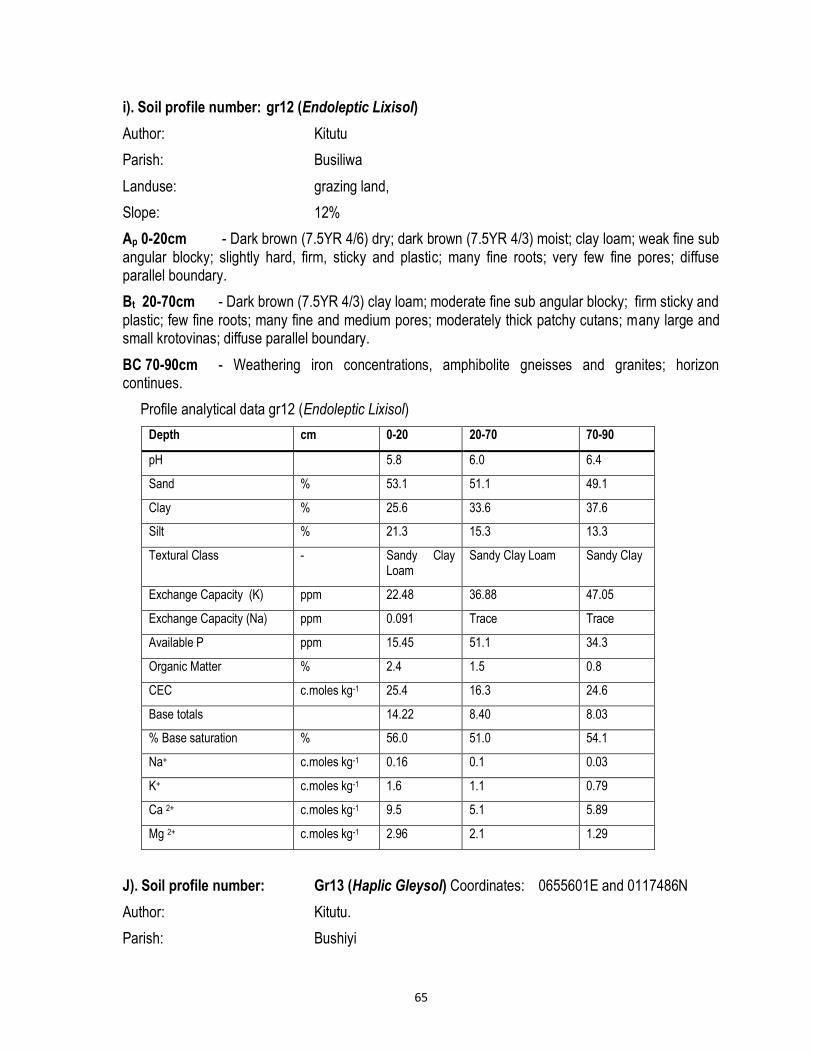
65
i). Soil profile number: gr12 (Endoleptic Lixisol)
Author: Kitutu
Parish: Busiliwa
Landuse: grazing land,
Slope: 12%
Ap 0-20cm - Dark brown (7.5YR 4/6) dry; dark brown (7.5YR 4/3) moist; clay loam; weak fine sub angular blocky; slightly hard, firm, sticky and plastic; many fine roots; very few fine pores; diffuse parallel boundary.
Bt 20-70cm - Dark brown (7.5YR 4/3) clay loam; moderate fine sub angular blocky; firm sticky and plastic; few fine roots; many fine and medium pores; moderately thick patchy cutans; many large and small krotovinas; diffuse parallel boundary.
BC 70-90cm - Weathering iron concentrations, amphibolite gneisses and granites; horizon continues.
Profile analytical data gr12 (Endoleptic Lixisol)
Depth cm 0-20 20-70 70-90
pH 5.8 6.0 6.4
Sand % 53.1 51.1 49.1
Clay % 25.6 33.6 37.6
Silt % 21.3 15.3 13.3
Textural Class - Sandy Clay Loam
Sandy Clay Loam Sandy Clay
Exchange Capacity (K) ppm 22.48 36.88 47.05
Exchange Capacity (Na) ppm 0.091 Trace Trace
Available P ppm 15.45 51.1 34.3
Organic Matter % 2.4 1.5 0.8
CEC c.moles kg-1 25.4 16.3 24.6
Base totals 14.22 8.40 8.03
% Base saturation % 56.0 51.0 54.1
Na+ c.moles kg-1 0.16 0.1 0.03
K+ c.moles kg-1 1.6 1.1 0.79
Ca 2+ c.moles kg-1 9.5 5.1 5.89
Mg 2+ c.moles kg-1 2.96 2.1 1.29
J). Soil profile number: Gr13 (Haplic Gleysol) Coordinates: 0655601E and 0117486N
Author: Kitutu.
Parish: Bushiyi
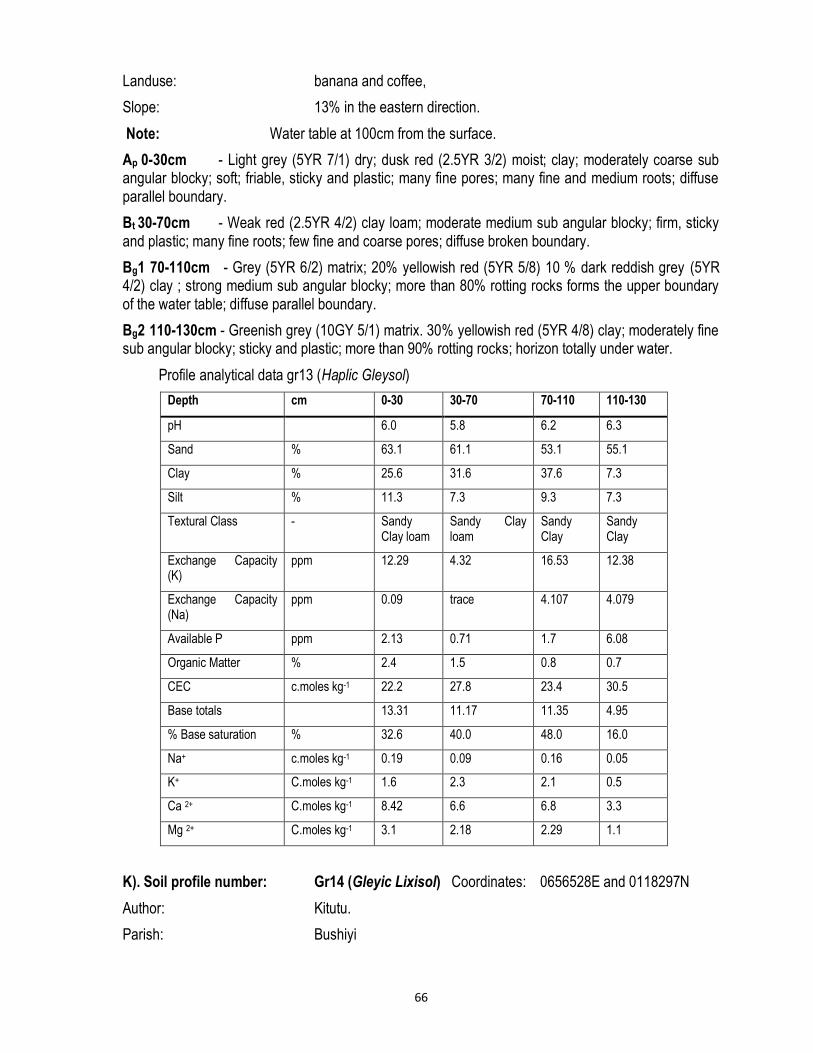
66
Landuse: banana and coffee,
Slope: 13% in the eastern direction.
Note: Water table at 100cm from the surface.
Ap 0-30cm - Light grey (5YR 7/1) dry; dusk red (2.5YR 3/2) moist; clay; moderately coarse sub angular blocky; soft; friable, sticky and plastic; many fine pores; many fine and medium roots; diffuse parallel boundary.
Bt 30-70cm - Weak red (2.5YR 4/2) clay loam; moderate medium sub angular blocky; firm, sticky and plastic; many fine roots; few fine and coarse pores; diffuse broken boundary.
Bg1 70-110cm - Grey (5YR 6/2) matrix; 20% yellowish red (5YR 5/8) 10 % dark reddish grey (5YR 4/2) clay ; strong medium sub angular blocky; more than 80% rotting rocks forms the upper boundary of the water table; diffuse parallel boundary.
Bg2 110-130cm - Greenish grey (10GY 5/1) matrix. 30% yellowish red (5YR 4/8) clay; moderately fine sub angular blocky; sticky and plastic; more than 90% rotting rocks; horizon totally under water.
Profile analytical data gr13 (Haplic Gleysol)
Depth cm 0-30 30-70 70-110 110-130
pH 6.0 5.8 6.2 6.3
Sand % 63.1 61.1 53.1 55.1
Clay % 25.6 31.6 37.6 7.3
Silt % 11.3 7.3 9.3 7.3
Textural Class - Sandy Clay loam
Sandy Clay loam
Sandy Clay
Sandy Clay
Exchange Capacity (K)
ppm 12.29 4.32 16.53 12.38
Exchange Capacity (Na)
ppm 0.09 trace 4.107 4.079
Available P ppm 2.13 0.71 1.7 6.08
Organic Matter % 2.4 1.5 0.8 0.7
CEC c.moles kg-1 22.2 27.8 23.4 30.5
Base totals 13.31 11.17 11.35 4.95
% Base saturation % 32.6 40.0 48.0 16.0
Na+ c.moles kg-1 0.19 0.09 0.16 0.05
K+ C.moles kg-1 1.6 2.3 2.1 0.5
Ca 2+ C.moles kg-1 8.42 6.6 6.8 3.3
Mg 2+ C.moles kg-1 3.1 2.18 2.29 1.1
K). Soil profile number: Gr14 (Gleyic Lixisol) Coordinates: 0656528E and 0118297N
Author: Kitutu.
Parish: Bushiyi
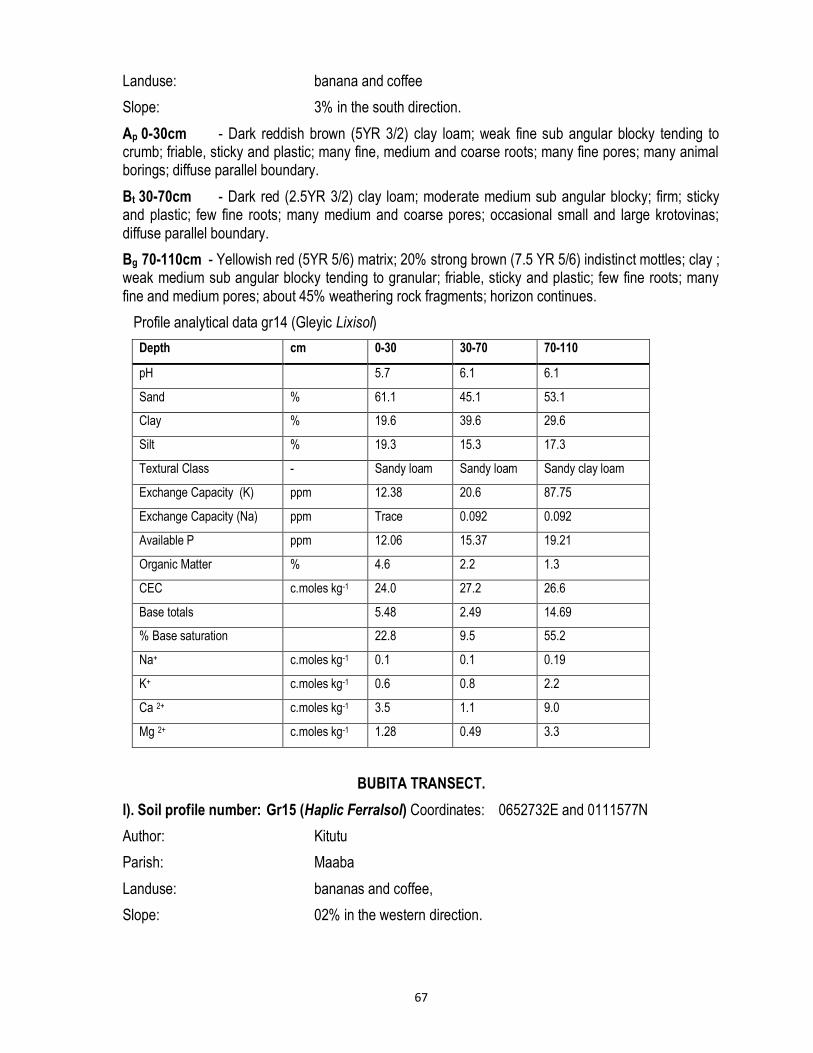
67
Landuse: banana and coffee
Slope: 3% in the south direction.
Ap 0-30cm - Dark reddish brown (5YR 3/2) clay loam; weak fine sub angular blocky tending to crumb; friable, sticky and plastic; many fine, medium and coarse roots; many fine pores; many animal borings; diffuse parallel boundary.
Bt 30-70cm - Dark red (2.5YR 3/2) clay loam; moderate medium sub angular blocky; firm; sticky and plastic; few fine roots; many medium and coarse pores; occasional small and large krotovinas; diffuse parallel boundary.
Bg 70-110cm - Yellowish red (5YR 5/6) matrix; 20% strong brown (7.5 YR 5/6) indistinct mottles; clay ; weak medium sub angular blocky tending to granular; friable, sticky and plastic; few fine roots; many fine and medium pores; about 45% weathering rock fragments; horizon continues.
Profile analytical data gr14 (Gleyic Lixisol)
Depth cm 0-30 30-70 70-110
pH 5.7 6.1 6.1
Sand % 61.1 45.1 53.1
Clay % 19.6 39.6 29.6
Silt % 19.3 15.3 17.3
Textural Class - Sandy loam Sandy loam Sandy clay loam
Exchange Capacity (K) ppm 12.38 20.6 87.75
Exchange Capacity (Na) ppm Trace 0.092 0.092
Available P ppm 12.06 15.37 19.21
Organic Matter % 4.6 2.2 1.3
CEC c.moles kg-1 24.0 27.2 26.6
Base totals 5.48 2.49 14.69
% Base saturation 22.8 9.5 55.2
Na+ c.moles kg-1 0.1 0.1 0.19
K+ c.moles kg-1 0.6 0.8 2.2
Ca 2+ c.moles kg-1 3.5 1.1 9.0
Mg 2+ c.moles kg-1 1.28 0.49 3.3
BUBITA TRANSECT.
l). Soil profile number: Gr15 (Haplic Ferralsol) Coordinates: 0652732E and 0111577N
Author: Kitutu
Parish: Maaba
Landuse: bananas and coffee,
Slope: 02% in the western direction.
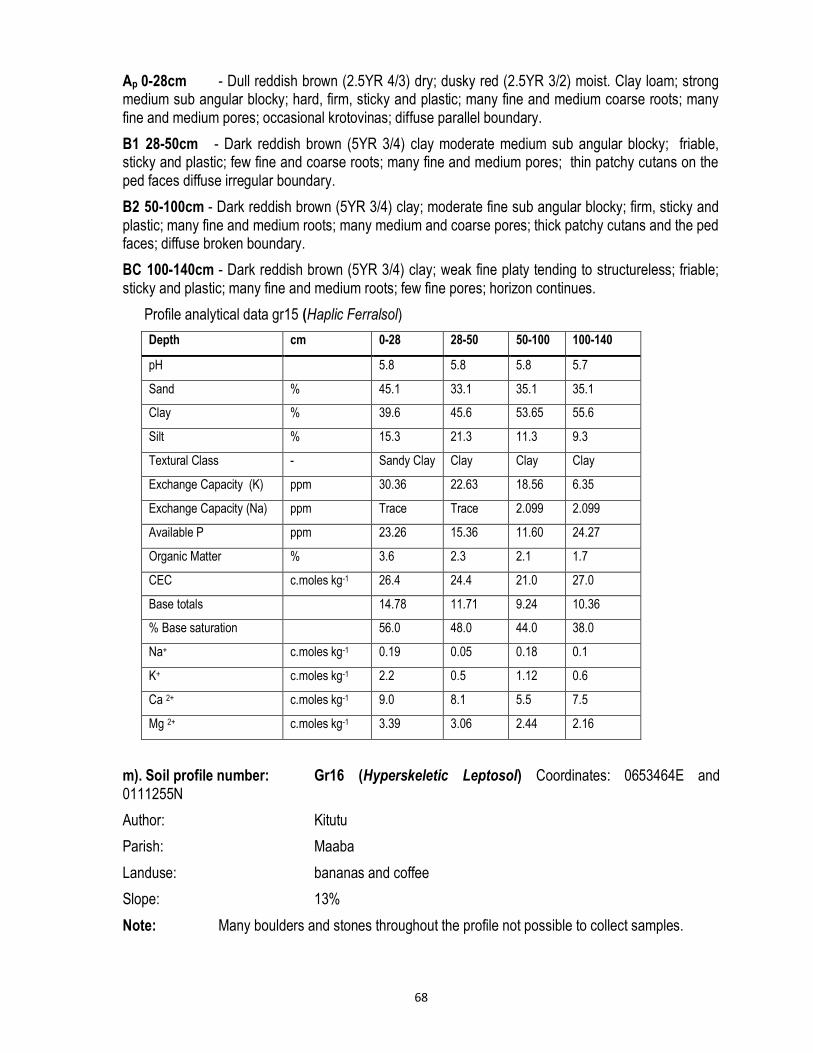
68
Ap 0-28cm - Dull reddish brown (2.5YR 4/3) dry; dusky red (2.5YR 3/2) moist. Clay loam; strong medium sub angular blocky; hard, firm, sticky and plastic; many fine and medium coarse roots; many fine and medium pores; occasional krotovinas; diffuse parallel boundary.
B1 28-50cm - Dark reddish brown (5YR 3/4) clay moderate medium sub angular blocky; friable, sticky and plastic; few fine and coarse roots; many fine and medium pores; thin patchy cutans on the ped faces diffuse irregular boundary.
B2 50-100cm - Dark reddish brown (5YR 3/4) clay; moderate fine sub angular blocky; firm, sticky and plastic; many fine and medium roots; many medium and coarse pores; thick patchy cutans and the ped faces; diffuse broken boundary.
BC 100-140cm - Dark reddish brown (5YR 3/4) clay; weak fine platy tending to structureless; friable; sticky and plastic; many fine and medium roots; few fine pores; horizon continues.
Profile analytical data gr15 (Haplic Ferralsol)
Depth cm 0-28 28-50 50-100 100-140
pH 5.8 5.8 5.8 5.7
Sand % 45.1 33.1 35.1 35.1
Clay % 39.6 45.6 53.65 55.6
Silt % 15.3 21.3 11.3 9.3
Textural Class - Sandy Clay Clay Clay Clay
Exchange Capacity (K) ppm 30.36 22.63 18.56 6.35
Exchange Capacity (Na) ppm Trace Trace 2.099 2.099
Available P ppm 23.26 15.36 11.60 24.27
Organic Matter % 3.6 2.3 2.1 1.7
CEC c.moles kg-1 26.4 24.4 21.0 27.0
Base totals 14.78 11.71 9.24 10.36
% Base saturation 56.0 48.0 44.0 38.0
Na+ c.moles kg-1 0.19 0.05 0.18 0.1
K+ c.moles kg-1 2.2 0.5 1.12 0.6
Ca 2+ c.moles kg-1 9.0 8.1 5.5 7.5
Mg 2+ c.moles kg-1 3.39 3.06 2.44 2.16
m). Soil profile number: Gr16 (Hyperskeletic Leptosol) Coordinates: 0653464E and 0111255N
Author: Kitutu
Parish: Maaba
Landuse: bananas and coffee
Slope: 13%
Note: Many boulders and stones throughout the profile not possible to collect samples.
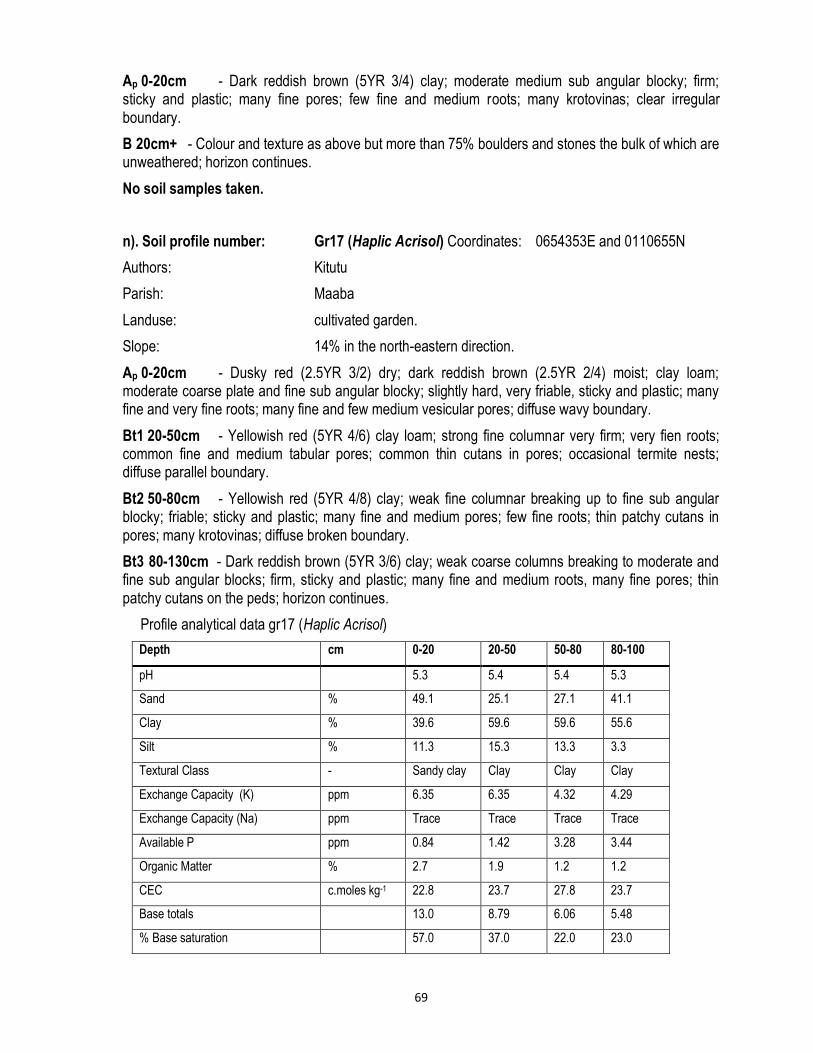
69
Ap 0-20cm - Dark reddish brown (5YR 3/4) clay; moderate medium sub angular blocky; firm; sticky and plastic; many fine pores; few fine and medium roots; many krotovinas; clear irregular boundary.
B 20cm+ - Colour and texture as above but more than 75% boulders and stones the bulk of which are unweathered; horizon continues.
No soil samples taken.
n). Soil profile number: Gr17 (Haplic Acrisol) Coordinates: 0654353E and 0110655N
Authors: Kitutu
Parish: Maaba
Landuse: cultivated garden.
Slope: 14% in the north-eastern direction.
Ap 0-20cm - Dusky red (2.5YR 3/2) dry; dark reddish brown (2.5YR 2/4) moist; clay loam; moderate coarse plate and fine sub angular blocky; slightly hard, very friable, sticky and plastic; many fine and very fine roots; many fine and few medium vesicular pores; diffuse wavy boundary.
Bt1 20-50cm - Yellowish red (5YR 4/6) clay loam; strong fine columnar very firm; very fien roots; common fine and medium tabular pores; common thin cutans in pores; occasional termite nests; diffuse parallel boundary.
Bt2 50-80cm - Yellowish red (5YR 4/8) clay; weak fine columnar breaking up to fine sub angular blocky; friable; sticky and plastic; many fine and medium pores; few fine roots; thin patchy cutans in pores; many krotovinas; diffuse broken boundary.
Bt3 80-130cm - Dark reddish brown (5YR 3/6) clay; weak coarse columns breaking to moderate and fine sub angular blocks; firm, sticky and plastic; many fine and medium roots, many fine pores; thin patchy cutans on the peds; horizon continues.
Profile analytical data gr17 (Haplic Acrisol)
Depth cm 0-20 20-50 50-80 80-100
pH 5.3 5.4 5.4 5.3
Sand % 49.1 25.1 27.1 41.1
Clay % 39.6 59.6 59.6 55.6
Silt % 11.3 15.3 13.3 3.3
Textural Class - Sandy clay Clay Clay Clay
Exchange Capacity (K) ppm 6.35 6.35 4.32 4.29
Exchange Capacity (Na) ppm Trace Trace Trace Trace
Available P ppm 0.84 1.42 3.28 3.44
Organic Matter % 2.7 1.9 1.2 1.2
CEC c.moles kg-1 22.8 23.7 27.8 23.7
Base totals 13.0 8.79 6.06 5.48
% Base saturation 57.0 37.0 22.0 23.0
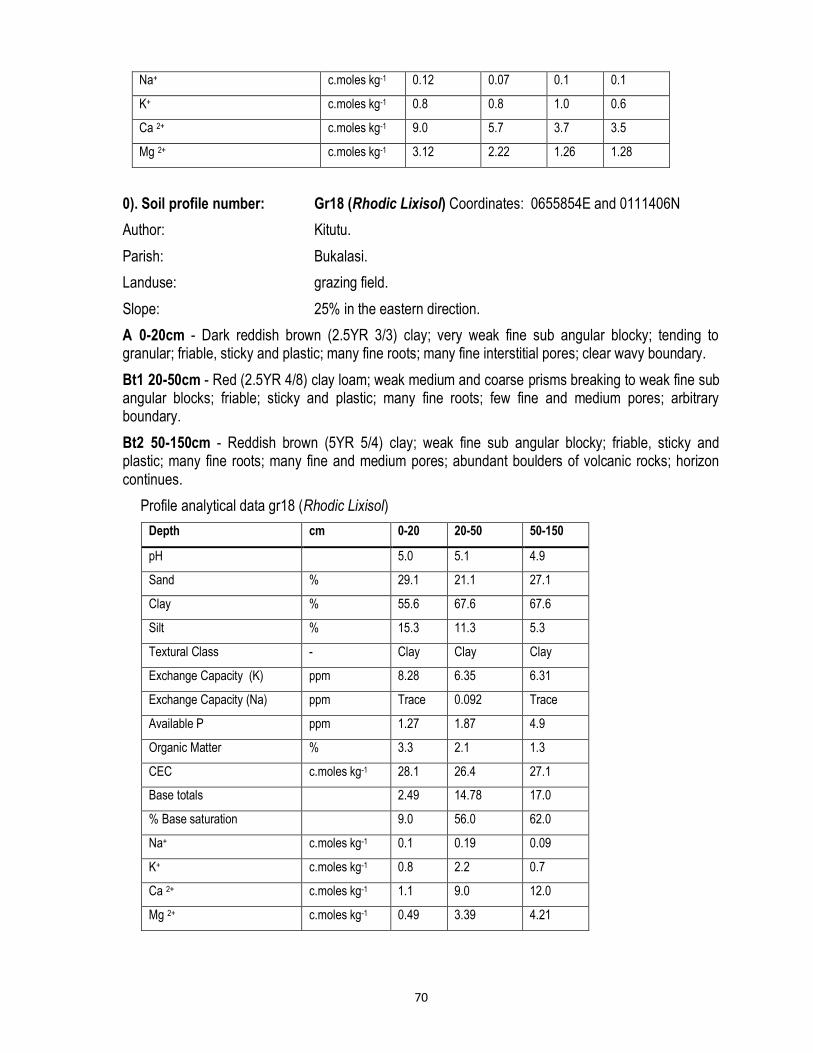
70
Na+ c.moles kg-1 0.12 0.07 0.1 0.1
K+ c.moles kg-1 0.8 0.8 1.0 0.6
Ca 2+ c.moles kg-1 9.0 5.7 3.7 3.5
Mg 2+ c.moles kg-1 3.12 2.22 1.26 1.28
0). Soil profile number: Gr18 (Rhodic Lixisol) Coordinates: 0655854E and 0111406N
Author: Kitutu.
Parish: Bukalasi.
Landuse: grazing field.
Slope: 25% in the eastern direction.
A 0-20cm - Dark reddish brown (2.5YR 3/3) clay; very weak fine sub angular blocky; tending to granular; friable, sticky and plastic; many fine roots; many fine interstitial pores; clear wavy boundary.
Bt1 20-50cm - Red (2.5YR 4/8) clay loam; weak medium and coarse prisms breaking to weak fine sub angular blocks; friable; sticky and plastic; many fine roots; few fine and medium pores; arbitrary boundary.
Bt2 50-150cm - Reddish brown (5YR 5/4) clay; weak fine sub angular blocky; friable, sticky and plastic; many fine roots; many fine and medium pores; abundant boulders of volcanic rocks; horizon continues.
Profile analytical data gr18 (Rhodic Lixisol)
Depth cm 0-20 20-50 50-150
pH 5.0 5.1 4.9
Sand % 29.1 21.1 27.1
Clay % 55.6 67.6 67.6
Silt % 15.3 11.3 5.3
Textural Class - Clay Clay Clay
Exchange Capacity (K) ppm 8.28 6.35 6.31
Exchange Capacity (Na) ppm Trace 0.092 Trace
Available P ppm 1.27 1.87 4.9
Organic Matter % 3.3 2.1 1.3
CEC c.moles kg-1 28.1 26.4 27.1
Base totals 2.49 14.78 17.0
% Base saturation 9.0 56.0 62.0
Na+ c.moles kg-1 0.1 0.19 0.09
K+ c.moles kg-1 0.8 2.2 0.7
Ca 2+ c.moles kg-1 1.1 9.0 12.0
Mg 2+ c.moles kg-1 0.49 3.39 4.21
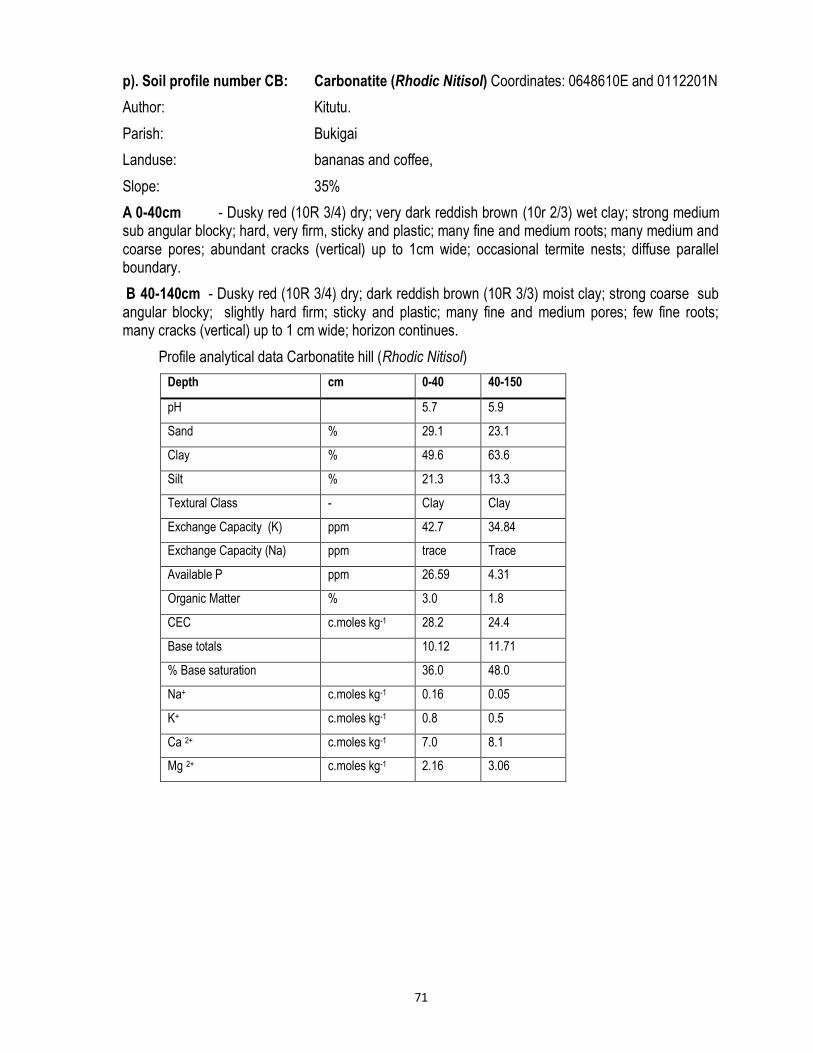
71
p). Soil profile number CB: Carbonatite (Rhodic Nitisol) Coordinates: 0648610E and 0112201N
Author: Kitutu.
Parish: Bukigai
Landuse: bananas and coffee,
Slope: 35%
A 0-40cm - Dusky red (10R 3/4) dry; very dark reddish brown (10r 2/3) wet clay; strong medium sub angular blocky; hard, very firm, sticky and plastic; many fine and medium roots; many medium and coarse pores; abundant cracks (vertical) up to 1cm wide; occasional termite nests; diffuse parallel boundary.
B 40-140cm - Dusky red (10R 3/4) dry; dark reddish brown (10R 3/3) moist clay; strong coarse sub angular blocky; slightly hard firm; sticky and plastic; many fine and medium pores; few fine roots; many cracks (vertical) up to 1 cm wide; horizon continues.
Profile analytical data Carbonatite hill (Rhodic Nitisol)
Depth cm 0-40 40-150
pH 5.7 5.9
Sand % 29.1 23.1
Clay % 49.6 63.6
Silt % 21.3 13.3
Textural Class - Clay Clay
Exchange Capacity (K) ppm 42.7 34.84
Exchange Capacity (Na) ppm trace Trace
Available P ppm 26.59 4.31
Organic Matter % 3.0 1.8
CEC c.moles kg-1 28.2 24.4
Base totals 10.12 11.71
% Base saturation 36.0 48.0
Na+ c.moles kg-1 0.16 0.05
K+ c.moles kg-1 0.8 0.5
Ca 2+ c.moles kg-1 7.0 8.1
Mg 2+ c.moles kg-1 2.16 3.06
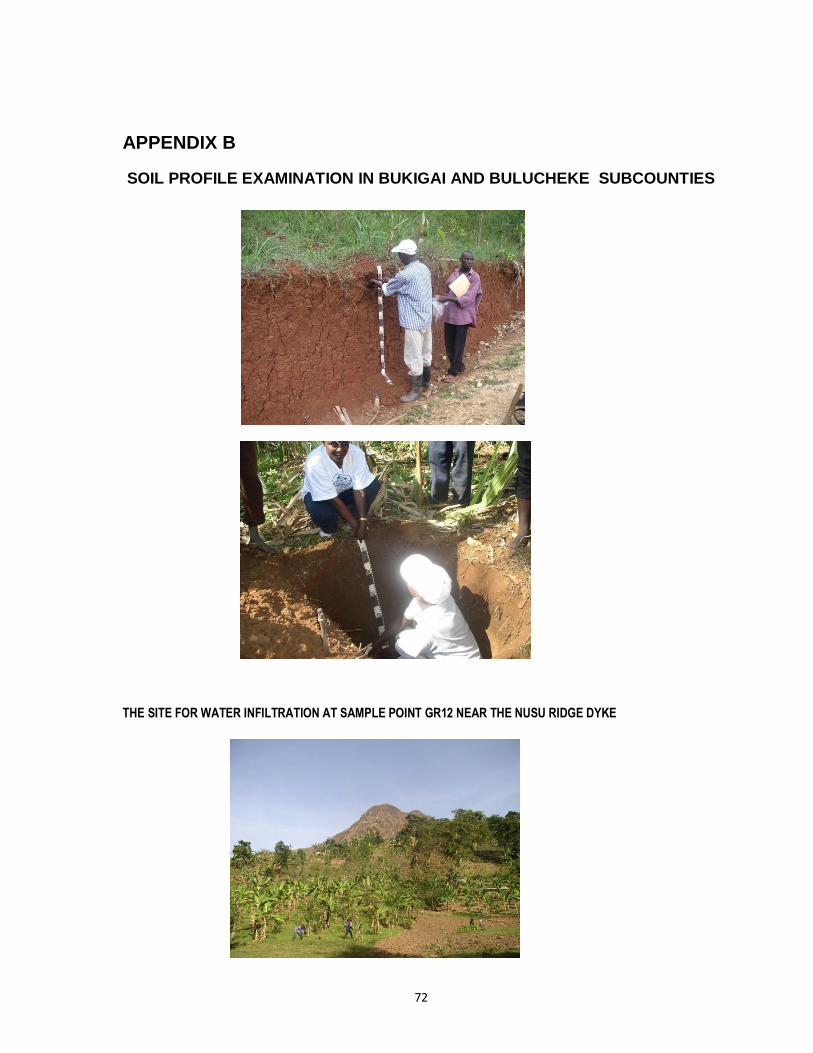
72
APPENDIX B
SOIL PROFILE EXAMINATION IN BUKIGAI AND BULUCHEKE SUBCOUNTIES
THE SITE FOR WATER INFILTRATION AT SAMPLE POINT GR12 NEAR THE NUSU RIDGE DYKE

73
APPENDIX C
STRUCTURED - INTERVIEW SHEET FOR BUDUDA DISTRICT. MAY 2004
1.0 Personal Information
1.1 Date of the interview
1.2 Name of Sub County
1.3 Name of Parish
1.4 Name of the village
1.5 Name of Person
1.6 Age of the person
1.7 Education level
1.8 What is your occupation?
2.0 Landlessness due to landslides.
2.1 How much land do you own?
2.2 Is the land sufficient for your needs?
2.3 Are there any people without land?
2.4 If yes, why don‟t they have land?
3.0 Changes in landuse.
3.1 Has there been any change in landuse?
3.2 If yes, describe the landuse change during each of the following period.
1. Before 1960
2 1960 to 1970
3 1970 to 1980
4 1980 to 1990

74
5 1990 to 2000
3.2 Explain why the land was used that way in each period above.
1. Before 1960
2 1960 to 1970
3 1970 to 1980
4 1980 to 1990
5 1990 to 2000
4.0 Where do the landslides occur?
4.1 Have you ever experienced landslides on your land?
4.2 If yes, how severe was it?
4.3 Do you know of other people who have experienced landslides on their land?
4.4 If yes, where
4.5 Can you describe how an area where a landslide is likely to occur looks like in terms
of slope steepness, slope form and vegetation cover?
4.6 What are the type of soils in areas where landslides occur.
4.7 Do you know areas where landslides do not occur?
4.8 Would you give reasons why the landslides do not occur in these soils?
4.9 What are the type of the soils in these areas?
4.10 Do you know any forested area where landslides have occurred?
4.11 If yes where?
5.0 When do landslides occur?
5.1 During which months did landslides occur?
5.2 What was the rainfall pattern in these months?
5.3 In which years did you experience many landslides?
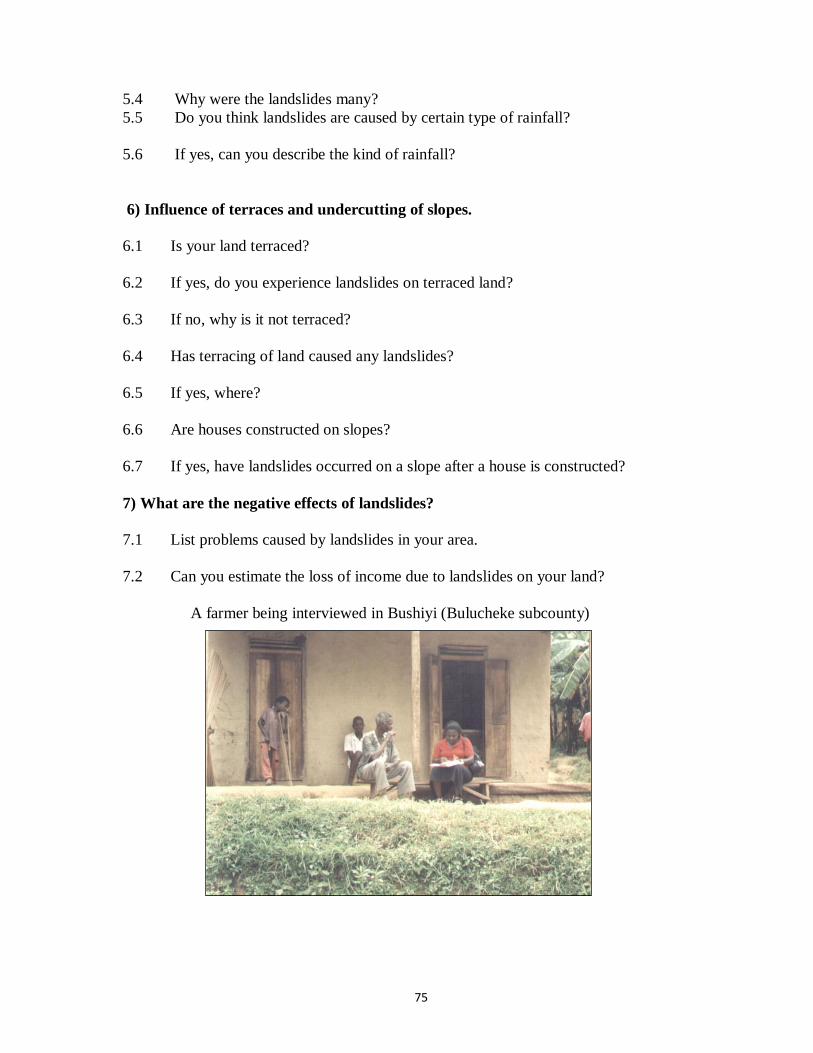
75
5.4 Why were the landslides many?
5.5 Do you think landslides are caused by certain type of rainfall?
5.6 If yes, can you describe the kind of rainfall?
6) Influence of terraces and undercutting of slopes.
6.1 Is your land terraced?
6.2 If yes, do you experience landslides on terraced land?
6.3 If no, why is it not terraced?
6.4 Has terracing of land caused any landslides?
6.5 If yes, where?
6.6 Are houses constructed on slopes?
6.7 If yes, have landslides occurred on a slope after a house is constructed?
7) What are the negative effects of landslides?
7.1 List problems caused by landslides in your area.
7.2 Can you estimate the loss of income due to landslides on your land?
A farmer being interviewed in Bushiyi (Bulucheke subcounty)
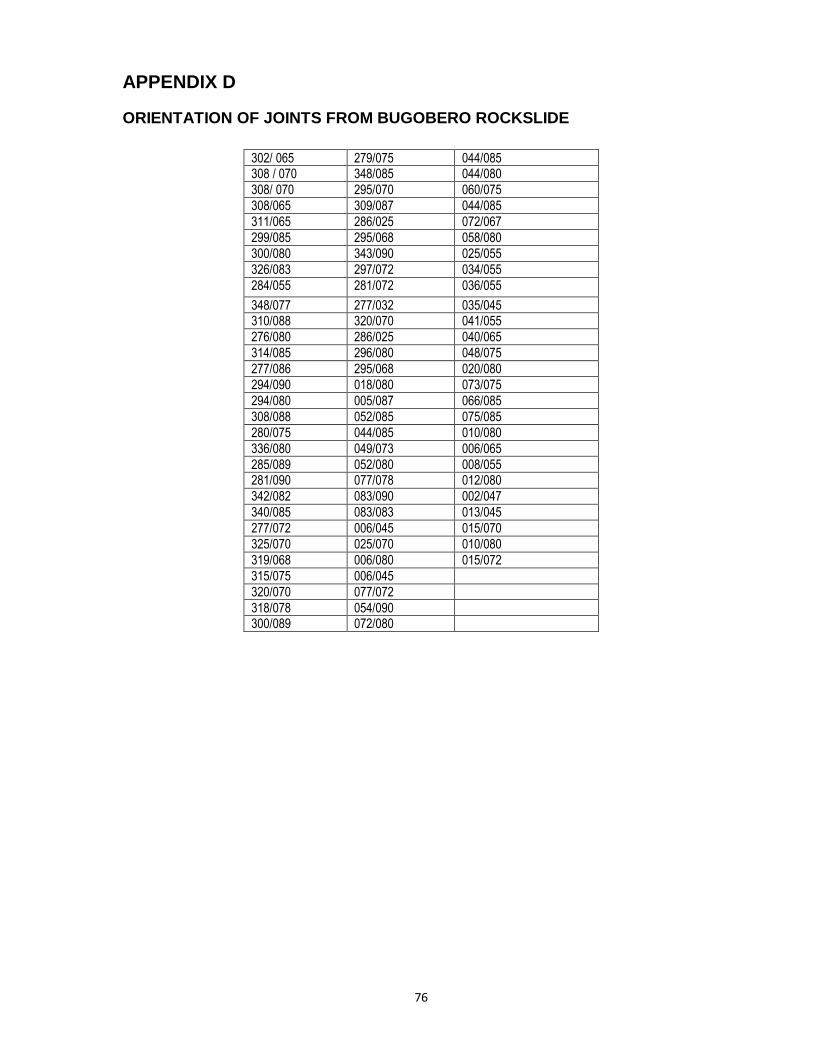
76
APPENDIX D
ORIENTATION OF JOINTS FROM BUGOBERO ROCKSLIDE
302/ 065 279/075 044/085 308 / 070 348/085 044/080
308/ 070 295/070 060/075
308/065 309/087 044/085
311/065 286/025 072/067
299/085 295/068 058/080
300/080 343/090 025/055
326/083 297/072 034/055
284/055 281/072 036/055
348/077 277/032 035/045 310/088 320/070 041/055
276/080 286/025 040/065
314/085 296/080 048/075
277/086 295/068 020/080
294/090 018/080 073/075
294/080 005/087 066/085
308/088 052/085 075/085
280/075 044/085 010/080
336/080 049/073 006/065
285/089 052/080 008/055 281/090 077/078 012/080
342/082 083/090 002/047
340/085 083/083 013/045
277/072 006/045 015/070
325/070 025/070 010/080
319/068 006/080 015/072
315/075 006/045
320/070 077/072
318/078 054/090 300/089 072/080
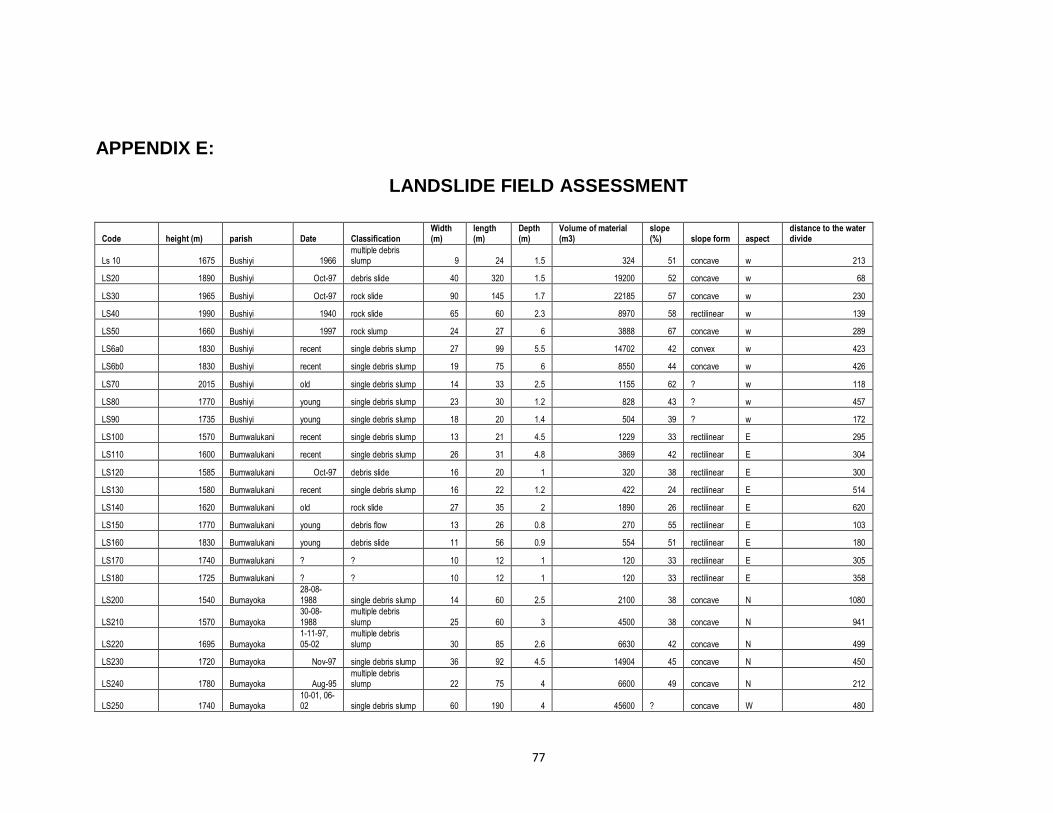
77
APPENDIX E:
LANDSLIDE FIELD ASSESSMENT
Code height (m) parish Date Classification Width (m)
length (m)
Depth (m)
Volume of material (m3)
slope (%) slope form aspect
distance to the water divide
Ls 10 1675 Bushiyi 1966 multiple debris slump 9 24 1.5 324 51 concave w 213
LS20 1890 Bushiyi Oct-97 debris slide 40 320 1.5 19200 52 concave w 68
LS30 1965 Bushiyi Oct-97 rock slide 90 145 1.7 22185 57 concave w 230
LS40 1990 Bushiyi 1940 rock slide 65 60 2.3 8970 58 rectilinear w 139
LS50 1660 Bushiyi 1997 rock slump 24 27 6 3888 67 concave w 289
LS6a0 1830 Bushiyi recent single debris slump 27 99 5.5 14702 42 convex w 423
LS6b0 1830 Bushiyi recent single debris slump 19 75 6 8550 44 concave w 426
LS70 2015 Bushiyi old single debris slump 14 33 2.5 1155 62 ? w 118
LS80 1770 Bushiyi young single debris slump 23 30 1.2 828 43 ? w 457
LS90 1735 Bushiyi young single debris slump 18 20 1.4 504 39 ? w 172
LS100 1570 Bumwalukani recent single debris slump 13 21 4.5 1229 33 rectilinear E 295
LS110 1600 Bumwalukani recent single debris slump 26 31 4.8 3869 42 rectilinear E 304
LS120 1585 Bumwalukani Oct-97 debris slide 16 20 1 320 38 rectilinear E 300
LS130 1580 Bumwalukani recent single debris slump 16 22 1.2 422 24 rectilinear E 514
LS140 1620 Bumwalukani old rock slide 27 35 2 1890 26 rectilinear E 620
LS150 1770 Bumwalukani young debris flow 13 26 0.8 270 55 rectilinear E 103
LS160 1830 Bumwalukani young debris slide 11 56 0.9 554 51 rectilinear E 180
LS170 1740 Bumwalukani ? ? 10 12 1 120 33 rectilinear E 305
LS180 1725 Bumwalukani ? ? 10 12 1 120 33 rectilinear E 358
LS200 1540 Bumayoka 28-08-1988 single debris slump 14 60 2.5 2100 38 concave N 1080
LS210 1570 Bumayoka 30-08-1988
multiple debris slump 25 60 3 4500 38 concave N 941
LS220 1695 Bumayoka
1-11-97,
05-02
multiple debris
slump 30 85 2.6 6630 42 concave N 499
LS230 1720 Bumayoka Nov-97 single debris slump 36 92 4.5 14904 45 concave N 450
LS240 1780 Bumayoka Aug-95 multiple debris slump 22 75 4 6600 49 concave N 212
LS250 1740 Bumayoka 10-01, 06-02 single debris slump 60 190 4 45600 ? concave W 480
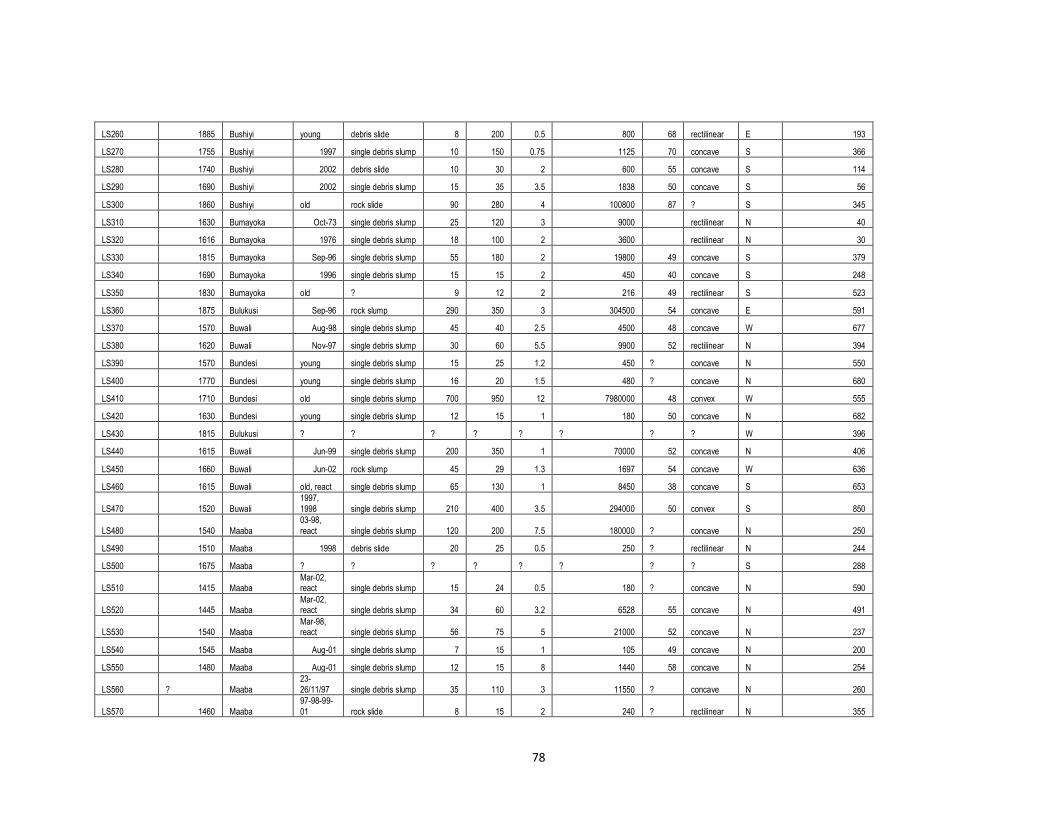
78
LS260 1885 Bushiyi young debris slide 8 200 0.5 800 68 rectilinear E 193
LS270 1755 Bushiyi 1997 single debris slump 10 150 0.75 1125 70 concave S 366
LS280 1740 Bushiyi 2002 debris slide 10 30 2 600 55 concave S 114
LS290 1690 Bushiyi 2002 single debris slump 15 35 3.5 1838 50 concave S 56
LS300 1860 Bushiyi old rock slide 90 280 4 100800 87 ? S 345
LS310 1630 Bumayoka Oct-73 single debris slump 25 120 3 9000 rectilinear N 40
LS320 1616 Bumayoka 1976 single debris slump 18 100 2 3600 rectilinear N 30
LS330 1815 Bumayoka Sep-96 single debris slump 55 180 2 19800 49 concave S 379
LS340 1690 Bumayoka 1996 single debris slump 15 15 2 450 40 concave S 248
LS350 1830 Bumayoka old ? 9 12 2 216 49 rectilinear S 523
LS360 1875 Bulukusi Sep-96 rock slump 290 350 3 304500 54 concave E 591
LS370 1570 Buwali Aug-98 single debris slump 45 40 2.5 4500 48 concave W 677
LS380 1620 Buwali Nov-97 single debris slump 30 60 5.5 9900 52 rectilinear N 394
LS390 1570 Bundesi young single debris slump 15 25 1.2 450 ? concave N 550
LS400 1770 Bundesi young single debris slump 16 20 1.5 480 ? concave N 680
LS410 1710 Bundesi old single debris slump 700 950 12 7980000 48 convex W 555
LS420 1630 Bundesi young single debris slump 12 15 1 180 50 concave N 682
LS430 1815 Bulukusi ? ? ? ? ? ? ? ? W 396
LS440 1615 Buwali Jun-99 single debris slump 200 350 1 70000 52 concave N 406
LS450 1660 Buwali Jun-02 rock slump 45 29 1.3 1697 54 concave W 636
LS460 1615 Buwali old, react single debris slump 65 130 1 8450 38 concave S 653
LS470 1520 Buwali 1997, 1998 single debris slump 210 400 3.5 294000 50 convex S 850
LS480 1540 Maaba 03-98, react single debris slump 120 200 7.5 180000 ? concave N 250
LS490 1510 Maaba 1998 debris slide 20 25 0.5 250 ? rectilinear N 244
LS500 1675 Maaba ? ? ? ? ? ? ? ? S 288
LS510 1415 Maaba Mar-02, react single debris slump 15 24 0.5 180 ? concave N 590
LS520 1445 Maaba Mar-02, react single debris slump 34 60 3.2 6528 55 concave N 491
LS530 1540 Maaba Mar-98, react single debris slump 56 75 5 21000 52 concave N 237
LS540 1545 Maaba Aug-01 single debris slump 7 15 1 105 49 concave N 200
LS550 1480 Maaba Aug-01 single debris slump 12 15 8 1440 58 concave N 254
LS560 ? Maaba 23-26/11/97 single debris slump 35 110 3 11550 ? concave N 260
LS570 1460 Maaba 97-98-99-01 rock slide 8 15 2 240 ? rectilinear N 355
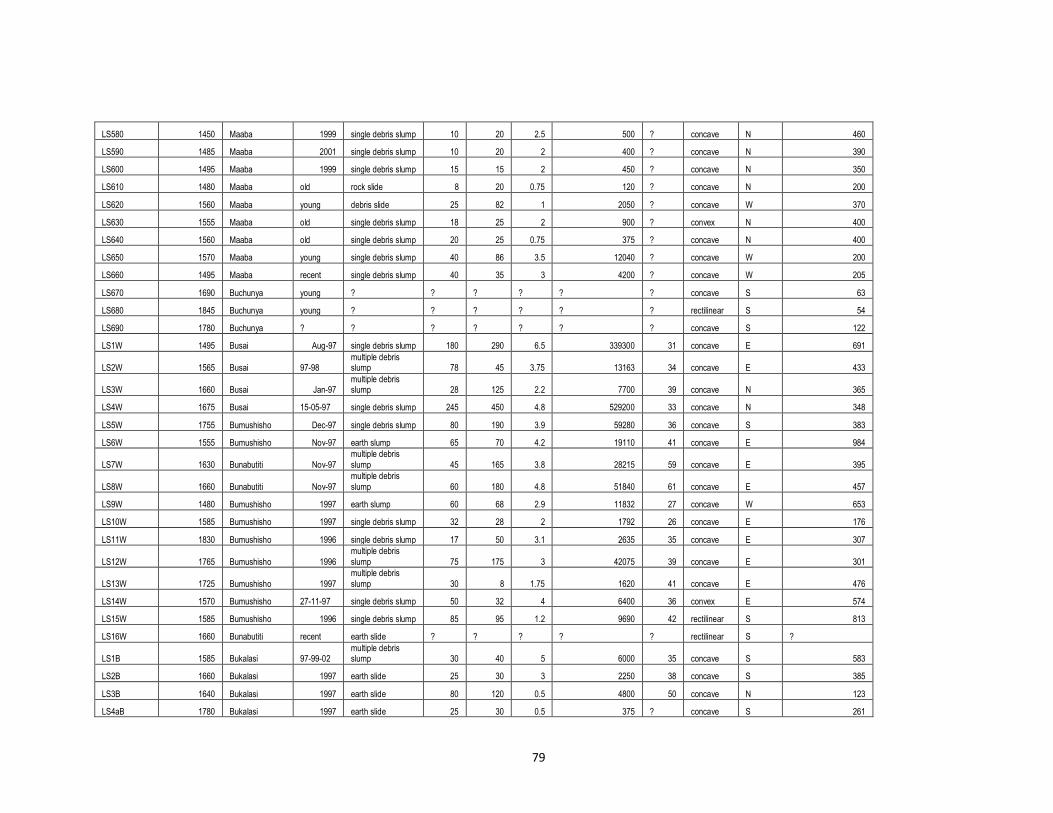
79
LS580 1450 Maaba 1999 single debris slump 10 20 2.5 500 ? concave N 460
LS590 1485 Maaba 2001 single debris slump 10 20 2 400 ? concave N 390
LS600 1495 Maaba 1999 single debris slump 15 15 2 450 ? concave N 350
LS610 1480 Maaba old rock slide 8 20 0.75 120 ? concave N 200
LS620 1560 Maaba young debris slide 25 82 1 2050 ? concave W 370
LS630 1555 Maaba old single debris slump 18 25 2 900 ? convex N 400
LS640 1560 Maaba old single debris slump 20 25 0.75 375 ? concave N 400
LS650 1570 Maaba young single debris slump 40 86 3.5 12040 ? concave W 200
LS660 1495 Maaba recent single debris slump 40 35 3 4200 ? concave W 205
LS670 1690 Buchunya young ? ? ? ? ? ? concave S 63
LS680 1845 Buchunya young ? ? ? ? ? ? rectilinear S 54
LS690 1780 Buchunya ? ? ? ? ? ? ? concave S 122
LS1W 1495 Busai Aug-97 single debris slump 180 290 6.5 339300 31 concave E 691
LS2W 1565 Busai 97-98 multiple debris slump 78 45 3.75 13163 34 concave E 433
LS3W 1660 Busai Jan-97 multiple debris slump 28 125 2.2 7700 39 concave N 365
LS4W 1675 Busai 15-05-97 single debris slump 245 450 4.8 529200 33 concave N 348
LS5W 1755 Bumushisho Dec-97 single debris slump 80 190 3.9 59280 36 concave S 383
LS6W 1555 Bumushisho Nov-97 earth slump 65 70 4.2 19110 41 concave E 984
LS7W 1630 Bunabutiti Nov-97 multiple debris slump 45 165 3.8 28215 59 concave E 395
LS8W 1660 Bunabutiti Nov-97 multiple debris slump 60 180 4.8 51840 61 concave E 457
LS9W 1480 Bumushisho 1997 earth slump 60 68 2.9 11832 27 concave W 653
LS10W 1585 Bumushisho 1997 single debris slump 32 28 2 1792 26 concave E 176
LS11W 1830 Bumushisho 1996 single debris slump 17 50 3.1 2635 35 concave E 307
LS12W 1765 Bumushisho 1996
multiple debris
slump 75 175 3 42075 39 concave E 301
LS13W 1725 Bumushisho 1997 multiple debris slump 30 8 1.75 1620 41 concave E 476
LS14W 1570 Bumushisho 27-11-97 single debris slump 50 32 4 6400 36 convex E 574
LS15W 1585 Bumushisho 1996 single debris slump 85 95 1.2 9690 42 rectilinear S 813
LS16W 1660 Bunabutiti recent earth slide ? ? ? ? ? rectilinear S ?
LS1B 1585 Bukalasi 97-99-02 multiple debris slump 30 40 5 6000 35 concave S 583
LS2B 1660 Bukalasi 1997 earth slide 25 30 3 2250 38 concave S 385
LS3B 1640 Bukalasi 1997 earth slide 80 120 0.5 4800 50 concave N 123
LS4aB 1780 Bukalasi 1997 earth slide 25 30 0.5 375 ? concave S 261
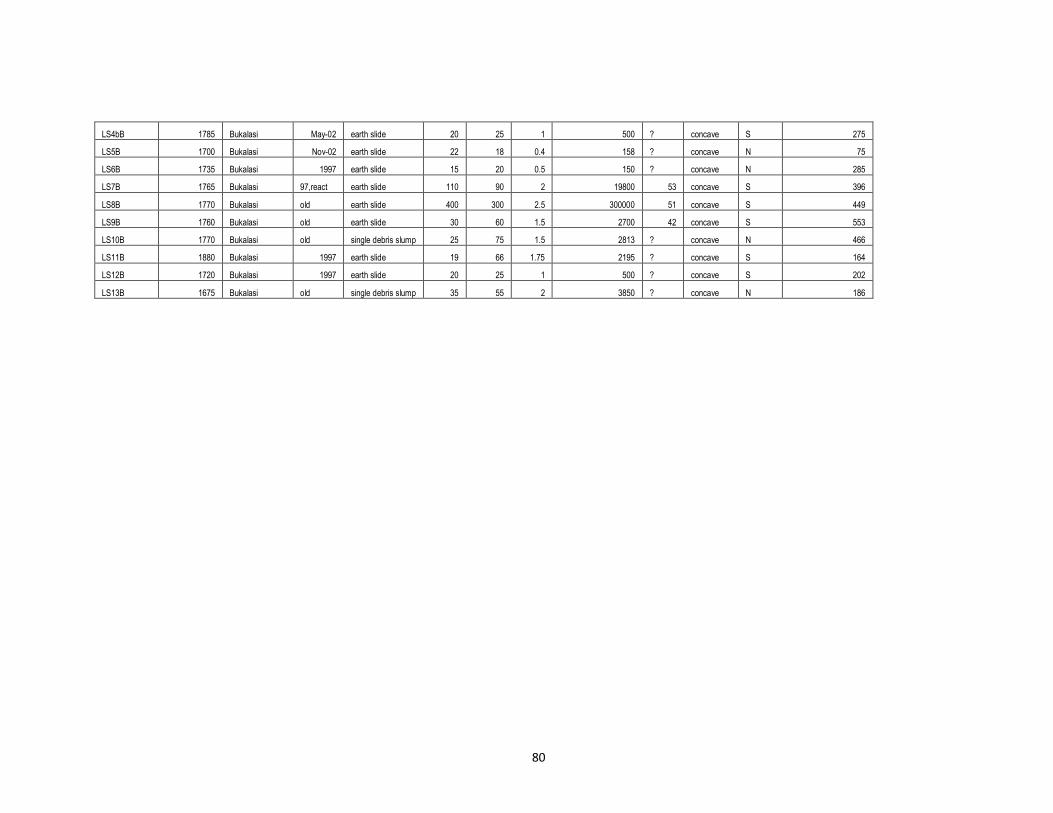
80
LS4bB 1785 Bukalasi May-02 earth slide 20 25 1 500 ? concave S 275
LS5B 1700 Bukalasi Nov-02 earth slide 22 18 0.4 158 ? concave N 75
LS6B 1735 Bukalasi 1997 earth slide 15 20 0.5 150 ? concave N 285
LS7B 1765 Bukalasi 97,react earth slide 110 90 2 19800 53 concave S 396
LS8B 1770 Bukalasi old earth slide 400 300 2.5 300000 51 concave S 449
LS9B 1760 Bukalasi old earth slide 30 60 1.5 2700 42 concave S 553
LS10B 1770 Bukalasi old single debris slump 25 75 1.5 2813 ? concave N 466
LS11B 1880 Bukalasi 1997 earth slide 19 66 1.75 2195 ? concave S 164
LS12B 1720 Bukalasi 1997 earth slide 20 25 1 500 ? concave S 202
LS13B 1675 Bukalasi old single debris slump 35 55 2 3850 ? concave N 186
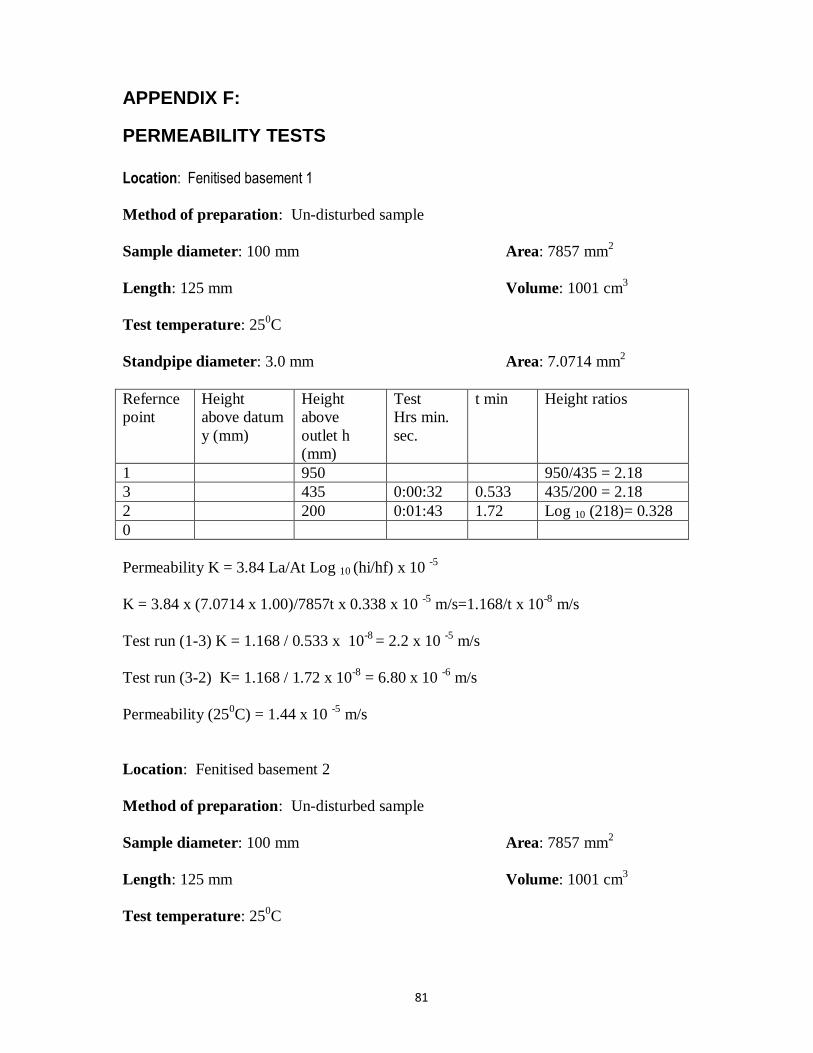
81
APPENDIX F:
PERMEABILITY TESTS
Location: Fenitised basement 1
Method of preparation: Un-disturbed sample
Sample diameter: 100 mm Area: 7857 mm2
Length: 125 mm Volume: 1001 cm3
Test temperature: 250C
Standpipe diameter: 3.0 mm Area: 7.0714 mm2
Refernce
point
Height
above datum
y (mm)
Height
above
outlet h
(mm)
Test
Hrs min.
sec.
t min Height ratios
1 950 950/435 = 2.18
3 435 0:00:32 0.533 435/200 = 2.18
2 200 0:01:43 1.72 Log 10 (218)= 0.328
0
Permeability K = 3.84 La/At Log 10 (hi/hf) x 10
-5
K = 3.84 x (7.0714 x 1.00)/7857t x 0.338 x 10 -5
m/s=1.168/t x 10-8
m/s
Test run (1-3) K = 1.168 / 0.533 x 10-8
= 2.2 x 10 -5
m/s
Test run (3-2) K= 1.168 / 1.72 x 10-8
= 6.80 x 10 -6
m/s
Permeability (250C) = 1.44 x 10
-5 m/s
Location: Fenitised basement 2
Method of preparation: Un-disturbed sample
Sample diameter: 100 mm Area: 7857 mm2
Length: 125 mm Volume: 1001 cm3
Test temperature: 250C
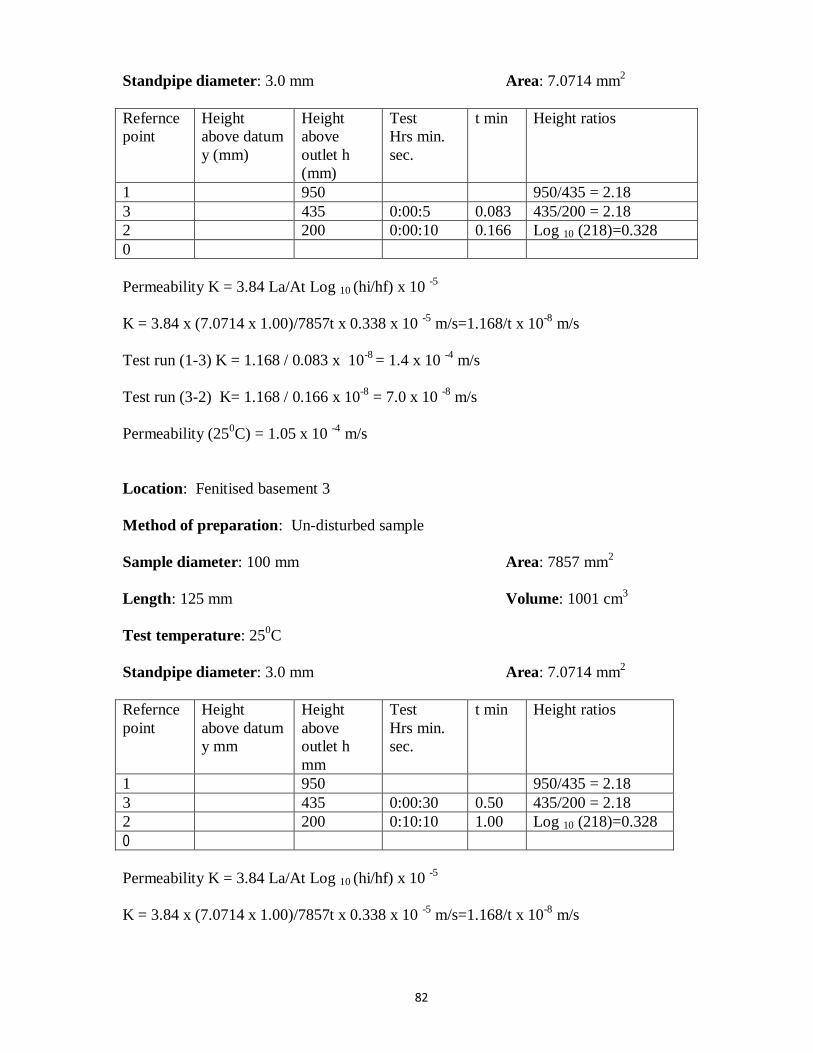
82
Standpipe diameter: 3.0 mm Area: 7.0714 mm2
Refernce
point
Height
above datum
y (mm)
Height
above
outlet h
(mm)
Test
Hrs min.
sec.
t min Height ratios
1 950 950/435 = 2.18
3 435 0:00:5 0.083 435/200 = 2.18
2 200 0:00:10 0.166 Log 10 (218)=0.328
0
Permeability K = 3.84 La/At Log 10 (hi/hf) x 10
-5
K = 3.84 x (7.0714 x 1.00)/7857t x 0.338 x 10 -5
m/s=1.168/t x 10-8
m/s
Test run (1-3) K = 1.168 / 0.083 x 10-8
= 1.4 x 10 -4
m/s
Test run (3-2) K= 1.168 / 0.166 x 10-8
= 7.0 x 10 -8
m/s
Permeability (250C) = 1.05 x 10
-4 m/s
Location: Fenitised basement 3
Method of preparation: Un-disturbed sample
Sample diameter: 100 mm Area: 7857 mm2
Length: 125 mm Volume: 1001 cm3
Test temperature: 250C
Standpipe diameter: 3.0 mm Area: 7.0714 mm2
Refernce
point
Height
above datum
y mm
Height
above
outlet h
mm
Test
Hrs min.
sec.
t min Height ratios
1 950 950/435 = 2.18
3 435 0:00:30 0.50 435/200 = 2.18
2 200 0:10:10 1.00 Log 10 (218)=0.328
0
Permeability K = 3.84 La/At Log 10 (hi/hf) x 10
-5
K = 3.84 x (7.0714 x 1.00)/7857t x 0.338 x 10 -5
m/s=1.168/t x 10-8
m/s
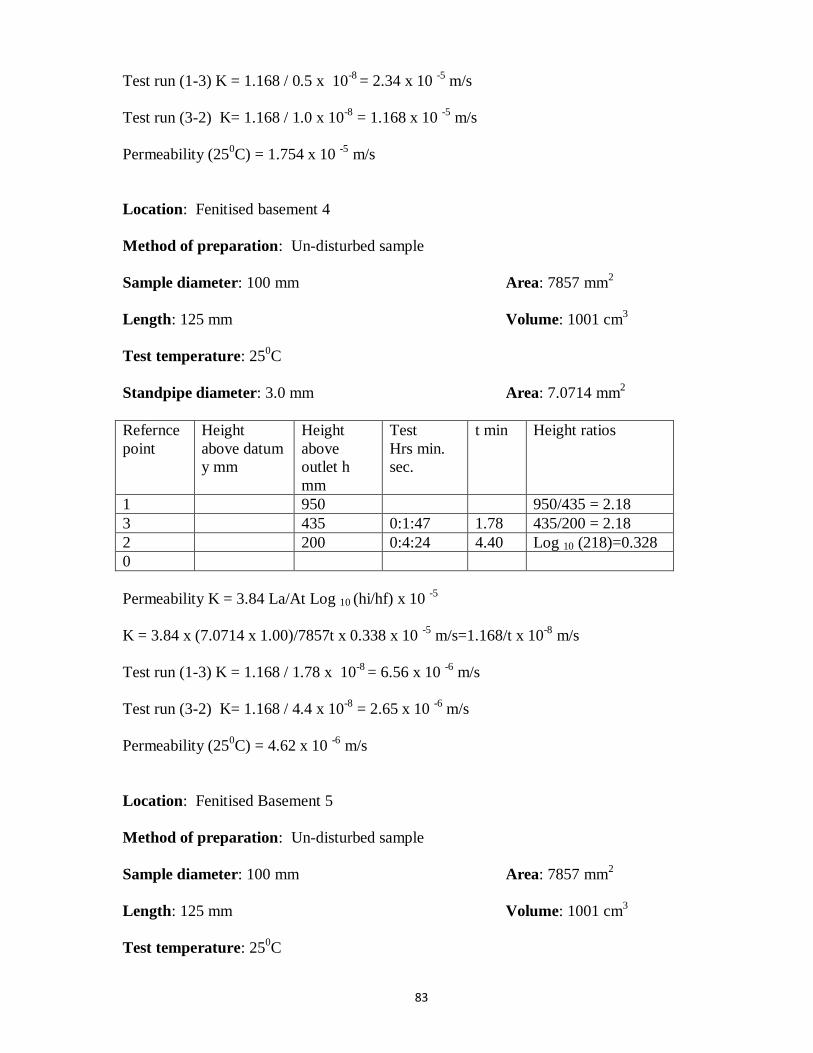
83
Test run (1-3) K = 1.168 / 0.5 x 10-8
= 2.34 x 10 -5
m/s
Test run (3-2) K= 1.168 / 1.0 x 10-8
= 1.168 x 10 -5
m/s
Permeability (250C) = 1.754 x 10
-5 m/s
Location: Fenitised basement 4
Method of preparation: Un-disturbed sample
Sample diameter: 100 mm Area: 7857 mm2
Length: 125 mm Volume: 1001 cm3
Test temperature: 250C
Standpipe diameter: 3.0 mm Area: 7.0714 mm2
Refernce
point
Height
above datum
y mm
Height
above
outlet h
mm
Test
Hrs min.
sec.
t min Height ratios
1 950 950/435 = 2.18
3 435 0:1:47 1.78 435/200 = 2.18
2 200 0:4:24 4.40 Log 10 (218)=0.328
0
Permeability K = 3.84 La/At Log 10 (hi/hf) x 10
-5
K = 3.84 x (7.0714 x 1.00)/7857t x 0.338 x 10 -5
m/s=1.168/t x 10-8
m/s
Test run (1-3) K = 1.168 / 1.78 x 10-8
= 6.56 x 10 -6
m/s
Test run (3-2) K= 1.168 / 4.4 x 10-8
= 2.65 x 10 -6
m/s
Permeability (250C) = 4.62 x 10
-6 m/s
Location: Fenitised Basement 5
Method of preparation: Un-disturbed sample
Sample diameter: 100 mm Area: 7857 mm2
Length: 125 mm Volume: 1001 cm3
Test temperature: 250C
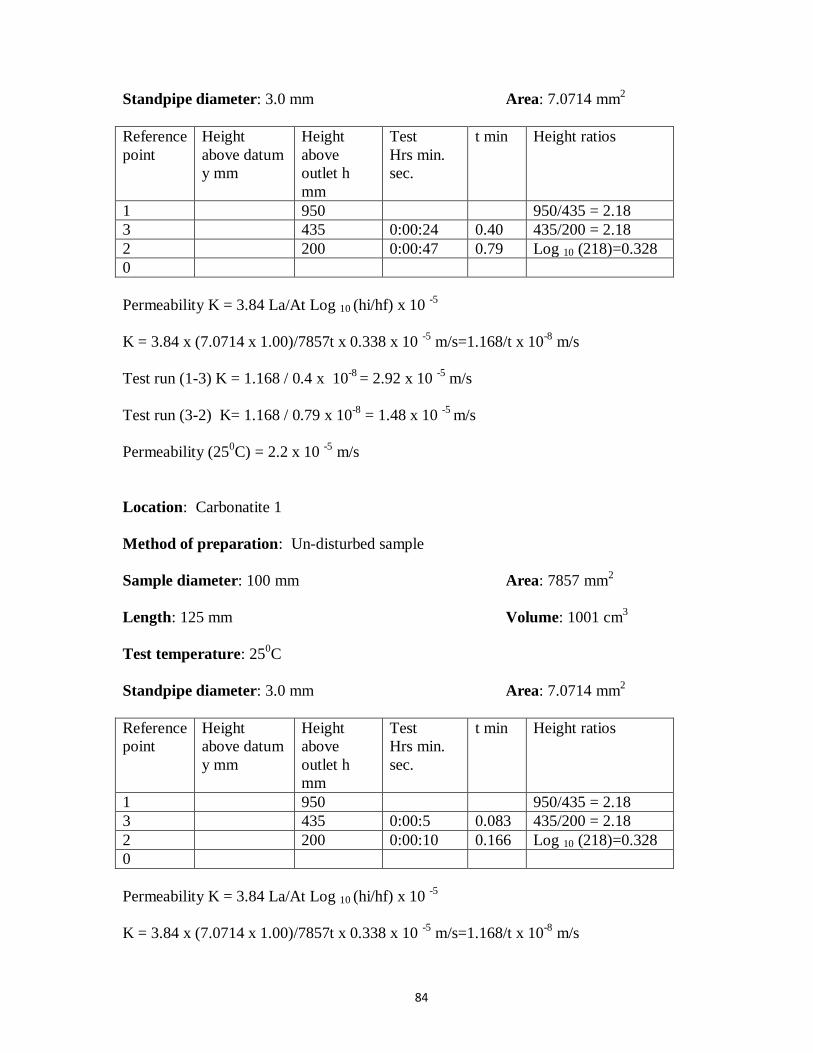
84
Standpipe diameter: 3.0 mm Area: 7.0714 mm2
Reference
point
Height
above datum
y mm
Height
above
outlet h
mm
Test
Hrs min.
sec.
t min Height ratios
1 950 950/435 = 2.18
3 435 0:00:24 0.40 435/200 = 2.18
2 200 0:00:47 0.79 Log 10 (218)=0.328
0
Permeability K = 3.84 La/At Log 10 (hi/hf) x 10
-5
K = 3.84 x (7.0714 x 1.00)/7857t x 0.338 x 10 -5
m/s=1.168/t x 10-8
m/s
Test run (1-3) K = 1.168 / 0.4 x 10-8
= 2.92 x 10 -5
m/s
Test run (3-2) K= 1.168 / 0.79 x 10-8
= 1.48 x 10 -5
m/s
Permeability (250C) = 2.2 x 10
-5 m/s
Location: Carbonatite 1
Method of preparation: Un-disturbed sample
Sample diameter: 100 mm Area: 7857 mm2
Length: 125 mm Volume: 1001 cm3
Test temperature: 250C
Standpipe diameter: 3.0 mm Area: 7.0714 mm2
Reference
point
Height
above datum
y mm
Height
above
outlet h
mm
Test
Hrs min.
sec.
t min Height ratios
1 950 950/435 = 2.18
3 435 0:00:5 0.083 435/200 = 2.18
2 200 0:00:10 0.166 Log 10 (218)=0.328
0
Permeability K = 3.84 La/At Log 10 (hi/hf) x 10
-5
K = 3.84 x (7.0714 x 1.00)/7857t x 0.338 x 10 -5
m/s=1.168/t x 10-8
m/s
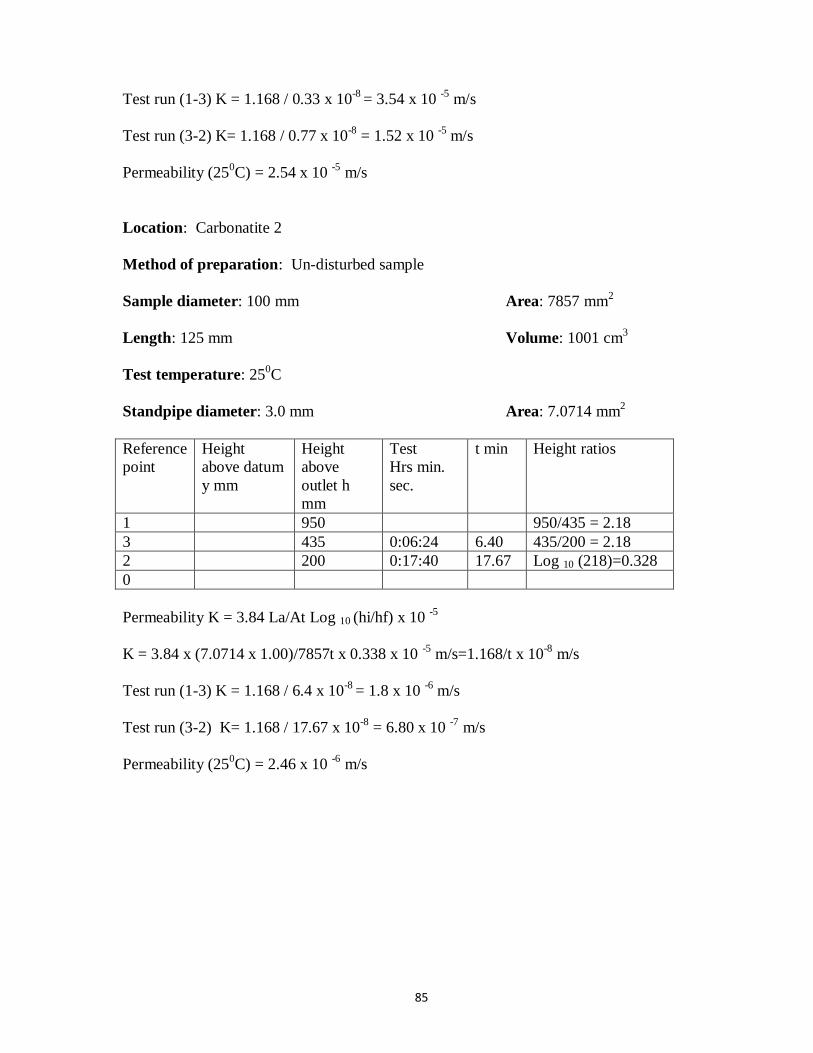
85
Test run (1-3) K = 1.168 / 0.33 x 10-8
= 3.54 x 10 -5
m/s
Test run (3-2) K= 1.168 / 0.77 x 10-8
= 1.52 x 10 -5
m/s
Permeability (250C) = 2.54 x 10
-5 m/s
Location: Carbonatite 2
Method of preparation: Un-disturbed sample
Sample diameter: 100 mm Area: 7857 mm2
Length: 125 mm Volume: 1001 cm3
Test temperature: 250C
Standpipe diameter: 3.0 mm Area: 7.0714 mm2
Reference
point
Height
above datum
y mm
Height
above
outlet h
mm
Test
Hrs min.
sec.
t min Height ratios
1 950 950/435 = 2.18
3 435 0:06:24 6.40 435/200 = 2.18
2 200 0:17:40 17.67 Log 10 (218)=0.328
0
Permeability K = 3.84 La/At Log 10 (hi/hf) x 10
-5
K = 3.84 x (7.0714 x 1.00)/7857t x 0.338 x 10 -5
m/s=1.168/t x 10-8
m/s
Test run (1-3) K = 1.168 / 6.4 x 10-8
= 1.8 x 10 -6
m/s
Test run (3-2) K= 1.168 / 17.67 x 10-8
= 6.80 x 10 -7
m/s
Permeability (250C) = 2.46 x 10
-6 m/s
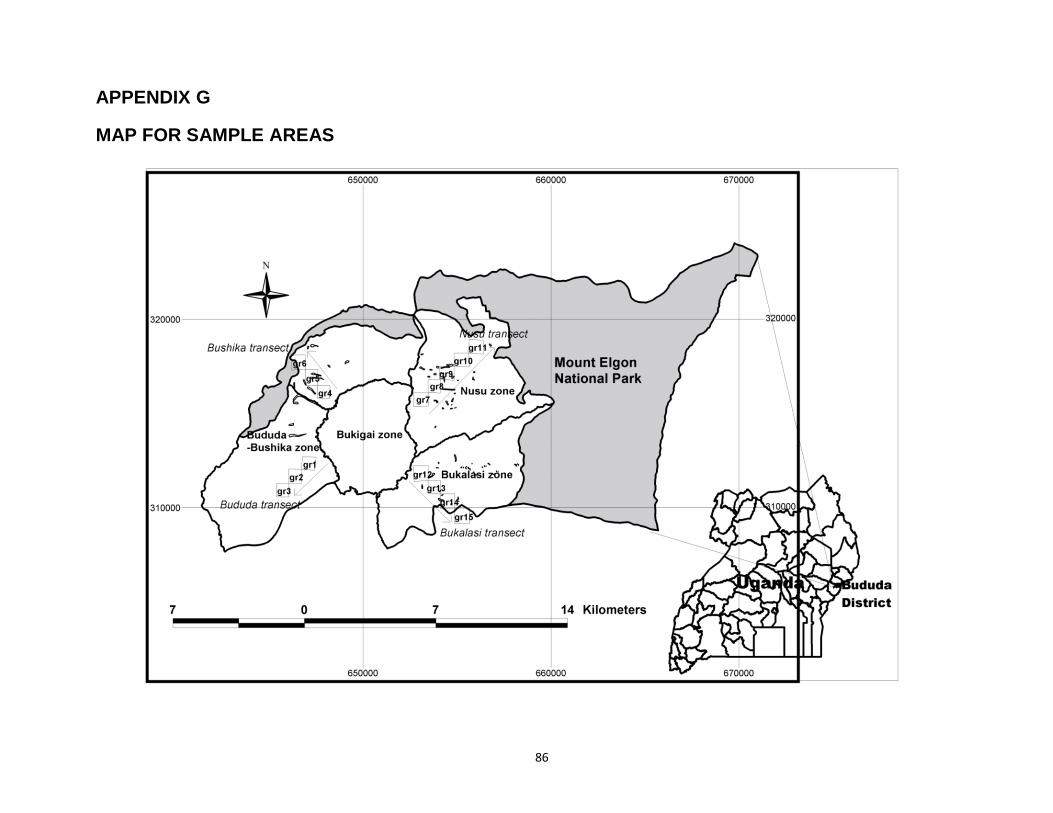
86
APPENDIX G
MAP FOR SAMPLE AREAS
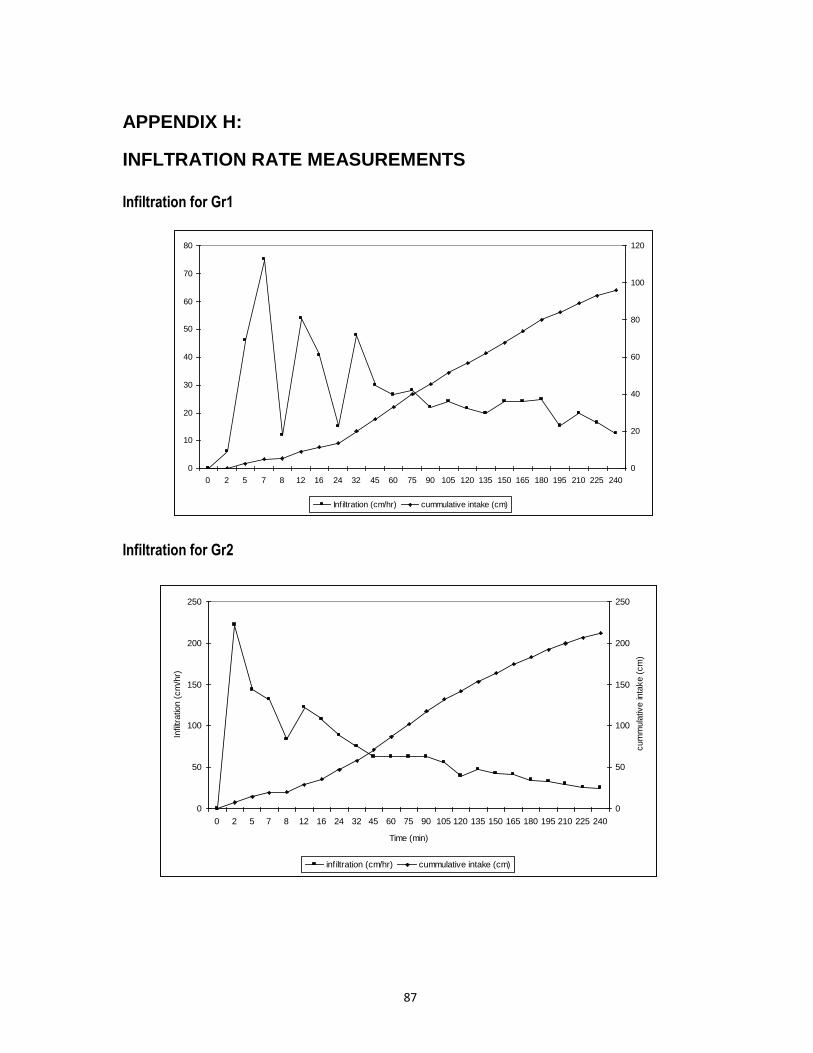
87
APPENDIX H:
INFLTRATION RATE MEASUREMENTS
Infiltration for Gr1
Infiltration for Gr2
0
50
100
150
200
250
0 2 5 7 8 12 16 24 32 45 60 75 90 105 120 135 150 165 180 195 210 225 240
Time (min)
Infil
tratio
n (
cm
/hr)
0
50
100
150
200
250
cum
mula
tive in
take (
cm
)
inf iltration (cm/hr) cummulative intake (cm)
0
10
20
30
40
50
60
70
80
0 2 5 7 8 12 16 24 32 45 60 75 90 105 120 135 150 165 180 195 210 225 240
0
20
40
60
80
100
120
Infiltration (cm/hr) cummulative intake (cm)
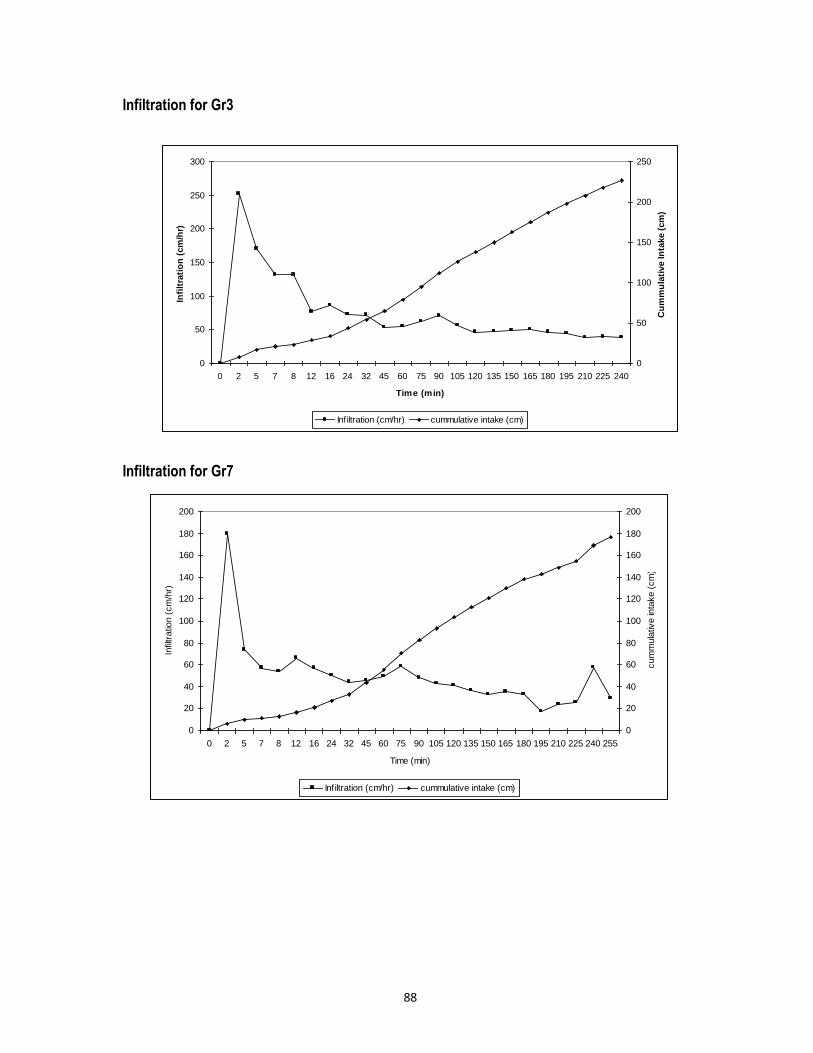
88
Infiltration for Gr3
Infiltration for Gr7
0
50
100
150
200
250
300
0 2 5 7 8 12 16 24 32 45 60 75 90 105 120 135 150 165 180 195 210 225 240
Time (min)
Infi
ltra
tio
n (
cm
/hr)
0
50
100
150
200
250
Cu
mm
ula
tive In
take (
cm
)
Infiltration (cm/hr) cummulative intake (cm)
0
20
40
60
80
100
120
140
160
180
200
0 2 5 7 8 12 16 24 32 45 60 75 90 105 120 135 150 165 180 195 210 225 240 255
Time (min)
Infil
tratio
n (
cm
/hr)
0
20
40
60
80
100
120
140
160
180
200
cum
mula
tive in
take (
cm
)
Inf iltration (cm/hr) cummulative intake (cm)
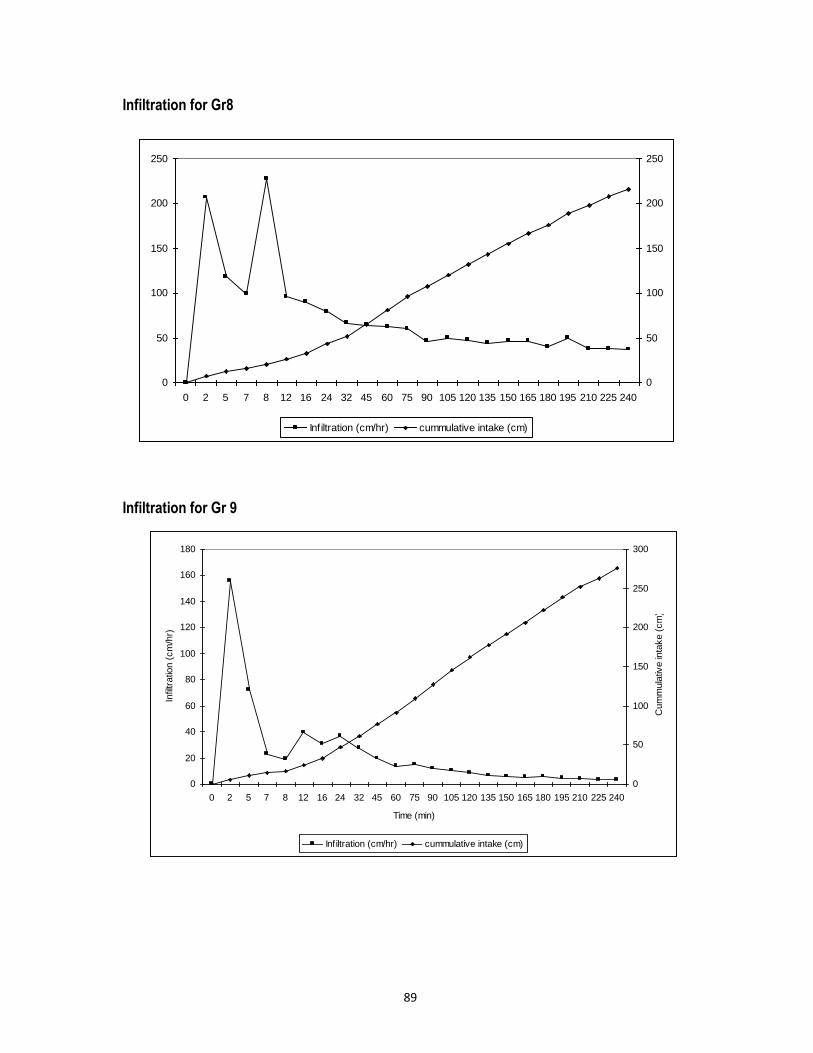
89
Infiltration for Gr8
Infiltration for Gr 9
0
50
100
150
200
250
0 2 5 7 8 12 16 24 32 45 60 75 90 105 120 135 150 165 180 195 210 225 240
0
50
100
150
200
250
Infiltration (cm/hr) cummulative intake (cm)
0
20
40
60
80
100
120
140
160
180
0 2 5 7 8 12 16 24 32 45 60 75 90 105 120 135 150 165 180 195 210 225 240
Time (min)
Infil
tratio
n (
cm
/hr)
0
50
100
150
200
250
300
Cum
mula
tive in
take (
cm
)
Inf iltration (cm/hr) cummulative intake (cm)
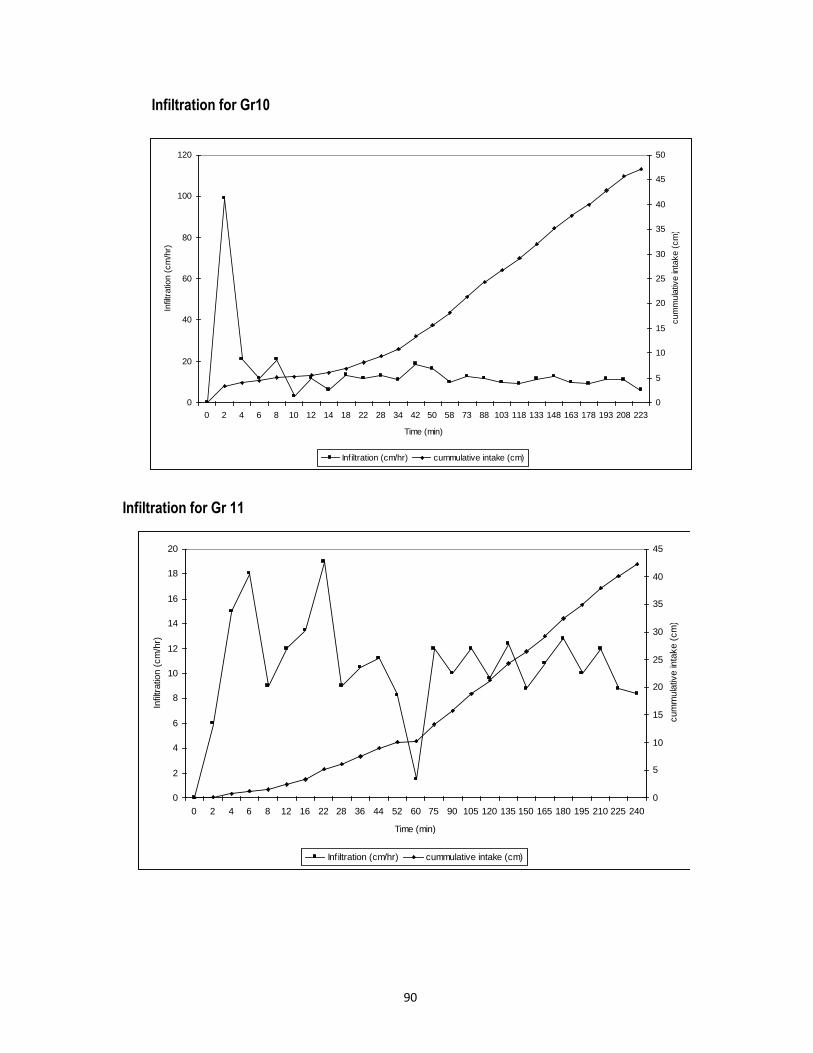
90
Infiltration for Gr10
Infiltration for Gr 11
0
2
4
6
8
10
12
14
16
18
20
0 2 4 6 8 12 16 22 28 36 44 52 60 75 90 105 120 135 150 165 180 195 210 225 240
Time (min)
Infil
tratio
n (
cm
/hr)
0
5
10
15
20
25
30
35
40
45
cum
mula
tive in
take (
cm
)
Inf iltration (cm/hr) cummulative intake (cm)
0
20
40
60
80
100
120
0 2 4 6 8 10 12 14 18 22 28 34 42 50 58 73 88 103 118 133 148 163 178 193 208 223
Time (min)
Infil
tratio
n (
cm
/hr)
0
5
10
15
20
25
30
35
40
45
50
cum
mula
tive in
take (
cm
)
Inf iltration (cm/hr) cummulative intake (cm)
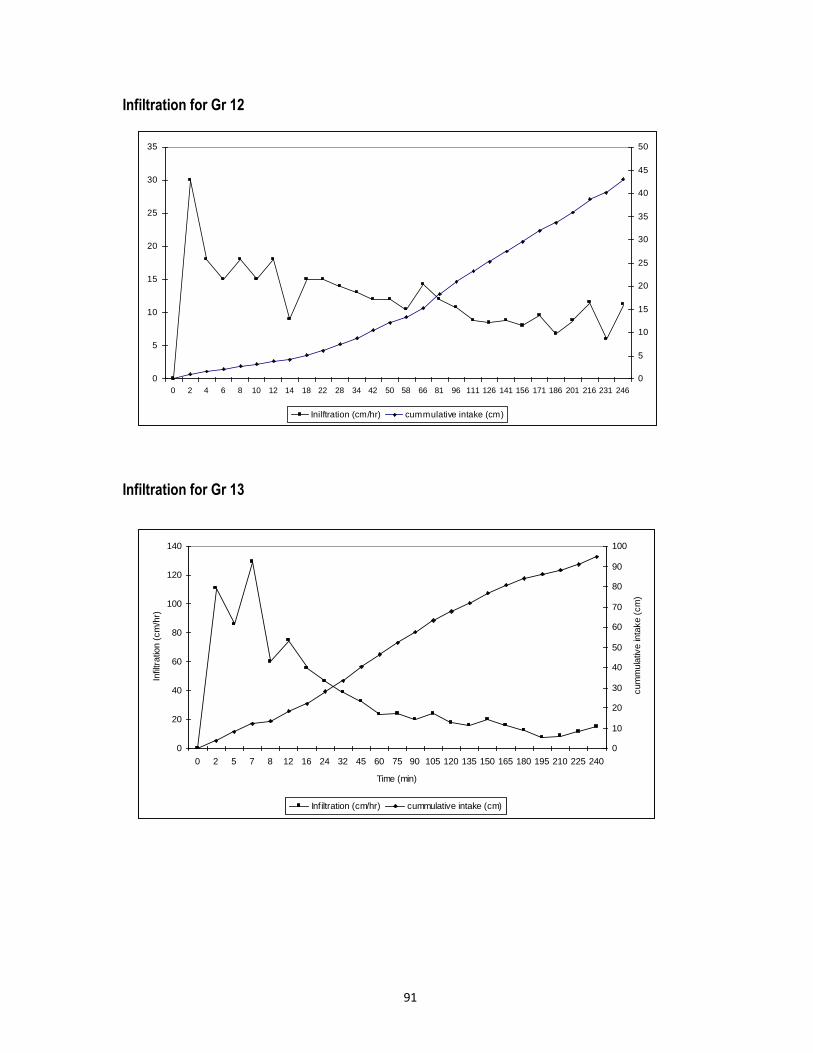
91
Infiltration for Gr 12
Infiltration for Gr 13
0
5
10
15
20
25
30
35
0 2 4 6 8 10 12 14 18 22 28 34 42 50 58 66 81 96 111 126 141 156 171 186 201 216 231 246
0
5
10
15
20
25
30
35
40
45
50
Inilftration (cm/hr) cummulative intake (cm)
0
20
40
60
80
100
120
140
0 2 5 7 8 12 16 24 32 45 60 75 90 105 120 135 150 165 180 195 210 225 240
Time (min)
Infil
tratio
n (
cm
/hr)
0
10
20
30
40
50
60
70
80
90
100
cum
mula
tive in
take (
cm
)
Inf iltration (cm/hr) cummulative intake (cm)
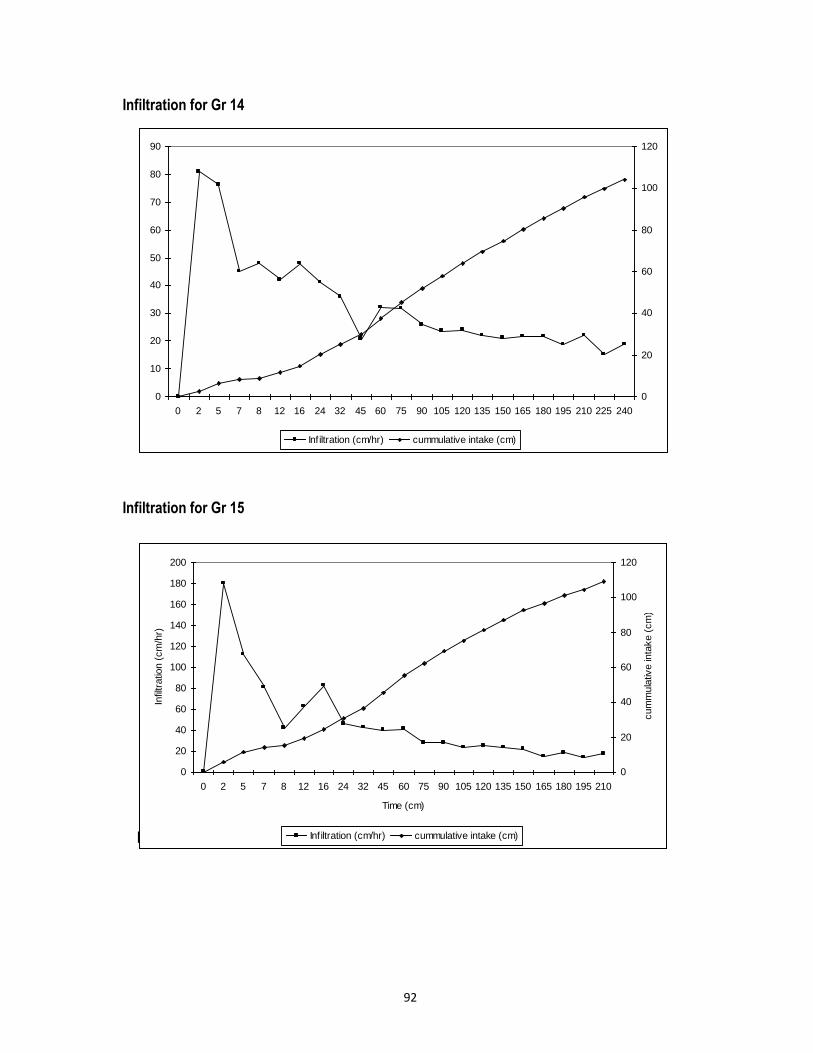
92
Infiltration for Gr 14
Infiltration for Gr 15
Infiltration for Gr 16
0
10
20
30
40
50
60
70
80
90
0 2 5 7 8 12 16 24 32 45 60 75 90 105 120 135 150 165 180 195 210 225 240
0
20
40
60
80
100
120
Infiltration (cm/hr) cummulative intake (cm)
0
20
40
60
80
100
120
140
160
180
200
0 2 5 7 8 12 16 24 32 45 60 75 90 105 120 135 150 165 180 195 210
Time (cm)
Infil
tratio
n (
cm
/hr)
0
20
40
60
80
100
120
cum
mula
tive in
take (
cm
)
Inf iltration (cm/hr) cummulative intake (cm)
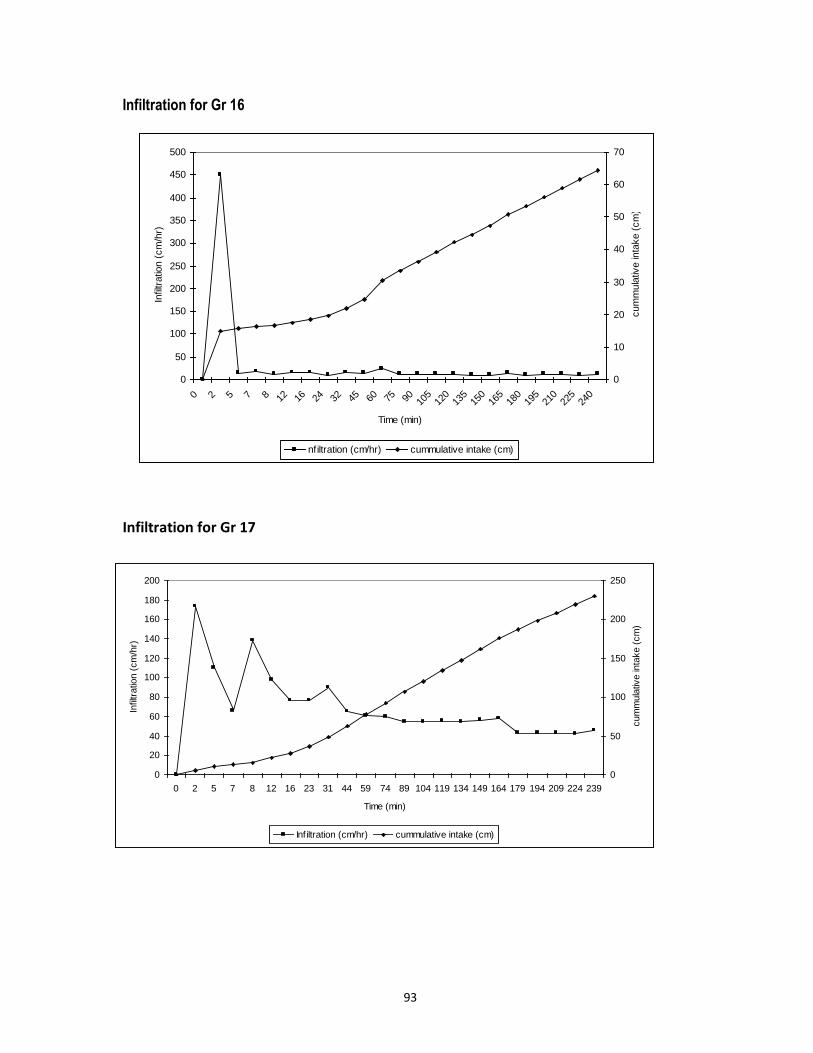
93
Infiltration for Gr 16
Infiltration for Gr 17
0
50
100
150
200
250
300
350
400
450
500
0 2 5 7 8 12 16 24 32 45 60 75 90 105
120
135
150
165
180
195
210
225
240
Time (min)
Infil
tratio
n (
cm
/hr)
0
10
20
30
40
50
60
70
cum
mula
tive in
take (
cm
)
nf iltration (cm/hr) cummulative intake (cm)
0
20
40
60
80
100
120
140
160
180
200
0 2 5 7 8 12 16 23 31 44 59 74 89 104 119 134 149 164 179 194 209 224 239
Time (min)
Infil
tratio
n (
cm
/hr)
0
50
100
150
200
250
cum
mula
tive in
take (
cm
)
Inf iltration (cm/hr) cummulative intake (cm)
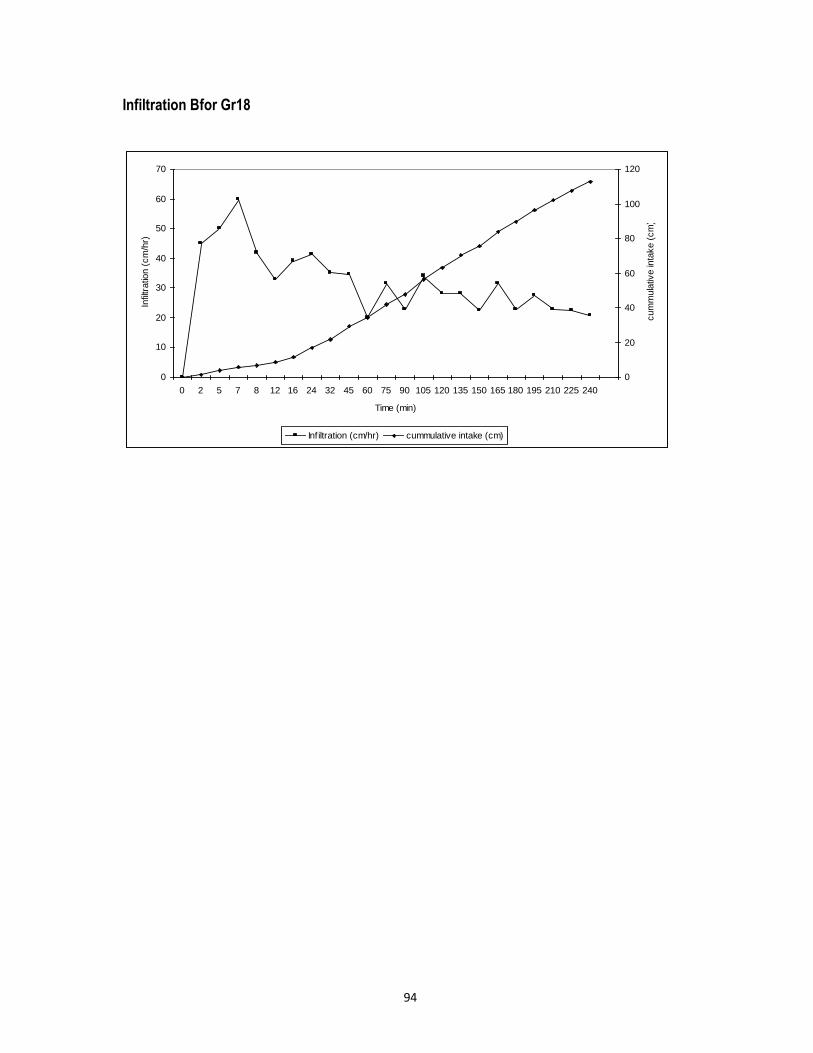
94
Infiltration Bfor Gr18
0
10
20
30
40
50
60
70
0 2 5 7 8 12 16 24 32 45 60 75 90 105 120 135 150 165 180 195 210 225 240
Time (min)
Infil
tratio
n (
cm
/hr)
0
20
40
60
80
100
120
cum
mula
tive in
take (
cm
)
Inf iltration (cm/hr) cummulative intake (cm)
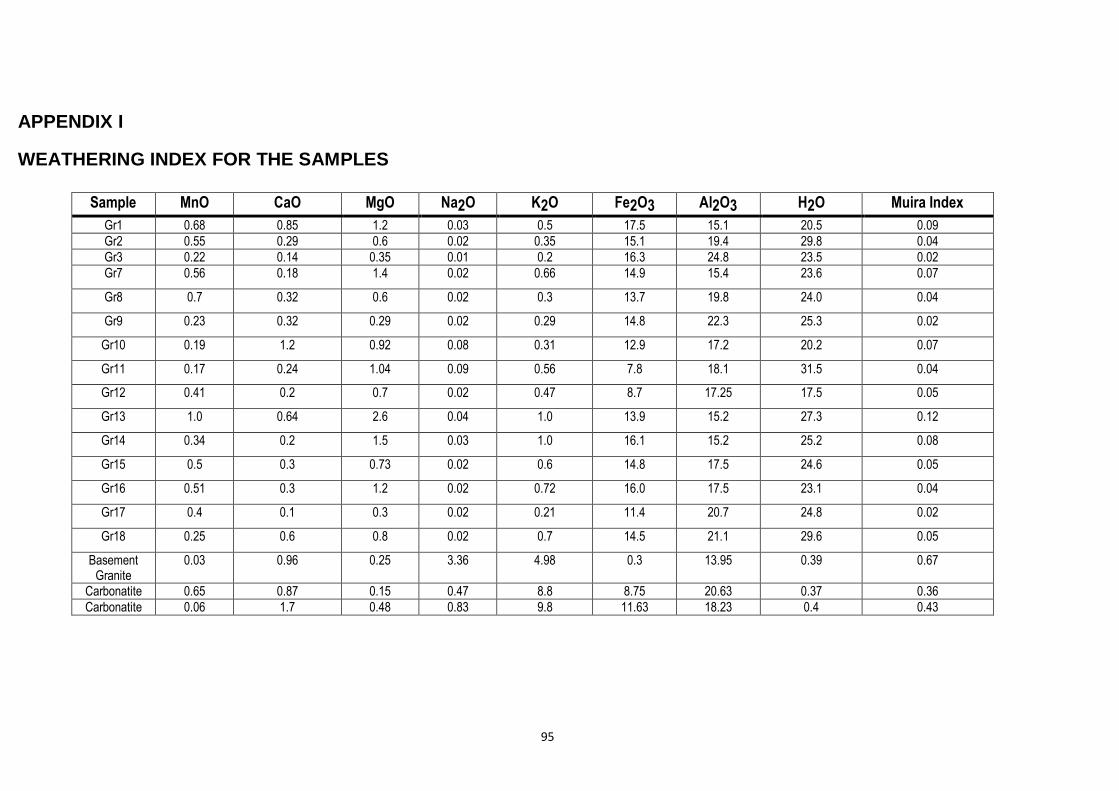
95
APPENDIX I
WEATHERING INDEX FOR THE SAMPLES
Sample MnO CaO MgO Na2O K2O Fe2O3 Al2O3 H2O Muira Index
Gr1 0.68 0.85 1.2 0.03 0.5 17.5 15.1 20.5 0.09
Gr2 0.55 0.29 0.6 0.02 0.35 15.1 19.4 29.8 0.04
Gr3 0.22 0.14 0.35 0.01 0.2 16.3 24.8 23.5 0.02
Gr7 0.56 0.18 1.4 0.02 0.66 14.9 15.4 23.6 0.07
Gr8 0.7 0.32 0.6 0.02 0.3 13.7 19.8 24.0 0.04
Gr9 0.23 0.32 0.29 0.02 0.29 14.8 22.3 25.3 0.02
Gr10 0.19 1.2 0.92 0.08 0.31 12.9 17.2 20.2 0.07
Gr11 0.17 0.24 1.04 0.09 0.56 7.8 18.1 31.5 0.04
Gr12 0.41 0.2 0.7 0.02 0.47 8.7 17.25 17.5 0.05
Gr13 1.0 0.64 2.6 0.04 1.0 13.9 15.2 27.3 0.12
Gr14 0.34 0.2 1.5 0.03 1.0 16.1 15.2 25.2 0.08
Gr15 0.5 0.3 0.73 0.02 0.6 14.8 17.5 24.6 0.05
Gr16 0.51 0.3 1.2 0.02 0.72 16.0 17.5 23.1 0.04
Gr17 0.4 0.1 0.3 0.02 0.21 11.4 20.7 24.8 0.02
Gr18 0.25 0.6 0.8 0.02 0.7 14.5 21.1 29.6 0.05
Basement Granite
0.03 0.96 0.25 3.36 4.98 0.3 13.95 0.39 0.67
Carbonatite 0.65 0.87 0.15 0.47 8.8 8.75 20.63 0.37 0.36
Carbonatite 0.06 1.7 0.48 0.83 9.8 11.63 18.23 0.4 0.43
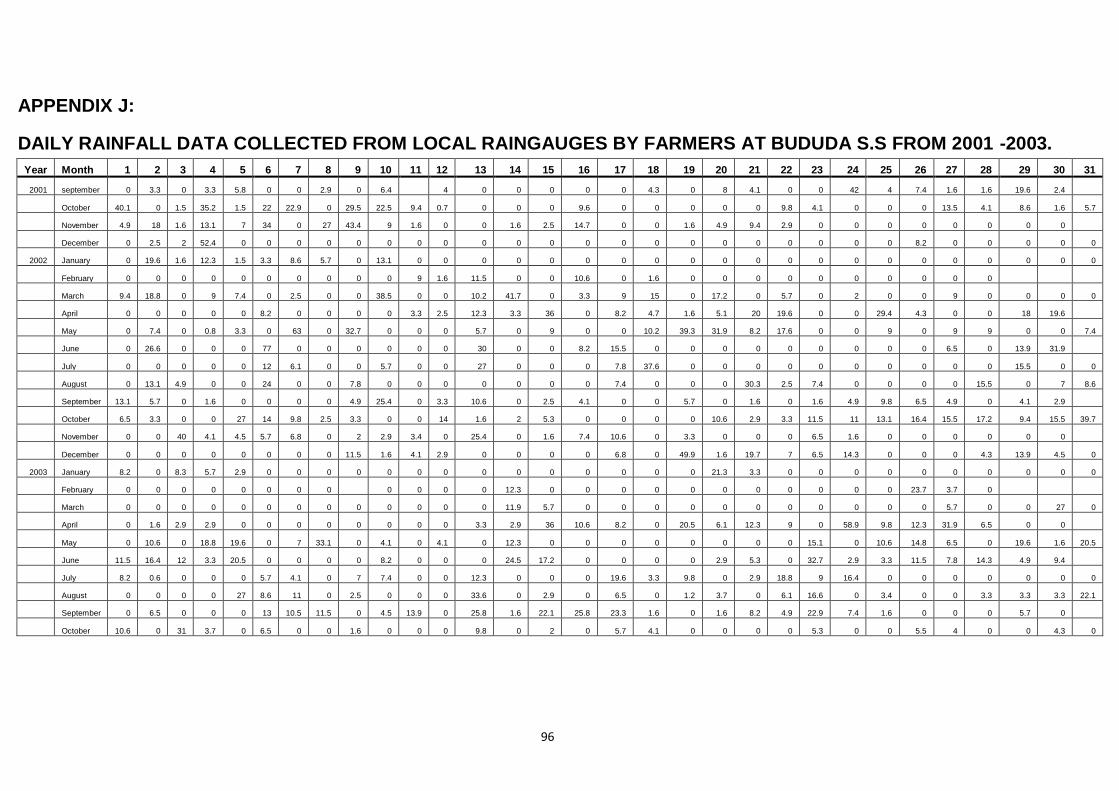
96
APPENDIX J:
DAILY RAINFALL DATA COLLECTED FROM LOCAL RAINGAUGES BY FARMERS AT BUDUDA S.S FROM 2001 -2003.
Year Month 1 2 3 4 5 6 7 8 9 10 11 12 13 14 15 16 17 18 19 20 21 22 23 24 25 26 27 28 29 30 31
2001 september 0 3.3 0 3.3 5.8 0 0 2.9 0 6.4
4 0 0 0 0 0 4.3 0 8 4.1 0 0 42 4 7.4 1.6 1.6 19.6 2.4
October 40.1 0 1.5 35.2 1.5 22 22.9 0 29.5 22.5 9.4 0.7 0 0 0 9.6 0 0 0 0 0 9.8 4.1 0 0 0 13.5 4.1 8.6 1.6 5.7
November 4.9 18 1.6 13.1 7 34 0 27 43.4 9 1.6 0 0 1.6 2.5 14.7 0 0 1.6 4.9 9.4 2.9 0 0 0 0 0 0 0 0
December 0 2.5 2 52.4 0 0 0 0 0 0 0 0 0 0 0 0 0 0 0 0 0 0 0 0 0 8.2 0 0 0 0 0
2002 January 0 19.6 1.6 12.3 1.5 3.3 8.6 5.7 0 13.1 0 0 0 0 0 0 0 0 0 0 0 0 0 0 0 0 0 0 0 0 0
February 0 0 0 0 0 0 0 0 0 0 9 1.6 11.5 0 0 10.6 0 1.6 0 0 0 0 0 0 0 0 0 0
March 9.4 18.8 0 9 7.4 0 2.5 0 0 38.5 0 0 10.2 41.7 0 3.3 9 15 0 17.2 0 5.7 0 2 0 0 9 0 0 0 0
April 0 0 0 0 0 8.2 0 0 0 0 3.3 2.5 12.3 3.3 36 0 8.2 4.7 1.6 5.1 20 19.6 0 0 29.4 4.3 0 0 18 19.6
May 0 7.4 0 0.8 3.3 0 63 0 32.7 0 0 0 5.7 0 9 0 0 10.2 39.3 31.9 8.2 17.6 0 0 9 0 9 9 0 0 7.4
June 0 26.6 0 0 0 77 0 0 0 0 0 0 30 0 0 8.2 15.5 0 0 0 0 0 0 0 0 0 6.5 0 13.9 31.9
July 0 0 0 0 0 12 6.1 0 0 5.7 0 0 27 0 0 0 7.8 37.6 0 0 0 0 0 0 0 0 0 0 15.5 0 0
August 0 13.1 4.9 0 0 24 0 0 7.8 0 0 0 0 0 0 0 7.4 0 0 0 30.3 2.5 7.4 0 0 0 0 15.5 0 7 8.6
September 13.1 5.7 0 1.6 0 0 0 0 4.9 25.4 0 3.3 10.6 0 2.5 4.1 0 0 5.7 0 1.6 0 1.6 4.9 9.8 6.5 4.9 0 4.1 2.9
October 6.5 3.3 0 0 27 14 9.8 2.5 3.3 0 0 14 1.6 2 5.3 0 0 0 0 10.6 2.9 3.3 11.5 11 13.1 16.4 15.5 17.2 9.4 15.5 39.7
November 0 0 40 4.1 4.5 5.7 6.8 0 2 2.9 3.4 0 25.4 0 1.6 7.4 10.6 0 3.3 0 0 0 6.5 1.6 0 0 0 0 0 0
December 0 0 0 0 0 0 0 0 11.5 1.6 4.1 2.9 0 0 0 0 6.8 0 49.9 1.6 19.7 7 6.5 14.3 0 0 0 4.3 13.9 4.5 0
2003 January 8.2 0 8.3 5.7 2.9 0 0 0 0 0 0 0 0 0 0 0 0 0 0 21.3 3.3 0 0 0 0 0 0 0 0 0 0
February 0 0 0 0 0 0 0 0
0 0 0 0 12.3 0 0 0 0 0 0 0 0 0 0 0 23.7 3.7 0
March 0 0 0 0 0 0 0 0 0 0 0 0 0 11.9 5.7 0 0 0 0 0 0 0 0 0 0 0 5.7 0 0 27 0
April 0 1.6 2.9 2.9 0 0 0 0 0 0 0 0 3.3 2.9 36 10.6 8.2 0 20.5 6.1 12.3 9 0 58.9 9.8 12.3 31.9 6.5 0 0
May 0 10.6 0 18.8 19.6 0 7 33.1 0 4.1 0 4.1 0 12.3 0 0 0 0 0 0 0 0 15.1 0 10.6 14.8 6.5 0 19.6 1.6 20.5
June 11.5 16.4 12 3.3 20.5 0 0 0 0 8.2 0 0 0 24.5 17.2 0 0 0 0 2.9 5.3 0 32.7 2.9 3.3 11.5 7.8 14.3 4.9 9.4
July 8.2 0.6 0 0 0 5.7 4.1 0 7 7.4 0 0 12.3 0 0 0 19.6 3.3 9.8 0 2.9 18.8 9 16.4 0 0 0 0 0 0 0
August 0 0 0 0 27 8.6 11 0 2.5 0 0 0 33.6 0 2.9 0 6.5 0 1.2 3.7 0 6.1 16.6 0 3.4 0 0 3.3 3.3 3.3 22.1
September 0 6.5 0 0 0 13 10.5 11.5 0 4.5 13.9 0 25.8 1.6 22.1 25.8 23.3 1.6 0 1.6 8.2 4.9 22.9 7.4 1.6 0 0 0 5.7 0
October 10.6 0 31 3.7 0 6.5 0 0 1.6 0 0 0 9.8 0 2 0 5.7 4.1 0 0 0 0 5.3 0 0 5.5 4 0 0 4.3 0