Embed Size (px)
Citation preview

Landscape report of K-12 Computer Science Education in Illinois
June 1, 2021 Raya Hegeman-Davis, PhD Madison Sewell College of Education College of Education University of Illinois, Urbana – Champaign University of Illinois, Urbana – Champaign [email protected] [email protected] ACKNOWLEDGEMENT This research is funded through a grant from the CME Group Foundation.

Landscape report of K-12 Computer Science Education in Illinois
2
Table of Contents Executive Summary 2 Overview 9
Purpose of this Report 9 Data Collection 10 Caveats 12 State Level CS Considerations 12
Recent Computer Science Legislation 12 Teacher Training Programs 12 Findings – In School Computer Science Offerings 13 Respondent Demographics 13 Computer Science Offerings 14 Computer Science Educator Backgrounds 15 Perceptions of Computer Science 16 Differences by region 17 Differences by locale 18 Differences by school type 19 School districts that offer CS vs. School districts that do not 19 Barriers in Computer Science Education 20 Differences by title 21
Differences by region 21 Differences by locale 22 Differences by school type 23 School districts that offer CS vs school districts that do not 24 Advanced Placement Computer Science Courses 25 Key Takeaways 25
Most critical barriers 25
Urban / rural divide 26
Districts offering CS vs districts not offering CS 26
Course Offerings 26
Findings - Out of school CS offerings 27
Out of School Educator Background 30
Perceptions of computer science 31
Barriers to out of school computer science programs 31
Key Takeaways 32
Recommendations 32
Teacher training 33
Course offerings 33
Administrator support 33
Future study 34 Acknowledgements 35 EndNotes 36 Appendix A 37
Landscape report of K-12 Computer Science Education in Illinois
3
Executive Summary
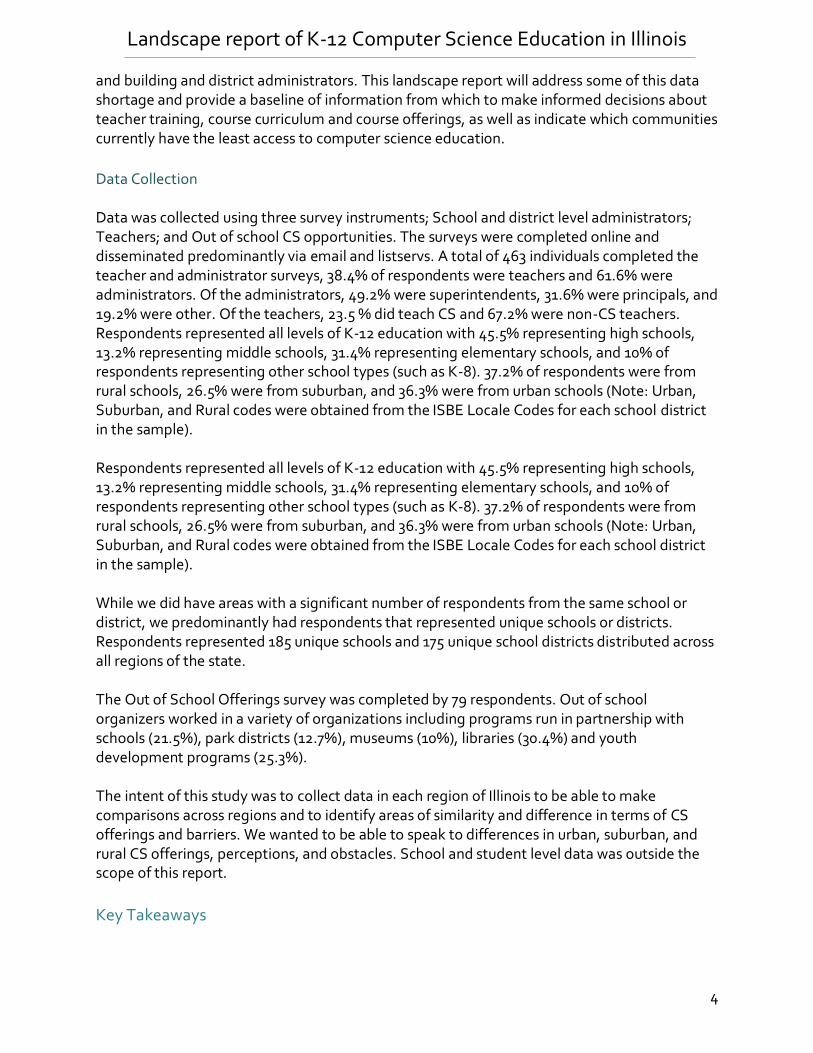
Introduction The modern, digital workforce requires the development of a different set of skills than what has been needed in previous generations. Computing represents the number one source of new wages in the U.S. Economy with over 14,000 unfilled computing jobs in Illinois alone.i However, all students, regardless of career or education goals will need to have at least a basic understanding of computational thinking and computer science principles to be successful in the workforce. Currently, nearly eight in 10 middle-skill jobs (more than a high school diploma, less than a bachelor’s) now require digital skillsii. Access to computer science and computational thinking courses is not only a matter of workforce development, but also of equity. Rural and low resources schools are less likely to offer computer science courses and are less likely to have teachers with CS certifications. A poll by Google / Gallup found that this, in large part, was because there was a lack of CS-skilled teachers and a lack of budget to train or hire teachersiii. Women, African-American, and Hispanic professionals remain underrepresented in STEM jobs, both in Illinois and nationally. Nearly 10% of the overall Illinois workforce is African-American, yet only represent about 5% of the STEM workforceiv. Research has shown that early access to computer science courses increases the likelihood of women and underrepresented students choosing CS related careers. In fact, Code.Org found that women who try AP Computer Science in high school are ten times more likely to major in it and Black and Latinx students are seven times more likelyv. Thus, increasing access to computer science courses at the high school level, and even earlier, greatly impacts pipelines to high wage jobs for students of color and women. Many other states have begun to recognize the crucial need for access to computational thinking and computer science across the K-12 spectrum and taken important steps for CS education, such as developing state plans for CS Ed, adopting K-12 Student CS Standards, and creating an office of Computer Science Education. 34 states have approved K-12 computer science standards with another 5 states in the process of approving student standards, including all of Illinois’ direct neighbors. 26 states have state-level funding for CS Ed professional learning and 21 states have a state-level computer science supervisorvi. There is some urgency to the need for a state effort towards K-12 computer science education. In the near future, states such as Arkansas will begin graduating students who have had computational thinking or computer science for a large part of their educational experience. Those students will be better prepared to work and innovate in the new digital workforce than Illinois students. It will become increasing difficult for Illinois to “catch-up” with other states without taking action.
Purpose of this report Currently there is very little data about what computer science courses are being taught in Illinois schools, where, and by whom as well as perceptions of the barriers to providing CS courses in schools, and perceptions of the future of K-12 CS education according to teachers
Landscape report of K-12 Computer Science Education in Illinois
4
and building and district administrators. This landscape report will address some of this data shortage and provide a baseline of information from which to make informed decisions about teacher training, course curriculum and course offerings, as well as indicate which communities currently have the least access to computer science education.
Data Collection
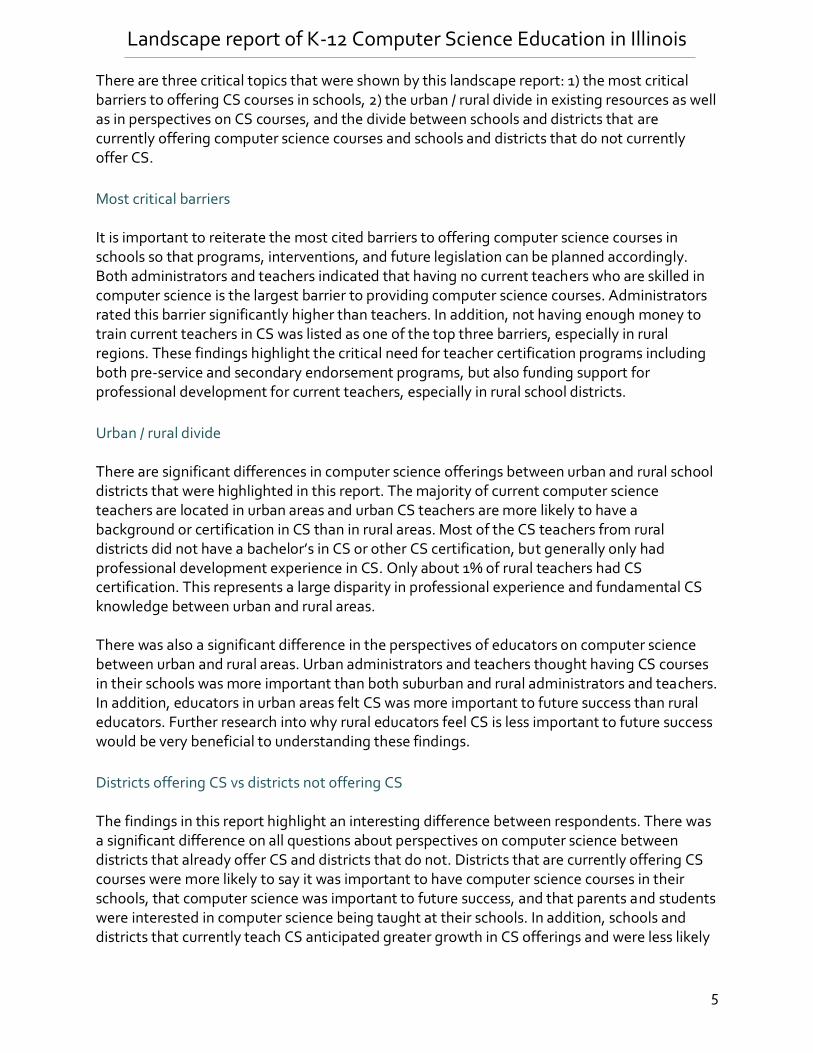
Data was collected using three survey instruments; School and district level administrators; Teachers; and Out of school CS opportunities. The surveys were completed online and disseminated predominantly via email and listservs. A total of 463 individuals completed the teacher and administrator surveys, 38.4% of respondents were teachers and 61.6% were administrators. Of the administrators, 49.2% were superintendents, 31.6% were principals, and 19.2% were other. Of the teachers, 23.5 % did teach CS and 67.2% were non-CS teachers. Respondents represented all levels of K-12 education with 45.5% representing high schools, 13.2% representing middle schools, 31.4% representing elementary schools, and 10% of respondents representing other school types (such as K-8). 37.2% of respondents were from rural schools, 26.5% were from suburban, and 36.3% were from urban schools (Note: Urban, Suburban, and Rural codes were obtained from the ISBE Locale Codes for each school district in the sample). Respondents represented all levels of K-12 education with 45.5% representing high schools, 13.2% representing middle schools, 31.4% representing elementary schools, and 10% of respondents representing other school types (such as K-8). 37.2% of respondents were from rural schools, 26.5% were from suburban, and 36.3% were from urban schools (Note: Urban, Suburban, and Rural codes were obtained from the ISBE Locale Codes for each school district in the sample). While we did have areas with a significant number of respondents from the same school or district, we predominantly had respondents that represented unique schools or districts. Respondents represented 185 unique schools and 175 unique school districts distributed across all regions of the state. The Out of School Offerings survey was completed by 79 respondents. Out of school organizers worked in a variety of organizations including programs run in partnership with schools (21.5%), park districts (12.7%), museums (10%), libraries (30.4%) and youth development programs (25.3%). The intent of this study was to collect data in each region of Illinois to be able to make comparisons across regions and to identify areas of similarity and difference in terms of CS offerings and barriers. We wanted to be able to speak to differences in urban, suburban, and rural CS offerings, perceptions, and obstacles. School and student level data was outside the scope of this report.
Key Takeaways
Landscape report of K-12 Computer Science Education in Illinois
5
There are three critical topics that were shown by this landscape report: 1) the most critical barriers to offering CS courses in schools, 2) the urban / rural divide in existing resources as well as in perspectives on CS courses, and the divide between schools and districts that are currently offering computer science courses and schools and districts that do not currently offer CS.
Most critical barriers It is important to reiterate the most cited barriers to offering computer science courses in schools so that programs, interventions, and future legislation can be planned accordingly. Both administrators and teachers indicated that having no current teachers who are skilled in computer science is the largest barrier to providing computer science courses. Administrators rated this barrier significantly higher than teachers. In addition, not having enough money to train current teachers in CS was listed as one of the top three barriers, especially in rural regions. These findings highlight the critical need for teacher certification programs including both pre-service and secondary endorsement programs, but also funding support for professional development for current teachers, especially in rural school districts.
Urban / rural divide There are significant differences in computer science offerings between urban and rural school districts that were highlighted in this report. The majority of current computer science teachers are located in urban areas and urban CS teachers are more likely to have a background or certification in CS than in rural areas. Most of the CS teachers from rural districts did not have a bachelor’s in CS or other CS certification, but generally only had professional development experience in CS. Only about 1% of rural teachers had CS certification. This represents a large disparity in professional experience and fundamental CS knowledge between urban and rural areas. There was also a significant difference in the perspectives of educators on computer science between urban and rural areas. Urban administrators and teachers thought having CS courses in their schools was more important than both suburban and rural administrators and teachers. In addition, educators in urban areas felt CS was more important to future success than rural educators. Further research into why rural educators feel CS is less important to future success would be very beneficial to understanding these findings.
Districts offering CS vs districts not offering CS The findings in this report highlight an interesting difference between respondents. There was a significant difference on all questions about perspectives on computer science between districts that already offer CS and districts that do not. Districts that are currently offering CS courses were more likely to say it was important to have computer science courses in their schools, that computer science was important to future success, and that parents and students were interested in computer science being taught at their schools. In addition, schools and districts that currently teach CS anticipated greater growth in CS offerings and were less likely

Landscape report of K-12 Computer Science Education in Illinois
6
to list not having enough money in school budget to train current teachers or lack of equipment as significant barriers to offering computer science. These findings seem to indicate that a significant shift in perspective happens once computer science courses become part of the curricular offerings. It may be that some educators, schools, or communities do not see themselves as computer scientists or part of the “tech” community. More research on how and why these perspectives change would help to understand how to advocate for inclusion of computer science in schools and districts that do not currently have any CS courses.
Course Offerings One additional finding is worth additional discussion; there is a shortage of intermediate and advanced computer science courses. Of the courses taught by respondents, 82% of them were introductory level courses. In addition, only 15% of non-AP courses and 17.5% of AP courses were counted as core curricula. All other CS courses were electives. It is critical that a spectrum of courses from introductory through advanced computer science be available to students in every district, but also that courses be allowed to count towards core graduation requirements.
Out of School Opportunities The findings from this report showed that there are a wide variety of organizations running an even wider variety of computer science programming. Respondents listed opportunities from coding clubs, to robotics, to app inventors, video game design, and 3d printers and maker spaces. These programs were offered to participants from age 6 to 15+. Once again, however, most offerings were at the beginner level. There seems to be a critical lack of options to continue to progress in computer science beyond the introductory level.
Recommendations Many of the findings in this report follow trends found in similar reports from other states. For example, the urban / rural divide and teacher shortage findings were a confirmation of anticipated results, but still help inform our understanding that “down state” currently has fewer CS education opportunities than the Chicagoland area. These findings help to provide an in-depth understanding of the particular needs of schools and districts in Illinois and what resources and supports are necessary to expand both access and equity in K-12 CS education. Based on the findings in this report we make the following recommendations:
Teacher training The number one barrier identified by both school administrators and teachers was a lack of trained CS teachers, additionally, lack of funds to train current teachers in CS was also identified as a significant barrier, especially in rural areas. A shortage of certification and professional development opportunities exacerbates this issue with many rural and peri-urban

Landscape report of K-12 Computer Science Education in Illinois
7
teachers unable to attend or afford courses or training opportunities offered solely in the Chicagoland area. We recommend a state appropriation for computer science professional development opportunities paired with a partnership effort of IIN hubs or other agencies and institutions to provide PD opportunities to teachers in all regions of the state at a significantly reduced rate or free of charge. We also recommend a focus by more institutions of higher education to provide both secondary CS endorsement programs as well as pre-service undergraduate pathways in computer science to being to start producing new CS teachers to address the increasing teacher shortage in Illinois.
Course offerings The findings indicated a large focus, both in and out of school, on introductory level computer science courses. In addition, only a relatively small percentage of CS courses (15% of non-AP courses and 17.5% of AP) were counted as core curricula. These findings, combined with data showing that the vast majority of CS courses are taught in the Chicagoland area, indicate that there is likely a critical shortage of opportunities for many students to continue to grow and be challenged in computer science. We recommend an intentional focus on providing professional development to support and develop more advanced computer science concepts for educators, especially for educators outside of the urban northeast region. We also recommend increased advocacy by CS education groups, higher education institutions and the Illinois State Board of Education to school districts to increase support for allowing computer science courses to count as core curricula.
Administrator support Educators from middle schools ranked “no district level support system for CS implementation” as a more significant barrier than both elementary and high school educators. If there is a lack of support, or perceived need for CS in middle schools, by district level administrators, that could result in a CS desert between elementary and high school which could severely limit or impact student growth and opportunities. It is critical to ongoing success and growth of CS programs for both district and building level administrators to support and advocate for such classes. We recommend an allocation of time and resources by stakeholder groups, such as institutions of higher education, CS education agencies, and the Illinois State Board of Education, to work with district level administrators to build greater support for and interest in computer science education. The direct result of this work will be district level administrators working with school level administrators and educators to examine curricular options, identify space in the school day
Landscape report of K-12 Computer Science Education in Illinois
8
for CS, and securing training or other professional development opportunities to build capacity and confidence of staff and educators.

Landscape report of K-12 Computer Science Education in Illinois
9
Overview In the past decade Chicago Public Schools has been an innovative and inspirational leader towards the aim of Computer Science for All. CPS was the first district in the country to launch the CS4All initiative by implementing a high school graduation requirement that included a year of computer science. CPS has also kept equity and inclusion at the heart of the CS4ALL initiative through the use of the Exploring Computer Science curriculum and equity focused trainings and supports. Unfortunately, despite the great work done in Chicago, Illinois as a state has not made the same strides in access and equity as CPS. In fact, until very recently, Illinois ranked in the bottom third of States in terms of Code.org’s nine policy framework, which is frequently used to measure the health of K-12 computer science across the United States. Of the policies tracked by Code.org, Illinois still does not have any preservice teacher education programs in computer science, a state plan for CS, dedicated computer science positions in state education agencies, or dedicated funding for CS professional development. Only very recently did Illinois address a few other policies including adopting K-12 CS Education standards, having a definition of computer science, and requiring all secondary schools to provide the opportunity for students to take computer science. The lack of focus on a statewide implementation of K-12 computer science education has wide ranging ramifications. A study completed at Oxford Universityvii estimated that by 2033, 47 percent of jobs will be automated. That means that students who entered kindergarten this year (2020 – 2021) will graduate high school into a workforce dominated by technology. It is critical that our current K-12 students have access to high-quality CS courses throughout their educational careers to ensure they are able to succeed and excel in our modern workforce. Further, tech jobs proved to be resilient during the COVID-19 crisisviii, which is yet another reason why it is so important that we see greater equity and inclusion in CS classes and in the CS and tech workforce. Disparity in access at the K-12 level also has lasting impacts through the school to work pipeline. In the 2018 – 2019 academic year, of the graduates from Computer Science, Information Science, and Computer Engineering from the entire University of Illinois System, only 1.7% were Black or African American and 4% were Hispanic / Latinx. In addition, women, African American, and Hispanic professionals remain underrepresented in STEM jobs, both in Illinois and nationally. Nearly 10% of the overall Illinois workforce is African American, yet only represent about 5% of the STEM workforceix. Research has shown that increasing access to computer science, especially AP CS A at the high school level, significantly increases interested and enrolment in STEM related fields in higher educationx.
Purpose of this report In fall of 2019 the first Illinois Statewide K-12 Computer Science Education Summit was organized by a team from UIUC, CS4IL, CPS, ISU, and others and held at the National Center for Supercomputing Applications (NCSA) in Urbana. This summit brought together a diverse

Landscape report of K-12 Computer Science Education in Illinois
10
set of participants from across the state and from a wide variety of stakeholder groups with two main goals: 1) to begin to create a network of CS stakeholders in the state of Illinois and 2) to begin a discussion on the creation of a State Plan for K-12 CS Education in Illinois. During this summit, and subsequent conversations with various stakeholders, it became clear that there was a lack of data about CS education from which to base decisions about how to expand CS Education in Illinois. More information was needed on who was teaching CS, in what parts of the state they were teaching, perceptions on the barriers to providing CS courses in schools, and perceptions of the future of K-12 CS education according to teachers and building and district administrators. The purpose of this report is to address some of these gaps in data and create a baseline from which to measure progress as well as to help identify the issues and barriers that teachers and administrators feel most prevent the inclusion or success of CS classes in their schools and districts. We view this landscape report as a first step in collecting necessary data, especially outside of the Chicago area, to identify both successes and areas for improvement in computing education in Illinois.
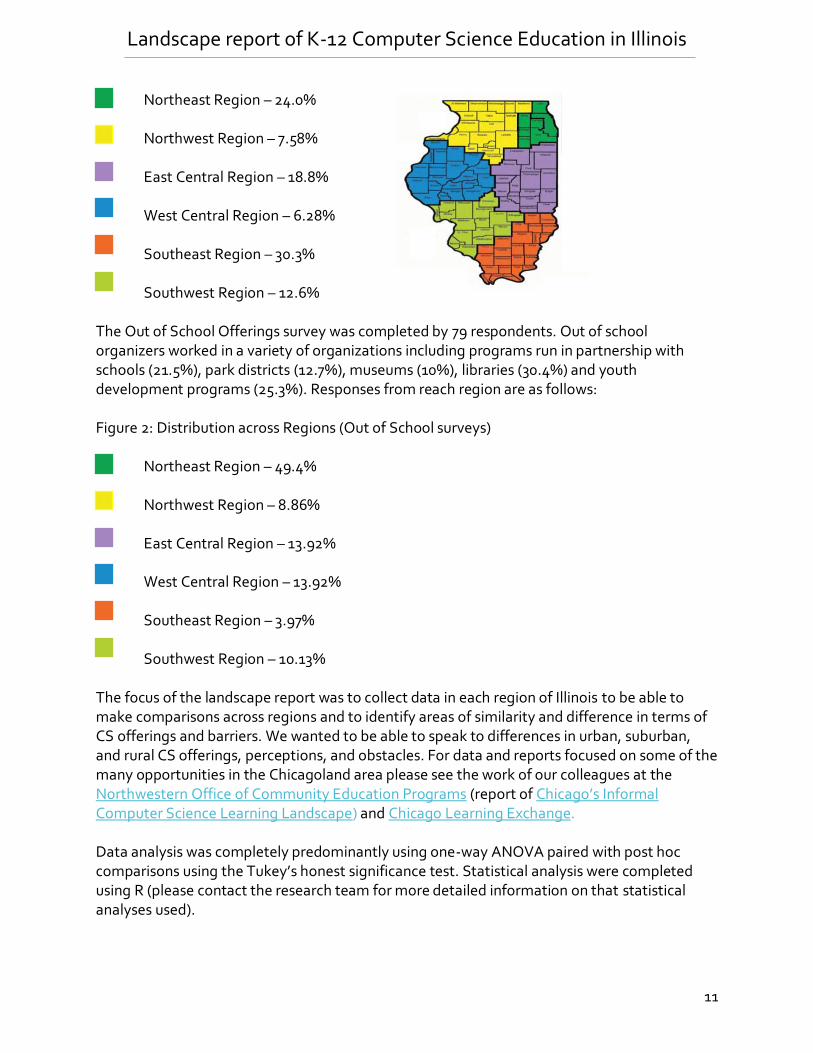
Data Collection Data was collected using three survey instruments; School and district level administrators; Teachers; and Out of school CS opportunities. The surveys were completed online and disseminated predominantly via email and listservs. A total of 463 individuals completed the teacher and administrator surveys, 38.4% of respondents were teachers and 61.6% were administrators. Of the administrators, 49.2% were superintendents, 31.6% were principals, and 19.2% were other adminstrative staff. Of the teachers, 23.5 % taught CS and 67.2% were non-CS teachers. Respondents represented all levels of K-12 education with 45.5% representing high schools, 13.2% representing middle schools, 31.4% representing elementary schools, and 10% of respondents representing other school types (such as K-8). 37.2% of respondents were from rural schools, 26.5% were from suburban, and 36.3% were from urban schools (Note: Urban, Suburban, and Rural codes were obtained from the ISBE Locale Codes for each school district in the sample). While we did have areas with a significant number of respondents from the same school or district, we predominantly had respondents that represented unique schools or districts. Respondents represented 185 unique schools and 175 unique school districts distributed across all regions of the state. Responses from each region are as follows:
Figure 1: Distribution across Regions (School-based surveys)
Landscape report of K-12 Computer Science Education in Illinois
11
Northeast Region – 24.0% Northwest Region – 7.58% East Central Region – 18.8% West Central Region – 6.28% Southeast Region – 30.3% Southwest Region – 12.6%
The Out of School Offerings survey was completed by 79 respondents. Out of school organizers worked in a variety of organizations including programs run in partnership with schools (21.5%), park districts (12.7%), museums (10%), libraries (30.4%) and youth development programs (25.3%). Responses from reach region are as follows: Figure 2: Distribution across Regions (Out of School surveys)
Northeast Region – 49.4% Northwest Region – 8.86% East Central Region – 13.92% West Central Region – 13.92% Southeast Region – 3.97% Southwest Region – 10.13%
The focus of the landscape report was to collect data in each region of Illinois to be able to make comparisons across regions and to identify areas of similarity and difference in terms of CS offerings and barriers. We wanted to be able to speak to differences in urban, suburban, and rural CS offerings, perceptions, and obstacles. For data and reports focused on some of the many opportunities in the Chicagoland area please see the work of our colleagues at the Northwestern Office of Community Education Programs (report of Chicago’s Informal Computer Science Learning Landscape) and Chicago Learning Exchange. Data analysis was completely predominantly using one-way ANOVA paired with post hoc comparisons using the Tukey’s honest significance test. Statistical analysis were completed using R (please contact the research team for more detailed information on that statistical analyses used).

Landscape report of K-12 Computer Science Education in Illinois
12
Caveats This landscape report was completed over the course of one academic year, by a small team of two researchers, during a global pandemic which immensely impacted schools and educators. Due to these factors, response rates in some regions were lower than others and there were many instances of respondents starting surveys and not completing them, thus impacting the total number of participants. The scope of this landscape report only included information gathered from educators (in and out of school) and administrators. This survey does not address any student level data including student demographics, pass rates, or issues of diversity or equity at the student level. While this data is vital and important, it was outside of the scope of this report.
State Level CS considerations
Recent Computer Science Legislation In March of 2021, Governor Pritzker signed House Bill (HB) 2170, known as the Education and Workforce Equity Act. This was a very large omnibus education bill that contained a variety of education initiatives including some new computer science requirements. HB2170 included the following computer science legislation:
• CS definition: IL will adopt a definition for 'computer science'. The definition used:
“Computer science" means the study of computers and algorithms, including their
principles, their hardware and software designs, their implementation, and their impact on
society. "Computer science" does not include the study of everyday uses of computers
and computer applications, such as keyboarding or accessing the Internet.
• CS standards: by Dec 1, 2021 IL will adopt standards for K-12 CS education. • CS course catalog: by Dec 1, 2021, IL will analyze and revise, if appropriate, existing
course titles dedicated to computer science or develop a short list of existing course titles that are recommended for computer science courses.
• CS offerings at every HS: by the 2023-24 school year, all high schools will be required to provide students the opportunity to take a CS course.
• CS reporting: schools will be required to report their CS curriculum offerings on the state report card.
This new CS legislation is a great step for Illinois and provides an important framework for continued growth in the state. Increasing access through requiring every school to offer the opportunity to take a CS course and ensuring that all K-12 CS courses meet a rigorous set of standards are critical to achieving both access and equity in CS.
Teacher Training Programs There are currently only two programs in Illinois which offer a CS endorsement pathway for current teachers; Illinois State University, in partnership with Northeastern Illinois University,
Landscape report of K-12 Computer Science Education in Illinois
13
and the University of Illinois, Urbana – Champaign (just launched in summer of 2021). A preservice computer science teacher education program is in-development at UIUC, however, at the time of the writing of this report, there are no active pre-service computer science teacher programs in Illinois. There are also alternative licensure programs in Illinois for computer science. Career changers with 2000+ hours of industry experience can apply for a Career and Technical Education (CTE) license and be eligible to teach CS courses that are housed within CTE departments. There is also an alternative licensure program at Saint Xavier University for people who studied computer science or related subjects for an undergraduate degree and have subsequently developed an interested in teaching. At the time of the writing of this report, the Saint Xavier University alternative licensure program was the only program of its kind in Illinois.
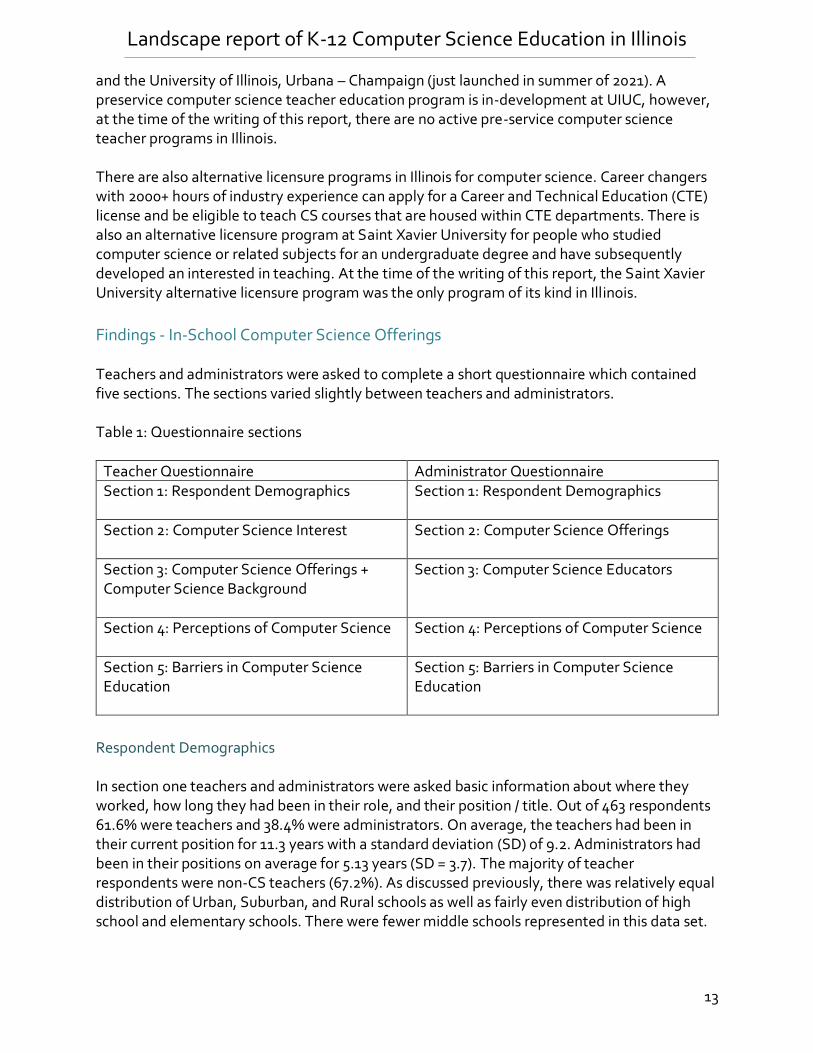
Findings - In-School Computer Science Offerings Teachers and administrators were asked to complete a short questionnaire which contained five sections. The sections varied slightly between teachers and administrators. Table 1: Questionnaire sections
Teacher Questionnaire Administrator Questionnaire Section 1: Respondent Demographics
Section 1: Respondent Demographics
Section 2: Computer Science Interest
Section 2: Computer Science Offerings
Section 3: Computer Science Offerings + Computer Science Background
Section 3: Computer Science Educators
Section 4: Perceptions of Computer Science
Section 4: Perceptions of Computer Science
Section 5: Barriers in Computer Science Education
Section 5: Barriers in Computer Science Education
Respondent Demographics In section one teachers and administrators were asked basic information about where they worked, how long they had been in their role, and their position / title. Out of 463 respondents 61.6% were teachers and 38.4% were administrators. On average, the teachers had been in their current position for 11.3 years with a standard deviation (SD) of 9.2. Administrators had been in their positions on average for 5.13 years (SD = 3.7). The majority of teacher respondents were non-CS teachers (67.2%). As discussed previously, there was relatively equal distribution of Urban, Suburban, and Rural schools as well as fairly even distribution of high school and elementary schools. There were fewer middle schools represented in this data set.

Landscape report of K-12 Computer Science Education in Illinois
14
Figure 3: Distribution of respondents across school types
Figure 4: Distribution of respondents in Urban, Suburban, and Rural Schools
Computer Science Offerings This section asked about computer science offerings at participant’s schools. This definition was provided at the top of the section:
Computer science can be defined as “the study of computers and algorithmic processes, including their principles, their hardware and software designs, their implementation, and their impact on society” (from Trends in Computer Science). Please note, this is different from Computer Literacy (e.g. keyboarding/typing skills, PowerPoint/word/excel skills, etc.) and Digital Citizenship (e.g. creating secure passwords, safe use of the internet, etc.)
Participants were asked, based on the definition provided, whether their school offered / if they taught computer science courses, computer literacy courses, or digital citizenship courses.
0% 10% 20% 30% 40% 50%
Elementary
Middle
High
Other
0% 10% 20% 30% 40% 50%
Urban
Suburban
Rural

Landscape report of K-12 Computer Science Education in Illinois
15
Figure 5: CS offerings by region
49 percent of administrators reported CS offerings in their schools while only 24% of teachers reported teaching CS (notably, however, of the teachers who self-identified as CS teachers, 70% reported teaching CS courses in alignment with the definition provided). A large percentage of these offerings were located in the Northeast region of the state. There was a statistically significant difference (p < .001) in teachers who reported teaching CS in urban vs rural areas with the majority of self-reported CS teachers located in Urban areas.
Figure 6: CS teachers by locale
The questionnaire asked about the types of CS courses offered in schools as well as additional offerings, either during the course of the school day, or as afterschool activities. Of the CS courses taught by respondents, 82% were introductory or beginner level courses, 46% were intermediate, and 51% were advanced or AP level courses. Of the non-AP courses taught, only 15% of the courses counted as core curricula (12% math, 3% science). 29% of non AP CS courses were elective CTE courses and 24% were “other” (this included some fine arts requirements, but was primarily listed as the CPS graduation requirement). Of the AP CS courses, 17.5% counted as a core math class. 13% of AP CS courses were a CTE elective and 14% were listed as “other” types of credit (such as fine arts). Of the respondents who were CS teachers, 66% of them reported also teaching non-CS courses. Teachers reported that, outside of courses that are explicitly computer science, schools predominantly provided Hour-of-Code-type activities once a year (41%) rather than activities that occurred more than once a year (11%). 62% of teachers reported that their schools offered afterschool CS opportunities (such as coding clubs, robotics clubs, App development clubs, Scouting events, Cyber security clubs, and more).
Computer Science Educator Backgrounds
0
0.1
0.2
0.3
0.4
0.5
0.6
0.7
CS Offerings
Northeast Northwest East Central
West Central Southeast Southwest
0
0.1
0.2
0.3
0.4
0.5
0.6
0.7
CS Teachers
Urban Suburban Rural
Landscape report of K-12 Computer Science Education in Illinois
16
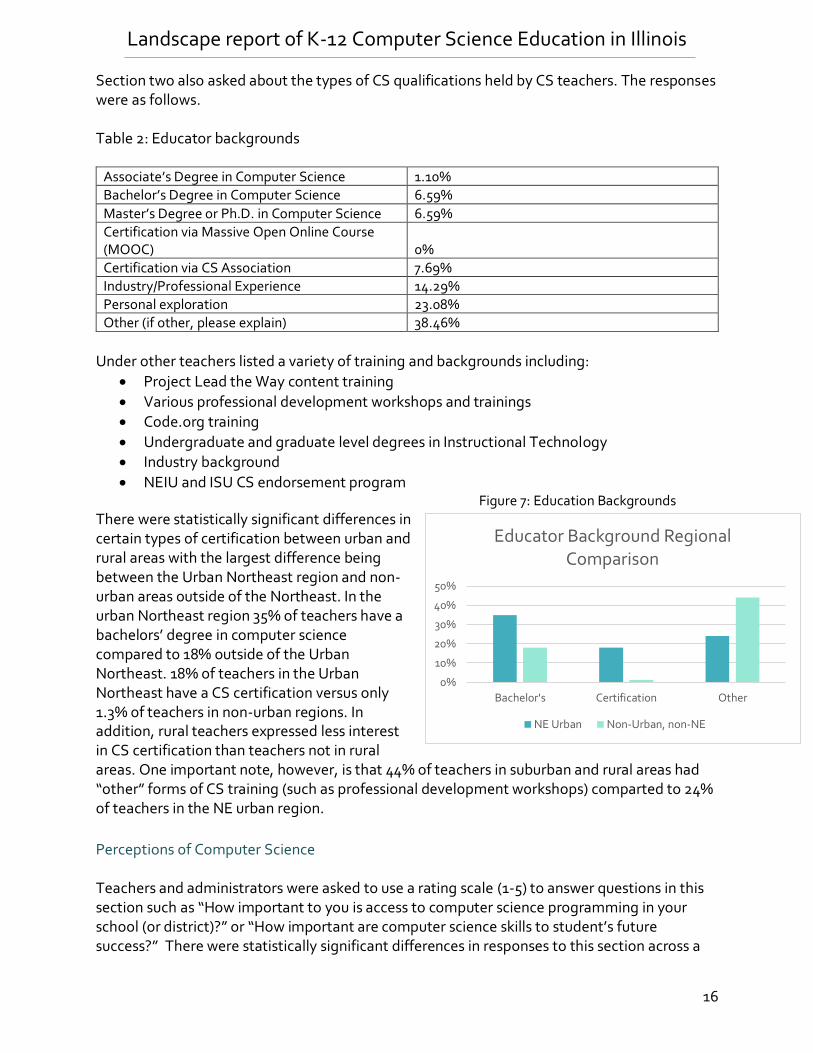
Section two also asked about the types of CS qualifications held by CS teachers. The responses were as follows. Table 2: Educator backgrounds
Associate’s Degree in Computer Science 1.10% Bachelor’s Degree in Computer Science 6.59% Master’s Degree or Ph.D. in Computer Science 6.59% Certification via Massive Open Online Course (MOOC) 0% Certification via CS Association 7.69% Industry/Professional Experience 14.29% Personal exploration 23.08% Other (if other, please explain) 38.46%
Under other teachers listed a variety of training and backgrounds including:
• Project Lead the Way content training
• Various professional development workshops and trainings • Code.org training
• Undergraduate and graduate level degrees in Instructional Technology • Industry background
• NEIU and ISU CS endorsement program Figure 7: Education Backgrounds
There were statistically significant differences in certain types of certification between urban and rural areas with the largest difference being between the Urban Northeast region and non-urban areas outside of the Northeast. In the urban Northeast region 35% of teachers have a bachelors’ degree in computer science compared to 18% outside of the Urban Northeast. 18% of teachers in the Urban Northeast have a CS certification versus only 1.3% of teachers in non-urban regions. In addition, rural teachers expressed less interest in CS certification than teachers not in rural areas. One important note, however, is that 44% of teachers in suburban and rural areas had “other” forms of CS training (such as professional development workshops) comparted to 24% of teachers in the NE urban region.
Perceptions of Computer Science Teachers and administrators were asked to use a rating scale (1-5) to answer questions in this section such as “How important to you is access to computer science programming in your school (or district)?” or “How important are computer science skills to student’s future success?” There were statistically significant differences in responses to this section across a
0%
10%
20%
30%
40%
50%
Bachelor's Certification Other
Educator Background Regional Comparison
NE Urban Non-Urban, non-NE
Landscape report of K-12 Computer Science Education in Illinois
17
variety of groupings including differences by region, locale (urban, suburban, or rural) and by school type (high school, middle school, or grade school). One question resulted in a statistically significant difference between administrators and teachers. When asked “In the next three years, do you anticipate the number of computer science courses in your district will increase, stay the same or decrease”, administrators reported anticipating greater growth than teachers. However, it is important to note that teachers, on average, expected the number of computer science courses in their district would grow.
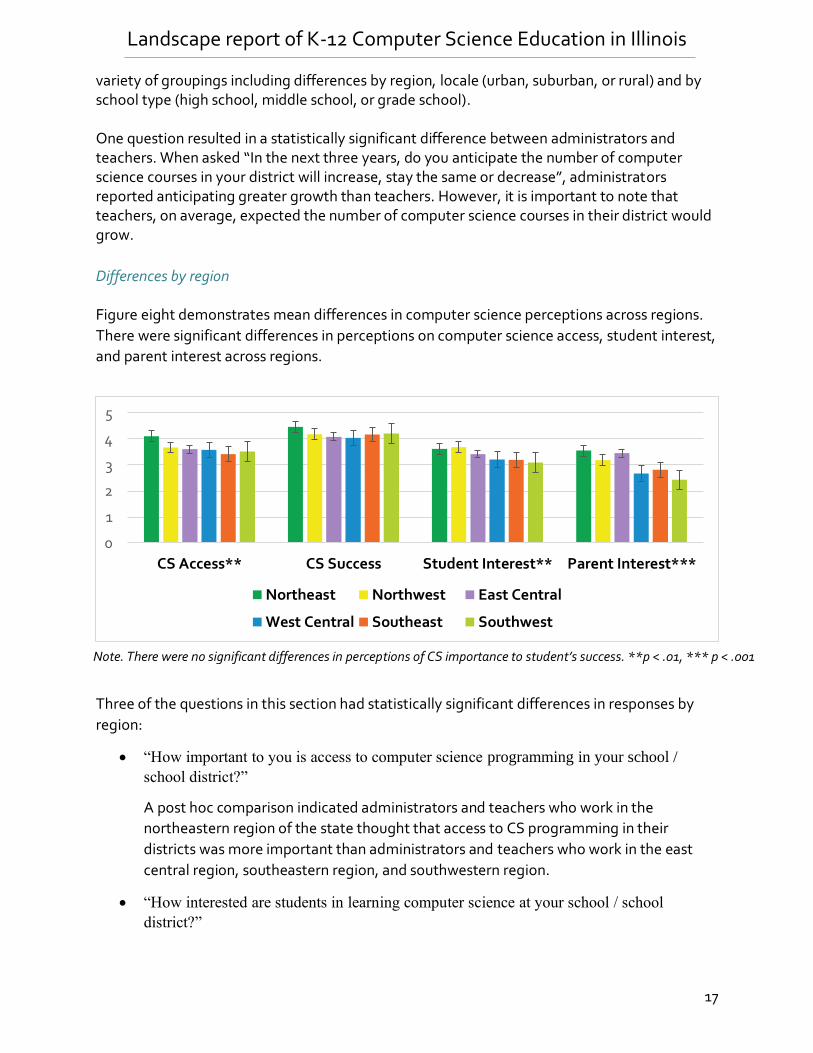
Differences by region Figure eight demonstrates mean differences in computer science perceptions across regions.
There were significant differences in perceptions on computer science access, student interest,
and parent interest across regions.
Three of the questions in this section had statistically significant differences in responses by
region:
• “How important to you is access to computer science programming in your school /
school district?”
A post hoc comparison indicated administrators and teachers who work in the
northeastern region of the state thought that access to CS programming in their
districts was more important than administrators and teachers who work in the east
central region, southeastern region, and southwestern region.
• “How interested are students in learning computer science at your school / school
district?”
0
1
2
3
4
5
CS Access** CS Success Student Interest** Parent Interest***
Northeast Northwest East Central
West Central Southeast Southwest
Note. There were no significant differences in perceptions of CS importance to student’s success. **p < .01, *** p < .001

Landscape report of K-12 Computer Science Education in Illinois
18
The post hoc comparison indicated administrators and teachers who work in the
northeastern region thought that students were more interested in learning CS than
administrators and teachers who work in the southeastern region and southwestern
region.
• “How interested are parents in incorporating computer science classes in your school /
school district?”
Data analysis indicated administrators and teachers who work in the northeastern
region thought that parents were more interested in having CS learning opportunities
than administrators and teachers who work in the southeastern region, southwestern
region, and west central region. In addition, administrators and teachers who work in
the east central region thought that parents were more interested in having CS learning
opportunities than parents in the southwest region.
Differences by locale Figure nine demonstrates mean differences in computer science perceptions across locales.
There were significant differences in perceptions on computer science access and computer
science importance for success
Note. There were no significant differences in perceptions of student and parent interest. **p < .01, *** p <
.001
Two questions in this section had statistically significant differences in responses by locale:
• “How important to you is access to computer science programming in your school /
school district?”
A post hoc comparison indicated administrators and teachers who work in the urban
areas of the state thought that access to CS programming in their districts was more
important than administrators and teachers who work in suburban areas, and rural
areas.
• “How important are computer science skills to student’s future success?”
0
1
2
3
4
5
CS Access** CS Success***
Urban Suburban Rural

Landscape report of K-12 Computer Science Education in Illinois
19
The post hoc comparison indicated administrators and teachers who work in the urban
areas of the state thought that access to CS programming in their districts was more
important than administrators and teachers who work in rural areas.
Differences by school type There were two questions in this section with statistically significant differences in responses
by school type:
• “How important to you is access to computer science programming in your school /
school district?”
Data analysis indicated administrators and teachers who work in high schools thought
that access to CS programming in their districts was more important than
administrators and teachers who work in elementary schools.
• “How interested are parents in incorporating computer science classes in your school /
school district?”
The post hoc comparison test indicated administrators and teachers who work in high
schools thought that parents were more interested in having CS learning opportunities
than administrators and teachers who work in elementary schools.
School districts that offer CS vs. School districts that do not
• Educators from schools/districts that offer computer science differed significantly from
educators who work in schools/districts that do not offer computer science on all of the
questions gauging perceptions of computer science “How important to you is access to
computer science programming in your school / school district?”
Administrators and teachers who offer CS in their schools thought that access to CS
programming in their districts was more important than administrators and teachers
who do not offer CS in their schools.
• “How important are computer science skills to student’s future success?”
Administrators and teachers who work in schools/districts that offer CS thought that CS
was more important to student success than administrators and teachers who work in
schools/districts that do not offer CS.
• “How interested are students in learning computer science at your school?” and “How
interested are parents in incorporating computer science classes in your school?”
Administrators and teachers who work in schools/districts that offer CS thought students
were more interested in learning CS than administrators and teachers who work in
schools/districts that do not offer CS. Similarly, administrators and teachers who work in
schools/districts that offer CS thought parents were more interested in incorporating CS
learning opportunities into curricula than administrators and teachers who work in
schools/districts that do not offer CS.

Landscape report of K-12 Computer Science Education in Illinois
20
Finally, when asked whether they anticipated a growth, stagnation, or decline in the number of
computer science courses offered in their district, educators from schools/districts that offer
CS reported anticipating greater growth than schools/districts that do not offer CS. However, it
is important to note that both groups, on average, expected the number of computer science
courses in their district would grow.
Barriers in Computer Science Education In this final section of the questionnaire, teachers and administrators were asked to rank a list of ten potential barriers to computer science education. The barriers provided were:
• There are no current teachers who are skilled in computer science
• There is not enough time in the school day to devote to computer science education
because of standardized testing requirements.
• There is not enough money in the school budget to train current teachers in computer
science
• There is not enough money in the school budget to purchase necessary supplies
(computers, software, etc.)
• There is no classroom space to offer computer science courses
• There is no equipment to support computer science courses
• There is no demand for computer science classes from students or parents
• There is no pathway in curriculum that would support computer science courses, and/or
students are required to take certain courses before the complete school, and computer
science doesn’t fit in any of the necessary course categories.
• Our schools don’t have the internet connectivity to support computer science courses.
• There is no district level support system for CS implementation
Teachers and administrators were subsequently asked to rank the top three barriers from the same list. There was also an option to choose “other” and add any additional barriers that were not listed. There were statistically significant differences in responses to this section across a variety of groupings including differences by title (administrator, teacher) by region, locale (urban, suburban, or rural) and by school type (high school, middle school, or grade school). Table three gives a breakdown of the highest ranked barriers and where there were statistical differences in barrier selection and ranking of barrier importance. The next section describes these differences in more detail and is organized by differences according to educator title, regional differences, difference by locale (urban, suburban, rural), difference by school type (elementary, middle, high school), and difference between districts that currently offer CS courses and districts that do not.
Educator Title Region Locale School Type CS Offered No current teachers who are skilled in computer science
X*

Landscape report of K-12 Computer Science Education in Illinois
21
Not enough time in the school day
X X* X
Not enough money in the school budget to train current teachers
X X X
Not enough money in the school budget to purchase necessary supplies
X* X* X*
No demand for computer science classes from students or parents
*
No district level support system for CS implementation
* X*
Other X X* X means significant difference in barrier selection * means significant difference in barrier importance
Differences by title
• “What are the most significant barriers to offering computer science courses? Please
select all”
Administrators and teachers largely reported the same barriers to a similar degree.
However, 63.5% of administrators indicated that a shortage of teachers who are skilled
in computer science was a significant barrier to offering computer science courses,
whereas 44.2% of teachers indicated that this was a barrier.
• “What are the three most significant barriers to offering computer science courses? Please
rank the top three”
Administrators and teachers also largely reported the same barriers as being the most
significant. For example, both administrators and teachers indicated that having no
current teachers who are skilled in computer science is the largest barrier to providing
computer science courses. However, administrators rated this barrier significantly
higher than teachers.
Administrators also indicated that a lack of demand for computer science classes from
students or parents was a larger barrier than teachers.
Teachers indicated that a lack of district-level support for computer science
implementation was a larger barrier than administrators
Differences by region

Landscape report of K-12 Computer Science Education in Illinois
22
• “What are the most significant barriers to offering computer science courses? Please
select all”
Administrators and teachers from different regions largely reported the same barriers
to a similar degree. However, there were three key differences in how often educators
from each region selected certain barriers.
Results from a chi-square test of independence indicated that there were regional
differences in the selection of “there is not enough time in the school day to devote to
computer science education because of standardized testing requirements”. 65.0% of
educators in the southwest region, 52.0% of educators in the southeast region, and
52% of educators in the northwest region indicated that this was a barrier to providing
CS. However, only 34% of educators from the east central region, 36% of educators
from the west central region, and 37% of educators from the northeast region indicated
that this was a barrier.
In addition, results indicated that there were regional differences in the selection of
“There is not enough money in the school budget to train current teachers in computer
science.” 45.9% of educators in the southeast region and 37.5% of educators in the
southwest region indicated that this was a barrier to providing CS. However, only 25.7%
of educators from the east central region, 23.8% of educators from the northwest
region, and 22% of educators from the northeast region indicated that this was a
barrier.
Finally, results from an additional chi-square test of independence indicated that there
were regional differences in the selection of “There is not enough money in the school
budget to purchase necessary supplies (computers, software, etc.)”. 34.7% of
educators in the southeast region indicated that this was a barrier to providing CS.
However, only 4.00% of educators from the west central region, and 18.6% of
educators from the northeast region indicated that this was a barrier.
• “What are the three most significant barriers to offering computer science courses? Please
rank the top three”
Educators across the six regions largely reported the same barriers as being the most
significant. There was one regional difference in barriers. Results analysis of responses
to “There is no equipment to support computer science courses.” varied systematically
by region. A post hoc comparison indicated administrators and teachers who work in
the east central region thought that a lack of equipment was a larger barrier than
administrators and teachers who work in the northeastern region.
Differences by locale
• “What are the most significant barriers to offering computer science courses? Please
select all”

Landscape report of K-12 Computer Science Education in Illinois
23
Administrators and teachers from different locales largely reported the same barriers to
a similar degree. However, there were two key differences in how often educators from
urban, suburban, and rural areas selected certain barriers. Data analysis indicated that
there were regional differences in the selection of “There is not enough money in the
school budget to train current teachers in computer science”. 39% of educators in the
rural areas indicated that this was a barrier to providing CS. However, only 28% of
educators from suburban areas and 25% of educators in urban areas indicated that this
was a barrier.
In addition, results indicated that there were regional differences in the selection of
“Other”. 20% of educators in the urban areas indicated other barriers to providing CS
(see Appendix A for qualitative coding). Only 14% of educators from suburban areas
and 8% of educators in rural areas indicated other barriers.
• “What are the three most significant barriers to offering computer science courses? Please
rank the top three”
Educators across urban, suburban, and rural areas largely reported the same barriers as
being the most significant. There was one locale difference in barriers. Results indicated
that the ranking of “There is no equipment to support computer science courses.”
varied systematically by locale. A post hoc comparison indicated administrators and
teachers who work rural areas thought that a lack of equipment was a larger barrier
than administrators and teachers who work in urban areas.
Differences by school type
• “What are the most significant barriers to offering computer science courses? Please
select all”
Results from a chi-square test of independence indicated that there were significant
differences in the selection of “there is not enough time in the school day to devote to
computer science education because of standardized testing requirements”. 58.8% of
educators in elementary schools and 64.7% of educators in middle schools indicated
that this was a barrier to providing CS. However, only 26.3% of educators in high
schools indicated that this was a barrier.
In addition, 35.3% of educators in middle schools indicated that a lack of district-level
support for computer science implementation was a significant barrier to providing
computer science programming whereas 14.1% of educators in elementary schools and
9.32% of educators in high schools indicated that this was a barrier.
• “What are the three most significant barriers to offering computer science courses? Please
rank the top three”
Results indicated that educators ranked “there is not enough time in the school day to
devote to computer science education because of standardized testing requirements”

Landscape report of K-12 Computer Science Education in Illinois
24
differently. A post hoc comparison indicated administrators and teachers who work in
elementary schools thought that this was a more significant barrier than administrators
and teachers who work in high schools.
In addition, results indicated that educators ranked “There is no district level support
system for CS implementation” differently. A post hoc comparison indicated
administrators and teachers who work in middle schools thought that this was a more
significant barrier than administrators and teachers who work in high schools and
administrators and teachers who work in elementary schools.
School districts that offer CS vs school districts that do not
• “What are the most significant barriers to offering computer science courses? Please
select all”
Results from a chi-square test of independence indicated that there were significant
differences in the selection of “there is not enough time in the school day to devote to
computer science education because of standardized testing requirements”. 49.8% of
educators in schools/districts that do not offer CS indicated that this was a significant
barrier whereas 32.7% of educators in schools/districts that offer CS indicated that this
was a barrier.
In addition, 37.2% of educators in schools/districts that do not offer CS indicated that
not having enough money in school budget to train current teachers was a significant
barrier whereas 19.6% of educators in schools/districts that do offer CS indicated that
this was a barrier.
Further, 20.9% of educators in schools/districts that do not offer CS indicated that not
having equipment to support computer science courses was a significant barrier
whereas 8.41% of educators in schools/districts that do offer CS indicated that this was
a barrier.
Finally, 24.3% of educators in schools/districts that do offer CS indicated “other”
barriers were significant whereas 9.21% of educators in schools/districts that do not
offer CS indicated that this was a barrier.
• “What are the three most significant barriers to offering computer science courses? Please
rank the top three”
Analysis indicated that educators ranked “There is no equipment to support computer
science courses” differently. Administrators and teachers who work in schools/districts
that do not offer CS thought that this was a more significant barrier than administrators
and teachers who work in schools that do offer CS.
In addition, results indicated that educators ranked “There is no pathway in curriculum
that would support computer science courses” differently. Administrators and teachers

Landscape report of K-12 Computer Science Education in Illinois
25
who work in schools that offer CS thought that this was a more significant barrier than
administrators and teachers who work in high schools.
Finally, educators ranked “other” barriers differently with educators from schools that
offer CS ranking this barrier as more significant than educators from schools that do not
offer CS.
Advanced Placement Computer Science Courses Through a FOIA request we obtained a list from the Illinois State Board of Education (ISBE) of all school districts in Illinois that have active Advanced Placement Computer Science (AP CS) course codes. There are two AP CS offerings, AP CS A and AP CS Principles. According to the data from ISBE there are 86 school districts that offer one or both AP CS courses. 31 districts offer both AP CS courses, 39 offer only AP CS A, and 17 offer only AP CS Principles. Figure 10 shows the percentage of each AP CS offering in each region of the state:
Key Takeaways There are three critical topics that were shown by this landscape report: 1) the most critical barriers to offering CS courses in schools, 2) the urban / rural divide in existing resources as well as in perspectives on CS courses, and 3) the divide between schools and districts that are currently offering computer science courses and schools and districts that do not currently offer CS.
Most critical barriers It is important to reiterate the most cited barriers to offering computer science courses in schools so that programs, interventions, and future legislation can be planned accordingly. Both administrators and teachers indicated that having no current teachers who are skilled in computer science is the largest barrier to providing computer science courses. Administrators
0.00%
10.00%
20.00%
30.00%
40.00%
50.00%
60.00%
70.00%
80.00%
90.00%
Northeast Northwest East Central WestCentral
Southeast Southwest
Percent of AP CS in the State
AP CS A AP CS P Both AP CS

Landscape report of K-12 Computer Science Education in Illinois
26
rated this barrier significantly higher than teachers. In addition, not having enough money to train current teachers in CS was listed as one of the top three barriers, especially in rural regions. These findings highlight the critical need for teacher certification programs including both pre-service and secondary endorsement programs, but also funding support for professional development for current teachers, especially in rural school districts.
Urban / rural divide There are significant differences in computer science offerings between urban and rural school districts that were highlighted in this report. The majority of current computer science teachers are located in urban areas and urban CS teachers are more likely to have a background or certification in CS than in rural areas. Most of the CS teachers from rural districts did not have a bachelor’s in CS or other CS certification, but generally only had professional development experience in CS. Only about 1% of rural teachers had CS certification. This represents a large disparity in professional experience and fundamental CS knowledge between urban and rural areas. There was also a significant difference in the perspectives of educators on computer science between urban and rural areas. Urban administrators and teachers thought having CS courses in their schools was more important than both suburban and rural administrators and teachers. In addition, educators in urban areas felt CS was more important to future success than rural educators. Further research into why rural educators feel CS is less important to future success would be very beneficial to understanding these findings.
Districts offering CS vs districts not offering CS The findings in this report highlight an interesting difference between respondents. There was a significant difference on all questions about perspectives on computer science between districts that already offer CS and districts that do not. Districts that are currently offering CS courses were more likely to say it was important to have computer science courses in their schools, that computer science was important to future success, and that parents and students were interested in computer science being taught at their schools. In addition, schools and districts that currently teach CS anticipated greater growth in CS offerings and were less likely to list not having enough money in school budget to train current teachers or lack of equipment as significant barriers to offering computer science. These findings seem to indicate that a significant shift in perspective happens once computer science courses become part of the curricular offerings. It may be that some educators, schools, or communities do not see themselves as computer scientists or part of the “tech” community. More research on how and why these perspectives change would help to understand how to advocate for inclusion of computer science in schools and districts that do not currently have any CS courses.
Course Offerings

Landscape report of K-12 Computer Science Education in Illinois
27
One additional finding is worth additional discussion; there is a shortage of intermediate and advanced computer science courses. Of the courses taught by respondents, 82% of them were introductory level courses. In addition, only 15% of non-AP courses and 17.5% of AP courses were counted as core curricula. All other CS courses were electives. It is critical that a spectrum of courses from introductory through advanced computer science be available to students in every district, but also that courses be allowed to count towards core graduation requirements.
Findings - Out of school CS offerings There was a total of 79 respondents to the Out of School CS Offerings questionnaire. Due to the distribution of responses by region (49% were in the Northeast region, less than 14% in each other region) we were unable to run statistical comparisons. This section will outline and discuss the demographic information for this questionnaire. The Out of School Questionnaire only had three sections: Section 1: Respondent Demographics Section 2: Program Information Section 3: Perceptions of Computer Science Respondents represented a variety of institutions or locations. Figure 11 shows the percentage of respondents from each type of organization.
Participants were provided the same definition of computer science used in the In-school Questionnaire:
We will now ask you some questions regarding computer science related programming. Computer science can be defined as “the study of computers and algorithmic processes, including their principles, their hardware and software designs, their implementation, and their impact on society” (from Trends in Computer Science). Please note, this is different from Computer Literacy (e.g. keyboarding/typing skills, PowerPoint/word/excel skills, etc.) and Digital Citizenship (e.g. creating secure passwords, safe use of the internet, etc.)
0.00%
10.00%
20.00%
30.00%
40.00%
School Park District Museum Library YouthDevelopment
Program
Percentage of Respondents
Percentage of Respondents

Landscape report of K-12 Computer Science Education in Illinois
28
Based on the definition, 73.4% of respondents felt their organization did offer computer science programming and 24% did not. 2.5% of respondents were uncertain. Participants were also asked to provide a brief description of their program. Table four provides examples of some of the responses. Table 4: Example program names and descriptions
Program Name Description Girls Who Code Girls Who Code is a non-profit dedicated to closing the gender
gap in technology. Girls work together on a project, learn about women in tech, and learn computer science skills. https://girlswhocode.com/.
Code Your Dreams Students build apps with Python- www.codeyourdreams.org; Our students learn the entire app development process including ideation, design, programming and presentations for both mobile and web-based applications.
Teen Intro to Video Game Design
Build a basic game as a group using Python, no experience is required.
3D Printing Activities Various programs we have had where teens learn basics of 3D printing and get to take home a 3D printed object.
Beginning projects with Arduino
Participants receive an Arduino and other supplies to complete the project that is guided step-by-step.
Kids Create Apps Participants design and create their own app over the course of several weeks during the summer. Presented by University of Illinois iSchool student as part of research grant.
Techsplorers
Techsplorers is a hands-on program that meets once a month and features a STEM activity including coding, VR, and robots.
FIRST Robotics Competition
Over about 15 weeks, students work with engineering professionals to design, build, and program a robot to compete in an annual sport-like game. https://www.firstinspires.org/robotics/frc/what-is-first-robotics-competition.
Tech Play Lab Hands-on activities that teach computational thinking and familiarize young children with technology they can code/control to create things.
Minecraft Madness Explore the world of Minecraft, one of the most popular video games in history, offers an amazing world of endless possibilities. Let your imagination transform your Minecraft experience into a unique world YOU create! Students will discover how to expand their worlds possibilities using popular game-enhancing mods. Build traps, arrow launchers, faster rail systems and more & participate in building challenges! Learn fundamentals of computer networking through this unique Minecraft experience that also allows you and your friends to work in multiplayer mode as you mine, craft and build together to survive.

Landscape report of K-12 Computer Science Education in Illinois
29
There was a relatively even distribution with regards to duration of the CS programs from one day to year-round and also a fairly even distribution of age ranges for participants. Figure 12: Duration of CS programs
Figure 13: Age range of participants
10.40%
4.48%
0%
8.96%
5.97%
7.46%
10.40%
13.40% 13.40%
17.90%
0.00%
2.00%
4.00%
6.00%
8.00%
10.00%
12.00%
14.00%
16.00%
18.00%
20.00%
1 Day Multipledays but
less than 1week
1 week Multipleweeks butless than 6
weeks
6 weeks Entiresummer
session (7to 12
weeks)
Schoolyear onesemester
(fall)
Schoolyear onesemester(spring)
Full schoolyear (fall to
spring)
Year-round
Out of School Program Duration
% of programs
0.00%
10.00%
20.00%
30.00%
40.00%
50.00%
60.00%
4 to 5 years 6 to 8 years 9 to 11 years 12 to 14 years 15+ years
Participant Age Range
% of participants
Landscape report of K-12 Computer Science Education in Illinois
30
The vast majority of out of school programs are for a beginner of introductory level of computer science. Respondents indicated that 88.8% of their programming is at the beginner level with 9.7% offered at an intermediate level and only 1.5% at an advanced level.
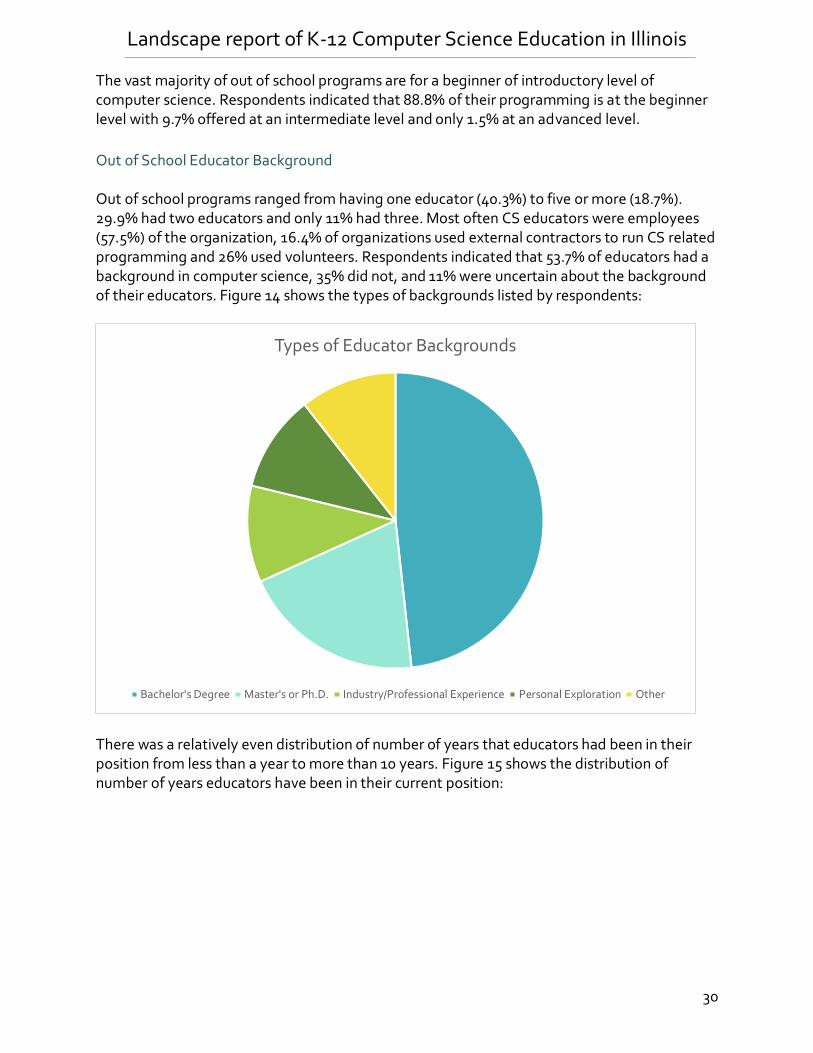
Out of School Educator Background Out of school programs ranged from having one educator (40.3%) to five or more (18.7%). 29.9% had two educators and only 11% had three. Most often CS educators were employees (57.5%) of the organization, 16.4% of organizations used external contractors to run CS related programming and 26% used volunteers. Respondents indicated that 53.7% of educators had a background in computer science, 35% did not, and 11% were uncertain about the background of their educators. Figure 14 shows the types of backgrounds listed by respondents:
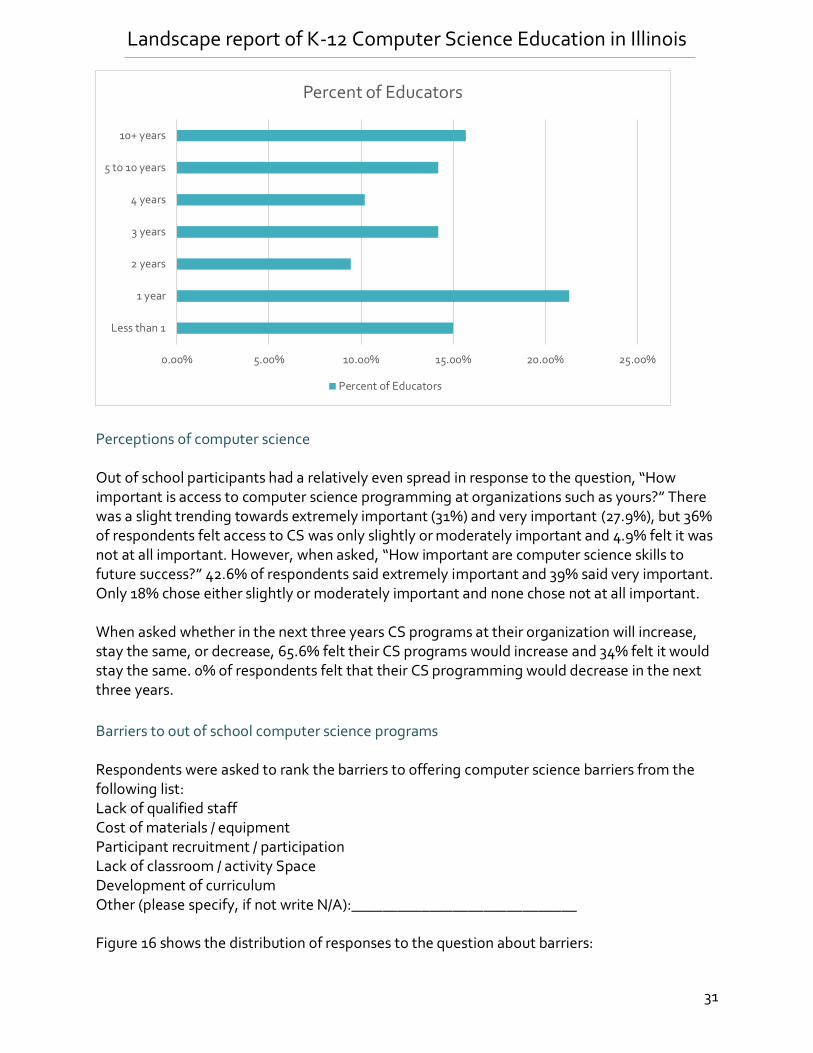
There was a relatively even distribution of number of years that educators had been in their position from less than a year to more than 10 years. Figure 15 shows the distribution of number of years educators have been in their current position:
Types of Educator Backgrounds
Bachelor's Degree Master's or Ph.D. Industry/Professional Experience Personal Exploration Other
Landscape report of K-12 Computer Science Education in Illinois
31
Perceptions of computer science Out of school participants had a relatively even spread in response to the question, “How important is access to computer science programming at organizations such as yours?” There was a slight trending towards extremely important (31%) and very important (27.9%), but 36% of respondents felt access to CS was only slightly or moderately important and 4.9% felt it was not at all important. However, when asked, “How important are computer science skills to future success?” 42.6% of respondents said extremely important and 39% said very important. Only 18% chose either slightly or moderately important and none chose not at all important. When asked whether in the next three years CS programs at their organization will increase, stay the same, or decrease, 65.6% felt their CS programs would increase and 34% felt it would stay the same. 0% of respondents felt that their CS programming would decrease in the next three years.
Barriers to out of school computer science programs Respondents were asked to rank the barriers to offering computer science barriers from the following list: Lack of qualified staff Cost of materials / equipment Participant recruitment / participation Lack of classroom / activity Space Development of curriculum Other (please specify, if not write N/A):_____________________________ Figure 16 shows the distribution of responses to the question about barriers:
0.00% 5.00% 10.00% 15.00% 20.00% 25.00%
Less than 1
1 year
2 years
3 years
4 years
5 to 10 years
10+ years
Percent of Educators
Percent of Educators

Landscape report of K-12 Computer Science Education in Illinois
32
Key Takeaways The findings from this report showed that there are a wide variety of organizations running an even wider variety of computer science programming. Respondents listed opportunities from coding clubs, to robotics, to app inventors, video game design, and 3d printers and maker spaces. These programs were offered to participants from age 6 to 15+. Once again, however, most offerings were at the beginner level. There seems to be a critical lack of options to continue to progress in computer science beyond the introductory level.
Recommendations This landscape report of K-12 computer science education is a first step in illuminating the status of computer science education in Illinois including what regions have computer science courses, the backgrounds of the educators teaching those courses, and both perceptions and barriers to providing or increasing computer science offerings. Many of the findings in this report follow trends found in similar reports from other states. For example, the urban / rural divide and teacher shortage findings were a confirmation of anticipated results, but still help inform our understanding that “down state” currently has fewer CS education opportunities than the Chicagoland area. These findings help to provide an in-depth understanding of the particular needs of schools and districts in Illinois and what resources and supports are necessary to expand both access and equity in K-12 CS education. Based on the findings in this report we make the following recommendations.
Barriers to CS Programs
Lack of qualified staff Cost of materials and/or equipment
Participant recruitment and/or participation Lack of classroom and/or activity space
Development of curriculum Other (please specify)
Landscape report of K-12 Computer Science Education in Illinois
33
Teacher training The number one barrier identified by both school administrators and teachers was a lack of trained CS teachers. Additionally, lack of funds to train current teachers in CS was also identified as a significant barrier, especially in rural areas. A shortage of certification and professional development opportunities exacerbates this issue with many rural and peri-urban teachers unable to attend or afford courses or training opportunities offered solely in the Chicagoland area. We recommend a state appropriation for computer science professional development opportunities paired with a partnership effort of IIN hubs or other agencies and institutions to provide PD opportunities to teachers in all regions of the state at a significantly reduced rate or free of charge. We also recommend a focus by more institutions of higher education to provide both secondary CS endorsement programs as well as pre-service undergraduate pathways in computer science to being to start producing new CS teachers to address the increasing teacher shortage in Illinois.
Course offerings The findings indicated a large focus, both in and out of school, on introductory level computer science courses. In addition, only a relatively small percentage of CS courses (15% of non-AP courses and 17.5% of AP) were counted as core curricula. These findings, combined with data showing that the vast majority of CS courses are taught in the Chicagoland area, indicate that there is likely a critical shortage of opportunities for many students to continue to grow and be challenged in computer science. We recommend an intentional focus on providing professional development to support and develop more advanced computer science concepts for educators, especially for educators outside of the urban northeast region. We also recommend increased advocacy by CS education groups, higher education institutions and the Illinois State Board of Education to school districts to increase support for allowing computer science courses to count as core curricula.
Administrator support Educators from middle schools ranked “no district level support system for CS implementation” as a more significant barrier than both elementary and high school educators. If there is a lack of support, or perceived need for CS in middle schools, by district level administrators, that could result in a CS desert between elementary and high school which could severely limit or impact student growth and opportunities. It is critical to ongoing success and growth of CS programs for both district and building level administrators to support and advocate for such classes.

Landscape report of K-12 Computer Science Education in Illinois
34
We recommend an allocation of time and resources by stakeholder groups, such as institutions of higher education, CS education agencies, and the Illinois State Board of Education, to work with district level administrators to build greater support for and interest in computer science education. The direct result of this work will be district level administrators working with school level administrators and educators to examine curricular options, identify space in the school day for CS, and securing training or other professional development opportunities to build capacity and confidence of staff and educators.
Future study
As educators and advocates continue to work to expand access to and equity of computer science in Illinois, future research is needed better understand some of the challenges as well as to measure how access to CS education is changing and improving. We recommend repeating the landscape report every two or three years to build on this baseline data and provide researchers and advocates with data to show growth over time. We also recommend further research on a few key findings. This study found both a significant difference in the type of background of educators, but also a reluctance by rural educators to pursue computer science certification programs. We recommend follow-up research to better understand the perspectives of rural educators on CS certification needs and opportunities. The findings from this report also indicated that few schools and districts were counting CS courses as core curricula, including AP courses. Given that according to Illinois statue AP CS courses can be used to satisfy a core math credit, this finding is interesting and merits further study. We recommend continued research into when and how computer science courses are counted as core curricula rather than as elective credit.
Landscape report of K-12 Computer Science Education in Illinois
35
Acknowledgements The authors are extremely grateful and would like to thank all the educators from across Illinois who participated in this Landscape Study. Thank you for sharing your experience, insights, and challenges in teaching computer science at your schools. The authors would like to recognize and thank the following members of the Landscape Report Advisory Committee for their contributions and support on this study: Jake Baskin – CSTA Doris Espiritu – Wright Community College Mark Harris – Discovery Partners Institute Mia Harris – OCEP, Northwestern Samantha Leav – Illinois State Board of Education Andy Rasmussen – Chicago Public Schools Caitlyn Walker – Illinois State Board of Education Troy Williams – Chicago Public Schools
Landscape report of K-12 Computer Science Education in Illinois
36
Endnotes
i Code.Org. Support K-12 Computer Science in Illinois. https://code.org/advocacy/state-facts/IL.pdf (Accessed September 12, 2018). ii Burning Glass Technologies. (2015). Crunched by the Numbers: The Digital Skills Gap in the Workforce. Author. http://www.burning-glass.com/wp-content/uploads/2015/06/Digital_Skills_Gap.pdf iii Google Inc. & Gallup Inc. (2017, August). Computer Science Learning: Closing the Gap: Rural and Small Town School Districts. Results From the 2015-2016 Google-Gallup Study of Computer Science in U.S. K-12 Schools (Issue Brief No. 4). Retrieved from https://goo.gl/hYxqCr iv https://science.house.gov/news/press-releases/smith-s-stem-education-act-signed-law. Illinois Innovation Index, Fall 2017. https://www.istcoalition.org/data/index/ v Code.org. Infographic Source Data. https://docs.google.com/document/d/1gySkItxiJn_vwb8HIIKNXqen184mRtzDX12cux0ZgZk/pub vi Code.org. 2019 State of Computer Science Education, Equity and Diversity. https://advocacy.code.org/2019_state_of_cs.pdf vii The Economist. (2018). A Study Finds Nearly Half the Jobs are Vulnerable to Automation. https://www.economist.com/graphic-detail/2018/04/24/a-study-finds-nearly-half-of-jobs-are-vulnerable-to-automation viii McKinsey Global Institute. (2021). The Future of Work after COVID-19. https://www.mckinsey.com/featured-insights/future-of-work/the-future-of-work-after-covid-19# ix https://science.house.gov/news/press-releases/smith-s-stem-education-act-signed-law. Illinois Innovation Index, Fall 2017. https://www.istcoalition.org/data/index/ x Code.org. Infographic Source Data. https://docs.google.com/document/d/1gySkItxiJn_vwb8HIIKNXqen184mRtzDX12cux0ZgZk/pub

Landscape report of K-12 Computer Science Education in Illinois
37
Appendix A
Other Barriers, Qualitative Coding
• All respondents wrote something if they selected the “other (please describe)” option
(N = 48)
• Most Common Codes
o Scheduling (14/ 48 = 29.2%)
o Finding teachers (9/ 48 = 18.75%)
o No barriers (6/48 = 12.5%)
o Teacher retention (4/48 = 8.33%)
o NA (4/48 = 8.33%)
o Paying teachers (3/48 = 6.25%)
Code Response
No barriers None, We currently build a MakerSpace STEM lab that allows up to teach multiple disciplines in Computer Science. We have 100% support in building our program from the District.
Integration I believe this is something that could be integrated in all that we do. We are getting a crash course in computer science as we navigate through remote, hybrid and in person learning. I believe it's really a matter of looking at what computer science is and how you would integrate into what you are doing, rather than as a separate course or curriculum.
COVID-19 virus Finding teachers Our biggest challenge has been finding teachers but we
have been able to make it work. I created the high school computer science course of study and would be happy to share how if interested
Teacher retention Teaching salaries are much lower than CS grads. We are working on Dual Credit option with U of I CS Dept.
Student interest Interest determines course availability--differes year to year. Scheduling Students have only 6 periods and not a lot of electives. Finding and paying for teachers
We would need to hire more teachers, at the expense of other departments.
Few district-level supports Our school does a great job addressing the issues listed above, but the district level supports are few. Curricular development is internal, corporate sponsorship and relationships are managed internally, equipment purchasing, budgets are all done internally. Mostly the district just creates barriers with regards to who is allowed to teach specific courses, limiting vendors, obscuring org charts to provide contacts for accountability for logistical roadblocks. CPS lacks transparency with budgets and

Landscape report of K-12 Computer Science Education in Illinois
38
inadequately compensating CTE teachers for the professional experience that they bring to the classroom.
No barriers The school teaches a CTE gaming class and the IB computer science class.
No barriers We do offer courses, so none of these really fit. However, I put the first one because it has been difficult to find more teachers
Scheduling CS is offered as a "specials class" (my class) and the scheduling of this class is primarily based on scheduling needs. Usually students take the class for only 1 hour per week.
Student interest Students have many opportunities for electives and computer science isn't a priority.
Scheduling Scheduling Conflicts
No barriers We offer a STEAM program which is fully supported Unsure Unsure being new to the district CTE pathway If computer science was a CTE recognized pathway, then
CTEI and Perkins funding could be applied No barriers I am answering this question broadly; Ridgewood High
School does not view what I've selected as barriers. Scheduling As a K-6 building after school programming is what we can
offer Scheduling Students are limited in their elective selections because of
required classes and our 6 period day. No district support The district only places value on reading and math. They
leave any computer training completely up to the individual teacher. I was given the position to teach computer science a few years ago and then they eliminated the position.
Finding teachers, Teacher retention
Teacher shortage is a significant issue for our rural school district in which state legislators widely ignore as they push legislation through without creating a financially supportive pathway to entice private sector employees to transition to public schools
NA n/a No barriers no barriers Unsure not sure if there are obstacles
Scheduling, Finding teachers and paying for teachers
sharing electives with the other departments; don't want to lose an art teacher at the expense of additional computer science courses; there needs to be a balance; art is just as good for students as programming
Scheduling Sometimes it is hard for students to fit CS into their schedules.
Scheduling There is not enough time in the school day because of other graduation requirements.
Finding teachers No staff to teach

Landscape report of K-12 Computer Science Education in Illinois
39
Unsure I do not know. Scheduling No time in the schedule to add other areas of study NA Adding 2021-2022
Student need The elementary computer students focus mostly on building computer literacy vs computer science courses.
NA We offer it off site Finding teachers, Teacher retention
We do not have enough teachers to teach CS. We have lost CS teachers that have moved into the workforce in a CS field. There needs to be a more streamlined path for teachers to become certified to teach CS. We will have teachers teaching CS that do not have CS certifications.
Scheduling Based on the size of our school we cannot offer any more electives in computer science
Student need My students are pretty young.
Scheduling, supplies Not enough TIME in the day to teach all that needs to be taught now, and our school doesn't have enough computers to hardly even incorporate using computer use into the core subjects. I am not blaming it on standardized testing as the above choice that is given.
Finding teachers There is only one business teacher Paying for teachers Not enough money in budget to have a teacher devoted
solely to computer science. Finding teachers It was very difficult to find someone licensed to teacher
computer literacy, let alone computer science in K-8 Unsure I do not know what the barriers are Scheduling We shifted from computer science to STEM as a weekly
special this year Scheduling We only have a 6 period day for student schedules. With the
4 core requirements plus things like Health, PE, Driver's Ed and, it makes it difficult to complete for a place on a student's schedule.
Finding teachers Computer Science is more specialized at the high school level. I'm not sure if there are any elementary or middle school teachers that are trained to teach computer science.
Scheduling Too many other courses required which leads to not available to fit into student schedule.
NA N/A Teacher retention We are pleased with our Computer Science Offerings. Our
most significant barrier to continuing them will be to replace teachers as our current staff retire or leave the profession.