Embed Size (px)
Citation preview

Landscape Evolution of the Umbum Creek Catchment Chapter 1: Introduction
1-1
1 INTRODUCTION
1.1 RATIONALE
To understand the development and complexity of the geometries of depositional elements within dryland fluvial/lacustrine systems it is necessary to look at the developmental history of the fluvial environment within the context of the surrounding landscape. Satellite imagery reveals underlying basement-related structural controls on landscape evolution (Figure 1.1).Straight river sections are aligned with regional lineaments. Lineaments are straight or gently curving structural lines (faults, cleavage, fold axes) which, being zones of weakness, find expression in the landscape (Twidale, 2004). Straight streams may form by weathering and erosion from above or by underpinning from beneath. The precise mechanism of underpinning is not clear and may be due to joggling in the basement which causes fractures in overlying alluvium or, alternatively, deep linear fractures could attract vadose waters which facilitate weathering and erosion in linear zones (Twidale, 2004). These basement structures are thought to have played a guiding role in the morphotectonic evolution of the Umbum Creek Catchment. However, the degree of influence of tectonic activity during the Neogene remains unclear. Questions remain as to what degree the modern landscape reflects sedimentary processes responding to neotectonic activity.
The Lake Eyre Basin Analogues Research Group (LEBARG) is a consortium formed by the Australian School of Petroleum (ASP) and supported by the Cooperative Research Centre for Landscape, Environments and Mineral Exploration (CRC LEME) and several industry sponsors. The aim of the LEBARG project is to develop an analogue model for clastic deltaic, specifically dryland fluvial/lacustrine petroleum reservoirs.
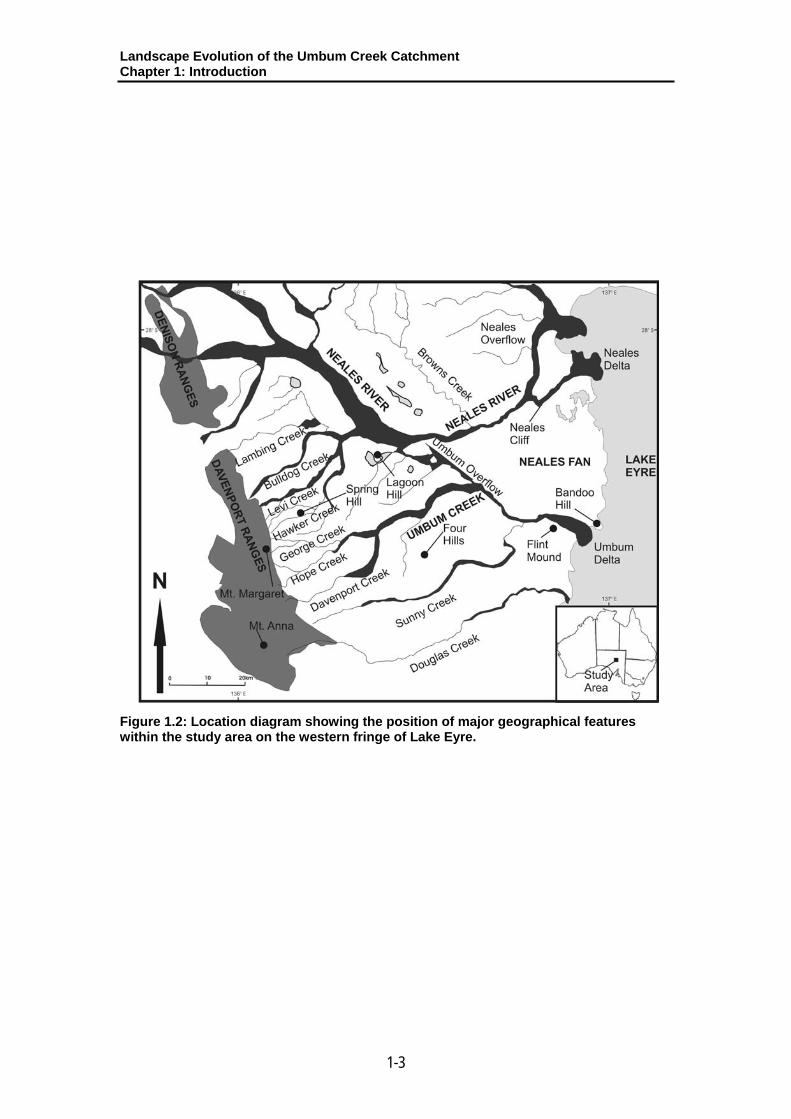
Dryland reservoirs are composed of depositional features that display a range of complexities related to connectivity, permeability and variability associated with the distribution of reservoirs, seals and baffles. As easily accessible reservoirs become depleted, petroleum exploration companies are looking at sourcing more petroleum reserves from these relatively poorly understood systems and a good understanding of their geometry is paramount in the engineering and design of fields for efficient production. Examples of important dryland fluvial reservoirs include the Triassic of the North Sea, Irish Sea and North Africa, the Cretaceous of Chad-Sudan and the Pliocene of the South Caspian Basin. The Umbum Creek Catchment and the Neales Fan, a broad fan-shaped feature on the western side of Lake Eyre, Central Australia (Figure 1.2), represent world class modern analogues of ancient dryland fluvial, lacustrine and aeolian systems that are the targets for petroleum exploration elsewhere in the world.
1.2 AIM OF PROJECT
The aim of this study is to delineate the geometry and landscape evolution history of the Umbum Creek Catchment, Central Australia. Special emphasis is placed on identifying Neogene landscape features that indicate neotectonic activity and their influence on the development of the Neales Fan. Methods employed include interpretations based on the following data:
Satellite imagery;
Digital Elevation Models (DEMs);
Global Positioning System (GPS) data; and,
Regolith-Landform mapping.

Landscape Evolution of the Umbum Creek Catchment Chapter 1: Introduction
1-2
Figure 1.1: Landsat 7 mosaic of the Australian continent (courtesy Geoscience Australia) indicating lineaments passing through the study area that broadly align to continent-wide structural corridors G2, G3 & G8 (Campbell & O’Driscoll, 1989).
Landscape Evolution of the Umbum Creek Catchment Chapter 1: Introduction
1-3
Figure 1.2: Location diagram showing the position of major geographical features within the study area on the western fringe of Lake Eyre.

Landscape Evolution of the Umbum Creek Catchment Chapter 1: Introduction
1-4
1.3 OBJECTIVES
The major objectives of this study were to develop a regolith-landform map of the Umbum Creek Catchment and use this to develop and refine a model of the landscape evolution of the Umbum Creek Catchment during the Cainozoic that incorporates a history of neotectonic influence on the development of the Neales Fan.
This study represents the first known use of satellite image analysis, geomorphometry, high accuracy topographic data and regolith landform mapping within the Umbum Creek Catchment and surrounding areas. In addition, the comparison of these datasets and their combination into one comprehensive study heralds a way forward for regolith geoscience where integrated data management and multi-disciplinary studies are in the initial stages of development and should become commonplace in the future.
1.4 BACKGROUND
Lake Eyre is in the northeast corner of the state of South Australia. It represents the terminal playa of the Lake Eyre Basin, the largest internal drainage basin in Australia (>1,300,000 km2). The lowest point of this playa is at approximately –15 m below sea level (Australian Height Datum (AHD)) and represents the lowest point in inland Australia (Nanson et al., 1998) (Figure 1.3).
Covering one sixth of the Australian continent, the Lake Eyre Basin incorporates more than one climatic zone, including the tropical monsoon system to the north and the mid-latitude westerly circulation system to the south (Croke et al., 1996) (Figure 1.4). Seasonality is an important factor within the arid regions of Australia. Tributaries feeding from the north of the catchment, the Cooper and the Diamantina Rivers, are subject to extreme flow events during the northern wet season and account for most fillings of the lake. Relatively little is known about the hydrology of the Western catchment which includes the Neales River, Umbum Creek, Macumba River, Margaret River and other smaller tributaries (Kotwicki & Allan, 1998).
The climate in the Lake Eyre region is arid with a mean annual rainfall of 146 mm/a, but a median rainfall of only 118 mm/a over 62 years of records (Kotwicki & Allen, 1998). The region experiences hot summers with a mean annual temperature of 24°C, but an average summer maximum temperature of 36.5°C. Minimum winter temperatures often fall below 0°C (Croke et al., 1998). Average annual evaporation is 3800 mm and exceeds rainfall for all months of the year (Ambrose et al., 1981).
1.5 STUDY AREA
Lake Eyre lies to the east of the study area that is bounded to the west by the Denison and Davenport Ranges (Figure 1.2). Watercourses tend to flow from the ranges to the lake trending in a northeasterly direction. The Neales River is the major river in the area, flowing from west to east and entering the study area through a gap between the Peake and Denison Ranges. The Neales River forms the northern boundary of the Neales Fan with the southern boundary formed by Umbum Creek and the Umbum Overflow (Figure 1.2). The Neales River flows into Lake Eyre forming the Neales Delta. Umbum Creek flows into Lake Eyre forming the Umbum Delta. Two overflow features are present: the Neales Overflow leaves the Neales River and flows north upstream of a large meander in the Neales River that forms the Neales Cliff (Figure 1.2) and the Umbum Overflow appears to flow from the Neales River southeast, connecting to Umbum Creek (Figure 1.2).

Landscape Evolution of the Umbum Creek Catchment Chapter 1: Introduction
NOTE: This figure is included on page 1-5 of the print copy of the thesis held in the University of Adelaide Library.
Figure 1.3: Location map showing the extent of the Lake Eyre Basin, Lake Eyre and major rivers (from Kotwicki & Allan, 1998).
1-5

Landscape Evolution of the Umbum Creek Catchment Chapter 1: Introduction
NOTE: This figure is included on page 1-6 of the print copy of the thesis held in the University of Adelaide Library.
Figure 1.4: Map of Australian climate zones showing the influence of the northern tropical monsoon system and the mid-latitude westerly circulation system across Australia (from Nanson & Price, 1998).
1-6

Landscape Evolution of the Umbum Creek Catchment Chapter 1: Introduction
1-7
Prominent hills in the Davenport Ranges include Mt. Margaret and Mt. Anna. There are several inliers that form topographic highs in the study area. Spring Hill and Lagoon Hill are two of these. Other prominent topographic features include Four Hills, Flint Mound and Bandoo Hill (Figure 1.2).
There are 16 springs in the study area. These are Brinkley Springs, Hawker Springs, Tarlton Spring, Edith Spring, Levi Springs, Fanny Spring, The Fountain Spring, Big Perry Spring, Little Perry Spring, Twelve Mile Spring, The Vaughan Spring, Outside Spring, Melon Spring, Milne Springs and Primrose Spring. These generally occur near the Davenport Ranges and near Spring Hill and Lagoon Hill (Figures 1.2 & 1.5).
1.6 STRATIGRAPHY
Until the mid-1950s the interpretation of the geology in the region was restricted to surface mapping and lithological logs of shallow water bores. With increasing interest in petroleum exploration since the 1950s, extensive geophysical exploration, followed by petroleum exploration and development drilling, led to an improvement in the understanding of the geology of the region (Milton & Morony, 1975).
The basement rocks in the area to the west of Lake Eyre are moderately folded Proterozoic rocks unconformably overlain by Jurassic sandstones and Cretaceous shales topped by Cainozoic sediments, gibber plains and stony desert plateaux (Wopfner & Twidale, 1967).
Krieg (2000) divided the succession into four phases of stratigraphic deposition:
Proterozoic Basement
1. Crystalline Basement The crystalline Basement is composed of unnamed metamorphics dated 1746±6Ma (U-Pb) comprised of grey quartzite, epidote quartzite, arenaceous schist, rare clinopyroxene granulite, minor amphibolite and pegmatite (Rogers & Freeman, 1996); massive coarse-grained granite and aplite dated 1533±6Ma at Lagoon Hill (Rogers & Freeman, 1996); and, early Proterozoic Peake Metamorphics consisting of dominantly volcanic rocks and coarse-grained arenaceous sediments of greenschist to amphibolite metamorphic facies (Ambrose et al., 1981).
2. Adelaide Geosyncline Adelaidean (850-480 Ma) rocks are exposed in the Peake, Denison and Davenport Ranges.These rocks consist of shallow water siltstones, sandstones, limestones and dolomites deposited in a steadily subsiding fault-bounded trough. Within these, the clastic sediments were chiefly derived from the Gawler Craton to the west and southwest (Ambrose et al., 1981)

Landscape Evolution of the Umbum Creek Catchment Chapter 1: Introduction
1-8
Figure 1.5: Spring location diagram showing springs clustered in the upper section of the catchment.

Landscape Evolution of the Umbum Creek Catchment Chapter 1: Introduction
1-9
Mesozoic Deposits
3. Great Artesian Basin The Mesozoic is represented by Jurassic and Cretaceous sandstones and mudstones comprising the Great Artesian Basin succession. The rocks were deposited in a broad intra-continental basin that extended far to the north across much of Queensland to the present day Gulf of Carpentaria (Alley & Pledge, 2000).
Only some units of the Mesozoic deposits are exposed within the study area (Rogers & Freeman, 1996; Krieg, 2000). The Algebuckina Sandstone is a fluvial sandstone that is predominantly composed of light brown, medium to very coarse-grained sandstone. The Cadna-Owie Formation is a thin but heterogeneous formation composed of sandstone, siltstone and shale assemblages deposited in a marginal marine setting. The Bulldog Shale is of marine origin and consists of grey shaly mudstones and claystones with wispy laminae, pyrite and carbonaceous material occurring throughout, including fossilised wood associated with glacial lonestones at the base of this unit. The Oodnadatta Formation is again of marine origin but composed of grey-green silty claystones and fossiliferous limestones. The Coorikianna Sandstone represents shallower marine shoreface conditions. It is composed of grey to khaki grey, very fine- to medium-grained sandstone with interbeds of claystone. Some intervals are calcareous and carbonaceous material and wood fragments are present in parts of the succession. The Winton Formation represents a further shallowing of the depositional environment to a non-marine, fluvial/lacustrine environment. This is a very fine-grained, low-energy unit of laminated dark grey feldspathic sandstones, claystones and cross-bedded siltstones with lenticular and nodular limestones. Carbonaceous material and plant fragments are abundant and thin coal seams are present. Bioturbation and freshwater bivalve shells have also been observed in this unit (Krieg 2000).
Cainozoic Deposits
4. Lake Eyre Basin Sediments deposited in the Cainozoic are divided by Krieg (2000) and Croke et al. (1998) into three broad sedimentary episodes: Late Palaeocene-Eocene, Middle Miocene and Quaternary that correspond to three successive climatic regimes (Table 1.1).
Eyre Formation, Late Palaeocene-Eocene: The sandstones of the Eyre Formation represent a wet phase with many fossils and casts of tropical to sub-tropical plants preserved;
Etadunna Formation, Middle Miocene evaporative mega-lake phase: Deposits from this phase are characterised by dolomites, dolomitic limestones and blue-green, palygorskite clays; and,
Quaternary: The final sedimentary assemblage consisting of a complex set of arid terrestrial materials of fluvial, aeolian, lacustrine and mound spring deposits.

Landscape Evolution of the Umbum Creek Catchment Chapter 1: Introduction Table 1.1: Stratigraphic correlation chart for Tertiary units from various Australian sedimentary basins (from Alley & Pledge, 2000).
NOTE: This table is included on page 1-10 of the print copy of the thesis held in the University of Adelaide Library.
1-10


Landscape Evolution of the Umbum Creek Catchment Chapter 1: Introduction
NOTE: This figure is included on page 1-14 of the print copy of the thesis held in the University of Adelaide Library.
Figure 1.7: Location of the contempoary monsoonal shear zone showing the point of origin of tropical cyclones (from Croke et al., 1999).
1-14

Landscape Evolution of the Umbum Creek Catchment Chapter 1: Introduction
NOTE: This figure is included on page 1-15 of the print copy of the thesis held in the University of Adelaide Library.
Figure 1.8: Diagram of Australian tectonic structure showing the arrangement of major structural features of the Australian continent (from Gale, 1992).
1-15

Landscape Evolution of the Umbum Creek Catchment Chapter 1: Introduction
NOTE: This figure is included on page 1-16 of the print copy of the thesis held in the University of Adelaide Library.
Figure 1.9: Diagram of Lake Eyre structural lineaments showing a strong divergence into NW and NE trending sets (from Firman, 1975).
1-16

Landscape Evolution of the Umbum Creek Catchment Chapter 1: Introduction Teluk (1974) conducted a literature review and an analysis of the basement structure via gravity and aeromagnetic surveys over the western half of the study area and concluded that Miocene block faulting, rejuvenated during Plio-Pleistocene times has given rise to the present dimensions of the Peake, Denison and Davenport Ranges. East of the ranges, the area appears to have been mildly down warped. Within the area, irregular basement topography is implied by the protrusion of several Precambrian inliers (Teluk, 1974). A structural interpretation of basement features was performed by Teluk (1974). Figure 1.10 illustrates the interpreted magnetic structure of the basement and identifyies the following structural elements: � The Mt. Margaret Fault extends between Levi and Hope Creeks, with the Cretaceous Bulldog Shale abutting against the fault; � The Douglas Creek Basement High trending west-northwest is interpreted as an anticlinal ridge of basement and Mesozoic sediments, with a complexly faulted northern edge; � The Spring Hill Basement Highs represent either separate or connected pre-Mesozoic erosional basement highs; � The Loudon Ridge forms a north-west trending structural high of upfaulted Cadna-Owie Formation; � The George Creek High is associated with outcropping Cadna-Owie Formation; � The Hawker Basin forms a structural low corresponding to a thick Bulldog Shale section with an eastern faulted margin; and, � The Cadlareena Basin represents progressive thickening of the Bulldog Shale in this area. Its eastern margin is faulted against the Loudon Ridge. Teluk (1974) identified two marked structural conjugate trends, northwesterly and northeasterly, that appear to have been superimposed on a generally flat pre-existing basement. This agrees with the interpretation of Firman (1975). Shoreline features evident on the flanks of Precambrian inliers indicate that the Spring Hill basement highs, Lagoon Hill and Cadlareena Basin controlled sedimentation during the Mesozoic Period (Rogers & Freeman, 1993) (Figure 1.10). Ambrose et al. (1981), in their study of the Peake and Denison Ranges, determine six stages of tectonic activity. Four of these stages occur prior to the Permian, followed by two stages postulated as mid-Miocene and Pleistocene. Strongly upturned Jurassic, Cretaceous and Tertiary sediments along the edge of the Mount Margaret Fault provide evidence for mid- Miocene faulting. This phase of tectonic activity is responsible for the uplift of large fault blocks forming the Peake and Denison Ranges.
1-17

Landscape Evolution of the Umbum Creek Catchment Chapter 1: Introduction
NOTE: This figure is included on page 1-18 of the print copy of the thesis held in the University of Adelaide Library.
Figure 1.10: Interpretation of a magnetic survey showing the trends of basement features and sedimentary basins containing Mesozoic sediment (after Teluk, 1974).
1-18

Landscape Evolution of the Umbum Creek Catchment Chapter 1: Introduction
1-19
Croke et al., (1998), Magee & Miller, (1998) and Nanson et al., (1998) interpreted the Lake Eyre Basin to be tectonically stable during the Quaternary, citing evidence of coeval lacustrine beach strand lines present around the basin at the same topographic level. Conversely, Krieg (2000) presents the case for neotectonics by analysing the differences in gradient of depositional surfaces of several units. The key evidence includes steepening of depositional gradients for several units in the area (Krieg, 2000). From this Krieg (2000) concludes that neotectonism has been occurring within the basin during the Cainozoic and that it has been of a mild and differential style. The oldest sediments examined, the Bulldog Shale, have been subject to the longest period of tectonism and now possess the steepest gradient at 1:70. The Tertiary Eyre Formation posseses a gradient of 1:270 and the overlying youngest cemented fluvial sediments are at 1:500, representing a continuum of mild tectonic activity to the present day, with the gibber plains having a gradient of 1:1000 (Krieg, 2000).
Wopfner (1968) gives evidence for remobilisation along the fault-bounded scarp of the Davenport Range citing up to 160 m of displacement in a gypsite surface either side of the Mt. Margaret and Levi Faults as evidence of Pleistocene neotectonism (Wopfner, 1968).
1.9 MOUND SPRINGS
The springs within the study area are connected to the aquifers of the Great Artesian Basin (Sibenaler et al., 2000). Within the Great Artesian Basin, the principal groundwater flow direction is from northeast to southwest, with recharge predominantly occurring in the Great Dividing Range (Aldam & Kuang, 1989) (Figure 1.11). There is another source of recharge along the western margin of the basin in the uplands west of the Simpson Desert and Lake Eyre (Boyd, 1990). On the western margin of the basin, the lateral mixing of Great Artesian Basin water with local recharge that has passed through gypsum-rich rocks alters the chemical composition of the groundwater. Chemical analyses show that not all water from the springs is artesian water. Some mixing and preferential evaporation appears to occur, although the full effects of this process are not yet understood (Kinhill-Stearns, 1984; Boyd, 1990). Regionally, groundwaters are divided chemically into saline, ‘sulphate’ corrosive waters relatively rich in calcium derived from the western recharge province, and better quality ‘carbonate’ waters relatively rich in sodium and fluorine in the northeast (Figure 1.12). Springs in the study area are located on the western margin of the basin and have saline, ‘sulphate’ corrosive waters.Discharges sourced from the eastern province have a likely travel time of up to three million years (Thomson & Barnett, 1985; Boyd, 1990). Travel times from the western recharge province have not been determined. Spring discharge flow rates are generally low, varying from no flow to moderately strong flow. Annual fluctuation rates in spring discharge are insignificant, although the flow away from the springs varies, reflecting differences in annual evaporation rates. The water flowing into the mound springs is characteristically warm with temperatures around 20–35°C (Boyd, 1990).
Aldam & Kuang (1989) summarise the various different structural styles that influence the occurrence of springs and mound springs in the southwestern portion of the Great Artesian Basin. They identified structural lineaments corresponding to the synthetic/antithetic fracture predicted by an east-west oriented stress-strain ellipsoid (Aldam & Kuang, 1989) (Figure 1.13).
Springs on the eastern side of the Davenport Ranges are related to a basement ridge with the aquifer exposed only along the major fault system (Figure 1.14b). Springs are associated with magnetic highs, a set of north northwest–south southeast trending faults and easterly drainage.

Landscape Evolution of the Umbum Creek Catchment Chapter 1: Introduction
NOTE: This figure is included on page 1-20 of the print copy of the thesis held in the University of Adelaide Library.
Figure 1.11: Schematic of Great Artesian Basin showing the development of springs at the edge of the basin as a result of the hydraulic gradient (from Thomson & Barnett, 1985).
1-20

Landscape Evolution of the Umbum Creek Catchment Chapter 1: Introduction
NOTE: This figure is included on page 1-21 of the print copy of the thesis held in the University of Adelaide Library.
Figure 1.12: Map of artesian water quality in the Lake Eyre region showing highly corrosive waters associated with the western province (from Thomson & Barnett, 1985).
1-21

Landscape Evolution of the Umbum Creek Catchment Chapter 1: Introduction
NOTE: This figure is included on page 1-22 of the print copy of the thesis held in the University of Adelaide Library.
Figure 1.13: Map of mound spring locations showing the relationship to springs and structural features (from Aldam & Kuang, 1989).
1-22

Landscape Evolution of the Umbum Creek Catchment Chapter 1: Introduction
NOTE: This figure is included on page 1-23 of the print copy of the thesis held in the University of Adelaide Library.
Figure 1.14: Diagrams illustrating the structural control of springs by faults. a) Etadurrana Springs. b) section through the study area showing how downcutting streams intersect structural features to create the springs. c) Billa Kalina Springs. d) Strangways Springs showing the tilting of fault blocks to create springs. Seismic line 86-AED shows interpreted structure beneath Dalhousie Springs (from Aldam & Kuang, 1989).
1-23

Landscape Evolution of the Umbum Creek Catchment Chapter 1: Introduction
1-24
The Cadna-Owie Formation is known to dip up to 70° as a result of drag-dip and block movement (Aldam & Kuang, 1989).
From these observations Aldam & Kuang (1989) conclude that basement highs bring the aquifer closer to the present day land surface and cause the confining beds to be eroded.Springs are usually located in present day topographic lows, often associated with eroding stream channels. Streams are structurally controlled, with block movement and erosion causing considerable thinning of the confining beds. The block movement is a result of basement wrench faults being reactivated causing the faults to reach the surface. Discharge may occur through the main fault or through subsidiary faults or fractures. Springs often occur at the intersection of two fault planes that have formed trapdoor structures. These structures allow relative movement of the constituent blocks, and depending on whether the blocks are undergoing relaxation or compression, will form a barrier or a conduit to groundwater flow (Figure 1.15).
The material of the mounds is derived mainly from chemical-precipitated solutes and colloids in the waters, along with some precipitation from algae and bacteria. Other sources include clastic material from the surrounding area that has been wind-blown and trapped by local vegetation. Organic detritus from the plants growing on the mounds is less frequently a source of sediment. The dominant lithifying agent is calcium carbonate (Thomson & Barnett, 1985; Boyd, 1990). The resultant sediments are commonly tuffs, travertine and veryfine-grained or crystalline limestone (Habermahl, 1986). In addition, plant detritus is recorded at several mounds. Dried out peaty mounds have been observed at Peake Ruins Springs and possible burnt peat at Twelve Mile Spring (Boyd, 1990).
Both Boyd (1990) and Thomson & Barnett (1985) quote estimates of mound growth of approximately 1000 years to build a hemispherical mound 3 m high.
Jessup & Norris (1971) draw examples from the Lake Eyre South region where extinct mounds exist that stand 9–11 m above the current erosional land surface on a pedestal of unweathered Cretaceous rocks, whereas modern active springs are less than 6 m high and rest on the lower erosional surface. The extinct springs are indicative of a higher hydrostatic head of water in the Great Artesian Basin system during at least the Pleistocene. From their position in relation to modern active springs it is clear that the locations of outflow have not changed significantly on a regional scale. The topographic separation of older and younger springs, however, can be explained through erosion of the land surface (Jessup & Norris, 1971; Boyd, 1990).
This difference in elevation between the lower, modern, active mound springs and the higher, older, extinct springs is geomorphologically important. Wopfner and Twidale (1967) argue that mound springs were active during the Pleistocene (80,000–40,000 years ago) from fossil dating of Pleistocene limestone deposits; while Jessup and Norris (1971) argue for a late Tertiary age for the onset of spring activity, concluding that the springs were contemporaneous with the Etadunna Formation from the relationship between Beresford and Hamilton Hill, both extinct springs, and the gypsite soil cap that formed in their central outflow pond. This gypsite soil, the Nonowie Member, is attributed a late Tertiary age from its relationship to other geological and soil features elsewhere in the region (Jessup & Norris, 1971).

Landscape Evolution of the Umbum Creek Catchment Chapter 1: Introduction
NOTE: This figure is included on page 1-25 of the print copy of the thesis held in the University of Adelaide Library.
Figure 1.15: Idealised mound spring cross-section showing the association of springs with faults (from Thomson & Barnett, 1985).
1-25

Landscape Evolution of the Umbum Creek Catchment Chapter 1: Introduction
1-26
1.10 DUNE ORIENTATIONS
Lake Eyre is located at the crux of both the Australian Tropical Monsoon System and the Mid-Latitude Westerly Circulation System. Dune formations are observed in both NE-SW and N-S orientation. Longitudinal dunes show a change in orientation reflecting a change in wind regime since dune formation.
The dune fields of central Australia cover a large area and several climatic zones. They form a characteristic giant whorl round the continental centre of Australia with the general direction of dune elongation being anticlockwise (Figure 1.16). The dunes are predominantly elongate, straight to slightly sinuous ridges of sand, that are sub-parallel to the resultant of sand-shifting winds and formed in a bi-directional regime (Brookfield, 1970).
Wopfner & Twidale (1967) explain how the dunes may form under this regime as the resultant of southeast and southwest dominant winds. The resulting migration of the dunes is essentially northward. Brookfield (1970) identified that the strongest winds derive from summer cyclones rather than from winter anticyclones and that the anticlockwise trend of the dunes around the central highlands is probably not caused by the anticyclones of the mid-latitude circulatory system but is more coincidence rather than effect. In fact, the time of origin of the Great Victorian Desert may be different to other dune fields in Australia (Brookfield, 1970).
Ash & Wasson (1983) present evidence that the modern wind regime is not the same as that which constructed the dunes. By classifying windiness they determined that the magnitude of the contemporary wind index is inadequate to account for large-scale dune-building processes, although it is sufficient to move sand on unvegetated dunes on a few days each year.Vegetation protects the dunes as a result of binding sand with roots and by modifying wind flow. Only dune crests are persistently mobile under present conditions in arid areas. This implies that when the dunes were forming in the Pleistocene they were submitted to increased windiness and/or had less vegetation cover (Ash & Wasson, 1983).
Nanson et al. (1995) examined this issue through thermoluminescence dating of several dunes in the Finke region of the Northern Territory. They identified two different types of dune: an older, northward oriented linear dune that was red-brown in colour, and pale coloured, source-bordering dunes that parallel the present prevailing wind direction. These pale dunes were identified as being derived from the alluvium of the Finke River. From TL dating, red longitudinal dunes appear to date from the last glacial (Stage 2) around 30–17 ka. There was little in the way of dune deposition during the early to mid-Holocene compared to the late Pleistocene (Nanson et al., 1995).
The oldest dunes appear to have formed c. 250ka (Nanson et al., 1995). The orientations of the source-bordering dunes indicate that there has been an easterly shift in the wind resultant since the regional dunefield was oriented. The source-bordering dunes have formed parallel to the present wind orientation over the last 5ka assisted by an abundant supply of sand via deflation and because the surface is not indurated and is poorly vegetated. The linear dunes seem to have resisted this trend as a result of a lack of sediment supply, slight induration through pedogenesis and vegetation cover (Nanson et al., 1995).

Landscape Evolution of the Umbum Creek Catchment Chapter 1: Introduction
NOTE: This figure is included on page 1-27 of the print copy of the thesis held in the University of Adelaide Library.
Figure 1.16: Map of Australian dune trends showing the whorl-shaped distribution of dune crest trends across the continent resulting from Pleistocene wind directions (from Nanson et al., 1995).
1-27

Landscape Evolution of the Umbum Creek Catchment Chapter 1: Introduction
1-28
1.11 GEOMORPHOLOGY
The opening of a rift valley between Australia and Antarctica at about 100Ma initiated a lowering of base level. As the Australian continent drifted north, the Cretaceous sea retreated and, in the Early Palaeocene, a period of weathering and erosion occured (Krieg, 2000).
From the Late Palaeocene to the Early Eocene extensive sand sheets deposited on braid-plains formed and where interspersed with restricted swamps and lagoons depositing carbonaceous sediment. The lack of thick and extensive fluvial conglomeratic facies and piedmont deposits flanking the ranges indicate a subdued topography (Alley & Pledge, 2000) (Table 1.4).
During the Oligocene, crustal stability and shrinking areas of deposition led to the formation of a mid-Tertiary plain. This remained stable into the mid-Miocene when the Lake Eyre Basin drainage formed an area of shallow sedimentation of approximately the same size as the present Lake Eyre playa. The surrounding land formed an erosional surface with very weak erosion and transport across it. This prolonged period of weathering led to the formation of a duricrust profile with a characteristic kaolinised zone and hard silcrete horizon (Wopfner & Twidale, 1967) (Table 1.4).
In the mid-Miocene the region underwent widespread epeirogenic movements, producing mild dome and basin topography. Uplift of the margins was accommodated by subsidence near Lake Eyre, allowing further deposition in the lake during the late Miocene and Pliocene (Wopfner & Twidale, 1967). As the climate fluctuated from a warm and wet climate in the Palaeocene to a warm, dry climate in the Miocene, conditions became favourable for the development of pedogenic silcretes. These were formed in a shallow groundwater environment with frequent recharge in a cold, wet climate. Silica-rich waters were mobilised into sandy sediments (Alexandre et al., 2003) (Table 1.4). Slow tectonic uplift caused water table fluctuations and as the silica-charged sediments were raised above the watertable, they became indurated forming silcrete (Krieg, 2000).
Episodic tectonic movement, including transcurrent and normal faulting, led to further development of dome and basin topography with Lake Eyre forming the largest depression.Upland areas began to erode, depositing into the basins. Gradients remained low and as a consequence small valleys were formed, incising no deeper than 15 m into the underlying silcretes and rapidly filling with alluvium. This alluvium in turn was subjected to further deep weathering, depositing bauxitic pisolites. These are exposed on the flanks of domal structures and are overlain by Etadunna Formation sediments. This indicates that the Etadunna Formation was deposited after the period of regional tectonic movement (Wopfner & Twidale, 1967).
Sedimentation began again after regional subsidence along the Lake Eyre Fault (Figure 1.5).This resulted in a downthrown western side and cased an asymmetry in the thickness of the Etadaunna Formation which thins further eastward (Wopfner & Twidale, 1967).
The Etadunna Formation was deposited in a brackish inland lake. Detrital material from the surrounding land was generally restricted to clays and fine sand, suggesting that the region again possessed very low gradients (Wopfner & Twidale, 1967) (Table 1.4).

Landscape Evolution of the Umbum Creek Catchment Chapter 1: Introduction
1-29
Table 1.4: Geomorphological summary of the Lake Eyre region based on work by various authors (Wopfner & Twidale, 1967; Jessup & Norris, 1971; Croke et al., 1996; Simon-Coinçon et al., 1996; Alley, 1998; Krieg, 2000)
AGE CLIMATE FM. EVENT
Cenomannian to Late Palaeocene
Warm and wet Weathering and erosion.Development of a kaolinitic deep weathering profile.
Late Palaeocene Warm and wet StuartPedoderm
Subsidence and silicification. Gentle warping producing dome and basin topography and accompanying silicification of silica-charged sediments.
Late Palaeocene to Middle Eocene
Tropical to subtropical Eyre Fm. Deposition of fluvio-lacustrine sand, silt and clay with broad braidstreams flowing northward.
Late Eocene Cool Monsoonal PaisleyPedoderm
Erosion, weathering and silicification.Warping and silicification of Paisley Pedoderm.
Late Oligocene to Miocene
Strongly seasonal with elevated temperatures
Etadunna Fm. Dolomite and magnesium-rich clay deposited in extensive, shallow alkaline lakes.
Pliocene Warm and wet Erosion, weathering and silicification with accompanying tectonism.Extensive dissection of landscape and the formation of broad fluviatile plains.
EarlyPleistocene
Myall CreekFm.
Deposition of gypsites and older mound spring limestones.
Pleistocene Increasingly arid fluctuating with pluvial
Red clay, silt and sand deposited in fluvial, lacustrine and aeolian settings. Erosion of gypsite surface.Several phases of erosion form terraces.
Pleistocene >160ka Warmakidyaboo
BedsHigh-energy meandering perennial river.
>160-103kaGhost Yard Beds
Perennial lacustrine conditions with high watertables.
50-31ka Base level lowering.

Landscape Evolution of the Umbum Creek Catchment Chapter 1: Introduction
1-30
Table 1.4 (continued).
AGE CLIMATE FM. EVENT
30ka Movement on Lake Eyre Fault
30-20 PiarookaBeds
Pimba Fm.
MumbalooPedoderm
Unrestricted fan sediments, ephemeral flow with multiple channels and ponding.Gypsum-rich clay and gibber plains.Gilgai.
20-18ka KootaberraFm.
Arid dune formation. Aeolian facies. Longitudinal sand dunes.
16ka Base level lowering.
BookalooPedoderm
Modern soils.
Landscape Evolution of the Umbum Creek Catchment Chapter 1: Introduction
1-31
The climate during the Oligocene-Miocene was wetter than the contemporary climate, but still strongly evaporitic to allow the deposition of dolomites within shallow alkaline lakes (Alley & Pledge, 2000).
During the Middle Pliocene, large freshwater to saline lakes fed by broad meandering river systems developed in the Lake Eyre area (Alley & Pledge, 2000). On the western shore of Lake Eyre an erosional period continued through the Pleistocene. Clastic sediments began to accumulate on broad, fluvial plains. This backfilling led to the deposition of gypsite sediments containing pauperate Foramnifera spp. indicating a brackish inland drainage environment for the start of this sedimentary sequence (Wopfner & Twidale, 1967). The geomorphic setting was similar to the present day, although higher rainfall and low evaporation rates allowed the persistence of large fresh water and brackish swamps (Wopfner & Twidale, 1967). A glacis, composed of the gypsum duricrust overlying Cretaceous sediments, formed during this lake highstand, high groundwater table environment (Simon-Coincon et al., 1996) (Table 1.4).
At the the same time, the rim of the Great Artesian Basin, along the east coast of Australia, was uplifted and created a piezometric gradient in the artesian aquifers. This resulted in the development of artesian springs along the western and southern edge of the Great Artesian Basin. In the shallow pools surrounding these springs, fresh-water limestones and travertine were formed (Wopfner & Twidale, 1967) (Table 1.4).
A return to a humid environment and a rising water table led to the formation of Pliocene-Pleistocene groundwater silcretes (Simon-Coincon et al., 1996). Reactivation along the western lineament 30 000 years ago caused further subsidence of the lake and uplift towards the western edge of the basin. This caused a rejuvenation of the drainage and led to the dissection of the gypsite surface down into the Cretaceous sediments. At the same time the eastern portion of the basin remained relatively stable (Wopfner & Twidale, 1967) (Table 1.4).
The post-gypsite erosion was not a single event but fluctuated between periods of active erosion and relative quiescence that led to the formation of terraces between the gypsite surface and the present-day erosional plains (Wopfner & Twidale, 1967). The detritus from this period of gypsite erosion was deposited into Lake Eyre and as the climate became more arid, these sediments were deflated and transported northwards by the wind and accumulated as dunes (Wopfner & Twidale, 1967).
The sequence of erosion, transport and deposition by water; and deflation, transport and deposition by wind, has persisted to the present, although the balance has changed with climate. During periods of higher rainfall, the balance was in favour of lacustrine deposition and the dunes were fixed with vegetation. During arid periods the depositional areas were deflated and wind deposition dominated. Deflation becomes ineffective once the water table is reached and, with arid conditions prevailing, sediment intake is restricted to sediment delivered during flood events (Wopfner & Twidale, 1967).
Modern conditions are arid and represent a lowstand in the history of Lake Eyre, with a generally dry climate and a low regional water table. Headward erosion has caused the low plains to erode into the older glacis surface. There is a difference of approximately 20 m between the glacis and the older floodplain implying that at least 20 m of Cretaceous sediment over an area of thousands of square kilometres has been removed (Simon-Coincon et al.,1996).

Landscape Evolution of the Umbum Creek Catchment Chapter 2: Methodology
2-1
2 METHODOLOGY A variety of different methods were used to examine the landscape. These include statistical analysis of seismic data, a range of different image processing methods for satellite imagery, morphometric analysis of a digital elevation model, standard geological methods for structural and stratigraphic mapping, the use of ground penetrating radar and regolith-landform mapping.
2.1 SEISMICITY IN THE LAKE EYRE REGION
The historical seismic record in the Lake Eyre region was examined to determine if there was contemporary seismic activity in the Lake Eyre region and if this was related to structural features that might be expressed in the landscape. Three datasets were examined to determine the mechanisms controlling seismic activity in the region.
2.1.1 Datasets
Three datasets were considered for comparison, including the state register for seismicity and two sets of hydrologic data: volumetric inflows to Lake Eyre and lake-level measurements.Each of these datasets has different constraints in terms of data consistency and the frequency of measurement.
South Australian Seismic Register
The recording of seismic activity in South Australia since European settlement has been sporadic and fraught with the intermittent closure of stations for various periods so that the network of seismic stations varies through time. This and the location of the bulk of these stations to the south and west of Lake Eyre result in a loss of spatial resolution due to triangulation errors. Measurements of magnitude and occurrence are relatively free of problems of spatial resolution and a period of similar data fidelity was chosen between 1979 and 2001 as representative of seismic activity in the region. The dataset was spatially limited to epicenters listed as occurring in the northeast corner of South Australia north of latitude 30°S and east of longitude 134°E.
Volumetric Inflows To Lake Eyre
The volumetric inflow data for Lake Eyre represents a reconstructed dataset developed by Kotwicki & Isdale (1991) for modelling purposes. This was developed by the use of proxy coral data representing flows in the Burdekin River, a major tributary in a catchment adjacent to Lake Eyre that has been statistically linked to the volumes of Lake Eyre inflows (Figure 1.3). The dataset is subject to uncertainty but is a good quality estimate for volumetric inflow (Kotwicki & Isdale, 1991).
Lake Level
A practical method of estimating lake levels was developed by Bob Backway of the Lake Eyre Yacht Club (www.lakeeyreyc.com, available May 21, 2006). Coupling the bathymetry of the lake with Landsat satellite imagery, the spatial extent of water in the lake is determined and the lake level calculated. This produces a consistent dataset over the period of time covered by satellite imagery (Backway, 2001).
2.1.2 Statistical Methods
The various datasets were averaged to annual statistics to account for the differences in measurement timescales. Variables of annual average magnitude, annual frequency and

Landscape Evolution of the Umbum Creek Catchment Chapter 2: Methodology
2-2
annual average focal depth compared against annual average volumetric inflow and annual average lake depths were examined. Each pair of datasets of earthquake and hydrographic data was examined by regression analysis. Further statistical tests (Pearson Product Moment, R, R2 and ANOVA tests) were applied to measure the extent, if any, of the correlation between data members.
The Pearson Product Moment test, R, produces a result that ranges from -1 to +1 and reflects the extent of a linear relationship between the two data sets. A positive result refers to a correlation between datasets where an increase in one is reflected by an increase in the other, and conversely, a decrease in one by a decrease in the other. The two are said to be positively correlated. A negative result refers to the situation where an increase in one data set is reflected by a corresponding decrease in the other and vice versa. This is known as a negative correlation. A result of zero represents a lack of correlation (STATSOFT, 2003).
The R2 Test returns the square of the Pearson Product Moment correlation coefficient and is interpreted as the proportion of the variance in one dataset attributable to the variance in the other. It can be thought of as representing the strength of the correlation. A value of 1 would represent a complete correlation, that is, no difference between datasets (STATSOFT, 2003).
The ANOVA test (Analysis Of Variance) produces a value for ‘Significance F’ which returns the one tailed probability that the variance in one dataset is not significantly different from the other dataset. A high value indicates that there is a high degree of variance between the two datasets. A low value indicates that there is a significant degree of correlation between datasets (STATSOFT, 2003).
2.2 REMOTE SENSING
Satellite remote sensing techniques were applied to reveal information about the relationships between landforms, to assist in mapping and to determine targets for later ground-truthing. A range of different platforms was used with each sensor providing a different type of information to be analysed. Satellite systems examined include Landsat, ASTER and JERS-1 SAR. In addition, image melding was conducted to combine ASTER and JERS-1 SAR.
2.2.1 Landsat 5 TM
Thematic Mapper (TM) is a multispectral scanning radiometer. TM image data consists of seven broad spectral bands in the infrared range with a spatial resolution of 30 m for most bands (1-5 and 7).
Primary Industries and Resources South Australia provided Landsat 5 TM data. Analysis was conducted using ER Mapper. The two scenes used were labelled 100_79_mga53 and 100_80_mga53 and provided in datum GDA94, projection MGA53. The scenes were captured on Sunday January 30 12:40:22 GMT 1994 and Wednesday January 18 21:32:23 GMT 1995 respectively (Figure 2.1).
The full scenes were sub-sampled to produce a combined scene that covers the field study area. These scenes were processed by constructing ER Mapper algorithms to merge the two scenes into one image. This process, however, produces results that are slightly different in tone for the respective tiles and adjustments were made manually to the final image transform to obtain a best colour match between images. Caution should be exercised when interpreting across the tile boundaries. The analysis of Landsat 5 TM data was via False Colour Composites (FCCs) and Band ratioing.

Landscape Evolution of the Umbum Creek Catchment Chapter 2: Methodology
NOTE: This figure is included on page 2-3 of the print copy of the thesis held in the University of Adelaide Library.
Figure 2.1: Location diagram of Landsat 5 TM data showing the position of the Landsat tiles used for analysis (Landsat 7 ETM mosaic image courtesy of Exxon-Mobil).
2-3

Landscape Evolution of the Umbum Creek Catchment Chapter 2: Methodology
2-4
False Colour Composites
ERMapper provides a series of algorithms to display commonly used false colour composites (FCCs). These display different Landsat TM bands as red, green and blue channels (e.g. RGB321). Specific combinations of bands were chosen for their known response associated with different features, for example, bands 3 and 1 with iron, bands 5 and 7 with clays and band 5 also with vegetation (Avery & Berlin, 1992).
Band Ratios
Band ratioing is a technique used where the signal from one spectral band is divided by the signal of a second spectral band (e.g. 5/7). This is particularly useful in identifying minerals with a strong response in one band but a weak response in the other (Avery & Berlin, 1992).The imbalance in the spectral signal of the two bands will result in a high ratio visible as a bright pixel. A range of simple band ratios out of 30 possible combinations was examined. The ratios may also be displayed as false colour composite images with a different ratio in each channel (e.g. RGB 3/1, 5/4, 5/7).
2.2.2 Analysis of Multi-Spectral ASTER data
The Advanced Spaceborn Thermal Emission Reflection Radiometer (ASTER) is a multispectral imaging device launched by NASA in December 1999. ASTER covers 14 bands from the visible to the thermal infrared and has varying spatial resolution dependent on wavelength. It is 15 m in the visible and near-infrared (VNIR), 30 m in the short wave infrared (SWIR) and 90 m in the thermal infrared (TIR). In addition, a backwards-looking sensor in band 3 of the VNIR provides the capability to create stereo pairs (Abrams et al., 2000).
Three ASTER L2 scenes (Figure 2.2) each approximately 60 km x 60 km were chosen for analysis, corresponding to ASTER data granules:
SC:AST_L1B.003:2003644986;
SC:AST_L1B.003:2003835431; and,
SC:AST_L1B.003:2018334242.
These are referred to respectively as:
Hawker Springs;
Neales Fan; and,
Sunny Creek. Original data © NASDA, MITI (2001) distributed by ACRES, Geoscience Australia.

Landscape Evolution of the Umbum Creek Catchment Chapter 2: Methodology
NOTE: This figure is included on page 2-5 of the print copy of the thesis held in the University of Adelaide Library.
Figure 2.2: Location diagram of ASTER data showing the position of the ASTER tiles used for analysis (Landsat 7 ETM mosaic image courtesy of Exxon-Mobil).
2-5

Landscape Evolution of the Umbum Creek Catchment Chapter 2: Methodology
2-6
Data Processing
The data was processed through a combination of RASTUS by Picoimages and ENVI 3.5 by Research Systems.
RASTUS (Real ASTer User System) is a software toolkit equipped with a range of tools for processing ASTER data. It produces an output in ENVI format. ENVI is a generic image-processing package designed for hyperspectral imagery.
Data was initially split into the three band sets with spatially distinct resolution, the VNIR/VNIR-B, SWIR and TIR.
Endmember Extraction: Unsupervised Classification
Each scene was run through a series of routines designed to extract endmembers. These divide the image up into discretely identifiable spectral units that provide discrimination between features in the image. The routines use different mathematical algorithms to select the endmembers.
1. Intrinsic (Non-negative mean square error minimisation); 2. Extrinsic (Non-negative Principal Components Analysis); 3. MLR (Multiple Linear Regression); and, 4. ICA (Independent Components Analysis).
Relative Band Depth Ratios
The SWIR and TIR data from each scene was analysed through several different band ratio techniques to identify mineralisation in the landscape. Information concerning mineral properties is recorded in Appendix A. Rowan’s ratios (Rowan & Mars, 2001) were applied to the SWIR bands and Ninomiya’s spectral indices (Ninomiya & Fu, 2001) were calculated for the TIR bands. Ninomiya’s carbonate index was calculated using ASTER band 14. This band has been known to have fidelity problems (Hewson, Pers. Comm. 2003) and none of the carbonate index analyses produced images capable of being realistically interpreted.
Rowan’s Ratios
Muscovite/Illite/Smectite = (B5+B7)/(B6x2)
Calcite = (B7+B9)/(B8x2)
Dolomite = (B6+B8)/(B7x2)
Alunite/Pyrophillite = (B4+B6)/(B5x2)
Ninomiya’s Spectral Indices
Silica Index: SI=B11xB11/B10/B12
Carbonate Index: CI=B13/B14
Supervised Classification
Several techniques were used to produce supervised classification outputs from the data.

Landscape Evolution of the Umbum Creek Catchment Chapter 2: Methodology
2-7
Regions of Interest (training areas) were defined with the aid of the endmembers produced from the unsupervised classification. These Regions of Interest were then supplied to the ENVI classification routines:
Parallelepiped;
Minimum Distance; and,
Mahalanobis Distance.
These produced classification maps. Of these, the Mahalanobis Distance classification provides the most easily interpreted image conducted at a Maximum Distance Error=100.
2.2.3 JERS-1 SAR
The Japanese Earth Resources Satellite (JERS-1) Synthetic Aperture Radar (SAR) is a high-resolution imaging radar that can map the topography and geology of the Earth’s surface. Its signal operates in the L-band (1.3 GHz, 23.5 cm) and is horizontally polarised (HH). It has an incidence angle of 35 degrees and a resolution of 12.5 m (Chapman et al., 2002). JERS-1 SAR was chosen for analysis to aid in the identification of buried structural features and palaeochannels. The use of SAR to identify buried palaeochannels has been well documented (McCauley et al., 1982; Dabbagh et al., 1997; Schaber et al., 1997; Schaber, 1999; Robinson, 2002). In order for this technique to work a specific set of conditions must be met.
1. The cover material must be radar smooth, fine-grained (relative to the wavelength) and homogeneous in order for the radar signal to penetrate without significant attenuation;
2. The cover material must be extremely dry; and, 3. Subsurface features are more likely to be revealed at high-look angles (more than 30
degrees) (Robinson, 2002).
Of these criteria 2) and 3) are met but the clast size of surficial lags in some parts of the study area is in the order of 4–5 cm; this grainsize is likely to cause significant attenuation of the signal (Robinson, 2002). The image was antenna corrected and passed through a standard 3x3 Lee filter Kernel using ERMapper v6.4.
2.2.4 JERS-1 SAR and ASTER image melding
Image melding is the process of combining different types of datasets into one image. In the case of satellite imagery, bands from one satellite dataset may be melded with bands from another satellite’s dataset to create an image that combines the properties of both satellites. In this case the spectral capabilities of ASTER data were melded with the textural capability of JERS-1 SAR.
Method
ERMapper v6.4 was used to meld the datasets. The datasets possess different image rotations, satellite tracks, image sizes, pixel sizes and scales. Both datasets were adjusted to consistent image rotation for each scene and the radar data resampled to match the 15 m cell size of the ASTER, visible near infra-red (VNIR) bands using cubic convolution. ASTER short wave infra-red (SWIR) bands were also resampled to 15 m pixels. The datasets were then melded by compiling an ERMapper algorithm that incorporated the JERS-1 SAR data into the arbitrarily chosen blue channel with the ASTER VNIR and SWIR bands loaded into the red and green channels. ERMapper could then display this dataset as an RGB meld image. Various permutations of bands were displayed in the remaining two channels. Best results were obtained using RGB = 4,7,(SAR). The JERS-1 band was not adjusted for size. Instead a mask was applied bounding the extents of the ASTER imagery.

Landscape Evolution of the Umbum Creek Catchment Chapter 2: Methodology
2-8
2.3 TECTONIC INFLUENCES ON GEOMORPHOLOGY
Morphometric analysis was conducted on a digital elevation model of the region to examine if neotectonic features were expressed in the landscape. This involved the construction of longitudinal stream profiles and the calculation of the catchment’s morphometric parameters.
2.3.1 Digital Elevation Model & Longitudinal Stream Profiles
Geomorphological data was extracted from the GEODATA 9 Second Digital Elevation Model (DEM-9S) Version 2.1. (AUSLIG/AGSO, 2003). Data was analysed using MicroDEM freeware and stream pathways defined using GA-Natmap stream vector data. Longitudinal profiles were plotted using the MicroDEM stream profile function.
The gridded DEM has a cell size of 9 seconds of longitude by 9 seconds of latitude that is equivalent to an approximate cell size of 250 m. The data within each 250 m cell is represented as the approximate elevation of the centre of the cell. As such it cannot always be assumed to represent the true depth of the stream profile. An error range of between 7.5 m and 20 m is cited for the DEM-9S dependent on slope (Geoscience Australia, 2002). For this reason small-scale perturbations in the longitudinal profile cannot be assumed to represent features such as nick points. It is the general trend of the profiles that is analysed.
The ideal channel longitudinal profile is defined here as the exponential line of best fit to the data. Where a stream profile possesses negative elevation values, and hence an exponential cannot be determined, the calculated equation is that corresponding to the line of best fit through data that has been elevated 10 m in order to produce a positive profile.
Stream reaches that possessed an anastomosing channel planform were recorded from the GA-Natmap stream vector data, as a change in stream planform may represent underlying neotectonic deformation (Holbrook & Schumm, 1999). The anastomosing reaches were transferred to the longitudinal profiles and presented as shaded boxes.
2.3.2 Morphometric Analysis
Morphometric analysis of drainage basins within the Umbum Creek catchment was carried out utilising the Terrain Analysis System (TAS) freeware program applied to the 9 second DEM.
A watershed was defined from the DEM calculated stream network using TAS option for calculating catchment area via ADRA (Adjustable Dispersion Routing Algorithm). An upper threshold of 10 was used for the transition boundary to derive the stream network. Unlike most flow direction routing algorithms, ADRA divides flow using local slope and an estimate of the cell's position relative to channel heads. Thus, by incorporating a model of channel initiation directly into the flow calculation, ADRA can model catchment area on hillslopes and along valley bottoms (Lindsay, 2002).
This stream network was then ordered according to the Strahler stream ordering method and the network statistics, drainage density and hypsometric curves transferred to MS Excel for display and analysis.
The watershed analysis divides the drainage into three major sub-catchments: the Neales, the Umbum and the Douglas (Figure 2.3). These were used as the boundaries for sub-catchment hypsometric analysis.

Landscape Evolution of the Umbum Creek Catchment Chapter 2: Methodology
2-9
Figure 2.3: : Delimitation of catchments within the study area showing the locations of catchment boundaries.

Landscape Evolution of the Umbum Creek Catchment Chapter 2: Methodology
2-10
TAS was used to determine results for Relative Stream Power (RSP) and Sediment Transport Capacity (LS) according to the methods cited in the TAS documentation.
RSP=As (1.0 x tanS)
and
LS=(As/22.13) 0.6 x (sinS/0.0896) 1.3
Where
As=specific catchment area S=local slope
2.3.3 Differential GPS Survey
In addition to data obtained from DEMs, topographic data was collected via a Differential Geographic Positioning System (DGPS) survey. Cross-channel profiles were taken along Umbum Creek and the Neales River and survey lines were taken across the surface of the Neales Fan.
A Trimble Real Time Kinematic (RTK) DGPS was used to conduct the survey. This consists of a base station and rover unit. The base station was installed and left to obtain satellite signal and equilibrate to an accuracy of +/-15 mm vertical error and +/-10 mm horizontal error. The rover unit was either attached to a vehicle or equipped as a backpack. The survey line was driven or walked out depending on the ruggedness and distance of the traverse line. The base station possesses limited radio signal broadcast distance and it was necessary to move the base station several times. Each time the base station was left to equilibrate to within the required error range at the new site.
2.3.4 Geological Cross-sections
Little subsurface geological data has been collected across the Neales Fan. The data that is available was collected as adjunct borehole data as part of a climatological study by Croke etal. (1998) and was directed at identifying the top of the Tertiary units. Fourteen bores were drilled to a maximum depth of 15 m and logged using four units:
Undifferentiated Quaternary sands and gravels;
Coarse sands;
Silty muds; and,
Black organic muds of the Tertiary Eyre Formation. This data was taken directly from the published dataset. Several of the boreholes have been surveyed with respect to height and have well constrained elevations, however, no published data was available for the exact borehole locations. An estimate of the location of each borehole was made from the published schematic map. The limited geological data from the boreholes was combined with surface geological mapping and topographic sections to produce schematic geological cross-sections.

Landscape Evolution of the Umbum Creek Catchment Chapter 2: Methodology
2-11
2.4 GEOLOGICAL STRUCTURE MAPPING
2.4.1 Standard Geological Methods
The low topographic elevation of much of the study area results in very little geological exposure. Along the Neales Cliff (Figure 1.2) there is significant geological exposure of Tertiary and Quaternary units. Geological structures such as folded bedding were mapped using standard geological methods to determine dip and dip direction of bedding planes and the trend and plunge of minor folds using a Suunto compass-clinometer.
Neotectonic deformation may occur as minor folding and warping within a flat lying unit. In order to detect this low degree of deformation over several hundreds of metres, a survey utilising a total station theodolite (with an accuracy of ±0.0001 m) was conducted.
The results of both structural mapping and the total station survey were plotted and interpreted to identify and measure signs of neotectonic activity.
2.4.2 Ground Penetrating Radar (GPR)
As part of other project work being conducted within the field study area, a Ground Penetrating Radar (GPR) survey was commissioned during the 2004 field season. This research was to examine the third dimension of reservoir-related architectural elements. Subsequent analysis of the GPR data revealed that the dataset can be used to identify interpreted structural discontinuities within the subsurface.
GPR detects changes in electromagnetic properties (dielectric permittivity, conductivity, and magnetic permeability) that are a function of subsurface material, structure, water content, and bulk density. Data is normally acquired using antennas placed on the ground surface or in boreholes. Short pulses of electromagnetic energy are injected from the surface and radiate until heterogeneities are encountered. Some energy is transmitted through to a deeper level, while the remainder is reflected to the receiving antennae. The ratio of transmitted to reflected energy depends largely on the relative dielectric permittivity of the material. The reflected response is amplified, transformed and stored and the resulting two-wave travel-time is used to estimate the depth and velocity (Moffat in Krapf & Lang, 2005).
Dielectric permittivity is a measure of the capacity of a material to store charge under an applied electric field relative to the same capacity in a vacuum. Under the field’s influence, charges separate and accumulate where materials of different dielectric permittivity meet (Moffat in Krapf & Lang, 2005). This phenomenon can be used to detect sedimentary boundaries and sedimentary architecture.
Two GPR surveys were undertaken by Ecophyte Technologies Pty Ltd during July and October 2004. A DGPS system with a vertical accuracy of 15 mm and a horizontal accuracy of 10 mm was used to allow spatial positioning during data collection, and to correct the data for the effects of topography.
Data was processed by Mark Reily (ASP), Ian Moffat (ASP) and John Joseph (CRC-LEME).

Landscape Evolution of the Umbum Creek Catchment Chapter 2: Methodology
2-12
2.5 REGOLITH GEOLOGY
2.5.1 Regolith Mapping
Remote sensing data (Chapter 3) revealed a high degree of variability in the expression of the land surface within the Umbum Creek Catchment. These changes are related to different types of landforms. The RT-Map system (Pain et al., in press) uses a dual scheme to define Regolith-Landform Units (RLU) based on regolith material and landform. RLU descriptions record the dominant regolith lithology, the dominant landform, surficial features (e.g. lag), minor features and the dominant vegetation community structure, type and species (Hill et al., 2003).Using this system it is possible to map landforms and changes in regolith characteristics across the landscape. Other methods such as traditional geology, geomorphology and soil maps do not incorporate the same degree of information relevant to the detection of neotectonic landscape features as this system. Neotectonic rearrangement alters the expression of landforms and regolith characteristics that are readily detected using this system. Thus the RLU method is extremely useful for highlighting changes due to neotectonic rearrangement of landforms.

Landscape Evolution of the Umbum Creek Catchment Chapter 3: Seismicity in the Lake Eyre Region
3-1
3 SEISMICITY IN THE LAKE EYRE REGION
3.1 INTRODUCTION
An examination of the landscape features surrounding Lake Eyre reveals a consistent series of lineaments that are observed forming boundaries to geomorphic features. In addition, stream directions are often controlled by these lineaments, as shown, for example, by the strong linear trend of the Warburton and Kalaweerina Grooves across the playa surface of Lake Eyre, particularly by the channel adjustment as these rivers enter the lake (Figure 3.1). These lineaments are interpreted as basement faults and show a strong spatial correlation with earthquake epicentres (Figure 3.1). Indeed this same trend is evident on a continent-wide scale and the Lake Eyre region appears to be the meeting point for several continental-scale structural lineaments (Figures 1.2 & 1.8).
3.2 TECTONIC MODEL
The Lake Eyre depression has been interpreted as a subsiding intra-continental basin that is the result of tectonic post-rift sag following the separation of the Australian and Antarctic continental plates (Drexel & Preiss, 1995). Water entering Lake Eyre should, as a result of its weight, estimated at around 63.2 Gt, cause tectonic loading on this subsidence prone area, resulting in seismic tremors in the surrounding region.
3.3 RESULTS
Three datasets were considered for comparison, including the state register for seismicity and two sets of hydrologic data: volumetric inflows to Lake Eyre and lake-level measurements.These were analysed according to statistical methods outlined in Chapter 2.1.
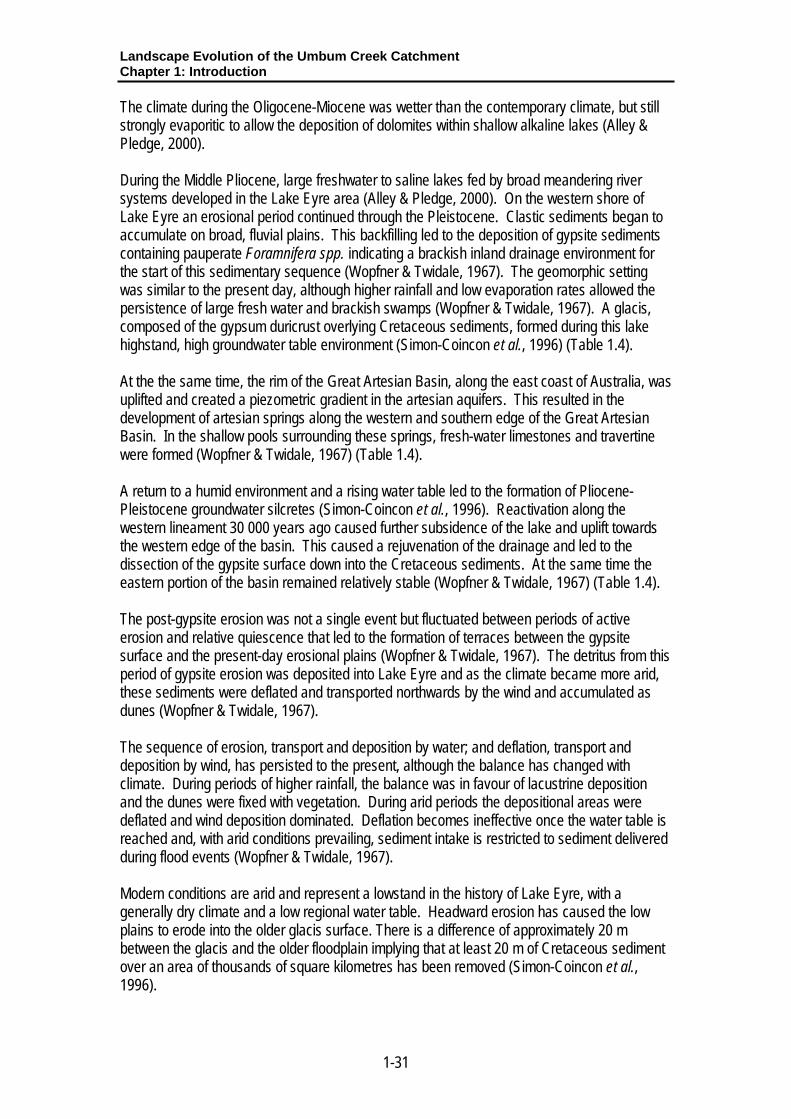
Through observational analysis of raw data plots it appears that there is some correlation between the earthquake datasets and the calculated inflows into Lake Eyre (Figures 3.2 & 3.3).When subjected to statistical analysis these apparent correlations are statistically insignificant (Table 3.1).
A comparison of the results shows that most of the dataset correlations display a slightly positive Pearson Product Moment, R (Table 3.1). This implies that they are all slightly positively correlated and this can be seen in the plots which suggest hints of statistical agreement (Figures 3.2 & 3.3). When subjected to the R2 test, however, the degree of correlation within the groups of data breaks down and small percentages are returned in all cases, indicating that they are not statistically significant (Table 3.1).

Landscape Evolution of the Umbum Creek Catchment Chapter 3: Seismicity in the Lake Eyre Region
3-2
Figure 3.1: Interpreted basement faults in the study area showing the spatial correlation with earthquake epicentres. The number of stations that record the event and the position of these stations influence epicentre location. For the South Australian seismic network, spatial error is likely to be within a 25-50 km radius. Seismic stations are located to the south and southeast of this region and thus the error is likely to plot in a north to northeasterly direction.

Landscape Evolution of the Umbum Creek Catchment Chapter 3: Seismicity in the Lake Eyre Region
3-3
Table 3.1: Statistical Results (refer to Chapter 2.1 for statistical methods)
Magnitude Volumetric Inflow Lake Level
Pearson R 0.078738 0.106003
R squared 0.0062 0.011237
ANOVA 0.71458 0.630244
Focal Depth Volumetric Inflow Lake Level
Pearson R 0.12062 0.065502
R squared 0.014549 0.004291
ANOVA 0.574506 0.766514
Frequency Volumetric Inflow Lake Level
Pearson R 0.005746 0.06648
R squared 3.3E-05 0.004442
ANOVA 0.978742 0.762544
3.4 DISCUSSION
There appeared to be a similar shape between the curves for Frequency and Inflow (Figure 3.2) and Frequency and Lake Level (Figure 3.3). This was not evident in the statistical results obtained from the analysis, but a time lag of six years appeared to separate the curves. By plotting the covariance matrix for a range of annual delay values, the variance peaks at an optimum value of six years (Figure 3.4). An increase in statistical correlation does occur when the frequency of earth tremors is replotted six years earlier (Figure 3.5 & Table 3.2). The Pearson Product Moment, R, and R2 increase significantly for Lake Level and for Volumetric Inflow. While this is still only a relatively small correlation it is more statistically significant than the comparison of the annual datasets without the time delay. Similarly, the ANOVA test produces results that show an increase in correlation.
Significantly, the earthquake Frequency data follows the Inflow and Lake Level results, not the other way around. This allows the interpretation that the increased number of tremors per year are related to increased volumes of water in the lake. However, a model based on tectonic loading cannot account for this delay, as the weight of the water should cause a relatively instantaneous response. An alternative model of hydroseismicity was examined to explain this delay.
3.4.1 Hydroseismicity
The theory of hydroseismicity was developed to account for intraplate seismic activity (Costain & Bollinger, 1996). This theory is based on long-term fluctuations in climate and rainfall. This causes fluctuation in water table that, via pore pressure diffusion, results in small changes in fluid pressure at depth, even as deep as the brittle-ductile transition (15–18km). These small changes may be enough to trigger a hydraulically induced earthquake. This applies for a fractured, hydraulically permeable crust.
Significant sediment thicknesses of Tertiary mudstones and sands and Cretaceous shales underlie Lake Eyre. This does not appear to be a regime within which hydroseismicity might dominate, as these sediments behave as aquicludes, preventing the transmission of water through their strata, unlike sandstone aquifers (Costain & Bollinger, 1996). The water-bearing Jurassic sandstones of the Great Artesian Basin lies still deeper and is more likely to transfer changes in hydrostatic pressure. The Great Artesian Basin stretches beneath the Australian landscape to the eastern coast where it has its recharge zone (See Chapter 1.9).
Landscape Evolution of the Umbum Creek Catchment Chapter 3: Seismicity in the Lake Eyre Region
3-4
Magnitude & Inflow
02468
101214
1975
1980
1985
1990
1995
2000
2005
Year
Vo
lum
etr
ic In
flo
w
(km
3)
0
0.5
1
1.5
2
2.5
An
nu
al A
ve
rag
e
Ma
gn
itu
de
(Ric
hte
rs)
Inflow
Magnitude
Focal Depth & Inflow
02468
101214
1975
1980
1985
1990
1995
2000
2005
Year
Vo
lum
etr
ic
Infl
ow
(k
m3
)
0
5
10
15
20
An
nu
al A
ve
rag
e
Fo
ca
l D
ep
th (
km
)
Inflow
Focal Depth
Frequency & Inflow
02468
101214
1975
1980
1985
1990
1995
2000
2005
Year
Vo
lum
etr
ic In
flo
w
(km
3)
0
50
100
150
An
nu
al
Fre
qu
en
cy
Inflow
Frequency
Figure 3.2: Regional earthquake data as compared to volumetric inflows into Lake Eyre through time (1979-2002) showing little correlation between earthquake datasets and calculated proxy inflows to Lake Eyre.

Landscape Evolution of the Umbum Creek Catchment Chapter 3: Seismicity in the Lake Eyre Region
3-5
M agn itude & L ake L evel
0
2
4
6
8
10
Year
La
ke
Le
ve
l (m
)
0
0 .5
1
1 .5
2
2 .5
An
nu
al A
ve
rag
e
Ma
gn
itu
de
(R
ich
ters
)
Lake Leve l
A vg M ag
Focal Depth & Lake Level
0
2
4
6
8
10
1975
1980
1985
1990
1995
2000
2005
Year
Lake L
evel (m
)
0
5
10
15
20
An
nu
al A
ve
rag
e
Fo
ca
l D
ep
th (
km
)
Lake Level
Focal Depth
Frequency & Lake Level
0
2
4
6
8
10
1975
1980
1985
1990
1995
2000
2005
Year
Lake L
evel
(m)
0
20
40
60
80
100
120
140
An
nu
al
Avera
ge
Fre
qu
en
cy
Lake Level
Frequency
Figure 3.3: Regional earthquake data as compared to estimated lake levels in Lake Eyre (1979-2002) showing little correlation between earthquake datasets and calculated lake levels.

Landscape Evolution of the Umbum Creek Catchment Chapter 3: Seismicity in the Lake Eyre Region
3-6
The recharge zone possesses the same sources of input as the Burdekin River, used to collect the Inflow data. The travel time for water from recharge to discharge is extremely long in the order of 3 Ma at a rate of 1–5 m/a (Sibenaler et al., 2000). This represents the physical travel time of water; however, it is possible that a pressure front may travel much more rapidly.
Pressure data was examined from Jackboot Bore and compared to Inflow, Lake Level and Frequency (Figures 3.7 & 3.8). Jackboot Bore is located within the southwestern section of the Lake Eyre Basin and was assumed to be representative of pressure changes within this region.The data was obtained from the Department of Water, Land, Biodiversity and Conservation (DWLBC) that has maintained a monitoring system in the Great Artesian Basin for over twenty years. Because the bores are artesian, bore pressures are recorded in kilopascals and converted to Relative Static Water Levels (RSWL) giving the elevation of the piezometric surface.
A qualitative assessment of the Jackboot Bore RSWL curve compared to both Volumetric Inflow and Lake Level (Figure 3.7) shows some agreement within their trends. This is reflected in the statistical correlation results demonstrating a mild correlation between the datasets with Volumetric Inflow displaying a slightly stronger correlation (Table 3.3). Given the scale of the GAB and the large number of variables involved within this open system, a mild correlation such as that between Volumetric Inflow and Jackboot Bore RSWL is considered significant. Thus when Frequency is compared to Jackboot Bore RSWL data that has been shifted backwards in time by six years to take account of the time delay apparent in the system, a strong correlation is observed (Table 3.4). It is clear that changes in hydraulic pressure cause earthquake tremors in this region. What is not clear is the reason for the six-year delay between the change in hydraulic pressure and the occurrence of earthquake tremors. Perhaps this delay is due to the time required for pressure to transfer from fluid pressure to some form of rock mechanical pressure through a change in rock properties.
3.5 FUTHER IMPLICATIONS
Analysis of seismicity demonstrates that a link exists between climate and tectonism via changes in hydraulic pressure in the northeastern corner of South Australia, as lake levels are a direct result of filling cycles caused by rainfall within the Lake Eyre Basin catchment. Kotwicki & Allan (1998) have demonstrated that a similar link exists between the filling cycle of Lake Eyre and the El Niño cycle. The driving mechanism for the El Niño cycle is the development of a cold-water current along the western South American coastline. By inference, the development of this current is therefore related to the occurrence of earthquake tremors in the centre of Australia. It is proposed that the teleconnections involved are part of a hysteresis loop of planetary proportions where changes in oceanic temperature lead to variation in the atmosphere. This results in fluctuations in rainfall within the Lake Eyre Basin catchment that, ultimately, cause earthquake tremors through changes in hydraulic pressure. If a link can be shown to exist between earthquake tremors in central Australia and oceanic currents off the southern Australian coast then the existence of this hypothetical loop can be verified and further investigation of the influence of this cycle can commence.

Landscape Evolution of the Umbum Creek Catchment Chapter 3: Seismicity in the Lake Eyre Region
3-7
Covariance
-40000
-20000
0
20000
40000
60000
0 2 4 6 8 10
Delay (Years)
Co
vari
an
ce
12
Figure 3.4: Covariance plot of Frequency versus Inflow data showing a peak in correlation at a delay of six years.

Landscape Evolution of the Umbum Creek Catchment Chapter 3: Seismicity in the Lake Eyre Region
3-8
6yr Time-shifted Frequency & Inflow
0
2
4
6
8
10
12
14
Year
Vo
lum
etr
ic I
nfl
ow
(km
3)
0
20
40
60
80
100
120
140
An
nu
al
Fre
qu
en
cy
Inflow
Frequency
6yr Time-shifted Frequency & Lake Level
0
2
4
6
8
10
Year
La
ke
Le
ve
l (m
)
0
20
40
60
80
100
120
140
An
nu
al A
vera
ge
Fre
qu
en
cy
Lake Level
Frequency
Figure 3.5: Plots of Annual Frequency versus Average Annual Inflow and Average Annual Lake Level versus Annual Frequency shifted backwards by 6 years showing a stronger correlation between earthquake datasets and both lake level and proxy inflow data.
Table 3.2: Statistical results for the six year time-shifted frequency plots.
6yr Time-shifted Frequency Volumetric Inflow Lake Level
Pearson R 0.093739 0.465689
R squared 0.008787 0.216866
ANOVA 0.686099 0.059576

Landscape Evolution of the Umbum Creek Catchment Chapter 3: Seismicity in the Lake Eyre Region
NOTE: This figure is included on page 3-9 of the print copy of the thesis held in the University of Adelaide Library.
Figure 3.6: Jackboot Bore location diagram showing the GAB monitored wellfields network. Jackboot Bore is circled (from Sibenaler et al., 2000).
3-9

Landscape Evolution of the Umbum Creek Catchment Chapter 3: Seismicity in the Lake Eyre Region
3-10
0
2
4
6
8
10
12
14
Year
Vo
lum
etr
ic In
flo
w (
km
3)
80
82
84
86
88
90
92
RS
WL
(m
AH
D)
Inflow
Jackboot Bore
0
1
2
3
4
5
6
7
8
9
10
1975
1980
1985
1990
1995
2000
2005
Year
Lake L
evel (m
)
81
82
83
84
85
86
87
88
89
90
RS
WL
(m
AH
D)
Lake Level
Jackboot Bore
Figure 3.7: Comparison of regional hydrologic datasets with Jackboot Bore RSWL. Inflow displays a minor correlation with bore pressure, as does Lake Level.
Table 3.3: Statistical results for Inflow and Lake Level compared to Jackboot Bore RSWL.
Inflow vs Jackboot Bore RSWL
Lake Level vs Jackboot Bore RSWL
Pearson R 0.314495 0.246923
R2 0.098907 0.060971
ANOVA 0.218914 0.356548

Landscape Evolution of the Umbum Creek Catchment Chapter 3: Seismicity in the Lake Eyre Region
3-11
Frequency & Jackboot Bore RSWL
80
82
84
86
88
90
92
1975
1980
1985
1990
1995
2000
2005
Year
RS
WL
(m
AH
D)
0
50
100
150
An
nu
al
Fre
qu
en
cy
Jackboot Bore
Frequency
Time Adjusted Frequency & Jackboot Bore RSWL
80
82
84
86
88
90
92
1975
1980
1985
1990
1995
2000
2005
Year
RS
WL
(m
AH
D)
0
50
100
150
An
nu
al F
req
uen
cy
Jackboot Bore
Frequency
Figure 3.8: Comparison of Frequency with Jackboot Bore RSWL showing a stronger correlation when Frequency is time-shifted by 6 years.
Table 3.4: Statistical results for comparison of regional datasets with Jackboot Bore RSWL.
Frequency vs Jackboot Bore RSWL
Time shifted Frequency vs Jackboot Bore RSWL
Pearson R 0.368119 0.708753
R2 0.135512 0.502331
ANOVA 0.132829 0.006686

Landscape Evolution of the Umbum Creek Catchment Chapter 3: Seismicity in the Lake Eyre Region
3-12
3.6 CONCLUSIONS
A statistical examination of earthquake, proxy inflow, lake level and bore pressure data has demonstrated that there is seismic activity observed in the Lake Eyre Region. This seismic activity is associated with basement faults. It is proposed that this seismicity is produced as a result of hydroseismicity, where variations in pressure at depth cause an increase in pore pressure that results in slip along susceptible faults. Fluctuations in rainfall in the recharge zone of the Great Artesian Basin causes a pressure front to pass through the aquifer that triggers earthquakes via hydroseismicity. The transfer of hydraulic pressure to rock mechanical pressure is calculated to take six years through undetermined mechanisms.