Embed Size (px)
Citation preview
sensors
Article
Landsat-Derived Estimates of Mangrove Extents inthe Sierra Leone Coastal Landscape Complexduring 1990ndash2016
Pinki Mondal ID Sylwia Trzaska and Alex de Sherbinin ID
Center for International Earth Science Information Network (CIESIN) the Earth Institute at Columbia UniversityPalisades NY 10964 USA strzaskaciesincolumbiaedu (ST) adesherbininciesincolumbiaedu (AdS) Correspondence pmondalciesincolumbiaedu Tel +1-845-365-8994
Received 12 October 2017 Accepted 19 December 2017 Published 21 December 2017
Abstract This study provides the first assessment of decadal changes in mangrove extents in SierraLeone While significant advances have been made in mangrove mapping using remote sensingno study has documented long-term changes in mangrove extents in Sierra Leonemdashone of themost vulnerable countries in West Africa Such understanding is critical for devising regionalmanagement strategies that can support local livelihoods We utilize multi-date Landsat data andcloud computational techniques to quantify spatiotemporal changes in land cover with focus onmangrove ecosystems for 1990ndash2016 along the coast of Sierra Leone We specifically focus on fourestuariesmdashScarcies Sierra Leone Yawri Bay and Sherbro We relied on the k-means approach foran unsupervised classification and validated the classified map from 2016 using ground truth datacollected from Sentinel-2 and high-resolution images and during field research (accuracy 95) Ourfindings indicate that the Scarcies river estuary witnessed the greatest mangrove loss since 1990(45) while the Sierra Leone river estuary experienced mangrove gain over the last 26 years (22)Overall the Sierra Leone coast lost 25 of its mangroves between 1990 and 2016 with the lowestcoverage in 2000 during the period of civil war (1991ndash2002) However natural mangrove dynamicsas supported by field observations indicate the potential for regeneration and sustainability undercarefully constructed management strategies
Keywords mangrove spatiotemporal change low elevation coastal zone Landsat West Africa
1 Introduction
Mangroves are located in the tropical and sub-tropical countries primarily between 30 N and30 S latitude These coastal forests are distributed in the inter-tidal regions and along river banksand lagoons This ecosystem is comprised of plant families with specialized adaptations to live inthe tidal environment According to an estimate from 2000 mangrove forests accounted for less than1 of total tropical forests in the world [1] Yet these are one of the most productive and biologicallycomplex ecosystems that store three to four times more carbon per equivalent area compared totropical forests [2] Besides mangrove forests provide protection to coastal communities from naturaldisasters especially storm surge and small to moderate tsunamis [34] However due to increasingland competition for agriculture aquaculture tourism and infrastructure development these forestshave declined from 188 million hectares in 1990 to 152 million hectares in 2005 [5]
Official estimates for the year 2000 suggest that Sierra Leone had 105300 hectares of mangrovesor roughly 0007 of the global total [5] In this West African country mangroves are an essentialsource of wood for the coastal communities and provide a number of indirect services such as fishbreeding sites and coastal protection Despite their undeniable benefits mangrove forests are underincreasing pressure due to urbanization and land reclamation on the flood plains conversion to rice
Sensors 2018 18 12 doi103390s18010012 wwwmdpicomjournalsensors
Sensors 2018 18 12 2 of 15
paddies and unsustainable exploitation for fuelwood and fish smoking This fragile ecosystem isalso sensitive to changing environmental conditions such as increased temperature and sea level riseas well as water characteristics such as salinity pollutants and sedimentation [6] The combinationof increasing human-induced and environmental stress may lead to unsustainable conditions formangroves and ultimately their decline A better understanding of the recent changes in mangroveextent and quality human pressures the impact of climate change as well as management practicesand opportunities may help sustaining mangroves and their benefits for future generations Howeverup-to-date good quality in situ data about mangroves are not available in Sierra Leone hinderingassessment of changes and the design of sustainable management plans Remote sensing can be analternative tool in this context given the availability of free satellite data dating from the 1970s atspatial and temporal scales suitable for landscape-level monitoring Taking advantage of these satelliteimages this study aims at assessing landscape-level changes in mangrove extents in Sierra Leoneduring 1990ndash2016
Remote sensing tools and techniques have been widely used in mangrove mapping and haverapidly evolved over the past decade [7ndash9] One of the most widely used satellite sensors for mangrovemapping is Landsat due to its spatial and temporal coverage and ease of accessibility Manystudies have used Landsat images as well as optical imagery from SPOT MODIS ASTER QuickBirdWorldView and IKONOS for quantifying mangrove extents and spatiotemporal changes across theglobe [110ndash40] These studies use a range of classification techniques and machine-learning algorithmssuch as unsupervised supervised hybrid classification and regression tree (CART) support vectormachine (SVM) object-oriented classification among others
The currently available global mangrove estimates are either directly calculated from opticalsatellite data national-level statistics or are derived from other global datasets [1541ndash43] Most ofthese studies provide only a snapshot for mangrove extents because of the massive scale of workinvolved in global mapping efforts Besides it is difficult to directly compare estimates from thesestudies ranging from 12 to 20 million hectares (see [5] for details) due to the differences in methodsinvolved Hamilton and Casey [41] identify that there are notable differences in mangrove estimates asprovided by these global studies and hence developed a new global dataset CGMFC-21 that providesannual mangrove estimates for 2000ndash2012 by compiling other existing datasets [14244] and usingstatistical techniques to predict estimates for 2013ndash2014 However nationalregional estimates shouldbe derived from direct observation (either via satellite or field visits) as these estimates are often usedfor revising nationalregional policies with impacts on local livelihoods
Many studies have reported spatiotemporal changes in mangroves from different parts of theworld especially the Sundarbans in India and Bangladesh and West-Central Africa [12ndash14252631]Past studies have reported widely variable single-date mangrove estimates for Sierra Leone mostlyowing to the different methodologies involved in these studies (Table 1) For the year 2000 alonethe estimates range from 65567 km2 to 291701 km2 [41] Even studies relying solely on Landsatimages report a wide range of estimates [145] likely because different definitions of lsquomangrove forestsrsquowere used in these studies However no study to the best of our knowledge has focused on long-termchanges in Sierra Leone despite the importance of mangroves in providing coastal protection andlivelihood opportunities in this vulnerable nation Moreover as one of the West African countriesselected for the USAID-funded West Africa Biodiversity and Climate Change (WA BiCC) projecta detailed land cover change analysis over the past decades is now required for Sierra Leone in orderto develop coastal conservation and climate resilience building activities
Sensors 2018 18 12 3 of 15
Table 1 Comparison of mangrove extents in Sierra Leone for 2000 as estimated by the Mangrove Forestsof the World (MFW) and the continuous mangrove forest cover for the 21st century (CGMFC-21)
Dataset Source Brief Description Area (km2)
MFW Giri et al 2011 [1] Landsat-derived discreteclassification 156496
- Fatoyinbo and Simard2013 [45]
Landsat-derived discreteclassification 955
- FAO 2007 [5] Country-specific reports based ontheir own classification system 1053
CGMFC-21mdashRevised MFW Hamilton and Casey2016 [41]
Integration of discrete MFW datasetand continuous Global Forest Cover(GFC) dataset
65567
CGMFC-21mdashRevised TerrestrialEcoregions of the World (TEOW)
Hamilton and Casey2016 [41]
Integration of discrete TEOWdataset and continuous GlobalForest Cover (GFC) dataset
291701
In this study we provide the first multi-year assessment (1990 2000 2010 and 2016) of spatialchanges in the mangrove extents in Sierra Leone coastal landscape complex (SLCLC) Since oneof the primary objectives of this study is to inform WA BiCC project for effective and sustainablecoastal management we use variable buffers (1 km 25 km and 5 km from the coastline) to identifypotential lsquodeforestation hotspotsrsquo that might require immediate attention from policy-makers Theother objective is to develop a landscape monitoring method using freely available data that can beeasily deployed for other WA BiCC countries Hence we take advantage of the freely available Landsatimages and recent advancement in the cloud computational techniques We utilize Landsat-5 7 8 andSentinel-2 images along with field data to quantify and interpret changes in mangrove covers in theSLCLC As a requirement of the WA BiCC project we specifically focus on four estuaries (ScarciesRiver Estuary Sierra Leone River Estuary Yawri Bay and Sherbro River Estuary) for addressing thefollowing questions
1 How has the mangrove extent changed in the SLCLC over the past 26 years Is there net mangrovegain or loss
2 Where did mangrove forests undergo the most changesmdashcloser to the coastline or further away3 Are there spatial differences in mangrove changes eg northern SLCLC vs southern SLCLC
2 Materials and Methods
21 Study Area
Sierra Leone covers 72300 km2 land area and hosts approximately 65 million people [46]This West African country has a tropical climate with two pronounced seasons a wet season from Mayto October and a dry season from November to April The average temperature also demonstratesa well-defined seasonal cycle with a maximum around March and a secondary maximum aroundOctoberNovember separated by lower temperatures during the rainy season The specific orientationof the coast in Sierra Leonemdashperpendicular to the moisture-bearing windsmdashcombined with theregional topography (Figure 1) makes the coast spanning Guinea Sierra Leone and Liberia the wettestpart of West Africa and among the wettest regions in the world with rainfall exceeding 4000 mmyearA relatively long rainy season with high rainfall amounts and the topography result in seasonalinfluxes of freshwater via twelve major river basins all draining in the Atlantic Ocean
Sierra Leone has diverse ecosystems including lowland rainforest mountain forestmangrovecoastal ecosystems freshwater swamps and marine ecosystems [47] Once a much forested(70) country Sierra Leone now hosts only 5 of the original intact forest [48] While 75 of theland is arable [47] the most fertile among these ecosystems is the coastal plains including mangroveswamps riverine grasslands inland valley swamps and flood plains of the major rivers Seasonal
Sensors 2018 18 12 4 of 15
wetlands that span from the uplands in the north to the mangroves along the coastline are importanthabitats for migratory water fowl water dependent amphibian and mammal species and serve asgrazing lands for waterbuck and buffalo
The Sierra Leone coastline stretches for about 506 km and the continental shelf extends forabout 27500 km2 This considerable continental shelf combined with the local currents creates asubstantial upwelling that places Sierra Leone within one of the worldrsquos most productive marineecosystems [4950] Fisheries represent the major source of income (~10 of the GDP) and contributesignificantly to poverty reduction and food security in Sierra Leone These fisheries also support asecondary economy of boat building wood cutting transporting fish weaving baskets selling fishinggear and petty trading Around 40000 artisanal fishers and their families operate about 12000 fishingboats leading to employment of 500000 people in the fisheries sector Most of the artisanal fishingactivities occur around the estuaries of three rivers the Scarcies Sierra Leone and Sherbro as wellas around Yawri Bay [51] that are also largely covered with mangroves The five most dominantmangrove species in the region are Avicennia germinans Rhizophora racemosa Rhizophora harrisoniiLaguncularia racemosa and Rhizophora mangle [52]
Sensors 2018 18 12 4 of 15
important habitats for migratory water fowl water dependent amphibian and mammal species and serve as grazing lands for waterbuck and buffalo
Figure 1 Location of the study area showing (a) Regional topography with focus areas in northern Sierra Leone and Southern Sierra Leone defined by rectangles (b) Focus areas in northern Sierra Leone (Scarcies River Estuary and Sierra Leone River Estuary) with multiple buffers extending inland from the estuary boundary (c) Focus areas in southern Sierra Leone (Yawri Bay and Sherbro River Estuary) with multiple buffers extending inland from the estuary boundary (d) Location of Sierra Leone in West Africa
The Sierra Leone coastline stretches for about 506 km and the continental shelf extends for about 27500 km2 This considerable continental shelf combined with the local currents creates a substantial upwelling that places Sierra Leone within one of the worldrsquos most productive marine ecosystems [4950] Fisheries represent the major source of income (~10 of the GDP) and contribute significantly to poverty reduction and food security in Sierra Leone These fisheries also support a secondary economy of boat building wood cutting transporting fish weaving baskets selling fishing gear and petty trading Around 40000 artisanal fishers and their families operate about 12000 fishing boats leading to employment of 500000 people in the fisheries sector Most of the artisanal fishing activities occur around the estuaries of three rivers the Scarcies Sierra Leone and Sherbro as well as around Yawri Bay [51] that are also largely covered with mangroves The five most dominant mangrove species in the region are Avicennia germinans Rhizophora racemosa Rhizophora harrisonii Laguncularia racemosa and Rhizophora mangle [52]
Figure 1 Location of the study area showing (a) Regional topography with focus areas in northernSierra Leone and Southern Sierra Leone defined by rectangles (b) Focus areas in northern Sierra Leone(Scarcies River Estuary and Sierra Leone River Estuary) with multiple buffers extending inland fromthe estuary boundary (c) Focus areas in southern Sierra Leone (Yawri Bay and Sherbro River Estuary)with multiple buffers extending inland from the estuary boundary (d) Location of Sierra Leone inWest Africa
Sensors 2018 18 12 5 of 15
In this study we specifically focus on multiple buffers extending inland from fourestuariesmdashScarcies river estuary Sierra Leone river estuary (SLRE) Yawri Bay and Sherbro riverestuary (Figure 1) because of their varying ecology mangrove usage and WA BiCC focus In SierraLeone people are heavily dependent on fuelwood for domestic energy mostly for cooking Mangrovewood is additionally used for fish processing building construction poles and household furnitureWhile both Scarcies and SLRE have all five dominant mangrove species Yawri Bay and Sherbro haveonly three of them The Rhizophora species has been heavily harvested for fuelwood for fish smokingwhereas the Avicennia species is primarily harvested for fuelwood for salt processing and experiencesless exploitation [51]
22 Satellite Data
In order to quantify the spatial extent of the mangroves in selected areas and its temporal changesover several decades a suite of Landsat images were analyzed and compared for the years 19902000 2010 and 2016 (Table 2) A total of nine Landsat scenes are required to cover the entire country(Figure 2) although more scenes were considered for each year in order to minimize missing datadue to frequent cloud cover (Table 2) For the most recent year (ie 2016) Landsat 8 OLI imageswere used on Google Earth Engine (GEE) a cloud computing platform Landsat 5 images were usedfor 2010 and 1990 whereas Landsat 7 images were used for 2000 (Table 2)mdashall available on the GEEplatform A closer look at the image availability revealed that only winterdry seasons have imagesavailable across the years Since the years considered in this study have varied cloud coverage a longertime-frame (with two dry seasons) was required for 2000 and 1990 to minimize missing data (egsee [1]) All remote sensing analyses were performed on the GEE platform and classified imagecovering only the study region were downloaded for further analyses
Table 2 Details of the satellite images used in the study
Sensor Study Period Image Dates No of Total Images
Landsat 8 2016 December 2015ndashMay 2016 99Landsat 5 2010 November 2009ndashMay 2010 46Landsat 7 2000 November 1999ndashDecember 2000 120Landsat 5 1990 November 1989ndashDecember 1990 34
Sensors 2018 18 12 5 of 15
In this study we specifically focus on multiple buffers extending inland from four estuariesmdashScarcies river estuary Sierra Leone river estuary (SLRE) Yawri Bay and Sherbro river estuary (Figure 1) because of their varying ecology mangrove usage and WA BiCC focus In Sierra Leone people are heavily dependent on fuelwood for domestic energy mostly for cooking Mangrove wood is additionally used for fish processing building construction poles and household furniture While both Scarcies and SLRE have all five dominant mangrove species Yawri Bay and Sherbro have only three of them The Rhizophora species has been heavily harvested for fuelwood for fish smoking whereas the Avicennia species is primarily harvested for fuelwood for salt processing and experiences less exploitation [51]
22 Satellite Data
In order to quantify the spatial extent of the mangroves in selected areas and its temporal changes over several decades a suite of Landsat images were analyzed and compared for the years 1990 2000 2010 and 2016 (Table 2) A total of nine Landsat scenes are required to cover the entire country (Figure 2) although more scenes were considered for each year in order to minimize missing data due to frequent cloud cover (Table 2) For the most recent year (ie 2016) Landsat 8 OLI images were used on Google Earth Engine (GEE) a cloud computing platform Landsat 5 images were used for 2010 and 1990 whereas Landsat 7 images were used for 2000 (Table 2)mdashall available on the GEE platform A closer look at the image availability revealed that only winterdry seasons have images available across the years Since the years considered in this study have varied cloud coverage a longer time-frame (with two dry seasons) was required for 2000 and 1990 to minimize missing data (eg see [1]) All remote sensing analyses were performed on the GEE platform and classified image covering only the study region were downloaded for further analyses
Table 2 Details of the satellite images used in the study
Sensor Study Period Image Dates No of Total Images Landsat 8 2016 December 2015ndashMay 2016 99 Landsat 5 2010 November 2009ndashMay 2010 46 Landsat 7 2000 November 1999ndashDecember 2000 120 Landsat 5 1990 November 1989ndashDecember 1990 34
Figure 2 Maps from Google Earth Engine (GEE) showing (a) Landsat footprints covering Sierra Leone and (b) location of validation points used for accuracy assessment for the 2016 classified map
The images available on GEE provide calibrated orthorectified top-of-atmosphere reflectance values for each band (spatial resolution 30 m for visible and infrared bands) Calibration coefficients
Figure 2 Maps from Google Earth Engine (GEE) showing (a) Landsat footprints covering Sierra Leoneand (b) location of validation points used for accuracy assessment for the 2016 classified map
Sensors 2018 18 12 6 of 15
The images available on GEE provide calibrated orthorectified top-of-atmosphere reflectancevalues for each band (spatial resolution 30 m for visible and infrared bands) Calibration coefficientsare either extracted from the image metadata or derived from [53] Both Landsat 5 and Landsat 7images include a quality mask band identifying pixels as clear (0) water (1) shadow (2) snow (3)or cloud (4) [54ndash56] Pixels with mask values for shadow snow or cloud in this cloud mask band wereexcluded At the time of this analysis Landsat 8 images were not available with a cloud mask bandon the GEE platform hence a cloud mask function was used to identify pixels with less than 25cloud cover Finally an image composite was created for each year using all visible and infrared bandsFor further data reduction the ldquomedianrdquo function on GEE was used that calculates the median valueof all unmasked pixels in the input imagery for each pixel location in the output image for each bandHence each of these median images is devoid of noise as reflected in extremely high or low valuesfor each band The median image was then clipped for the low elevation coastal zone (LECZ) withelevation lt=40 m a criteria widely used to define the LECZ (eg see [45])
23 Land Cover Classification
We identified four dominant land covers in the study area using Sentinel-2 and high-resolutionimages available on the GEE platformmdash(1) waterwetland (2) mangrove (3) other vegetation and (4)builtbare soil In the interest of a consistent definition that can be applied across WA BiCC countrieswe broadly define lsquomangroversquo as the forest cover type that (i) has a distinct spectral signature comparedto other vegetation (Figure 3) and (ii) is located within the LECZ
Sensors 2018 18 12 6 of 15
are either extracted from the image metadata or derived from [53] Both Landsat 5 and Landsat 7 images include a quality mask band identifying pixels as clear (0) water (1) shadow (2) snow (3) or cloud (4) [54ndash56] Pixels with mask values for shadow snow or cloud in this cloud mask band were excluded At the time of this analysis Landsat 8 images were not available with a cloud mask band on the GEE platform hence a cloud mask function was used to identify pixels with less than 25 cloud cover Finally an image composite was created for each year using all visible and infrared bands For further data reduction the ldquomedianrdquo function on GEE was used that calculates the median value of all unmasked pixels in the input imagery for each pixel location in the output image for each band Hence each of these median images is devoid of noise as reflected in extremely high or low values for each band The median image was then clipped for the low elevation coastal zone (LECZ) with elevation lt=40 m a criteria widely used to define the LECZ (eg see [45])
23 Land Cover Classification
We identified four dominant land covers in the study area using Sentinel-2 and high-resolution images available on the GEE platformmdash(1) waterwetland (2) mangrove (3) other vegetation and (4) builtbare soil In the interest of a consistent definition that can be applied across WA BiCC countries we broadly define lsquomangroversquo as the forest cover type that (i) has a distinct spectral signature compared to other vegetation (Figure 3) and (ii) is located within the LECZ
Figure 3 Description of the land cover classes their appearances on Landsat and high-resolution images and spectral reflectance curves for representative pixels from each class
We then used the GEE lsquoclustererrsquo package to classify the clipped composite images for each year The package offers different clustering algorithms including k-means x-means cobweb and Learning Vector Quantization that can classify an image with no a priori knowledge We used a k-means approach [57] to perform an unsupervised classification as several past studies have
Figure 3 Description of the land cover classes their appearances on Landsat and high-resolutionimages and spectral reflectance curves for representative pixels from each class
Sensors 2018 18 12 7 of 15
We then used the GEE lsquoclustererrsquo package to classify the clipped composite images for each yearThe package offers different clustering algorithms including k-means x-means cobweb and LearningVector Quantization that can classify an image with no a priori knowledge We used a k-meansapproach [57] to perform an unsupervised classification as several past studies have successfullyutilized unsupervised classification approach for mangrove mapping [14192425313945] On GEE50 clusters were first identified in each of the four composite images corresponding to the fourtime-steps based on the reflectance values from all bands Then the clusters were sorted based onthe mean values for the near-infrared band (band 5 for Landsat 8band 4 for Landsat 5 and 7)as that band provides the maximum separability across land cover classes (Figure 3) This automatedunsupervised classification technique on the cloud computing platform is ideal for similar studiesin other developing countries where resources for advanced methods and detailed field data areoften unavailable The sorted clusters were then labeled one of the four land cover classes by visualinspection of the high-resolution images (Figure 3) All analyses were carried out on the GEE platformexcept class labeling that was done on ArcGIS 1041
Following the image classification areas under each land cover were quantified using GIS tools forthe four focus areas (Figure 1) We used a GIS shape file for the estuaries and created three buffers fromthese estuary boundaries that extend 1 km 25 km and 5 km inland Buffer zones are not mutuallyexclusive ie the 5 km buffer encompasses the 1 km and 25 km zones In these buffers we quantifiedthe land cover extents (in absolute numbers and percentages) for each focus area by time slice (19902000 2010 and 2016) as well as change in land cover between time slices
3 Results
31 Accuracy Assessment
A total of 300 validation points following a stratified random sampling strategy by area (150 formangrove and 50 for each of the other three land cover class stratum randomly distributed across thefour focus areas) were collected using Sentinel-2 and other high-resolution images from winterspringof 2016 on the GEE platform to perform an accuracy assessment for the 2016 classified image Field dataon mangrove locations collected during summer 2016 provided information regarding the appearanceof mangroves on high-resolution images and thus facilitated validation point collection on the GEEplatform The validation points were used to extract land cover classes from the 2016 classified map inArcGIS Then a confusion matrix was created with the observed and predictedclassified land coverclasses The overall accuracy (ie correct predictionstotal predictions) of the 2016 classification is 95(Table 3) The kappa statistic (κ) for the classified map is 093 While we did not directly validate landcover maps from the older dates due to lack of validation data we used other available estimates tocompare the mangrove extents
Table 3 Accuracy assessment for the 2016 classified map The overall accuracy is shown in bold
Ground Truth
Classified WaterWetland Mangrove Other Vegetation BareBuilt Userrsquos Accuracy
Waterwetland 46 1 0 0 98Mangrove 4 143 0 3 95
Other vegetation 0 6 50 1 88Barebuilt 0 0 0 46 100
Producerrsquos accuracy 92 95 100 92 95
32 Estimated Mangrove Extents in 2016
Figure 4 shows the spatial distributions of different land covers in the SLCLC In the SLRE andSherbro regions the area covered by mangroves increases twofold between 1 km and 5 km bufferwhereas the Scarcies and Yawri bay regions have 5- or 7-times more mangroves when areas further
Sensors 2018 18 12 8 of 15
away from the coastline are considered (Table 4) The Sherbro region has the largest area covered withmangroves among the four focus areas while mangrove cover has the smallest absolute extent in theScarcies region (except within 1 km buffer) Further investigation of the spatial distribution of themangroves shows that in SLRE and Sherbro regions considerable portions of the coastline is coveredwith mangroves (Figure 4bc) whereas in Yawri Bay mangroves are concentrated along the main rivers(Figure 4c)
Sensors 2018 18 12 8 of 15
covered with mangroves (Figure 4bc) whereas in Yawri Bay mangroves are concentrated along the main rivers (Figure 4c)
Figure 4 (a) Spatial distribution of the four land cover classes across the Sierra Leone coastal landscape complex for 2016 Panels show mangrove extents in (b) northern Sierra Leone (Scarcies River Estuary and Sierra Leone River Estuary) and (c) southern Sierra Leone (Yawri Bay and Sherbro River Estuary)
Table 4 Estimated mangrove cover in 2016 within different buffers for the four focus areas in Sierra Leone
Region 1 km Buffer 25 km Buffer 5 km Buffer
Mangrove
Area (sq km)
Relative Mangrove
Extent
Mangrove Area
(sq km)
Relative Mangrove
Extent
Mangrove Area
(sq km)
Relative Mangrove
Extent Scarcies River
Estuary 1735 36 4238 36 9039 37
Sierra Leone River Estuary
16071 48 24901 36 29055 26
Yawri Bay 1543 51 5505 51 11398 45 Sherbro River
Estuary 35578 68 60554 56 76299 44
33 Land Cover Changes within the Focus Areas
Figure 5 further summarizes the spatiotemporal changes of the different land cover classes between different time slices In the Scarcies region mangroves remained the most dominant land cover (Figure 5) However the Scarcies witnessed fluctuations in mangrove extents with more mangroves during 1990 (66 within 1 km 65 within 25 km 59 within 5 km) and 2010 (56 within 1 km 57 within 25 km 58 within 5 km) Mangrove extents declined in this region during 2000 (43 within 1 km 38 within 25 km 34 within 5 km) and 2016 (36 both within 1 km and 25 km 37 within 5 km) mostly owing to an increase in waterwetland (Figure 5) Built areabare
Figure 4 (a) Spatial distribution of the four land cover classes across the Sierra Leone coastal landscapecomplex for 2016 Panels show mangrove extents in (b) northern Sierra Leone (Scarcies River Estuaryand Sierra Leone River Estuary) and (c) southern Sierra Leone (Yawri Bay and Sherbro River Estuary)
Table 4 Estimated mangrove cover in 2016 within different buffers for the four focus areas inSierra Leone
Region 1 km Buffer 25 km Buffer 5 km Buffer
MangroveArea
(sq km)
RelativeMangrove
Extent
MangroveArea
(sq km)
RelativeMangrove
Extent
MangroveArea
(sq km)
RelativeMangrove
Extent
Scarcies RiverEstuary 1735 36 4238 36 9039 37
Sierra Leone RiverEstuary 16071 48 24901 36 29055 26
Yawri Bay 1543 51 5505 51 11398 45
Sherbro RiverEstuary 35578 68 60554 56 76299 44
Sensors 2018 18 12 9 of 15
33 Land Cover Changes within the Focus Areas
Figure 5 further summarizes the spatiotemporal changes of the different land cover classesbetween different time slices In the Scarcies region mangroves remained the most dominant land cover(Figure 5) However the Scarcies witnessed fluctuations in mangrove extents with more mangrovesduring 1990 (66 within 1 km 65 within 25 km 59 within 5 km) and 2010 (56 within 1 km57 within 25 km 58 within 5 km) Mangrove extents declined in this region during 2000 (43within 1 km 38 within 25 km 34 within 5 km) and 2016 (36 both within 1 km and 25 km 37within 5 km) mostly owing to an increase in waterwetland (Figure 5) Built areabare soil more thandoubled during post-2000 years increasing from 8 to 18 both within 1 km and 25 km and from 6to 14 within 5 km
Sensors 2018 18 12 9 of 15
soil more than doubled during post-2000 years increasing from 8 to 18 both within 1 km and 25 km and from 6 to 14 within 5 km
Figure 5 Relative extents of different land covers within the four focus areas during 1990ndash2016 Panels show mangrove extents within buffers of (a) 1 km (b) 25 km (c) 5 km extending inland from the coastline
In the SLRE region other vegetation (eg forest plantation farmland etc) has been the most dominant land cover over the past 26 years except for the 1 km buffer zone where mangrove was the most dominant land cover in the years of 1990 2010 and 2016 (Figure 5) Other vegetation coverage ranged between (i) 27 in 1990 and 49 in 2000 within the 1 km buffer (ii) 39 in 1990 and 60 in 2000 within 25 km buffer and (iii) 51 in 1990 and 69 in 2000 within 5 km buffer Waterwetland coverage ranged between 5 and 21 across years and buffer zones with more coverage closer to the coastline Built area or bare soil ranged between 4 and 14 across space and time with minimum coverage in 2000 and maximum coverage in 2010
In the Yawri Bay region mangroves covered the most area across the years and buffer zones except for in 2000 with (i) both wetlandswater and other vegetation covering more area than the mangroves within 1 km buffer and (ii) other vegetation covering more area in 5 km buffer (Figure 5) Waterwetland has declined over time (eg 14 in 1990 to 2 in 2016 within 1 km) within all three buffer zones with an increase during 2000 Built areabare soil increased over time (19 to 27 within 1 km 14 to 22 within 25 km and 11 to 18 within 5 km) with a decline in between for all three buffer zones
As with the Scarcies region mangroves remained the dominant land cover in the Sherbro region with an estimated area covering 68 within 1 km 56 within 25 km and 44 within 5 km buffer zones in 2016 (Table 4) The only exception is within 5 km buffer zone in 2000 (Figure 5) when other vegetation covered more area (46) than mangroves (37) The other two land covers remained relatively stable throughout the years and covered less area (~10) compared to mangroves and other vegetation The findings from the field visits during summer 2016 showed that
Figure 5 Relative extents of different land covers within the four focus areas during 1990ndash2016Panels show mangrove extents within buffers of (a) 1 km (b) 25 km (c) 5 km extending inland fromthe coastline
In the SLRE region other vegetation (eg forest plantation farmland etc) has been the mostdominant land cover over the past 26 years except for the 1 km buffer zone where mangrove was themost dominant land cover in the years of 1990 2010 and 2016 (Figure 5) Other vegetation coverageranged between (i) 27 in 1990 and 49 in 2000 within the 1 km buffer (ii) 39 in 1990 and 60 in2000 within 25 km buffer and (iii) 51 in 1990 and 69 in 2000 within 5 km buffer Waterwetlandcoverage ranged between 5 and 21 across years and buffer zones with more coverage closer to thecoastline Built area or bare soil ranged between 4 and 14 across space and time with minimumcoverage in 2000 and maximum coverage in 2010
In the Yawri Bay region mangroves covered the most area across the years and buffer zonesexcept for in 2000 with (i) both wetlandswater and other vegetation covering more area than themangroves within 1 km buffer and (ii) other vegetation covering more area in 5 km buffer (Figure 5)Waterwetland has declined over time (eg 14 in 1990 to 2 in 2016 within 1 km) within all three
Sensors 2018 18 12 10 of 15
buffer zones with an increase during 2000 Built areabare soil increased over time (19 to 27 within1 km 14 to 22 within 25 km and 11 to 18 within 5 km) with a decline in between for all threebuffer zones
As with the Scarcies region mangroves remained the dominant land cover in the Sherbro regionwith an estimated area covering 68 within 1 km 56 within 25 km and 44 within 5 km bufferzones in 2016 (Table 4) The only exception is within 5 km buffer zone in 2000 (Figure 5) when othervegetation covered more area (46) than mangroves (37) The other two land covers remainedrelatively stable throughout the years and covered less area (~10) compared to mangroves and othervegetation The findings from the field visits during summer 2016 showed that the Sherbro area iscovered with largest and oldest trees indicating less degradation over past decades than in other areasand explaining a relative stability of the mangrove cover over time
34 Spatiotemporal Changes in Mangrove Extents over the Last Three Decades
Table 5 shows the overall change in mangrove cover between 1990 and 2016 in each focus areafor different buffers The largest decline is observed in the Scarcies for all buffers up to 46 in the1 km buffer The SLRE has experienced an increase of about 22 in the 1 km buffer The Sherbro andYawri Bay regions experienced slight expansion (lt10) of the mangroves when the narrowest bufferclosest to the sea shore is considered These two regions witnessed modest decline (lt20) when largerbuffers are considered This comparison however does not capture the full history of fluctuations
Table 5 Summary of mangrove extents (area in sq km) during 1990 and 2016 for the four focus areasin the Sierra Leone coastal landscape complex Values in bold denote mangrove gain while values inred italic denote mangrove loss during 1990ndash2016 The lsquoSierra Leone coastal landscape complexrsquo refersto all the mangroves along the full length of the coast not only in the buffers in the four areas
Region 1 km Buffer 25 km Buffer 5 km Buffer
1990 2016Change(RelativeChange)
1990 2016Change(RelativeChange)
1990 2016Change(RelativeChange)
Scarcies RiverEstuary 3195 1735 minus1460
(minus46) 7343 4238 minus3105(minus42) 14258 9039 minus5219
(minus37)
Sierra LeoneRiver Estuary 13187 16071 2884
(22) 21302 24901 3599(17) 26169 29055 2886
(11)
Yawri Bay 1434 1543 109(8) 6011 5505 minus506
(minus8) 13830 11398 minus2432(minus18)
Sherbro RiverEstuary 33682 35578 1896
(6) 59148 60554 1406(2) 76826 76299 minus527
(minus1)
1990 2016 Overall change(Relative change)
Sierra Leonecoastal
landscapecomplex
243482 183432 minus6005 (minus25)
As shown in Figure 5 mangrovesrsquo relative extent is the lowest in 2000 in each region and eachbuffer which is also the year where the other types of vegetation and waterwetland combined coverthe largest area Subsequently in 2010 the relative mangrove extent increases back to the extents from1990 in nearly all cases with the exception of Yawri Bay Then it remains stable in Sherbro and YawriBay while it continues to increase in SLRE In the Scarcies on the other hand it decreases again in2016 to the extent similar to that in 2000
Figure 6 further highlights decadal changes in mangrove extents in the SLCLC The largest lossof mangroves in the Scarcies region is observed between 1990 and 2000 and is mostly located in thesouth-eastern part of the Scarcies region and along the Greater Scarcies River (Figure 6a) while the
Sensors 2018 18 12 11 of 15
loss between 2010 and 2016 mostly happened in the northern part of the region (Figure 6c) In otherparts of the SLCLC signs of non-clustered deforestation are present in pre- and post-2000 years withthe exception of Southern Yawri Bay In general the Scarcies and Yawri Bay seem to undergo largestmangrove fluctuations between years
Sensors 2018 18 12 11 of 15
Figure 6 Decadal changes in mangrove extents in the Sierra Leone coastal landscape complex (SLCLC) during (a) 1990ndash2000 (b) 2000ndash2010 (c) 2010ndash2016
4 Discussion and Conclusions
This study based on a discrete classification of Landsat pixels provides an estimate of 152642 km2 mangrove extent for 2000 that is similar to the estimates provided by [1] While a continuous classification approach can as argued by [41] provide more accurate estimates it is almost impossible to apply for historical land cover analyses in the absence of existing maps with known accuracy or extensive field data from earlier years Therefore it could not be applied in our study aimed at estimating the evolution of the mangrove extents in Sierra Leone Our study relies solely on dominant spectral signature within a single pixel (30 m times 30 m) for a discrete classification ie presenceabsence of a certain class While it is possible that our study overestimates mangrove coverage in the SLCLC because of the way discrete classification works our approach allows us to provide important insights into decadal changes in spatial patterns in mangrove forests Besides our findings agree with those from the past studies that showed an increase in mangrove extents after 2000 [541]
As shown in Figures 5 and 6b all four focus areas witnessed an increase in mangrove extents in all three buffer zones between 2000 and 2010 However only SLRE witnessed an increase in mangrove area post-2010 most probably as a result of reforestation efforts Considering the overall changes during 1990ndash2016 mangroves have declined only in the farthest buffer in the Sherbro and Yawri Bay regions pointing to the possible reclaiming of the land and expansion of agriculture by the communities living inland The Scarcies region underwent the most extensive mangrove loss among all the areas (Table 5) but in different locations for pre-2000 and post-2010 time periods (Figure 6) In both cases the most probable cause is the conversion of mangroves to rice paddies However the rapid recovery of the mangroves over a period of 10 years between 2000 and 2010 in some areas is more indicative of degradation or lsquothinning outrsquo during the periods prior to 2000 rather than a complete deforestation While causality is difficult to attribute the decade of the 1990s was also a period of civil war which may have heightened dependence on mangrove forests for fuel wood charcoal production and construction andor weakened conservation and protection measures These findings especially the overall patterns in change can particularly benefit regional andor national policy-makers in drafting coastal conservation policies
It is important to note that it is challenging to distinguish between wetlands and sparse mangrove forests because of the inherent limitations of optical remote sensing in terms of the spectral and spatial resolution especially in tropical countries with frequent cloud cover Hence it is possible that a pixel with sparse mangrove cover will record a spectral signature of the underlying water that is dominant within that pixel and thus be classified as waterwetland A validation check with high-resolution images from 2016 indeed confirms that the area along and surrounding the Scarcies river hosts young and sparsely distributed mangroves rather than a complete clear-cut of
Figure 6 Decadal changes in mangrove extents in the Sierra Leone coastal landscape complex (SLCLC)during (a) 1990ndash2000 (b) 2000ndash2010 (c) 2010ndash2016
4 Discussion and Conclusions
This study based on a discrete classification of Landsat pixels provides an estimate of 152642 km2
mangrove extent for 2000 that is similar to the estimates provided by [1] While a continuousclassification approach can as argued by [41] provide more accurate estimates it is almost impossibleto apply for historical land cover analyses in the absence of existing maps with known accuracyor extensive field data from earlier years Therefore it could not be applied in our study aimed atestimating the evolution of the mangrove extents in Sierra Leone Our study relies solely on dominantspectral signature within a single pixel (30 m times 30 m) for a discrete classification ie presenceabsenceof a certain class While it is possible that our study overestimates mangrove coverage in the SLCLCbecause of the way discrete classification works our approach allows us to provide important insightsinto decadal changes in spatial patterns in mangrove forests Besides our findings agree with thosefrom the past studies that showed an increase in mangrove extents after 2000 [541]
As shown in Figures 5 and 6b all four focus areas witnessed an increase in mangrove extents inall three buffer zones between 2000 and 2010 However only SLRE witnessed an increase in mangrovearea post-2010 most probably as a result of reforestation efforts Considering the overall changesduring 1990ndash2016 mangroves have declined only in the farthest buffer in the Sherbro and YawriBay regions pointing to the possible reclaiming of the land and expansion of agriculture by thecommunities living inland The Scarcies region underwent the most extensive mangrove loss amongall the areas (Table 5) but in different locations for pre-2000 and post-2010 time periods (Figure 6)In both cases the most probable cause is the conversion of mangroves to rice paddies However therapid recovery of the mangroves over a period of 10 years between 2000 and 2010 in some areas is moreindicative of degradation or lsquothinning outrsquo during the periods prior to 2000 rather than a completedeforestation While causality is difficult to attribute the decade of the 1990s was also a period of civilwar which may have heightened dependence on mangrove forests for fuel wood charcoal productionand construction andor weakened conservation and protection measures These findings especiallythe overall patterns in change can particularly benefit regional andor national policy-makers indrafting coastal conservation policies
Sensors 2018 18 12 12 of 15
It is important to note that it is challenging to distinguish between wetlands and sparse mangroveforests because of the inherent limitations of optical remote sensing in terms of the spectral and spatialresolution especially in tropical countries with frequent cloud cover Hence it is possible that a pixelwith sparse mangrove cover will record a spectral signature of the underlying water that is dominantwithin that pixel and thus be classified as waterwetland A validation check with high-resolutionimages from 2016 indeed confirms that the area along and surrounding the Scarcies river hosts youngand sparsely distributed mangroves rather than a complete clear-cut of dense mangrove forests Eventhough high-resolution satellite images do not exist for earlier years for validation purposes it ispossible that mangrove forests in the Scarcies region witnessed degradation or lsquothinning outrsquo during1990ndash2000 rather than a complete deforestation Thus the fluctuations in mangrove extents as shownin Figure 6 possibly represent alternate thinning and reforestation This is consistent with the highregeneration potential observed on field visits to the Scarcies region
To be useful at large scale satellite-based assessment of mangrove cover needs to be complementedby in-situ evaluation of the quality of the forests The field trips during summer 2016 indicate thatdespite degradation the remaining mangroves in the Scarcies region show higher species diversity(relative to other regions in Sierra Leone) and high regeneration level thus indicating human pressureon the forests but also high regeneration potential should human pressures be lowered or bettermanaged This is further supported by the fluctuations in mangrove forest cover from dense to sparseto dense estimated in this study The Sherbro area is on the opposite side of the spectrum with lowestspecies diversity highly dominated by Rhizophora racemosa These mangroves are also the oldest amongthe four areas and have the lowest regeneration rates with little disturbance in the forests Theseforests while with high commercial potential exhibit low adaptation potential to future potentiallyaltered climatic conditions The SLRE has the smallest trees with the lowest basal area pointing toyoungest forests sign of past and current exploitation of the forest as well as recent reforestation effortsThe Yawri Bay has fewer adult trees but the highest number of seedlings both showing signs of goodpotential for regeneration and sustainability
Overall despite a noticeable overall long term decrease of the mangrove cover in Sierra Leonea closer look at mangrove evolution shows a good potential for conservation if properly monitoredand managed Conserving the fluctuating mangroves in the SLCLC would require a carefullydesigned management plan involving current and alternative livelihood strategies sustainable resourcemanagement schemes at local and national levels and sensitization of the populations about mangroveservices and their value under climate change beyond responding to communitiesrsquo immediate needsAmong the coastal populations fishing communities are the ones that will be the most affected bythe decline in mangroves yet are also the ones who currently rely on mangroves the most for theirlivelihoods These populations exhibit low livelihood diversification mostly revolving around fishingand fish processing with some contribution from agriculture and petty trade [52] The SLRE hasslightly higher diversification of livelihood strategies largely due to the proximity of Freetown andslightly higher grounds In the Scarcies and Sherbro regions alternative or supplementary livelihoodopportunities are quasi non-existent In most of the communities visited during field trips mangrovesare also open-access and individuals can access ownership by lsquoadding valuersquo to the land which inmost cases translates into clearing the mangroves for rice cultivation Existing community-basedmanagement initiatives seem to be mostly geared towards short term economic benefits from landscovered by mangroves rather than driven by holistic long term plans that include a wide range ofservices provided to a wide range of populations that would insure sustainability of the resource andfishing livelihoods While projects aimed at mangrove conservation could benefit from the existingmanagement structures significant change to the management goals would be required
Acknowledgments This work is made possible by the generous support of the American People through theUnited States Agency for International Development (USAID) The contents of this work are the sole responsibilityof its authors and do not necessarily reflect the views of USAID or the United States Government We acknowledgethe contributions of Zebedee Njisuh Aiah Lebbie Samuel Weekes George Ganda Michael Balinga Paola
Sensors 2018 18 12 13 of 15
Kim-Blanco Valentina Mara Emilie Schnarr Malanding Jaiteh and the field research team We thank theanonymous reviewers for their constructive feedback
Author Contributions PM and AdS conceived and designed the study ST designed and conducted field-workPM analyzed the data PM and ST wrote the paper
Conflicts of Interest The authors declare no conflict of interest
References
1 Giri C Ochieng E Tieszen LL Zhu Z Singh A Loveland T Masek J Duke N Status and distributionof mangrove forests of the world using earth observation satellite data Glob Ecol Biogeogr 2011 20 154ndash159[CrossRef]
2 Murdiyarso D Purbopuspito J Kauffman JB Warren MW Sasmito SD Donato DC Manuri SKrisnawati H Taberima S Kurnianto S The potential of Indonesian mangrove forests for global climatechange mitigation Nat Clim Chang 2015 5 1089ndash1092 [CrossRef]
3 Danielsen F Soslashrensen MK Olwig MF Selvam V Parish F Burgess ND Hiraishi TKarunagaran VM Rasmussen MS Hansen LB The Asian tsunami A protective role for coastalvegetation Science 2005 310 643 [CrossRef] [PubMed]
4 Kathiresan K Rajendran N Coastal mangrove forests mitigated tsunami Estuar Coast Shelf Sci 2005 65601ndash606 [CrossRef]
5 FAO The Worldrsquos Mangroves 1980ndash2005 FAO Rome Italy 20076 Ellison JC Climate Change Vulnerability Assessment and Adaptation Planning for Mangrove Systems World
Wildlife Fund (WWF) Washington DC USA 20127 Blasco F Gauquelin T Rasolofoharinoro M Denis J Aizpuru M Caldairou V Recent advances in
mangrove studies using remote sensing data Mar Freshw Res 1998 49 287ndash296 [CrossRef]8 Giri C Observation and Monitoring of Mangrove Forests Using Remote Sensing Opportunities and
Challenges Remote Sens 2016 8 783 [CrossRef]9 Heumann BW Satellite remote sensing of mangrove forests Recent advances and future opportunities
Prog Phys Geogr 2011 35 87ndash108 [CrossRef]10 Almahasheer H Aljowair A Duarte CM Irigoien X Decadal stability of Red Sea mangroves Estuar
Coast Shelf Sci 2016 169 164ndash172 [CrossRef]11 Dan TT Chen CF Chiang SH Ogawa S Mapping and change analysis in mangrove forest by using
Landsat imagery In Xxiii Isprs Congress Commission Viii Halounova L Safar V Raju PLN Planka LZdimal V Kumar TS Faruque FS Kerr Y Ramasamy SM Comiso J et al Eds CopernicusGesellschaft MBH Gottingen Germany 2016 Volume 3 pp 109ndash116
12 Dutta D Das PK Paul S Sharma JR Dadhwal VK Assessment of ecological disturbance in themangrove forest of Sundarbans caused by cyclones using MODIS time-series data (2001ndash2011) Nat Hazards2015 79 775ndash790 [CrossRef]
13 Dutta D Das PK Paul S Sharma JR Dhadwal VK Spatio-temporal assessment of ecologicaldisturbance and its intensity in the mangrove forest using MODIS derived disturbance index In ISPRSTechnical Commission Viii Symposium Dadhwal VK Diwakar PG Seshasai MVR Raju PLN Hakeem AEds Copernicus Gesellschaft MBH Gottingen Germany 2014 Volume XL-8 pp 555ndash559
14 Fatoyinbo TE Simard M Washington-Allen RA Shugart HH Landscape-scale extent heightbiomass and carbon estimation of Mozambiquersquos mangrove forests with Landsat ETM+ and Shuttle RadarTopography Mission elevation data J Geophys Res Biogeosci 2008 113 [CrossRef]
15 Fromard F Vega C Proisy C Half a century of dynamic coastal change affecting mangrove shorelines ofFrench Guiana A case study based on remote sensing data analyses and field surveys Mar Geol 2004 208265ndash280 [CrossRef]
16 Ghosh MK Kumar L Roy C Mapping Long-Term Changes in Mangrove Species Composition andDistribution in the Sundarbans Forests 2016 7 305 [CrossRef]
17 Giri C Long J Abbas S Murali RM Qamer FM Pengra B Thau D Distribution and dynamics ofmangrove forests of South Asia J Environ Manag 2015 148 101ndash111 [CrossRef] [PubMed]
18 Giri C Muhlhausen J Mangrove forest distributions and dynamics in Madagascar (1975ndash2005) Sensors2008 8 2104ndash2117 [CrossRef] [PubMed]
Sensors 2018 18 12 14 of 15
19 Hamilton S Assessing the role of commercial aquaculture in displacing mangrove forest Bull Mar Sci2013 89 585ndash601 [CrossRef]
20 Hirata Y Tabuchi R Patanaponpaiboon P Poungparn S Yoneda R Fujioka Y Estimation ofaboveground biomass in mangrove forests using high-resolution satellite data J For Res 2014 19 34ndash41[CrossRef]
21 Kamal M Phinn S Johansen K Object-Based Approach for Multi-Scale Mangrove Composition MappingUsing Multi-Resolution Image Datasets Remote Sens 2015 7 4753ndash4783 [CrossRef]
22 Kamthonkiat D Rodfai C Saiwanrungkul A Koshimura S Matsuoka M Geoinformatics in mangrovemonitoring Damage and recovery after the 2004 Indian Ocean tsunami in Phang Nga Thailand Nat HazardsEarth Syst Sci 2011 11 1851ndash1862 [CrossRef]
23 Kanniah KD Sheikhi A Cracknell AP Goh HC Tan KP Ho CS Rasli FN Satellite Images forMonitoring Mangrove Cover Changes in a Fast Growing Economic Region in Southern Peninsular MalaysiaRemote Sens 2015 7 14360ndash14385 [CrossRef]
24 Kirui KB Kairo JG Bosire J Viergever KM Rudra S Huxham M Briers RA Mapping of mangroveforest land cover change along the Kenya coastline using Landsat imagery Ocean Coast Manag 2013 8319ndash24 [CrossRef]
25 Kovacs JM de Santiago FF Bastien J Lafrance P An Assessment of Mangroves in Guinea West AfricaUsing a Field and Remote Sensing Based Approach Wetlands 2010 30 773ndash782 [CrossRef]
26 Kuenzer C van Beijma S Gessner U Dech S Land surface dynamics and environmental challenges ofthe Niger Delta Africa Remote sensing-based analyses spanning three decades (1986ndash2013) Appl Geogr2014 53 354ndash368 [CrossRef]
27 Leimgruber P Kelly DS Steininger MK Brunner J Muller T Songer M Forest cover change patternsin Myanmar (Burma) 1990ndash2000 Environ Conserv 2005 32 356ndash364 [CrossRef]
28 LeMarie M van der Zaag P Menting G Bacluete E Schotanus D The use of remote sensing formonitoring environmental indicators The case of the Incomati estuary Mozambique Phys Chem Earth2006 31 857ndash863 [CrossRef]
29 Liu K Liu L Liu HX Li X Wang SG Exploring the effects of biophysical parameters on the spatialpattern of rare cold damage to mangrove forests Remote Sens Environ 2014 150 20ndash33 [CrossRef]
30 Macamo CCF Massuanganhe E Nicolau DK Bandeira SO Adams JB Mangroversquos response tocyclone Eline (2000) What is happening 14 years later Aquat Bot 2016 134 10ndash17 [CrossRef]
31 Manna S Mondal PP Mukhopadhyay A Akhand A Hazra S Mitra D Vegetation cover changeanalysis from multi-temporal satellite data in Jharkhali Island Sundarbans India Indian J Geo-Mar Sci2013 42 331ndash342
32 Misra A Murali RM Vethamony P Assessment of the land useland cover (LULC) and mangrovechanges along the Mandovi-Zuari estuarine complex of Goa India Arab J Geosci 2015 8 267ndash279[CrossRef]
33 Monzon AK Reyes SR Veridiano RK Tumaneng R De Alban JD Synergy of optical and SAR datafor mapping and monitoring mangroves In XXIII ISPRS Congress Commission VI Halounova L Safar VGong J Hanzl V Wu H Vyas A Wang L Musikhin I Tsai F Gruen A et al Eds CopernicusGesellschaft MBH Gottingen Germany 2016 Volume 41 pp 259ndash266
34 Omo-Irabor OO Olobaniyi SB Akunna J Venus V Maina JM Paradzayi C Mangrove vulnerabilitymodelling in parts of Western Niger Delta Nigeria using satellite images GIS techniques and SpatialMulti-Criteria Analysis (SMCA) Environ Monit Assess 2011 178 39ndash51 [CrossRef] [PubMed]
35 Otero V Quisthoudt K Koedam N Dahdouh-Guebas F Mangroves at Their Limits Detection and AreaEstimation of Mangroves along the Sahara Desert Coast Remote Sens 2016 8 512 [CrossRef]
36 Reddy CS Satish KV Pasha SV Jha CS Dadhwal VK Assessment and monitoring of deforestationand land-use changes (1976ndash2014) in Andaman and Nicobar Islands India using remote sensing and GISCurr Sci 2016 111 1492ndash1499 [CrossRef]
37 Salami AT Akinyede J de Gier A A preliminary assessment of NigeriaSat-1 for sustainable mangroveforest monitoring Int J Appl Earth Obs Geoinf 2010 12 S18ndashS22 [CrossRef]
38 Seto KC Fragkias M Mangrove conversion and aquaculture development in Vietnam A remotesensing-based approach for evaluating the Ramsar Convention on Wetlands Glob Environ Chang 2007 17486ndash500 [CrossRef]
Sensors 2018 18 12 15 of 15
39 Shapiro AC Trettin CC Kuchly H Alavinapanah S Bandeira S The Mangroves of the Zambezi DeltaIncrease in Extent Observed via Satellite from 1994 to 2013 Remote Sens 2015 7 16504ndash16518 [CrossRef]
40 Wang L Sousa WP Gong P Integration of object-based and pixel-based classification for mappingmangroves with IKONOS imagery Int J Remote Sens 2004 25 5655ndash5668 [CrossRef]
41 Hamilton SE Casey D Creation of a high spatio-temporal resolution global database of continuousmangrove forest cover for the 21st century (CGMFC-21) Glob Ecol Biogeogr 2016 25 729ndash738 [CrossRef]
42 Olson DM Dinerstein E Wikramanayake ED Burgess ND Powell GVN Underwood ECDrsquoamico JA Itoua I Strand HE Morrison JC et al Terrestrial ecoregions of the world A newmap of life on earth A new global map of terrestrial ecoregions provides an innovative tool for conservingbiodiversity BioScience 2001 51 933ndash938 [CrossRef]
43 Spalding M Kainuma M Collins L World Atlas of Mangroves Earthscan London UK 201044 Hansen MC Potapov PV Moore R Hancher M Turubanova SA Tyukavina A Thau D
Stehman SV Goetz SJ Loveland TR et al High-resolution global maps of 21st-century forest coverchange Science 2013 342 850ndash853 [CrossRef] [PubMed]
45 Fatoyinbo TE Simard M Height and biomass of mangroves in Africa from ICESatGLAS and SRTM Int JRemote Sens 2013 34 668ndash681 [CrossRef]
46 World Bank World Development Indicators Available online httpdatabankworldbankorgdatareportsaspxsource=2ampcountry=SLE (accessed on 31 July 2017)
47 Blinker L Country Environment Profile (CEP) Sierra Leone European Commission Cardiff UK 200648 GoSL (Government of Sierra Leone) Conservation and Wildlife Policy 2010 Government of Sierra Leone
Freetown Sierra Leone 201049 Heymans JJ Vakily JM Structure and Dynamics of the Marine Ecosystem off Sierra Leone for Three Time Periods
1964 1978 1990 Fisheries Centre UBC Vancouver BC Canada 200450 GCLME (Guinea Current Large Marine Ecosystem) Regional Coordinating Unit In Towards Ecosystem-Based
Management of the Guinea Current Large Marine Ecosystem United Nations Development Programme (UNDP)New York NY USA 2013
51 IUCN Strategies for Conservation and Sustainable Management of Mangrove Forest in Sierra Leone IUCN GlandSwitzerland 2007
52 Trzaska S de Sherbinin A Kim-Blanco P Mara V Schnarr E Jaiteh M Mondal P Climate ChangeVulnerability Assessment in Mangrove Regions of Sierra Leone USAID Washington DC USA 2017 Availableonline httpwwwciesincolumbiaeduwa-biccwa-bicc-ccva-abridged-ffpdf (accessed on 20 December2017)
53 Chander G Markham BL Helder DL Summary of current radiometric calibration coefficients for LandsatMSS TM ETM+ and EO-1 ALI sensors Remote Sens Environ 2009 113 893ndash903 [CrossRef]
54 Zhu Z Wang S Woodcock CE Improvement and expansion of the Fmask algorithm Cloud cloudshadow and snow detection for Landsats 4ndash7 8 and Sentinel 2 images Remote Sens Environ 2015 159269ndash277 [CrossRef]
55 Zhu Z Woodcock CE Object-based cloud and cloud shadow detection in Landsat imagery Remote SensEnviron 2012 118 83ndash94 [CrossRef]
56 GitHub fmask Available online httpsgithubcomprs021fmask (accessed on 31 July 2017)57 Arthur D Vassilvitskii S k-means++ The advantages of careful seeding In Proceedings of the eighteenth
Annual ACM-SIAM Symposium on Discrete Algorithms Society for Industrial and Applied MathematicsNew Orleans Louisiana 7ndash9 January 2007 pp 1027ndash1035
copy 2017 by the authors Licensee MDPI Basel Switzerland This article is an open accessarticle distributed under the terms and conditions of the Creative Commons Attribution(CC BY) license (httpcreativecommonsorglicensesby40)
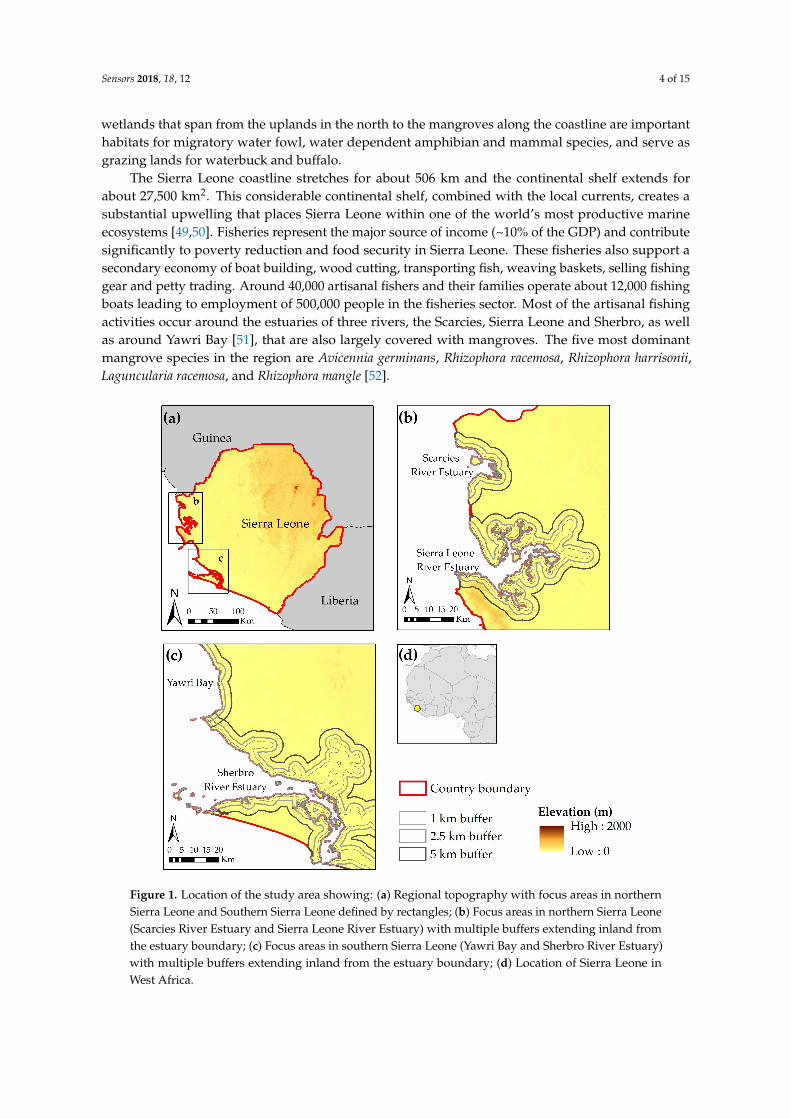
Sensors 2018 18 12 4 of 15
wetlands that span from the uplands in the north to the mangroves along the coastline are importanthabitats for migratory water fowl water dependent amphibian and mammal species and serve asgrazing lands for waterbuck and buffalo
The Sierra Leone coastline stretches for about 506 km and the continental shelf extends forabout 27500 km2 This considerable continental shelf combined with the local currents creates asubstantial upwelling that places Sierra Leone within one of the worldrsquos most productive marineecosystems [4950] Fisheries represent the major source of income (~10 of the GDP) and contributesignificantly to poverty reduction and food security in Sierra Leone These fisheries also support asecondary economy of boat building wood cutting transporting fish weaving baskets selling fishinggear and petty trading Around 40000 artisanal fishers and their families operate about 12000 fishingboats leading to employment of 500000 people in the fisheries sector Most of the artisanal fishingactivities occur around the estuaries of three rivers the Scarcies Sierra Leone and Sherbro as wellas around Yawri Bay [51] that are also largely covered with mangroves The five most dominantmangrove species in the region are Avicennia germinans Rhizophora racemosa Rhizophora harrisoniiLaguncularia racemosa and Rhizophora mangle [52]
Sensors 2018 18 12 4 of 15
important habitats for migratory water fowl water dependent amphibian and mammal species and serve as grazing lands for waterbuck and buffalo
Figure 1 Location of the study area showing (a) Regional topography with focus areas in northern Sierra Leone and Southern Sierra Leone defined by rectangles (b) Focus areas in northern Sierra Leone (Scarcies River Estuary and Sierra Leone River Estuary) with multiple buffers extending inland from the estuary boundary (c) Focus areas in southern Sierra Leone (Yawri Bay and Sherbro River Estuary) with multiple buffers extending inland from the estuary boundary (d) Location of Sierra Leone in West Africa
The Sierra Leone coastline stretches for about 506 km and the continental shelf extends for about 27500 km2 This considerable continental shelf combined with the local currents creates a substantial upwelling that places Sierra Leone within one of the worldrsquos most productive marine ecosystems [4950] Fisheries represent the major source of income (~10 of the GDP) and contribute significantly to poverty reduction and food security in Sierra Leone These fisheries also support a secondary economy of boat building wood cutting transporting fish weaving baskets selling fishing gear and petty trading Around 40000 artisanal fishers and their families operate about 12000 fishing boats leading to employment of 500000 people in the fisheries sector Most of the artisanal fishing activities occur around the estuaries of three rivers the Scarcies Sierra Leone and Sherbro as well as around Yawri Bay [51] that are also largely covered with mangroves The five most dominant mangrove species in the region are Avicennia germinans Rhizophora racemosa Rhizophora harrisonii Laguncularia racemosa and Rhizophora mangle [52]
Figure 1 Location of the study area showing (a) Regional topography with focus areas in northernSierra Leone and Southern Sierra Leone defined by rectangles (b) Focus areas in northern Sierra Leone(Scarcies River Estuary and Sierra Leone River Estuary) with multiple buffers extending inland fromthe estuary boundary (c) Focus areas in southern Sierra Leone (Yawri Bay and Sherbro River Estuary)with multiple buffers extending inland from the estuary boundary (d) Location of Sierra Leone inWest Africa
Sensors 2018 18 12 5 of 15
In this study we specifically focus on multiple buffers extending inland from fourestuariesmdashScarcies river estuary Sierra Leone river estuary (SLRE) Yawri Bay and Sherbro riverestuary (Figure 1) because of their varying ecology mangrove usage and WA BiCC focus In SierraLeone people are heavily dependent on fuelwood for domestic energy mostly for cooking Mangrovewood is additionally used for fish processing building construction poles and household furnitureWhile both Scarcies and SLRE have all five dominant mangrove species Yawri Bay and Sherbro haveonly three of them The Rhizophora species has been heavily harvested for fuelwood for fish smokingwhereas the Avicennia species is primarily harvested for fuelwood for salt processing and experiencesless exploitation [51]
22 Satellite Data
In order to quantify the spatial extent of the mangroves in selected areas and its temporal changesover several decades a suite of Landsat images were analyzed and compared for the years 19902000 2010 and 2016 (Table 2) A total of nine Landsat scenes are required to cover the entire country(Figure 2) although more scenes were considered for each year in order to minimize missing datadue to frequent cloud cover (Table 2) For the most recent year (ie 2016) Landsat 8 OLI imageswere used on Google Earth Engine (GEE) a cloud computing platform Landsat 5 images were usedfor 2010 and 1990 whereas Landsat 7 images were used for 2000 (Table 2)mdashall available on the GEEplatform A closer look at the image availability revealed that only winterdry seasons have imagesavailable across the years Since the years considered in this study have varied cloud coverage a longertime-frame (with two dry seasons) was required for 2000 and 1990 to minimize missing data (egsee [1]) All remote sensing analyses were performed on the GEE platform and classified imagecovering only the study region were downloaded for further analyses
Table 2 Details of the satellite images used in the study
Sensor Study Period Image Dates No of Total Images
Landsat 8 2016 December 2015ndashMay 2016 99Landsat 5 2010 November 2009ndashMay 2010 46Landsat 7 2000 November 1999ndashDecember 2000 120Landsat 5 1990 November 1989ndashDecember 1990 34
Sensors 2018 18 12 5 of 15
In this study we specifically focus on multiple buffers extending inland from four estuariesmdashScarcies river estuary Sierra Leone river estuary (SLRE) Yawri Bay and Sherbro river estuary (Figure 1) because of their varying ecology mangrove usage and WA BiCC focus In Sierra Leone people are heavily dependent on fuelwood for domestic energy mostly for cooking Mangrove wood is additionally used for fish processing building construction poles and household furniture While both Scarcies and SLRE have all five dominant mangrove species Yawri Bay and Sherbro have only three of them The Rhizophora species has been heavily harvested for fuelwood for fish smoking whereas the Avicennia species is primarily harvested for fuelwood for salt processing and experiences less exploitation [51]
22 Satellite Data
In order to quantify the spatial extent of the mangroves in selected areas and its temporal changes over several decades a suite of Landsat images were analyzed and compared for the years 1990 2000 2010 and 2016 (Table 2) A total of nine Landsat scenes are required to cover the entire country (Figure 2) although more scenes were considered for each year in order to minimize missing data due to frequent cloud cover (Table 2) For the most recent year (ie 2016) Landsat 8 OLI images were used on Google Earth Engine (GEE) a cloud computing platform Landsat 5 images were used for 2010 and 1990 whereas Landsat 7 images were used for 2000 (Table 2)mdashall available on the GEE platform A closer look at the image availability revealed that only winterdry seasons have images available across the years Since the years considered in this study have varied cloud coverage a longer time-frame (with two dry seasons) was required for 2000 and 1990 to minimize missing data (eg see [1]) All remote sensing analyses were performed on the GEE platform and classified image covering only the study region were downloaded for further analyses
Table 2 Details of the satellite images used in the study
Sensor Study Period Image Dates No of Total Images Landsat 8 2016 December 2015ndashMay 2016 99 Landsat 5 2010 November 2009ndashMay 2010 46 Landsat 7 2000 November 1999ndashDecember 2000 120 Landsat 5 1990 November 1989ndashDecember 1990 34
Figure 2 Maps from Google Earth Engine (GEE) showing (a) Landsat footprints covering Sierra Leone and (b) location of validation points used for accuracy assessment for the 2016 classified map
The images available on GEE provide calibrated orthorectified top-of-atmosphere reflectance values for each band (spatial resolution 30 m for visible and infrared bands) Calibration coefficients
Figure 2 Maps from Google Earth Engine (GEE) showing (a) Landsat footprints covering Sierra Leoneand (b) location of validation points used for accuracy assessment for the 2016 classified map
Sensors 2018 18 12 6 of 15
The images available on GEE provide calibrated orthorectified top-of-atmosphere reflectancevalues for each band (spatial resolution 30 m for visible and infrared bands) Calibration coefficientsare either extracted from the image metadata or derived from [53] Both Landsat 5 and Landsat 7images include a quality mask band identifying pixels as clear (0) water (1) shadow (2) snow (3)or cloud (4) [54ndash56] Pixels with mask values for shadow snow or cloud in this cloud mask band wereexcluded At the time of this analysis Landsat 8 images were not available with a cloud mask bandon the GEE platform hence a cloud mask function was used to identify pixels with less than 25cloud cover Finally an image composite was created for each year using all visible and infrared bandsFor further data reduction the ldquomedianrdquo function on GEE was used that calculates the median valueof all unmasked pixels in the input imagery for each pixel location in the output image for each bandHence each of these median images is devoid of noise as reflected in extremely high or low valuesfor each band The median image was then clipped for the low elevation coastal zone (LECZ) withelevation lt=40 m a criteria widely used to define the LECZ (eg see [45])
23 Land Cover Classification
We identified four dominant land covers in the study area using Sentinel-2 and high-resolutionimages available on the GEE platformmdash(1) waterwetland (2) mangrove (3) other vegetation and (4)builtbare soil In the interest of a consistent definition that can be applied across WA BiCC countrieswe broadly define lsquomangroversquo as the forest cover type that (i) has a distinct spectral signature comparedto other vegetation (Figure 3) and (ii) is located within the LECZ
Sensors 2018 18 12 6 of 15
are either extracted from the image metadata or derived from [53] Both Landsat 5 and Landsat 7 images include a quality mask band identifying pixels as clear (0) water (1) shadow (2) snow (3) or cloud (4) [54ndash56] Pixels with mask values for shadow snow or cloud in this cloud mask band were excluded At the time of this analysis Landsat 8 images were not available with a cloud mask band on the GEE platform hence a cloud mask function was used to identify pixels with less than 25 cloud cover Finally an image composite was created for each year using all visible and infrared bands For further data reduction the ldquomedianrdquo function on GEE was used that calculates the median value of all unmasked pixels in the input imagery for each pixel location in the output image for each band Hence each of these median images is devoid of noise as reflected in extremely high or low values for each band The median image was then clipped for the low elevation coastal zone (LECZ) with elevation lt=40 m a criteria widely used to define the LECZ (eg see [45])
23 Land Cover Classification
We identified four dominant land covers in the study area using Sentinel-2 and high-resolution images available on the GEE platformmdash(1) waterwetland (2) mangrove (3) other vegetation and (4) builtbare soil In the interest of a consistent definition that can be applied across WA BiCC countries we broadly define lsquomangroversquo as the forest cover type that (i) has a distinct spectral signature compared to other vegetation (Figure 3) and (ii) is located within the LECZ
Figure 3 Description of the land cover classes their appearances on Landsat and high-resolution images and spectral reflectance curves for representative pixels from each class
We then used the GEE lsquoclustererrsquo package to classify the clipped composite images for each year The package offers different clustering algorithms including k-means x-means cobweb and Learning Vector Quantization that can classify an image with no a priori knowledge We used a k-means approach [57] to perform an unsupervised classification as several past studies have
Figure 3 Description of the land cover classes their appearances on Landsat and high-resolutionimages and spectral reflectance curves for representative pixels from each class
Sensors 2018 18 12 7 of 15
We then used the GEE lsquoclustererrsquo package to classify the clipped composite images for each yearThe package offers different clustering algorithms including k-means x-means cobweb and LearningVector Quantization that can classify an image with no a priori knowledge We used a k-meansapproach [57] to perform an unsupervised classification as several past studies have successfullyutilized unsupervised classification approach for mangrove mapping [14192425313945] On GEE50 clusters were first identified in each of the four composite images corresponding to the fourtime-steps based on the reflectance values from all bands Then the clusters were sorted based onthe mean values for the near-infrared band (band 5 for Landsat 8band 4 for Landsat 5 and 7)as that band provides the maximum separability across land cover classes (Figure 3) This automatedunsupervised classification technique on the cloud computing platform is ideal for similar studiesin other developing countries where resources for advanced methods and detailed field data areoften unavailable The sorted clusters were then labeled one of the four land cover classes by visualinspection of the high-resolution images (Figure 3) All analyses were carried out on the GEE platformexcept class labeling that was done on ArcGIS 1041
Following the image classification areas under each land cover were quantified using GIS tools forthe four focus areas (Figure 1) We used a GIS shape file for the estuaries and created three buffers fromthese estuary boundaries that extend 1 km 25 km and 5 km inland Buffer zones are not mutuallyexclusive ie the 5 km buffer encompasses the 1 km and 25 km zones In these buffers we quantifiedthe land cover extents (in absolute numbers and percentages) for each focus area by time slice (19902000 2010 and 2016) as well as change in land cover between time slices
3 Results
31 Accuracy Assessment
A total of 300 validation points following a stratified random sampling strategy by area (150 formangrove and 50 for each of the other three land cover class stratum randomly distributed across thefour focus areas) were collected using Sentinel-2 and other high-resolution images from winterspringof 2016 on the GEE platform to perform an accuracy assessment for the 2016 classified image Field dataon mangrove locations collected during summer 2016 provided information regarding the appearanceof mangroves on high-resolution images and thus facilitated validation point collection on the GEEplatform The validation points were used to extract land cover classes from the 2016 classified map inArcGIS Then a confusion matrix was created with the observed and predictedclassified land coverclasses The overall accuracy (ie correct predictionstotal predictions) of the 2016 classification is 95(Table 3) The kappa statistic (κ) for the classified map is 093 While we did not directly validate landcover maps from the older dates due to lack of validation data we used other available estimates tocompare the mangrove extents
Table 3 Accuracy assessment for the 2016 classified map The overall accuracy is shown in bold
Ground Truth
Classified WaterWetland Mangrove Other Vegetation BareBuilt Userrsquos Accuracy
Waterwetland 46 1 0 0 98Mangrove 4 143 0 3 95
Other vegetation 0 6 50 1 88Barebuilt 0 0 0 46 100
Producerrsquos accuracy 92 95 100 92 95
32 Estimated Mangrove Extents in 2016
Figure 4 shows the spatial distributions of different land covers in the SLCLC In the SLRE andSherbro regions the area covered by mangroves increases twofold between 1 km and 5 km bufferwhereas the Scarcies and Yawri bay regions have 5- or 7-times more mangroves when areas further
Sensors 2018 18 12 8 of 15
away from the coastline are considered (Table 4) The Sherbro region has the largest area covered withmangroves among the four focus areas while mangrove cover has the smallest absolute extent in theScarcies region (except within 1 km buffer) Further investigation of the spatial distribution of themangroves shows that in SLRE and Sherbro regions considerable portions of the coastline is coveredwith mangroves (Figure 4bc) whereas in Yawri Bay mangroves are concentrated along the main rivers(Figure 4c)
Sensors 2018 18 12 8 of 15
covered with mangroves (Figure 4bc) whereas in Yawri Bay mangroves are concentrated along the main rivers (Figure 4c)
Figure 4 (a) Spatial distribution of the four land cover classes across the Sierra Leone coastal landscape complex for 2016 Panels show mangrove extents in (b) northern Sierra Leone (Scarcies River Estuary and Sierra Leone River Estuary) and (c) southern Sierra Leone (Yawri Bay and Sherbro River Estuary)
Table 4 Estimated mangrove cover in 2016 within different buffers for the four focus areas in Sierra Leone
Region 1 km Buffer 25 km Buffer 5 km Buffer
Mangrove
Area (sq km)
Relative Mangrove
Extent
Mangrove Area
(sq km)
Relative Mangrove
Extent
Mangrove Area
(sq km)
Relative Mangrove
Extent Scarcies River
Estuary 1735 36 4238 36 9039 37
Sierra Leone River Estuary
16071 48 24901 36 29055 26
Yawri Bay 1543 51 5505 51 11398 45 Sherbro River
Estuary 35578 68 60554 56 76299 44
33 Land Cover Changes within the Focus Areas
Figure 5 further summarizes the spatiotemporal changes of the different land cover classes between different time slices In the Scarcies region mangroves remained the most dominant land cover (Figure 5) However the Scarcies witnessed fluctuations in mangrove extents with more mangroves during 1990 (66 within 1 km 65 within 25 km 59 within 5 km) and 2010 (56 within 1 km 57 within 25 km 58 within 5 km) Mangrove extents declined in this region during 2000 (43 within 1 km 38 within 25 km 34 within 5 km) and 2016 (36 both within 1 km and 25 km 37 within 5 km) mostly owing to an increase in waterwetland (Figure 5) Built areabare
Figure 4 (a) Spatial distribution of the four land cover classes across the Sierra Leone coastal landscapecomplex for 2016 Panels show mangrove extents in (b) northern Sierra Leone (Scarcies River Estuaryand Sierra Leone River Estuary) and (c) southern Sierra Leone (Yawri Bay and Sherbro River Estuary)
Table 4 Estimated mangrove cover in 2016 within different buffers for the four focus areas inSierra Leone
Region 1 km Buffer 25 km Buffer 5 km Buffer
MangroveArea
(sq km)
RelativeMangrove
Extent
MangroveArea
(sq km)
RelativeMangrove
Extent
MangroveArea
(sq km)
RelativeMangrove
Extent
Scarcies RiverEstuary 1735 36 4238 36 9039 37
Sierra Leone RiverEstuary 16071 48 24901 36 29055 26
Yawri Bay 1543 51 5505 51 11398 45
Sherbro RiverEstuary 35578 68 60554 56 76299 44
Sensors 2018 18 12 9 of 15
33 Land Cover Changes within the Focus Areas
Figure 5 further summarizes the spatiotemporal changes of the different land cover classesbetween different time slices In the Scarcies region mangroves remained the most dominant land cover(Figure 5) However the Scarcies witnessed fluctuations in mangrove extents with more mangrovesduring 1990 (66 within 1 km 65 within 25 km 59 within 5 km) and 2010 (56 within 1 km57 within 25 km 58 within 5 km) Mangrove extents declined in this region during 2000 (43within 1 km 38 within 25 km 34 within 5 km) and 2016 (36 both within 1 km and 25 km 37within 5 km) mostly owing to an increase in waterwetland (Figure 5) Built areabare soil more thandoubled during post-2000 years increasing from 8 to 18 both within 1 km and 25 km and from 6to 14 within 5 km
Sensors 2018 18 12 9 of 15
soil more than doubled during post-2000 years increasing from 8 to 18 both within 1 km and 25 km and from 6 to 14 within 5 km
Figure 5 Relative extents of different land covers within the four focus areas during 1990ndash2016 Panels show mangrove extents within buffers of (a) 1 km (b) 25 km (c) 5 km extending inland from the coastline
In the SLRE region other vegetation (eg forest plantation farmland etc) has been the most dominant land cover over the past 26 years except for the 1 km buffer zone where mangrove was the most dominant land cover in the years of 1990 2010 and 2016 (Figure 5) Other vegetation coverage ranged between (i) 27 in 1990 and 49 in 2000 within the 1 km buffer (ii) 39 in 1990 and 60 in 2000 within 25 km buffer and (iii) 51 in 1990 and 69 in 2000 within 5 km buffer Waterwetland coverage ranged between 5 and 21 across years and buffer zones with more coverage closer to the coastline Built area or bare soil ranged between 4 and 14 across space and time with minimum coverage in 2000 and maximum coverage in 2010
In the Yawri Bay region mangroves covered the most area across the years and buffer zones except for in 2000 with (i) both wetlandswater and other vegetation covering more area than the mangroves within 1 km buffer and (ii) other vegetation covering more area in 5 km buffer (Figure 5) Waterwetland has declined over time (eg 14 in 1990 to 2 in 2016 within 1 km) within all three buffer zones with an increase during 2000 Built areabare soil increased over time (19 to 27 within 1 km 14 to 22 within 25 km and 11 to 18 within 5 km) with a decline in between for all three buffer zones
As with the Scarcies region mangroves remained the dominant land cover in the Sherbro region with an estimated area covering 68 within 1 km 56 within 25 km and 44 within 5 km buffer zones in 2016 (Table 4) The only exception is within 5 km buffer zone in 2000 (Figure 5) when other vegetation covered more area (46) than mangroves (37) The other two land covers remained relatively stable throughout the years and covered less area (~10) compared to mangroves and other vegetation The findings from the field visits during summer 2016 showed that
Figure 5 Relative extents of different land covers within the four focus areas during 1990ndash2016Panels show mangrove extents within buffers of (a) 1 km (b) 25 km (c) 5 km extending inland fromthe coastline
In the SLRE region other vegetation (eg forest plantation farmland etc) has been the mostdominant land cover over the past 26 years except for the 1 km buffer zone where mangrove was themost dominant land cover in the years of 1990 2010 and 2016 (Figure 5) Other vegetation coverageranged between (i) 27 in 1990 and 49 in 2000 within the 1 km buffer (ii) 39 in 1990 and 60 in2000 within 25 km buffer and (iii) 51 in 1990 and 69 in 2000 within 5 km buffer Waterwetlandcoverage ranged between 5 and 21 across years and buffer zones with more coverage closer to thecoastline Built area or bare soil ranged between 4 and 14 across space and time with minimumcoverage in 2000 and maximum coverage in 2010
In the Yawri Bay region mangroves covered the most area across the years and buffer zonesexcept for in 2000 with (i) both wetlandswater and other vegetation covering more area than themangroves within 1 km buffer and (ii) other vegetation covering more area in 5 km buffer (Figure 5)Waterwetland has declined over time (eg 14 in 1990 to 2 in 2016 within 1 km) within all three
Sensors 2018 18 12 10 of 15
buffer zones with an increase during 2000 Built areabare soil increased over time (19 to 27 within1 km 14 to 22 within 25 km and 11 to 18 within 5 km) with a decline in between for all threebuffer zones
As with the Scarcies region mangroves remained the dominant land cover in the Sherbro regionwith an estimated area covering 68 within 1 km 56 within 25 km and 44 within 5 km bufferzones in 2016 (Table 4) The only exception is within 5 km buffer zone in 2000 (Figure 5) when othervegetation covered more area (46) than mangroves (37) The other two land covers remainedrelatively stable throughout the years and covered less area (~10) compared to mangroves and othervegetation The findings from the field visits during summer 2016 showed that the Sherbro area iscovered with largest and oldest trees indicating less degradation over past decades than in other areasand explaining a relative stability of the mangrove cover over time
34 Spatiotemporal Changes in Mangrove Extents over the Last Three Decades
Table 5 shows the overall change in mangrove cover between 1990 and 2016 in each focus areafor different buffers The largest decline is observed in the Scarcies for all buffers up to 46 in the1 km buffer The SLRE has experienced an increase of about 22 in the 1 km buffer The Sherbro andYawri Bay regions experienced slight expansion (lt10) of the mangroves when the narrowest bufferclosest to the sea shore is considered These two regions witnessed modest decline (lt20) when largerbuffers are considered This comparison however does not capture the full history of fluctuations
Table 5 Summary of mangrove extents (area in sq km) during 1990 and 2016 for the four focus areasin the Sierra Leone coastal landscape complex Values in bold denote mangrove gain while values inred italic denote mangrove loss during 1990ndash2016 The lsquoSierra Leone coastal landscape complexrsquo refersto all the mangroves along the full length of the coast not only in the buffers in the four areas
Region 1 km Buffer 25 km Buffer 5 km Buffer
1990 2016Change(RelativeChange)
1990 2016Change(RelativeChange)
1990 2016Change(RelativeChange)
Scarcies RiverEstuary 3195 1735 minus1460
(minus46) 7343 4238 minus3105(minus42) 14258 9039 minus5219
(minus37)
Sierra LeoneRiver Estuary 13187 16071 2884
(22) 21302 24901 3599(17) 26169 29055 2886
(11)
Yawri Bay 1434 1543 109(8) 6011 5505 minus506
(minus8) 13830 11398 minus2432(minus18)
Sherbro RiverEstuary 33682 35578 1896
(6) 59148 60554 1406(2) 76826 76299 minus527
(minus1)
1990 2016 Overall change(Relative change)
Sierra Leonecoastal
landscapecomplex
243482 183432 minus6005 (minus25)
As shown in Figure 5 mangrovesrsquo relative extent is the lowest in 2000 in each region and eachbuffer which is also the year where the other types of vegetation and waterwetland combined coverthe largest area Subsequently in 2010 the relative mangrove extent increases back to the extents from1990 in nearly all cases with the exception of Yawri Bay Then it remains stable in Sherbro and YawriBay while it continues to increase in SLRE In the Scarcies on the other hand it decreases again in2016 to the extent similar to that in 2000
Figure 6 further highlights decadal changes in mangrove extents in the SLCLC The largest lossof mangroves in the Scarcies region is observed between 1990 and 2000 and is mostly located in thesouth-eastern part of the Scarcies region and along the Greater Scarcies River (Figure 6a) while the
Sensors 2018 18 12 11 of 15
loss between 2010 and 2016 mostly happened in the northern part of the region (Figure 6c) In otherparts of the SLCLC signs of non-clustered deforestation are present in pre- and post-2000 years withthe exception of Southern Yawri Bay In general the Scarcies and Yawri Bay seem to undergo largestmangrove fluctuations between years
Sensors 2018 18 12 11 of 15
Figure 6 Decadal changes in mangrove extents in the Sierra Leone coastal landscape complex (SLCLC) during (a) 1990ndash2000 (b) 2000ndash2010 (c) 2010ndash2016
4 Discussion and Conclusions
This study based on a discrete classification of Landsat pixels provides an estimate of 152642 km2 mangrove extent for 2000 that is similar to the estimates provided by [1] While a continuous classification approach can as argued by [41] provide more accurate estimates it is almost impossible to apply for historical land cover analyses in the absence of existing maps with known accuracy or extensive field data from earlier years Therefore it could not be applied in our study aimed at estimating the evolution of the mangrove extents in Sierra Leone Our study relies solely on dominant spectral signature within a single pixel (30 m times 30 m) for a discrete classification ie presenceabsence of a certain class While it is possible that our study overestimates mangrove coverage in the SLCLC because of the way discrete classification works our approach allows us to provide important insights into decadal changes in spatial patterns in mangrove forests Besides our findings agree with those from the past studies that showed an increase in mangrove extents after 2000 [541]
As shown in Figures 5 and 6b all four focus areas witnessed an increase in mangrove extents in all three buffer zones between 2000 and 2010 However only SLRE witnessed an increase in mangrove area post-2010 most probably as a result of reforestation efforts Considering the overall changes during 1990ndash2016 mangroves have declined only in the farthest buffer in the Sherbro and Yawri Bay regions pointing to the possible reclaiming of the land and expansion of agriculture by the communities living inland The Scarcies region underwent the most extensive mangrove loss among all the areas (Table 5) but in different locations for pre-2000 and post-2010 time periods (Figure 6) In both cases the most probable cause is the conversion of mangroves to rice paddies However the rapid recovery of the mangroves over a period of 10 years between 2000 and 2010 in some areas is more indicative of degradation or lsquothinning outrsquo during the periods prior to 2000 rather than a complete deforestation While causality is difficult to attribute the decade of the 1990s was also a period of civil war which may have heightened dependence on mangrove forests for fuel wood charcoal production and construction andor weakened conservation and protection measures These findings especially the overall patterns in change can particularly benefit regional andor national policy-makers in drafting coastal conservation policies
It is important to note that it is challenging to distinguish between wetlands and sparse mangrove forests because of the inherent limitations of optical remote sensing in terms of the spectral and spatial resolution especially in tropical countries with frequent cloud cover Hence it is possible that a pixel with sparse mangrove cover will record a spectral signature of the underlying water that is dominant within that pixel and thus be classified as waterwetland A validation check with high-resolution images from 2016 indeed confirms that the area along and surrounding the Scarcies river hosts young and sparsely distributed mangroves rather than a complete clear-cut of
Figure 6 Decadal changes in mangrove extents in the Sierra Leone coastal landscape complex (SLCLC)during (a) 1990ndash2000 (b) 2000ndash2010 (c) 2010ndash2016
4 Discussion and Conclusions
This study based on a discrete classification of Landsat pixels provides an estimate of 152642 km2
mangrove extent for 2000 that is similar to the estimates provided by [1] While a continuousclassification approach can as argued by [41] provide more accurate estimates it is almost impossibleto apply for historical land cover analyses in the absence of existing maps with known accuracyor extensive field data from earlier years Therefore it could not be applied in our study aimed atestimating the evolution of the mangrove extents in Sierra Leone Our study relies solely on dominantspectral signature within a single pixel (30 m times 30 m) for a discrete classification ie presenceabsenceof a certain class While it is possible that our study overestimates mangrove coverage in the SLCLCbecause of the way discrete classification works our approach allows us to provide important insightsinto decadal changes in spatial patterns in mangrove forests Besides our findings agree with thosefrom the past studies that showed an increase in mangrove extents after 2000 [541]
As shown in Figures 5 and 6b all four focus areas witnessed an increase in mangrove extents inall three buffer zones between 2000 and 2010 However only SLRE witnessed an increase in mangrovearea post-2010 most probably as a result of reforestation efforts Considering the overall changesduring 1990ndash2016 mangroves have declined only in the farthest buffer in the Sherbro and YawriBay regions pointing to the possible reclaiming of the land and expansion of agriculture by thecommunities living inland The Scarcies region underwent the most extensive mangrove loss amongall the areas (Table 5) but in different locations for pre-2000 and post-2010 time periods (Figure 6)In both cases the most probable cause is the conversion of mangroves to rice paddies However therapid recovery of the mangroves over a period of 10 years between 2000 and 2010 in some areas is moreindicative of degradation or lsquothinning outrsquo during the periods prior to 2000 rather than a completedeforestation While causality is difficult to attribute the decade of the 1990s was also a period of civilwar which may have heightened dependence on mangrove forests for fuel wood charcoal productionand construction andor weakened conservation and protection measures These findings especiallythe overall patterns in change can particularly benefit regional andor national policy-makers indrafting coastal conservation policies
Sensors 2018 18 12 12 of 15
It is important to note that it is challenging to distinguish between wetlands and sparse mangroveforests because of the inherent limitations of optical remote sensing in terms of the spectral and spatialresolution especially in tropical countries with frequent cloud cover Hence it is possible that a pixelwith sparse mangrove cover will record a spectral signature of the underlying water that is dominantwithin that pixel and thus be classified as waterwetland A validation check with high-resolutionimages from 2016 indeed confirms that the area along and surrounding the Scarcies river hosts youngand sparsely distributed mangroves rather than a complete clear-cut of dense mangrove forests Eventhough high-resolution satellite images do not exist for earlier years for validation purposes it ispossible that mangrove forests in the Scarcies region witnessed degradation or lsquothinning outrsquo during1990ndash2000 rather than a complete deforestation Thus the fluctuations in mangrove extents as shownin Figure 6 possibly represent alternate thinning and reforestation This is consistent with the highregeneration potential observed on field visits to the Scarcies region
To be useful at large scale satellite-based assessment of mangrove cover needs to be complementedby in-situ evaluation of the quality of the forests The field trips during summer 2016 indicate thatdespite degradation the remaining mangroves in the Scarcies region show higher species diversity(relative to other regions in Sierra Leone) and high regeneration level thus indicating human pressureon the forests but also high regeneration potential should human pressures be lowered or bettermanaged This is further supported by the fluctuations in mangrove forest cover from dense to sparseto dense estimated in this study The Sherbro area is on the opposite side of the spectrum with lowestspecies diversity highly dominated by Rhizophora racemosa These mangroves are also the oldest amongthe four areas and have the lowest regeneration rates with little disturbance in the forests Theseforests while with high commercial potential exhibit low adaptation potential to future potentiallyaltered climatic conditions The SLRE has the smallest trees with the lowest basal area pointing toyoungest forests sign of past and current exploitation of the forest as well as recent reforestation effortsThe Yawri Bay has fewer adult trees but the highest number of seedlings both showing signs of goodpotential for regeneration and sustainability
Overall despite a noticeable overall long term decrease of the mangrove cover in Sierra Leonea closer look at mangrove evolution shows a good potential for conservation if properly monitoredand managed Conserving the fluctuating mangroves in the SLCLC would require a carefullydesigned management plan involving current and alternative livelihood strategies sustainable resourcemanagement schemes at local and national levels and sensitization of the populations about mangroveservices and their value under climate change beyond responding to communitiesrsquo immediate needsAmong the coastal populations fishing communities are the ones that will be the most affected bythe decline in mangroves yet are also the ones who currently rely on mangroves the most for theirlivelihoods These populations exhibit low livelihood diversification mostly revolving around fishingand fish processing with some contribution from agriculture and petty trade [52] The SLRE hasslightly higher diversification of livelihood strategies largely due to the proximity of Freetown andslightly higher grounds In the Scarcies and Sherbro regions alternative or supplementary livelihoodopportunities are quasi non-existent In most of the communities visited during field trips mangrovesare also open-access and individuals can access ownership by lsquoadding valuersquo to the land which inmost cases translates into clearing the mangroves for rice cultivation Existing community-basedmanagement initiatives seem to be mostly geared towards short term economic benefits from landscovered by mangroves rather than driven by holistic long term plans that include a wide range ofservices provided to a wide range of populations that would insure sustainability of the resource andfishing livelihoods While projects aimed at mangrove conservation could benefit from the existingmanagement structures significant change to the management goals would be required
Acknowledgments This work is made possible by the generous support of the American People through theUnited States Agency for International Development (USAID) The contents of this work are the sole responsibilityof its authors and do not necessarily reflect the views of USAID or the United States Government We acknowledgethe contributions of Zebedee Njisuh Aiah Lebbie Samuel Weekes George Ganda Michael Balinga Paola
Sensors 2018 18 12 13 of 15
Kim-Blanco Valentina Mara Emilie Schnarr Malanding Jaiteh and the field research team We thank theanonymous reviewers for their constructive feedback
Author Contributions PM and AdS conceived and designed the study ST designed and conducted field-workPM analyzed the data PM and ST wrote the paper
Conflicts of Interest The authors declare no conflict of interest
References
1 Giri C Ochieng E Tieszen LL Zhu Z Singh A Loveland T Masek J Duke N Status and distributionof mangrove forests of the world using earth observation satellite data Glob Ecol Biogeogr 2011 20 154ndash159[CrossRef]
2 Murdiyarso D Purbopuspito J Kauffman JB Warren MW Sasmito SD Donato DC Manuri SKrisnawati H Taberima S Kurnianto S The potential of Indonesian mangrove forests for global climatechange mitigation Nat Clim Chang 2015 5 1089ndash1092 [CrossRef]
3 Danielsen F Soslashrensen MK Olwig MF Selvam V Parish F Burgess ND Hiraishi TKarunagaran VM Rasmussen MS Hansen LB The Asian tsunami A protective role for coastalvegetation Science 2005 310 643 [CrossRef] [PubMed]
4 Kathiresan K Rajendran N Coastal mangrove forests mitigated tsunami Estuar Coast Shelf Sci 2005 65601ndash606 [CrossRef]
5 FAO The Worldrsquos Mangroves 1980ndash2005 FAO Rome Italy 20076 Ellison JC Climate Change Vulnerability Assessment and Adaptation Planning for Mangrove Systems World
Wildlife Fund (WWF) Washington DC USA 20127 Blasco F Gauquelin T Rasolofoharinoro M Denis J Aizpuru M Caldairou V Recent advances in
mangrove studies using remote sensing data Mar Freshw Res 1998 49 287ndash296 [CrossRef]8 Giri C Observation and Monitoring of Mangrove Forests Using Remote Sensing Opportunities and
Challenges Remote Sens 2016 8 783 [CrossRef]9 Heumann BW Satellite remote sensing of mangrove forests Recent advances and future opportunities
Prog Phys Geogr 2011 35 87ndash108 [CrossRef]10 Almahasheer H Aljowair A Duarte CM Irigoien X Decadal stability of Red Sea mangroves Estuar
Coast Shelf Sci 2016 169 164ndash172 [CrossRef]11 Dan TT Chen CF Chiang SH Ogawa S Mapping and change analysis in mangrove forest by using
Landsat imagery In Xxiii Isprs Congress Commission Viii Halounova L Safar V Raju PLN Planka LZdimal V Kumar TS Faruque FS Kerr Y Ramasamy SM Comiso J et al Eds CopernicusGesellschaft MBH Gottingen Germany 2016 Volume 3 pp 109ndash116
12 Dutta D Das PK Paul S Sharma JR Dadhwal VK Assessment of ecological disturbance in themangrove forest of Sundarbans caused by cyclones using MODIS time-series data (2001ndash2011) Nat Hazards2015 79 775ndash790 [CrossRef]
13 Dutta D Das PK Paul S Sharma JR Dhadwal VK Spatio-temporal assessment of ecologicaldisturbance and its intensity in the mangrove forest using MODIS derived disturbance index In ISPRSTechnical Commission Viii Symposium Dadhwal VK Diwakar PG Seshasai MVR Raju PLN Hakeem AEds Copernicus Gesellschaft MBH Gottingen Germany 2014 Volume XL-8 pp 555ndash559
14 Fatoyinbo TE Simard M Washington-Allen RA Shugart HH Landscape-scale extent heightbiomass and carbon estimation of Mozambiquersquos mangrove forests with Landsat ETM+ and Shuttle RadarTopography Mission elevation data J Geophys Res Biogeosci 2008 113 [CrossRef]
15 Fromard F Vega C Proisy C Half a century of dynamic coastal change affecting mangrove shorelines ofFrench Guiana A case study based on remote sensing data analyses and field surveys Mar Geol 2004 208265ndash280 [CrossRef]
16 Ghosh MK Kumar L Roy C Mapping Long-Term Changes in Mangrove Species Composition andDistribution in the Sundarbans Forests 2016 7 305 [CrossRef]
17 Giri C Long J Abbas S Murali RM Qamer FM Pengra B Thau D Distribution and dynamics ofmangrove forests of South Asia J Environ Manag 2015 148 101ndash111 [CrossRef] [PubMed]
18 Giri C Muhlhausen J Mangrove forest distributions and dynamics in Madagascar (1975ndash2005) Sensors2008 8 2104ndash2117 [CrossRef] [PubMed]
Sensors 2018 18 12 14 of 15
19 Hamilton S Assessing the role of commercial aquaculture in displacing mangrove forest Bull Mar Sci2013 89 585ndash601 [CrossRef]
20 Hirata Y Tabuchi R Patanaponpaiboon P Poungparn S Yoneda R Fujioka Y Estimation ofaboveground biomass in mangrove forests using high-resolution satellite data J For Res 2014 19 34ndash41[CrossRef]
21 Kamal M Phinn S Johansen K Object-Based Approach for Multi-Scale Mangrove Composition MappingUsing Multi-Resolution Image Datasets Remote Sens 2015 7 4753ndash4783 [CrossRef]
22 Kamthonkiat D Rodfai C Saiwanrungkul A Koshimura S Matsuoka M Geoinformatics in mangrovemonitoring Damage and recovery after the 2004 Indian Ocean tsunami in Phang Nga Thailand Nat HazardsEarth Syst Sci 2011 11 1851ndash1862 [CrossRef]
23 Kanniah KD Sheikhi A Cracknell AP Goh HC Tan KP Ho CS Rasli FN Satellite Images forMonitoring Mangrove Cover Changes in a Fast Growing Economic Region in Southern Peninsular MalaysiaRemote Sens 2015 7 14360ndash14385 [CrossRef]
24 Kirui KB Kairo JG Bosire J Viergever KM Rudra S Huxham M Briers RA Mapping of mangroveforest land cover change along the Kenya coastline using Landsat imagery Ocean Coast Manag 2013 8319ndash24 [CrossRef]
25 Kovacs JM de Santiago FF Bastien J Lafrance P An Assessment of Mangroves in Guinea West AfricaUsing a Field and Remote Sensing Based Approach Wetlands 2010 30 773ndash782 [CrossRef]
26 Kuenzer C van Beijma S Gessner U Dech S Land surface dynamics and environmental challenges ofthe Niger Delta Africa Remote sensing-based analyses spanning three decades (1986ndash2013) Appl Geogr2014 53 354ndash368 [CrossRef]
27 Leimgruber P Kelly DS Steininger MK Brunner J Muller T Songer M Forest cover change patternsin Myanmar (Burma) 1990ndash2000 Environ Conserv 2005 32 356ndash364 [CrossRef]
28 LeMarie M van der Zaag P Menting G Bacluete E Schotanus D The use of remote sensing formonitoring environmental indicators The case of the Incomati estuary Mozambique Phys Chem Earth2006 31 857ndash863 [CrossRef]
29 Liu K Liu L Liu HX Li X Wang SG Exploring the effects of biophysical parameters on the spatialpattern of rare cold damage to mangrove forests Remote Sens Environ 2014 150 20ndash33 [CrossRef]
30 Macamo CCF Massuanganhe E Nicolau DK Bandeira SO Adams JB Mangroversquos response tocyclone Eline (2000) What is happening 14 years later Aquat Bot 2016 134 10ndash17 [CrossRef]
31 Manna S Mondal PP Mukhopadhyay A Akhand A Hazra S Mitra D Vegetation cover changeanalysis from multi-temporal satellite data in Jharkhali Island Sundarbans India Indian J Geo-Mar Sci2013 42 331ndash342
32 Misra A Murali RM Vethamony P Assessment of the land useland cover (LULC) and mangrovechanges along the Mandovi-Zuari estuarine complex of Goa India Arab J Geosci 2015 8 267ndash279[CrossRef]
33 Monzon AK Reyes SR Veridiano RK Tumaneng R De Alban JD Synergy of optical and SAR datafor mapping and monitoring mangroves In XXIII ISPRS Congress Commission VI Halounova L Safar VGong J Hanzl V Wu H Vyas A Wang L Musikhin I Tsai F Gruen A et al Eds CopernicusGesellschaft MBH Gottingen Germany 2016 Volume 41 pp 259ndash266
34 Omo-Irabor OO Olobaniyi SB Akunna J Venus V Maina JM Paradzayi C Mangrove vulnerabilitymodelling in parts of Western Niger Delta Nigeria using satellite images GIS techniques and SpatialMulti-Criteria Analysis (SMCA) Environ Monit Assess 2011 178 39ndash51 [CrossRef] [PubMed]
35 Otero V Quisthoudt K Koedam N Dahdouh-Guebas F Mangroves at Their Limits Detection and AreaEstimation of Mangroves along the Sahara Desert Coast Remote Sens 2016 8 512 [CrossRef]
36 Reddy CS Satish KV Pasha SV Jha CS Dadhwal VK Assessment and monitoring of deforestationand land-use changes (1976ndash2014) in Andaman and Nicobar Islands India using remote sensing and GISCurr Sci 2016 111 1492ndash1499 [CrossRef]
37 Salami AT Akinyede J de Gier A A preliminary assessment of NigeriaSat-1 for sustainable mangroveforest monitoring Int J Appl Earth Obs Geoinf 2010 12 S18ndashS22 [CrossRef]
38 Seto KC Fragkias M Mangrove conversion and aquaculture development in Vietnam A remotesensing-based approach for evaluating the Ramsar Convention on Wetlands Glob Environ Chang 2007 17486ndash500 [CrossRef]
Sensors 2018 18 12 15 of 15
39 Shapiro AC Trettin CC Kuchly H Alavinapanah S Bandeira S The Mangroves of the Zambezi DeltaIncrease in Extent Observed via Satellite from 1994 to 2013 Remote Sens 2015 7 16504ndash16518 [CrossRef]
40 Wang L Sousa WP Gong P Integration of object-based and pixel-based classification for mappingmangroves with IKONOS imagery Int J Remote Sens 2004 25 5655ndash5668 [CrossRef]
41 Hamilton SE Casey D Creation of a high spatio-temporal resolution global database of continuousmangrove forest cover for the 21st century (CGMFC-21) Glob Ecol Biogeogr 2016 25 729ndash738 [CrossRef]
42 Olson DM Dinerstein E Wikramanayake ED Burgess ND Powell GVN Underwood ECDrsquoamico JA Itoua I Strand HE Morrison JC et al Terrestrial ecoregions of the world A newmap of life on earth A new global map of terrestrial ecoregions provides an innovative tool for conservingbiodiversity BioScience 2001 51 933ndash938 [CrossRef]
43 Spalding M Kainuma M Collins L World Atlas of Mangroves Earthscan London UK 201044 Hansen MC Potapov PV Moore R Hancher M Turubanova SA Tyukavina A Thau D
Stehman SV Goetz SJ Loveland TR et al High-resolution global maps of 21st-century forest coverchange Science 2013 342 850ndash853 [CrossRef] [PubMed]
45 Fatoyinbo TE Simard M Height and biomass of mangroves in Africa from ICESatGLAS and SRTM Int JRemote Sens 2013 34 668ndash681 [CrossRef]
46 World Bank World Development Indicators Available online httpdatabankworldbankorgdatareportsaspxsource=2ampcountry=SLE (accessed on 31 July 2017)
47 Blinker L Country Environment Profile (CEP) Sierra Leone European Commission Cardiff UK 200648 GoSL (Government of Sierra Leone) Conservation and Wildlife Policy 2010 Government of Sierra Leone
Freetown Sierra Leone 201049 Heymans JJ Vakily JM Structure and Dynamics of the Marine Ecosystem off Sierra Leone for Three Time Periods
1964 1978 1990 Fisheries Centre UBC Vancouver BC Canada 200450 GCLME (Guinea Current Large Marine Ecosystem) Regional Coordinating Unit In Towards Ecosystem-Based
Management of the Guinea Current Large Marine Ecosystem United Nations Development Programme (UNDP)New York NY USA 2013
51 IUCN Strategies for Conservation and Sustainable Management of Mangrove Forest in Sierra Leone IUCN GlandSwitzerland 2007
52 Trzaska S de Sherbinin A Kim-Blanco P Mara V Schnarr E Jaiteh M Mondal P Climate ChangeVulnerability Assessment in Mangrove Regions of Sierra Leone USAID Washington DC USA 2017 Availableonline httpwwwciesincolumbiaeduwa-biccwa-bicc-ccva-abridged-ffpdf (accessed on 20 December2017)
53 Chander G Markham BL Helder DL Summary of current radiometric calibration coefficients for LandsatMSS TM ETM+ and EO-1 ALI sensors Remote Sens Environ 2009 113 893ndash903 [CrossRef]
54 Zhu Z Wang S Woodcock CE Improvement and expansion of the Fmask algorithm Cloud cloudshadow and snow detection for Landsats 4ndash7 8 and Sentinel 2 images Remote Sens Environ 2015 159269ndash277 [CrossRef]
55 Zhu Z Woodcock CE Object-based cloud and cloud shadow detection in Landsat imagery Remote SensEnviron 2012 118 83ndash94 [CrossRef]
56 GitHub fmask Available online httpsgithubcomprs021fmask (accessed on 31 July 2017)57 Arthur D Vassilvitskii S k-means++ The advantages of careful seeding In Proceedings of the eighteenth
Annual ACM-SIAM Symposium on Discrete Algorithms Society for Industrial and Applied MathematicsNew Orleans Louisiana 7ndash9 January 2007 pp 1027ndash1035
copy 2017 by the authors Licensee MDPI Basel Switzerland This article is an open accessarticle distributed under the terms and conditions of the Creative Commons Attribution(CC BY) license (httpcreativecommonsorglicensesby40)
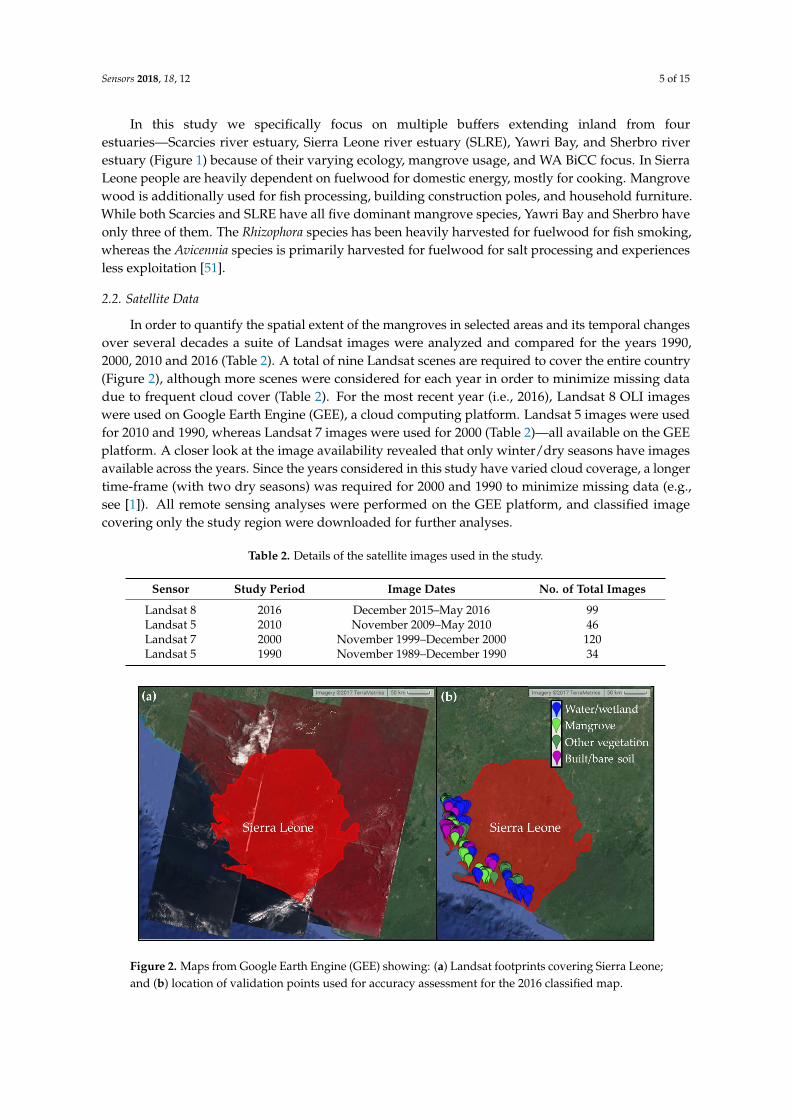
Sensors 2018 18 12 5 of 15
In this study we specifically focus on multiple buffers extending inland from fourestuariesmdashScarcies river estuary Sierra Leone river estuary (SLRE) Yawri Bay and Sherbro riverestuary (Figure 1) because of their varying ecology mangrove usage and WA BiCC focus In SierraLeone people are heavily dependent on fuelwood for domestic energy mostly for cooking Mangrovewood is additionally used for fish processing building construction poles and household furnitureWhile both Scarcies and SLRE have all five dominant mangrove species Yawri Bay and Sherbro haveonly three of them The Rhizophora species has been heavily harvested for fuelwood for fish smokingwhereas the Avicennia species is primarily harvested for fuelwood for salt processing and experiencesless exploitation [51]
22 Satellite Data
In order to quantify the spatial extent of the mangroves in selected areas and its temporal changesover several decades a suite of Landsat images were analyzed and compared for the years 19902000 2010 and 2016 (Table 2) A total of nine Landsat scenes are required to cover the entire country(Figure 2) although more scenes were considered for each year in order to minimize missing datadue to frequent cloud cover (Table 2) For the most recent year (ie 2016) Landsat 8 OLI imageswere used on Google Earth Engine (GEE) a cloud computing platform Landsat 5 images were usedfor 2010 and 1990 whereas Landsat 7 images were used for 2000 (Table 2)mdashall available on the GEEplatform A closer look at the image availability revealed that only winterdry seasons have imagesavailable across the years Since the years considered in this study have varied cloud coverage a longertime-frame (with two dry seasons) was required for 2000 and 1990 to minimize missing data (egsee [1]) All remote sensing analyses were performed on the GEE platform and classified imagecovering only the study region were downloaded for further analyses
Table 2 Details of the satellite images used in the study
Sensor Study Period Image Dates No of Total Images
Landsat 8 2016 December 2015ndashMay 2016 99Landsat 5 2010 November 2009ndashMay 2010 46Landsat 7 2000 November 1999ndashDecember 2000 120Landsat 5 1990 November 1989ndashDecember 1990 34
Sensors 2018 18 12 5 of 15
In this study we specifically focus on multiple buffers extending inland from four estuariesmdashScarcies river estuary Sierra Leone river estuary (SLRE) Yawri Bay and Sherbro river estuary (Figure 1) because of their varying ecology mangrove usage and WA BiCC focus In Sierra Leone people are heavily dependent on fuelwood for domestic energy mostly for cooking Mangrove wood is additionally used for fish processing building construction poles and household furniture While both Scarcies and SLRE have all five dominant mangrove species Yawri Bay and Sherbro have only three of them The Rhizophora species has been heavily harvested for fuelwood for fish smoking whereas the Avicennia species is primarily harvested for fuelwood for salt processing and experiences less exploitation [51]
22 Satellite Data
In order to quantify the spatial extent of the mangroves in selected areas and its temporal changes over several decades a suite of Landsat images were analyzed and compared for the years 1990 2000 2010 and 2016 (Table 2) A total of nine Landsat scenes are required to cover the entire country (Figure 2) although more scenes were considered for each year in order to minimize missing data due to frequent cloud cover (Table 2) For the most recent year (ie 2016) Landsat 8 OLI images were used on Google Earth Engine (GEE) a cloud computing platform Landsat 5 images were used for 2010 and 1990 whereas Landsat 7 images were used for 2000 (Table 2)mdashall available on the GEE platform A closer look at the image availability revealed that only winterdry seasons have images available across the years Since the years considered in this study have varied cloud coverage a longer time-frame (with two dry seasons) was required for 2000 and 1990 to minimize missing data (eg see [1]) All remote sensing analyses were performed on the GEE platform and classified image covering only the study region were downloaded for further analyses
Table 2 Details of the satellite images used in the study
Sensor Study Period Image Dates No of Total Images Landsat 8 2016 December 2015ndashMay 2016 99 Landsat 5 2010 November 2009ndashMay 2010 46 Landsat 7 2000 November 1999ndashDecember 2000 120 Landsat 5 1990 November 1989ndashDecember 1990 34
Figure 2 Maps from Google Earth Engine (GEE) showing (a) Landsat footprints covering Sierra Leone and (b) location of validation points used for accuracy assessment for the 2016 classified map
The images available on GEE provide calibrated orthorectified top-of-atmosphere reflectance values for each band (spatial resolution 30 m for visible and infrared bands) Calibration coefficients
Figure 2 Maps from Google Earth Engine (GEE) showing (a) Landsat footprints covering Sierra Leoneand (b) location of validation points used for accuracy assessment for the 2016 classified map
Sensors 2018 18 12 6 of 15
The images available on GEE provide calibrated orthorectified top-of-atmosphere reflectancevalues for each band (spatial resolution 30 m for visible and infrared bands) Calibration coefficientsare either extracted from the image metadata or derived from [53] Both Landsat 5 and Landsat 7images include a quality mask band identifying pixels as clear (0) water (1) shadow (2) snow (3)or cloud (4) [54ndash56] Pixels with mask values for shadow snow or cloud in this cloud mask band wereexcluded At the time of this analysis Landsat 8 images were not available with a cloud mask bandon the GEE platform hence a cloud mask function was used to identify pixels with less than 25cloud cover Finally an image composite was created for each year using all visible and infrared bandsFor further data reduction the ldquomedianrdquo function on GEE was used that calculates the median valueof all unmasked pixels in the input imagery for each pixel location in the output image for each bandHence each of these median images is devoid of noise as reflected in extremely high or low valuesfor each band The median image was then clipped for the low elevation coastal zone (LECZ) withelevation lt=40 m a criteria widely used to define the LECZ (eg see [45])
23 Land Cover Classification
We identified four dominant land covers in the study area using Sentinel-2 and high-resolutionimages available on the GEE platformmdash(1) waterwetland (2) mangrove (3) other vegetation and (4)builtbare soil In the interest of a consistent definition that can be applied across WA BiCC countrieswe broadly define lsquomangroversquo as the forest cover type that (i) has a distinct spectral signature comparedto other vegetation (Figure 3) and (ii) is located within the LECZ
Sensors 2018 18 12 6 of 15
are either extracted from the image metadata or derived from [53] Both Landsat 5 and Landsat 7 images include a quality mask band identifying pixels as clear (0) water (1) shadow (2) snow (3) or cloud (4) [54ndash56] Pixels with mask values for shadow snow or cloud in this cloud mask band were excluded At the time of this analysis Landsat 8 images were not available with a cloud mask band on the GEE platform hence a cloud mask function was used to identify pixels with less than 25 cloud cover Finally an image composite was created for each year using all visible and infrared bands For further data reduction the ldquomedianrdquo function on GEE was used that calculates the median value of all unmasked pixels in the input imagery for each pixel location in the output image for each band Hence each of these median images is devoid of noise as reflected in extremely high or low values for each band The median image was then clipped for the low elevation coastal zone (LECZ) with elevation lt=40 m a criteria widely used to define the LECZ (eg see [45])
23 Land Cover Classification
We identified four dominant land covers in the study area using Sentinel-2 and high-resolution images available on the GEE platformmdash(1) waterwetland (2) mangrove (3) other vegetation and (4) builtbare soil In the interest of a consistent definition that can be applied across WA BiCC countries we broadly define lsquomangroversquo as the forest cover type that (i) has a distinct spectral signature compared to other vegetation (Figure 3) and (ii) is located within the LECZ
Figure 3 Description of the land cover classes their appearances on Landsat and high-resolution images and spectral reflectance curves for representative pixels from each class
We then used the GEE lsquoclustererrsquo package to classify the clipped composite images for each year The package offers different clustering algorithms including k-means x-means cobweb and Learning Vector Quantization that can classify an image with no a priori knowledge We used a k-means approach [57] to perform an unsupervised classification as several past studies have
Figure 3 Description of the land cover classes their appearances on Landsat and high-resolutionimages and spectral reflectance curves for representative pixels from each class
Sensors 2018 18 12 7 of 15
We then used the GEE lsquoclustererrsquo package to classify the clipped composite images for each yearThe package offers different clustering algorithms including k-means x-means cobweb and LearningVector Quantization that can classify an image with no a priori knowledge We used a k-meansapproach [57] to perform an unsupervised classification as several past studies have successfullyutilized unsupervised classification approach for mangrove mapping [14192425313945] On GEE50 clusters were first identified in each of the four composite images corresponding to the fourtime-steps based on the reflectance values from all bands Then the clusters were sorted based onthe mean values for the near-infrared band (band 5 for Landsat 8band 4 for Landsat 5 and 7)as that band provides the maximum separability across land cover classes (Figure 3) This automatedunsupervised classification technique on the cloud computing platform is ideal for similar studiesin other developing countries where resources for advanced methods and detailed field data areoften unavailable The sorted clusters were then labeled one of the four land cover classes by visualinspection of the high-resolution images (Figure 3) All analyses were carried out on the GEE platformexcept class labeling that was done on ArcGIS 1041
Following the image classification areas under each land cover were quantified using GIS tools forthe four focus areas (Figure 1) We used a GIS shape file for the estuaries and created three buffers fromthese estuary boundaries that extend 1 km 25 km and 5 km inland Buffer zones are not mutuallyexclusive ie the 5 km buffer encompasses the 1 km and 25 km zones In these buffers we quantifiedthe land cover extents (in absolute numbers and percentages) for each focus area by time slice (19902000 2010 and 2016) as well as change in land cover between time slices
3 Results
31 Accuracy Assessment
A total of 300 validation points following a stratified random sampling strategy by area (150 formangrove and 50 for each of the other three land cover class stratum randomly distributed across thefour focus areas) were collected using Sentinel-2 and other high-resolution images from winterspringof 2016 on the GEE platform to perform an accuracy assessment for the 2016 classified image Field dataon mangrove locations collected during summer 2016 provided information regarding the appearanceof mangroves on high-resolution images and thus facilitated validation point collection on the GEEplatform The validation points were used to extract land cover classes from the 2016 classified map inArcGIS Then a confusion matrix was created with the observed and predictedclassified land coverclasses The overall accuracy (ie correct predictionstotal predictions) of the 2016 classification is 95(Table 3) The kappa statistic (κ) for the classified map is 093 While we did not directly validate landcover maps from the older dates due to lack of validation data we used other available estimates tocompare the mangrove extents
Table 3 Accuracy assessment for the 2016 classified map The overall accuracy is shown in bold
Ground Truth
Classified WaterWetland Mangrove Other Vegetation BareBuilt Userrsquos Accuracy
Waterwetland 46 1 0 0 98Mangrove 4 143 0 3 95
Other vegetation 0 6 50 1 88Barebuilt 0 0 0 46 100
Producerrsquos accuracy 92 95 100 92 95
32 Estimated Mangrove Extents in 2016
Figure 4 shows the spatial distributions of different land covers in the SLCLC In the SLRE andSherbro regions the area covered by mangroves increases twofold between 1 km and 5 km bufferwhereas the Scarcies and Yawri bay regions have 5- or 7-times more mangroves when areas further
Sensors 2018 18 12 8 of 15
away from the coastline are considered (Table 4) The Sherbro region has the largest area covered withmangroves among the four focus areas while mangrove cover has the smallest absolute extent in theScarcies region (except within 1 km buffer) Further investigation of the spatial distribution of themangroves shows that in SLRE and Sherbro regions considerable portions of the coastline is coveredwith mangroves (Figure 4bc) whereas in Yawri Bay mangroves are concentrated along the main rivers(Figure 4c)
Sensors 2018 18 12 8 of 15
covered with mangroves (Figure 4bc) whereas in Yawri Bay mangroves are concentrated along the main rivers (Figure 4c)
Figure 4 (a) Spatial distribution of the four land cover classes across the Sierra Leone coastal landscape complex for 2016 Panels show mangrove extents in (b) northern Sierra Leone (Scarcies River Estuary and Sierra Leone River Estuary) and (c) southern Sierra Leone (Yawri Bay and Sherbro River Estuary)
Table 4 Estimated mangrove cover in 2016 within different buffers for the four focus areas in Sierra Leone
Region 1 km Buffer 25 km Buffer 5 km Buffer
Mangrove
Area (sq km)
Relative Mangrove
Extent
Mangrove Area
(sq km)
Relative Mangrove
Extent
Mangrove Area
(sq km)
Relative Mangrove
Extent Scarcies River
Estuary 1735 36 4238 36 9039 37
Sierra Leone River Estuary
16071 48 24901 36 29055 26
Yawri Bay 1543 51 5505 51 11398 45 Sherbro River
Estuary 35578 68 60554 56 76299 44
33 Land Cover Changes within the Focus Areas
Figure 5 further summarizes the spatiotemporal changes of the different land cover classes between different time slices In the Scarcies region mangroves remained the most dominant land cover (Figure 5) However the Scarcies witnessed fluctuations in mangrove extents with more mangroves during 1990 (66 within 1 km 65 within 25 km 59 within 5 km) and 2010 (56 within 1 km 57 within 25 km 58 within 5 km) Mangrove extents declined in this region during 2000 (43 within 1 km 38 within 25 km 34 within 5 km) and 2016 (36 both within 1 km and 25 km 37 within 5 km) mostly owing to an increase in waterwetland (Figure 5) Built areabare
Figure 4 (a) Spatial distribution of the four land cover classes across the Sierra Leone coastal landscapecomplex for 2016 Panels show mangrove extents in (b) northern Sierra Leone (Scarcies River Estuaryand Sierra Leone River Estuary) and (c) southern Sierra Leone (Yawri Bay and Sherbro River Estuary)
Table 4 Estimated mangrove cover in 2016 within different buffers for the four focus areas inSierra Leone
Region 1 km Buffer 25 km Buffer 5 km Buffer
MangroveArea
(sq km)
RelativeMangrove
Extent
MangroveArea
(sq km)
RelativeMangrove
Extent
MangroveArea
(sq km)
RelativeMangrove
Extent
Scarcies RiverEstuary 1735 36 4238 36 9039 37
Sierra Leone RiverEstuary 16071 48 24901 36 29055 26
Yawri Bay 1543 51 5505 51 11398 45
Sherbro RiverEstuary 35578 68 60554 56 76299 44
Sensors 2018 18 12 9 of 15
33 Land Cover Changes within the Focus Areas
Figure 5 further summarizes the spatiotemporal changes of the different land cover classesbetween different time slices In the Scarcies region mangroves remained the most dominant land cover(Figure 5) However the Scarcies witnessed fluctuations in mangrove extents with more mangrovesduring 1990 (66 within 1 km 65 within 25 km 59 within 5 km) and 2010 (56 within 1 km57 within 25 km 58 within 5 km) Mangrove extents declined in this region during 2000 (43within 1 km 38 within 25 km 34 within 5 km) and 2016 (36 both within 1 km and 25 km 37within 5 km) mostly owing to an increase in waterwetland (Figure 5) Built areabare soil more thandoubled during post-2000 years increasing from 8 to 18 both within 1 km and 25 km and from 6to 14 within 5 km
Sensors 2018 18 12 9 of 15
soil more than doubled during post-2000 years increasing from 8 to 18 both within 1 km and 25 km and from 6 to 14 within 5 km
Figure 5 Relative extents of different land covers within the four focus areas during 1990ndash2016 Panels show mangrove extents within buffers of (a) 1 km (b) 25 km (c) 5 km extending inland from the coastline
In the SLRE region other vegetation (eg forest plantation farmland etc) has been the most dominant land cover over the past 26 years except for the 1 km buffer zone where mangrove was the most dominant land cover in the years of 1990 2010 and 2016 (Figure 5) Other vegetation coverage ranged between (i) 27 in 1990 and 49 in 2000 within the 1 km buffer (ii) 39 in 1990 and 60 in 2000 within 25 km buffer and (iii) 51 in 1990 and 69 in 2000 within 5 km buffer Waterwetland coverage ranged between 5 and 21 across years and buffer zones with more coverage closer to the coastline Built area or bare soil ranged between 4 and 14 across space and time with minimum coverage in 2000 and maximum coverage in 2010
In the Yawri Bay region mangroves covered the most area across the years and buffer zones except for in 2000 with (i) both wetlandswater and other vegetation covering more area than the mangroves within 1 km buffer and (ii) other vegetation covering more area in 5 km buffer (Figure 5) Waterwetland has declined over time (eg 14 in 1990 to 2 in 2016 within 1 km) within all three buffer zones with an increase during 2000 Built areabare soil increased over time (19 to 27 within 1 km 14 to 22 within 25 km and 11 to 18 within 5 km) with a decline in between for all three buffer zones
As with the Scarcies region mangroves remained the dominant land cover in the Sherbro region with an estimated area covering 68 within 1 km 56 within 25 km and 44 within 5 km buffer zones in 2016 (Table 4) The only exception is within 5 km buffer zone in 2000 (Figure 5) when other vegetation covered more area (46) than mangroves (37) The other two land covers remained relatively stable throughout the years and covered less area (~10) compared to mangroves and other vegetation The findings from the field visits during summer 2016 showed that
Figure 5 Relative extents of different land covers within the four focus areas during 1990ndash2016Panels show mangrove extents within buffers of (a) 1 km (b) 25 km (c) 5 km extending inland fromthe coastline
In the SLRE region other vegetation (eg forest plantation farmland etc) has been the mostdominant land cover over the past 26 years except for the 1 km buffer zone where mangrove was themost dominant land cover in the years of 1990 2010 and 2016 (Figure 5) Other vegetation coverageranged between (i) 27 in 1990 and 49 in 2000 within the 1 km buffer (ii) 39 in 1990 and 60 in2000 within 25 km buffer and (iii) 51 in 1990 and 69 in 2000 within 5 km buffer Waterwetlandcoverage ranged between 5 and 21 across years and buffer zones with more coverage closer to thecoastline Built area or bare soil ranged between 4 and 14 across space and time with minimumcoverage in 2000 and maximum coverage in 2010
In the Yawri Bay region mangroves covered the most area across the years and buffer zonesexcept for in 2000 with (i) both wetlandswater and other vegetation covering more area than themangroves within 1 km buffer and (ii) other vegetation covering more area in 5 km buffer (Figure 5)Waterwetland has declined over time (eg 14 in 1990 to 2 in 2016 within 1 km) within all three
Sensors 2018 18 12 10 of 15
buffer zones with an increase during 2000 Built areabare soil increased over time (19 to 27 within1 km 14 to 22 within 25 km and 11 to 18 within 5 km) with a decline in between for all threebuffer zones
As with the Scarcies region mangroves remained the dominant land cover in the Sherbro regionwith an estimated area covering 68 within 1 km 56 within 25 km and 44 within 5 km bufferzones in 2016 (Table 4) The only exception is within 5 km buffer zone in 2000 (Figure 5) when othervegetation covered more area (46) than mangroves (37) The other two land covers remainedrelatively stable throughout the years and covered less area (~10) compared to mangroves and othervegetation The findings from the field visits during summer 2016 showed that the Sherbro area iscovered with largest and oldest trees indicating less degradation over past decades than in other areasand explaining a relative stability of the mangrove cover over time
34 Spatiotemporal Changes in Mangrove Extents over the Last Three Decades
Table 5 shows the overall change in mangrove cover between 1990 and 2016 in each focus areafor different buffers The largest decline is observed in the Scarcies for all buffers up to 46 in the1 km buffer The SLRE has experienced an increase of about 22 in the 1 km buffer The Sherbro andYawri Bay regions experienced slight expansion (lt10) of the mangroves when the narrowest bufferclosest to the sea shore is considered These two regions witnessed modest decline (lt20) when largerbuffers are considered This comparison however does not capture the full history of fluctuations
Table 5 Summary of mangrove extents (area in sq km) during 1990 and 2016 for the four focus areasin the Sierra Leone coastal landscape complex Values in bold denote mangrove gain while values inred italic denote mangrove loss during 1990ndash2016 The lsquoSierra Leone coastal landscape complexrsquo refersto all the mangroves along the full length of the coast not only in the buffers in the four areas
Region 1 km Buffer 25 km Buffer 5 km Buffer
1990 2016Change(RelativeChange)
1990 2016Change(RelativeChange)
1990 2016Change(RelativeChange)
Scarcies RiverEstuary 3195 1735 minus1460
(minus46) 7343 4238 minus3105(minus42) 14258 9039 minus5219
(minus37)
Sierra LeoneRiver Estuary 13187 16071 2884
(22) 21302 24901 3599(17) 26169 29055 2886
(11)
Yawri Bay 1434 1543 109(8) 6011 5505 minus506
(minus8) 13830 11398 minus2432(minus18)
Sherbro RiverEstuary 33682 35578 1896
(6) 59148 60554 1406(2) 76826 76299 minus527
(minus1)
1990 2016 Overall change(Relative change)
Sierra Leonecoastal
landscapecomplex
243482 183432 minus6005 (minus25)
As shown in Figure 5 mangrovesrsquo relative extent is the lowest in 2000 in each region and eachbuffer which is also the year where the other types of vegetation and waterwetland combined coverthe largest area Subsequently in 2010 the relative mangrove extent increases back to the extents from1990 in nearly all cases with the exception of Yawri Bay Then it remains stable in Sherbro and YawriBay while it continues to increase in SLRE In the Scarcies on the other hand it decreases again in2016 to the extent similar to that in 2000
Figure 6 further highlights decadal changes in mangrove extents in the SLCLC The largest lossof mangroves in the Scarcies region is observed between 1990 and 2000 and is mostly located in thesouth-eastern part of the Scarcies region and along the Greater Scarcies River (Figure 6a) while the
Sensors 2018 18 12 11 of 15
loss between 2010 and 2016 mostly happened in the northern part of the region (Figure 6c) In otherparts of the SLCLC signs of non-clustered deforestation are present in pre- and post-2000 years withthe exception of Southern Yawri Bay In general the Scarcies and Yawri Bay seem to undergo largestmangrove fluctuations between years
Sensors 2018 18 12 11 of 15
Figure 6 Decadal changes in mangrove extents in the Sierra Leone coastal landscape complex (SLCLC) during (a) 1990ndash2000 (b) 2000ndash2010 (c) 2010ndash2016
4 Discussion and Conclusions
This study based on a discrete classification of Landsat pixels provides an estimate of 152642 km2 mangrove extent for 2000 that is similar to the estimates provided by [1] While a continuous classification approach can as argued by [41] provide more accurate estimates it is almost impossible to apply for historical land cover analyses in the absence of existing maps with known accuracy or extensive field data from earlier years Therefore it could not be applied in our study aimed at estimating the evolution of the mangrove extents in Sierra Leone Our study relies solely on dominant spectral signature within a single pixel (30 m times 30 m) for a discrete classification ie presenceabsence of a certain class While it is possible that our study overestimates mangrove coverage in the SLCLC because of the way discrete classification works our approach allows us to provide important insights into decadal changes in spatial patterns in mangrove forests Besides our findings agree with those from the past studies that showed an increase in mangrove extents after 2000 [541]
As shown in Figures 5 and 6b all four focus areas witnessed an increase in mangrove extents in all three buffer zones between 2000 and 2010 However only SLRE witnessed an increase in mangrove area post-2010 most probably as a result of reforestation efforts Considering the overall changes during 1990ndash2016 mangroves have declined only in the farthest buffer in the Sherbro and Yawri Bay regions pointing to the possible reclaiming of the land and expansion of agriculture by the communities living inland The Scarcies region underwent the most extensive mangrove loss among all the areas (Table 5) but in different locations for pre-2000 and post-2010 time periods (Figure 6) In both cases the most probable cause is the conversion of mangroves to rice paddies However the rapid recovery of the mangroves over a period of 10 years between 2000 and 2010 in some areas is more indicative of degradation or lsquothinning outrsquo during the periods prior to 2000 rather than a complete deforestation While causality is difficult to attribute the decade of the 1990s was also a period of civil war which may have heightened dependence on mangrove forests for fuel wood charcoal production and construction andor weakened conservation and protection measures These findings especially the overall patterns in change can particularly benefit regional andor national policy-makers in drafting coastal conservation policies
It is important to note that it is challenging to distinguish between wetlands and sparse mangrove forests because of the inherent limitations of optical remote sensing in terms of the spectral and spatial resolution especially in tropical countries with frequent cloud cover Hence it is possible that a pixel with sparse mangrove cover will record a spectral signature of the underlying water that is dominant within that pixel and thus be classified as waterwetland A validation check with high-resolution images from 2016 indeed confirms that the area along and surrounding the Scarcies river hosts young and sparsely distributed mangroves rather than a complete clear-cut of
Figure 6 Decadal changes in mangrove extents in the Sierra Leone coastal landscape complex (SLCLC)during (a) 1990ndash2000 (b) 2000ndash2010 (c) 2010ndash2016
4 Discussion and Conclusions
This study based on a discrete classification of Landsat pixels provides an estimate of 152642 km2
mangrove extent for 2000 that is similar to the estimates provided by [1] While a continuousclassification approach can as argued by [41] provide more accurate estimates it is almost impossibleto apply for historical land cover analyses in the absence of existing maps with known accuracyor extensive field data from earlier years Therefore it could not be applied in our study aimed atestimating the evolution of the mangrove extents in Sierra Leone Our study relies solely on dominantspectral signature within a single pixel (30 m times 30 m) for a discrete classification ie presenceabsenceof a certain class While it is possible that our study overestimates mangrove coverage in the SLCLCbecause of the way discrete classification works our approach allows us to provide important insightsinto decadal changes in spatial patterns in mangrove forests Besides our findings agree with thosefrom the past studies that showed an increase in mangrove extents after 2000 [541]
As shown in Figures 5 and 6b all four focus areas witnessed an increase in mangrove extents inall three buffer zones between 2000 and 2010 However only SLRE witnessed an increase in mangrovearea post-2010 most probably as a result of reforestation efforts Considering the overall changesduring 1990ndash2016 mangroves have declined only in the farthest buffer in the Sherbro and YawriBay regions pointing to the possible reclaiming of the land and expansion of agriculture by thecommunities living inland The Scarcies region underwent the most extensive mangrove loss amongall the areas (Table 5) but in different locations for pre-2000 and post-2010 time periods (Figure 6)In both cases the most probable cause is the conversion of mangroves to rice paddies However therapid recovery of the mangroves over a period of 10 years between 2000 and 2010 in some areas is moreindicative of degradation or lsquothinning outrsquo during the periods prior to 2000 rather than a completedeforestation While causality is difficult to attribute the decade of the 1990s was also a period of civilwar which may have heightened dependence on mangrove forests for fuel wood charcoal productionand construction andor weakened conservation and protection measures These findings especiallythe overall patterns in change can particularly benefit regional andor national policy-makers indrafting coastal conservation policies
Sensors 2018 18 12 12 of 15
It is important to note that it is challenging to distinguish between wetlands and sparse mangroveforests because of the inherent limitations of optical remote sensing in terms of the spectral and spatialresolution especially in tropical countries with frequent cloud cover Hence it is possible that a pixelwith sparse mangrove cover will record a spectral signature of the underlying water that is dominantwithin that pixel and thus be classified as waterwetland A validation check with high-resolutionimages from 2016 indeed confirms that the area along and surrounding the Scarcies river hosts youngand sparsely distributed mangroves rather than a complete clear-cut of dense mangrove forests Eventhough high-resolution satellite images do not exist for earlier years for validation purposes it ispossible that mangrove forests in the Scarcies region witnessed degradation or lsquothinning outrsquo during1990ndash2000 rather than a complete deforestation Thus the fluctuations in mangrove extents as shownin Figure 6 possibly represent alternate thinning and reforestation This is consistent with the highregeneration potential observed on field visits to the Scarcies region
To be useful at large scale satellite-based assessment of mangrove cover needs to be complementedby in-situ evaluation of the quality of the forests The field trips during summer 2016 indicate thatdespite degradation the remaining mangroves in the Scarcies region show higher species diversity(relative to other regions in Sierra Leone) and high regeneration level thus indicating human pressureon the forests but also high regeneration potential should human pressures be lowered or bettermanaged This is further supported by the fluctuations in mangrove forest cover from dense to sparseto dense estimated in this study The Sherbro area is on the opposite side of the spectrum with lowestspecies diversity highly dominated by Rhizophora racemosa These mangroves are also the oldest amongthe four areas and have the lowest regeneration rates with little disturbance in the forests Theseforests while with high commercial potential exhibit low adaptation potential to future potentiallyaltered climatic conditions The SLRE has the smallest trees with the lowest basal area pointing toyoungest forests sign of past and current exploitation of the forest as well as recent reforestation effortsThe Yawri Bay has fewer adult trees but the highest number of seedlings both showing signs of goodpotential for regeneration and sustainability
Overall despite a noticeable overall long term decrease of the mangrove cover in Sierra Leonea closer look at mangrove evolution shows a good potential for conservation if properly monitoredand managed Conserving the fluctuating mangroves in the SLCLC would require a carefullydesigned management plan involving current and alternative livelihood strategies sustainable resourcemanagement schemes at local and national levels and sensitization of the populations about mangroveservices and their value under climate change beyond responding to communitiesrsquo immediate needsAmong the coastal populations fishing communities are the ones that will be the most affected bythe decline in mangroves yet are also the ones who currently rely on mangroves the most for theirlivelihoods These populations exhibit low livelihood diversification mostly revolving around fishingand fish processing with some contribution from agriculture and petty trade [52] The SLRE hasslightly higher diversification of livelihood strategies largely due to the proximity of Freetown andslightly higher grounds In the Scarcies and Sherbro regions alternative or supplementary livelihoodopportunities are quasi non-existent In most of the communities visited during field trips mangrovesare also open-access and individuals can access ownership by lsquoadding valuersquo to the land which inmost cases translates into clearing the mangroves for rice cultivation Existing community-basedmanagement initiatives seem to be mostly geared towards short term economic benefits from landscovered by mangroves rather than driven by holistic long term plans that include a wide range ofservices provided to a wide range of populations that would insure sustainability of the resource andfishing livelihoods While projects aimed at mangrove conservation could benefit from the existingmanagement structures significant change to the management goals would be required
Acknowledgments This work is made possible by the generous support of the American People through theUnited States Agency for International Development (USAID) The contents of this work are the sole responsibilityof its authors and do not necessarily reflect the views of USAID or the United States Government We acknowledgethe contributions of Zebedee Njisuh Aiah Lebbie Samuel Weekes George Ganda Michael Balinga Paola
Sensors 2018 18 12 13 of 15
Kim-Blanco Valentina Mara Emilie Schnarr Malanding Jaiteh and the field research team We thank theanonymous reviewers for their constructive feedback
Author Contributions PM and AdS conceived and designed the study ST designed and conducted field-workPM analyzed the data PM and ST wrote the paper
Conflicts of Interest The authors declare no conflict of interest
References
1 Giri C Ochieng E Tieszen LL Zhu Z Singh A Loveland T Masek J Duke N Status and distributionof mangrove forests of the world using earth observation satellite data Glob Ecol Biogeogr 2011 20 154ndash159[CrossRef]
2 Murdiyarso D Purbopuspito J Kauffman JB Warren MW Sasmito SD Donato DC Manuri SKrisnawati H Taberima S Kurnianto S The potential of Indonesian mangrove forests for global climatechange mitigation Nat Clim Chang 2015 5 1089ndash1092 [CrossRef]
3 Danielsen F Soslashrensen MK Olwig MF Selvam V Parish F Burgess ND Hiraishi TKarunagaran VM Rasmussen MS Hansen LB The Asian tsunami A protective role for coastalvegetation Science 2005 310 643 [CrossRef] [PubMed]
4 Kathiresan K Rajendran N Coastal mangrove forests mitigated tsunami Estuar Coast Shelf Sci 2005 65601ndash606 [CrossRef]
5 FAO The Worldrsquos Mangroves 1980ndash2005 FAO Rome Italy 20076 Ellison JC Climate Change Vulnerability Assessment and Adaptation Planning for Mangrove Systems World
Wildlife Fund (WWF) Washington DC USA 20127 Blasco F Gauquelin T Rasolofoharinoro M Denis J Aizpuru M Caldairou V Recent advances in
mangrove studies using remote sensing data Mar Freshw Res 1998 49 287ndash296 [CrossRef]8 Giri C Observation and Monitoring of Mangrove Forests Using Remote Sensing Opportunities and
Challenges Remote Sens 2016 8 783 [CrossRef]9 Heumann BW Satellite remote sensing of mangrove forests Recent advances and future opportunities
Prog Phys Geogr 2011 35 87ndash108 [CrossRef]10 Almahasheer H Aljowair A Duarte CM Irigoien X Decadal stability of Red Sea mangroves Estuar
Coast Shelf Sci 2016 169 164ndash172 [CrossRef]11 Dan TT Chen CF Chiang SH Ogawa S Mapping and change analysis in mangrove forest by using
Landsat imagery In Xxiii Isprs Congress Commission Viii Halounova L Safar V Raju PLN Planka LZdimal V Kumar TS Faruque FS Kerr Y Ramasamy SM Comiso J et al Eds CopernicusGesellschaft MBH Gottingen Germany 2016 Volume 3 pp 109ndash116
12 Dutta D Das PK Paul S Sharma JR Dadhwal VK Assessment of ecological disturbance in themangrove forest of Sundarbans caused by cyclones using MODIS time-series data (2001ndash2011) Nat Hazards2015 79 775ndash790 [CrossRef]
13 Dutta D Das PK Paul S Sharma JR Dhadwal VK Spatio-temporal assessment of ecologicaldisturbance and its intensity in the mangrove forest using MODIS derived disturbance index In ISPRSTechnical Commission Viii Symposium Dadhwal VK Diwakar PG Seshasai MVR Raju PLN Hakeem AEds Copernicus Gesellschaft MBH Gottingen Germany 2014 Volume XL-8 pp 555ndash559
14 Fatoyinbo TE Simard M Washington-Allen RA Shugart HH Landscape-scale extent heightbiomass and carbon estimation of Mozambiquersquos mangrove forests with Landsat ETM+ and Shuttle RadarTopography Mission elevation data J Geophys Res Biogeosci 2008 113 [CrossRef]
15 Fromard F Vega C Proisy C Half a century of dynamic coastal change affecting mangrove shorelines ofFrench Guiana A case study based on remote sensing data analyses and field surveys Mar Geol 2004 208265ndash280 [CrossRef]
16 Ghosh MK Kumar L Roy C Mapping Long-Term Changes in Mangrove Species Composition andDistribution in the Sundarbans Forests 2016 7 305 [CrossRef]
17 Giri C Long J Abbas S Murali RM Qamer FM Pengra B Thau D Distribution and dynamics ofmangrove forests of South Asia J Environ Manag 2015 148 101ndash111 [CrossRef] [PubMed]
18 Giri C Muhlhausen J Mangrove forest distributions and dynamics in Madagascar (1975ndash2005) Sensors2008 8 2104ndash2117 [CrossRef] [PubMed]
Sensors 2018 18 12 14 of 15
19 Hamilton S Assessing the role of commercial aquaculture in displacing mangrove forest Bull Mar Sci2013 89 585ndash601 [CrossRef]
20 Hirata Y Tabuchi R Patanaponpaiboon P Poungparn S Yoneda R Fujioka Y Estimation ofaboveground biomass in mangrove forests using high-resolution satellite data J For Res 2014 19 34ndash41[CrossRef]
21 Kamal M Phinn S Johansen K Object-Based Approach for Multi-Scale Mangrove Composition MappingUsing Multi-Resolution Image Datasets Remote Sens 2015 7 4753ndash4783 [CrossRef]
22 Kamthonkiat D Rodfai C Saiwanrungkul A Koshimura S Matsuoka M Geoinformatics in mangrovemonitoring Damage and recovery after the 2004 Indian Ocean tsunami in Phang Nga Thailand Nat HazardsEarth Syst Sci 2011 11 1851ndash1862 [CrossRef]
23 Kanniah KD Sheikhi A Cracknell AP Goh HC Tan KP Ho CS Rasli FN Satellite Images forMonitoring Mangrove Cover Changes in a Fast Growing Economic Region in Southern Peninsular MalaysiaRemote Sens 2015 7 14360ndash14385 [CrossRef]
24 Kirui KB Kairo JG Bosire J Viergever KM Rudra S Huxham M Briers RA Mapping of mangroveforest land cover change along the Kenya coastline using Landsat imagery Ocean Coast Manag 2013 8319ndash24 [CrossRef]
25 Kovacs JM de Santiago FF Bastien J Lafrance P An Assessment of Mangroves in Guinea West AfricaUsing a Field and Remote Sensing Based Approach Wetlands 2010 30 773ndash782 [CrossRef]
26 Kuenzer C van Beijma S Gessner U Dech S Land surface dynamics and environmental challenges ofthe Niger Delta Africa Remote sensing-based analyses spanning three decades (1986ndash2013) Appl Geogr2014 53 354ndash368 [CrossRef]
27 Leimgruber P Kelly DS Steininger MK Brunner J Muller T Songer M Forest cover change patternsin Myanmar (Burma) 1990ndash2000 Environ Conserv 2005 32 356ndash364 [CrossRef]
28 LeMarie M van der Zaag P Menting G Bacluete E Schotanus D The use of remote sensing formonitoring environmental indicators The case of the Incomati estuary Mozambique Phys Chem Earth2006 31 857ndash863 [CrossRef]
29 Liu K Liu L Liu HX Li X Wang SG Exploring the effects of biophysical parameters on the spatialpattern of rare cold damage to mangrove forests Remote Sens Environ 2014 150 20ndash33 [CrossRef]
30 Macamo CCF Massuanganhe E Nicolau DK Bandeira SO Adams JB Mangroversquos response tocyclone Eline (2000) What is happening 14 years later Aquat Bot 2016 134 10ndash17 [CrossRef]
31 Manna S Mondal PP Mukhopadhyay A Akhand A Hazra S Mitra D Vegetation cover changeanalysis from multi-temporal satellite data in Jharkhali Island Sundarbans India Indian J Geo-Mar Sci2013 42 331ndash342
32 Misra A Murali RM Vethamony P Assessment of the land useland cover (LULC) and mangrovechanges along the Mandovi-Zuari estuarine complex of Goa India Arab J Geosci 2015 8 267ndash279[CrossRef]
33 Monzon AK Reyes SR Veridiano RK Tumaneng R De Alban JD Synergy of optical and SAR datafor mapping and monitoring mangroves In XXIII ISPRS Congress Commission VI Halounova L Safar VGong J Hanzl V Wu H Vyas A Wang L Musikhin I Tsai F Gruen A et al Eds CopernicusGesellschaft MBH Gottingen Germany 2016 Volume 41 pp 259ndash266
34 Omo-Irabor OO Olobaniyi SB Akunna J Venus V Maina JM Paradzayi C Mangrove vulnerabilitymodelling in parts of Western Niger Delta Nigeria using satellite images GIS techniques and SpatialMulti-Criteria Analysis (SMCA) Environ Monit Assess 2011 178 39ndash51 [CrossRef] [PubMed]
35 Otero V Quisthoudt K Koedam N Dahdouh-Guebas F Mangroves at Their Limits Detection and AreaEstimation of Mangroves along the Sahara Desert Coast Remote Sens 2016 8 512 [CrossRef]
36 Reddy CS Satish KV Pasha SV Jha CS Dadhwal VK Assessment and monitoring of deforestationand land-use changes (1976ndash2014) in Andaman and Nicobar Islands India using remote sensing and GISCurr Sci 2016 111 1492ndash1499 [CrossRef]
37 Salami AT Akinyede J de Gier A A preliminary assessment of NigeriaSat-1 for sustainable mangroveforest monitoring Int J Appl Earth Obs Geoinf 2010 12 S18ndashS22 [CrossRef]
38 Seto KC Fragkias M Mangrove conversion and aquaculture development in Vietnam A remotesensing-based approach for evaluating the Ramsar Convention on Wetlands Glob Environ Chang 2007 17486ndash500 [CrossRef]
Sensors 2018 18 12 15 of 15
39 Shapiro AC Trettin CC Kuchly H Alavinapanah S Bandeira S The Mangroves of the Zambezi DeltaIncrease in Extent Observed via Satellite from 1994 to 2013 Remote Sens 2015 7 16504ndash16518 [CrossRef]
40 Wang L Sousa WP Gong P Integration of object-based and pixel-based classification for mappingmangroves with IKONOS imagery Int J Remote Sens 2004 25 5655ndash5668 [CrossRef]
41 Hamilton SE Casey D Creation of a high spatio-temporal resolution global database of continuousmangrove forest cover for the 21st century (CGMFC-21) Glob Ecol Biogeogr 2016 25 729ndash738 [CrossRef]
42 Olson DM Dinerstein E Wikramanayake ED Burgess ND Powell GVN Underwood ECDrsquoamico JA Itoua I Strand HE Morrison JC et al Terrestrial ecoregions of the world A newmap of life on earth A new global map of terrestrial ecoregions provides an innovative tool for conservingbiodiversity BioScience 2001 51 933ndash938 [CrossRef]
43 Spalding M Kainuma M Collins L World Atlas of Mangroves Earthscan London UK 201044 Hansen MC Potapov PV Moore R Hancher M Turubanova SA Tyukavina A Thau D
Stehman SV Goetz SJ Loveland TR et al High-resolution global maps of 21st-century forest coverchange Science 2013 342 850ndash853 [CrossRef] [PubMed]
45 Fatoyinbo TE Simard M Height and biomass of mangroves in Africa from ICESatGLAS and SRTM Int JRemote Sens 2013 34 668ndash681 [CrossRef]
46 World Bank World Development Indicators Available online httpdatabankworldbankorgdatareportsaspxsource=2ampcountry=SLE (accessed on 31 July 2017)
47 Blinker L Country Environment Profile (CEP) Sierra Leone European Commission Cardiff UK 200648 GoSL (Government of Sierra Leone) Conservation and Wildlife Policy 2010 Government of Sierra Leone
Freetown Sierra Leone 201049 Heymans JJ Vakily JM Structure and Dynamics of the Marine Ecosystem off Sierra Leone for Three Time Periods
1964 1978 1990 Fisheries Centre UBC Vancouver BC Canada 200450 GCLME (Guinea Current Large Marine Ecosystem) Regional Coordinating Unit In Towards Ecosystem-Based
Management of the Guinea Current Large Marine Ecosystem United Nations Development Programme (UNDP)New York NY USA 2013
51 IUCN Strategies for Conservation and Sustainable Management of Mangrove Forest in Sierra Leone IUCN GlandSwitzerland 2007
52 Trzaska S de Sherbinin A Kim-Blanco P Mara V Schnarr E Jaiteh M Mondal P Climate ChangeVulnerability Assessment in Mangrove Regions of Sierra Leone USAID Washington DC USA 2017 Availableonline httpwwwciesincolumbiaeduwa-biccwa-bicc-ccva-abridged-ffpdf (accessed on 20 December2017)
53 Chander G Markham BL Helder DL Summary of current radiometric calibration coefficients for LandsatMSS TM ETM+ and EO-1 ALI sensors Remote Sens Environ 2009 113 893ndash903 [CrossRef]
54 Zhu Z Wang S Woodcock CE Improvement and expansion of the Fmask algorithm Cloud cloudshadow and snow detection for Landsats 4ndash7 8 and Sentinel 2 images Remote Sens Environ 2015 159269ndash277 [CrossRef]
55 Zhu Z Woodcock CE Object-based cloud and cloud shadow detection in Landsat imagery Remote SensEnviron 2012 118 83ndash94 [CrossRef]
56 GitHub fmask Available online httpsgithubcomprs021fmask (accessed on 31 July 2017)57 Arthur D Vassilvitskii S k-means++ The advantages of careful seeding In Proceedings of the eighteenth
Annual ACM-SIAM Symposium on Discrete Algorithms Society for Industrial and Applied MathematicsNew Orleans Louisiana 7ndash9 January 2007 pp 1027ndash1035
copy 2017 by the authors Licensee MDPI Basel Switzerland This article is an open accessarticle distributed under the terms and conditions of the Creative Commons Attribution(CC BY) license (httpcreativecommonsorglicensesby40)
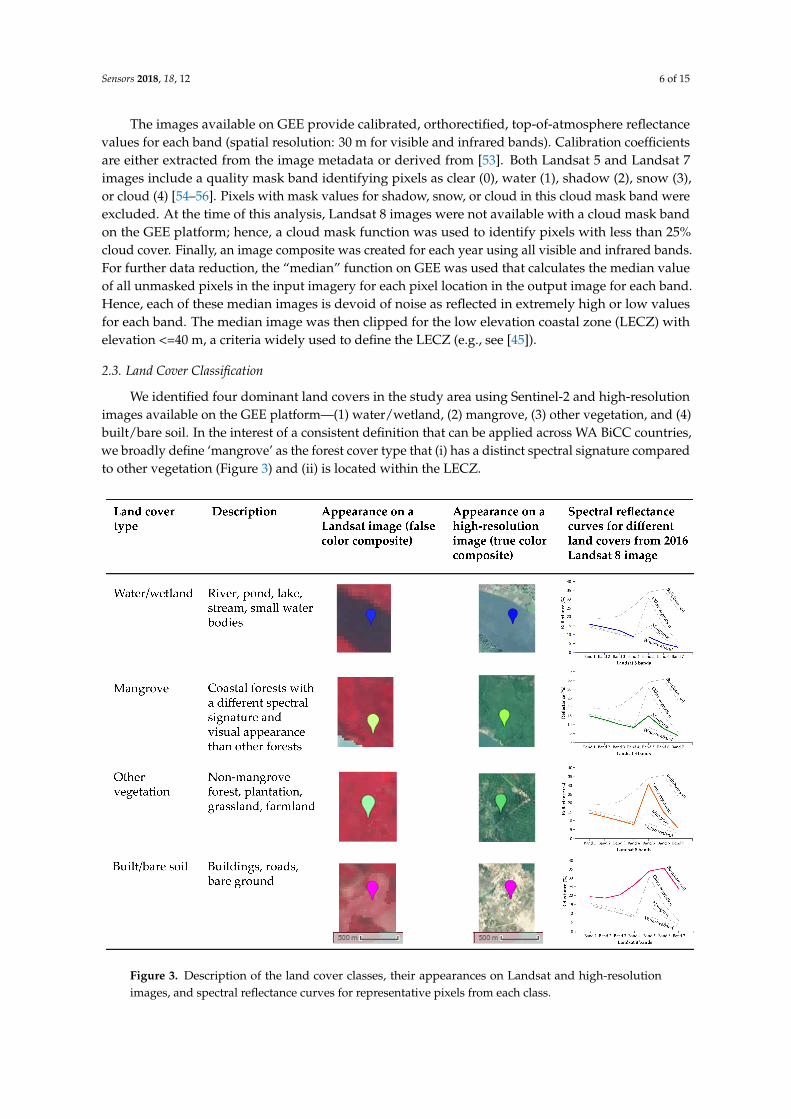
Sensors 2018 18 12 6 of 15
The images available on GEE provide calibrated orthorectified top-of-atmosphere reflectancevalues for each band (spatial resolution 30 m for visible and infrared bands) Calibration coefficientsare either extracted from the image metadata or derived from [53] Both Landsat 5 and Landsat 7images include a quality mask band identifying pixels as clear (0) water (1) shadow (2) snow (3)or cloud (4) [54ndash56] Pixels with mask values for shadow snow or cloud in this cloud mask band wereexcluded At the time of this analysis Landsat 8 images were not available with a cloud mask bandon the GEE platform hence a cloud mask function was used to identify pixels with less than 25cloud cover Finally an image composite was created for each year using all visible and infrared bandsFor further data reduction the ldquomedianrdquo function on GEE was used that calculates the median valueof all unmasked pixels in the input imagery for each pixel location in the output image for each bandHence each of these median images is devoid of noise as reflected in extremely high or low valuesfor each band The median image was then clipped for the low elevation coastal zone (LECZ) withelevation lt=40 m a criteria widely used to define the LECZ (eg see [45])
23 Land Cover Classification
We identified four dominant land covers in the study area using Sentinel-2 and high-resolutionimages available on the GEE platformmdash(1) waterwetland (2) mangrove (3) other vegetation and (4)builtbare soil In the interest of a consistent definition that can be applied across WA BiCC countrieswe broadly define lsquomangroversquo as the forest cover type that (i) has a distinct spectral signature comparedto other vegetation (Figure 3) and (ii) is located within the LECZ
Sensors 2018 18 12 6 of 15
are either extracted from the image metadata or derived from [53] Both Landsat 5 and Landsat 7 images include a quality mask band identifying pixels as clear (0) water (1) shadow (2) snow (3) or cloud (4) [54ndash56] Pixels with mask values for shadow snow or cloud in this cloud mask band were excluded At the time of this analysis Landsat 8 images were not available with a cloud mask band on the GEE platform hence a cloud mask function was used to identify pixels with less than 25 cloud cover Finally an image composite was created for each year using all visible and infrared bands For further data reduction the ldquomedianrdquo function on GEE was used that calculates the median value of all unmasked pixels in the input imagery for each pixel location in the output image for each band Hence each of these median images is devoid of noise as reflected in extremely high or low values for each band The median image was then clipped for the low elevation coastal zone (LECZ) with elevation lt=40 m a criteria widely used to define the LECZ (eg see [45])
23 Land Cover Classification
We identified four dominant land covers in the study area using Sentinel-2 and high-resolution images available on the GEE platformmdash(1) waterwetland (2) mangrove (3) other vegetation and (4) builtbare soil In the interest of a consistent definition that can be applied across WA BiCC countries we broadly define lsquomangroversquo as the forest cover type that (i) has a distinct spectral signature compared to other vegetation (Figure 3) and (ii) is located within the LECZ
Figure 3 Description of the land cover classes their appearances on Landsat and high-resolution images and spectral reflectance curves for representative pixels from each class
We then used the GEE lsquoclustererrsquo package to classify the clipped composite images for each year The package offers different clustering algorithms including k-means x-means cobweb and Learning Vector Quantization that can classify an image with no a priori knowledge We used a k-means approach [57] to perform an unsupervised classification as several past studies have
Figure 3 Description of the land cover classes their appearances on Landsat and high-resolutionimages and spectral reflectance curves for representative pixels from each class
Sensors 2018 18 12 7 of 15
We then used the GEE lsquoclustererrsquo package to classify the clipped composite images for each yearThe package offers different clustering algorithms including k-means x-means cobweb and LearningVector Quantization that can classify an image with no a priori knowledge We used a k-meansapproach [57] to perform an unsupervised classification as several past studies have successfullyutilized unsupervised classification approach for mangrove mapping [14192425313945] On GEE50 clusters were first identified in each of the four composite images corresponding to the fourtime-steps based on the reflectance values from all bands Then the clusters were sorted based onthe mean values for the near-infrared band (band 5 for Landsat 8band 4 for Landsat 5 and 7)as that band provides the maximum separability across land cover classes (Figure 3) This automatedunsupervised classification technique on the cloud computing platform is ideal for similar studiesin other developing countries where resources for advanced methods and detailed field data areoften unavailable The sorted clusters were then labeled one of the four land cover classes by visualinspection of the high-resolution images (Figure 3) All analyses were carried out on the GEE platformexcept class labeling that was done on ArcGIS 1041
Following the image classification areas under each land cover were quantified using GIS tools forthe four focus areas (Figure 1) We used a GIS shape file for the estuaries and created three buffers fromthese estuary boundaries that extend 1 km 25 km and 5 km inland Buffer zones are not mutuallyexclusive ie the 5 km buffer encompasses the 1 km and 25 km zones In these buffers we quantifiedthe land cover extents (in absolute numbers and percentages) for each focus area by time slice (19902000 2010 and 2016) as well as change in land cover between time slices
3 Results
31 Accuracy Assessment
A total of 300 validation points following a stratified random sampling strategy by area (150 formangrove and 50 for each of the other three land cover class stratum randomly distributed across thefour focus areas) were collected using Sentinel-2 and other high-resolution images from winterspringof 2016 on the GEE platform to perform an accuracy assessment for the 2016 classified image Field dataon mangrove locations collected during summer 2016 provided information regarding the appearanceof mangroves on high-resolution images and thus facilitated validation point collection on the GEEplatform The validation points were used to extract land cover classes from the 2016 classified map inArcGIS Then a confusion matrix was created with the observed and predictedclassified land coverclasses The overall accuracy (ie correct predictionstotal predictions) of the 2016 classification is 95(Table 3) The kappa statistic (κ) for the classified map is 093 While we did not directly validate landcover maps from the older dates due to lack of validation data we used other available estimates tocompare the mangrove extents
Table 3 Accuracy assessment for the 2016 classified map The overall accuracy is shown in bold
Ground Truth
Classified WaterWetland Mangrove Other Vegetation BareBuilt Userrsquos Accuracy
Waterwetland 46 1 0 0 98Mangrove 4 143 0 3 95
Other vegetation 0 6 50 1 88Barebuilt 0 0 0 46 100
Producerrsquos accuracy 92 95 100 92 95
32 Estimated Mangrove Extents in 2016
Figure 4 shows the spatial distributions of different land covers in the SLCLC In the SLRE andSherbro regions the area covered by mangroves increases twofold between 1 km and 5 km bufferwhereas the Scarcies and Yawri bay regions have 5- or 7-times more mangroves when areas further
Sensors 2018 18 12 8 of 15
away from the coastline are considered (Table 4) The Sherbro region has the largest area covered withmangroves among the four focus areas while mangrove cover has the smallest absolute extent in theScarcies region (except within 1 km buffer) Further investigation of the spatial distribution of themangroves shows that in SLRE and Sherbro regions considerable portions of the coastline is coveredwith mangroves (Figure 4bc) whereas in Yawri Bay mangroves are concentrated along the main rivers(Figure 4c)
Sensors 2018 18 12 8 of 15
covered with mangroves (Figure 4bc) whereas in Yawri Bay mangroves are concentrated along the main rivers (Figure 4c)
Figure 4 (a) Spatial distribution of the four land cover classes across the Sierra Leone coastal landscape complex for 2016 Panels show mangrove extents in (b) northern Sierra Leone (Scarcies River Estuary and Sierra Leone River Estuary) and (c) southern Sierra Leone (Yawri Bay and Sherbro River Estuary)
Table 4 Estimated mangrove cover in 2016 within different buffers for the four focus areas in Sierra Leone
Region 1 km Buffer 25 km Buffer 5 km Buffer
Mangrove
Area (sq km)
Relative Mangrove
Extent
Mangrove Area
(sq km)
Relative Mangrove
Extent
Mangrove Area
(sq km)
Relative Mangrove
Extent Scarcies River
Estuary 1735 36 4238 36 9039 37
Sierra Leone River Estuary
16071 48 24901 36 29055 26
Yawri Bay 1543 51 5505 51 11398 45 Sherbro River
Estuary 35578 68 60554 56 76299 44
33 Land Cover Changes within the Focus Areas
Figure 5 further summarizes the spatiotemporal changes of the different land cover classes between different time slices In the Scarcies region mangroves remained the most dominant land cover (Figure 5) However the Scarcies witnessed fluctuations in mangrove extents with more mangroves during 1990 (66 within 1 km 65 within 25 km 59 within 5 km) and 2010 (56 within 1 km 57 within 25 km 58 within 5 km) Mangrove extents declined in this region during 2000 (43 within 1 km 38 within 25 km 34 within 5 km) and 2016 (36 both within 1 km and 25 km 37 within 5 km) mostly owing to an increase in waterwetland (Figure 5) Built areabare
Figure 4 (a) Spatial distribution of the four land cover classes across the Sierra Leone coastal landscapecomplex for 2016 Panels show mangrove extents in (b) northern Sierra Leone (Scarcies River Estuaryand Sierra Leone River Estuary) and (c) southern Sierra Leone (Yawri Bay and Sherbro River Estuary)
Table 4 Estimated mangrove cover in 2016 within different buffers for the four focus areas inSierra Leone
Region 1 km Buffer 25 km Buffer 5 km Buffer
MangroveArea
(sq km)
RelativeMangrove
Extent
MangroveArea
(sq km)
RelativeMangrove
Extent
MangroveArea
(sq km)
RelativeMangrove
Extent
Scarcies RiverEstuary 1735 36 4238 36 9039 37
Sierra Leone RiverEstuary 16071 48 24901 36 29055 26
Yawri Bay 1543 51 5505 51 11398 45
Sherbro RiverEstuary 35578 68 60554 56 76299 44
Sensors 2018 18 12 9 of 15
33 Land Cover Changes within the Focus Areas
Figure 5 further summarizes the spatiotemporal changes of the different land cover classesbetween different time slices In the Scarcies region mangroves remained the most dominant land cover(Figure 5) However the Scarcies witnessed fluctuations in mangrove extents with more mangrovesduring 1990 (66 within 1 km 65 within 25 km 59 within 5 km) and 2010 (56 within 1 km57 within 25 km 58 within 5 km) Mangrove extents declined in this region during 2000 (43within 1 km 38 within 25 km 34 within 5 km) and 2016 (36 both within 1 km and 25 km 37within 5 km) mostly owing to an increase in waterwetland (Figure 5) Built areabare soil more thandoubled during post-2000 years increasing from 8 to 18 both within 1 km and 25 km and from 6to 14 within 5 km
Sensors 2018 18 12 9 of 15
soil more than doubled during post-2000 years increasing from 8 to 18 both within 1 km and 25 km and from 6 to 14 within 5 km
Figure 5 Relative extents of different land covers within the four focus areas during 1990ndash2016 Panels show mangrove extents within buffers of (a) 1 km (b) 25 km (c) 5 km extending inland from the coastline
In the SLRE region other vegetation (eg forest plantation farmland etc) has been the most dominant land cover over the past 26 years except for the 1 km buffer zone where mangrove was the most dominant land cover in the years of 1990 2010 and 2016 (Figure 5) Other vegetation coverage ranged between (i) 27 in 1990 and 49 in 2000 within the 1 km buffer (ii) 39 in 1990 and 60 in 2000 within 25 km buffer and (iii) 51 in 1990 and 69 in 2000 within 5 km buffer Waterwetland coverage ranged between 5 and 21 across years and buffer zones with more coverage closer to the coastline Built area or bare soil ranged between 4 and 14 across space and time with minimum coverage in 2000 and maximum coverage in 2010
In the Yawri Bay region mangroves covered the most area across the years and buffer zones except for in 2000 with (i) both wetlandswater and other vegetation covering more area than the mangroves within 1 km buffer and (ii) other vegetation covering more area in 5 km buffer (Figure 5) Waterwetland has declined over time (eg 14 in 1990 to 2 in 2016 within 1 km) within all three buffer zones with an increase during 2000 Built areabare soil increased over time (19 to 27 within 1 km 14 to 22 within 25 km and 11 to 18 within 5 km) with a decline in between for all three buffer zones
As with the Scarcies region mangroves remained the dominant land cover in the Sherbro region with an estimated area covering 68 within 1 km 56 within 25 km and 44 within 5 km buffer zones in 2016 (Table 4) The only exception is within 5 km buffer zone in 2000 (Figure 5) when other vegetation covered more area (46) than mangroves (37) The other two land covers remained relatively stable throughout the years and covered less area (~10) compared to mangroves and other vegetation The findings from the field visits during summer 2016 showed that
Figure 5 Relative extents of different land covers within the four focus areas during 1990ndash2016Panels show mangrove extents within buffers of (a) 1 km (b) 25 km (c) 5 km extending inland fromthe coastline
In the SLRE region other vegetation (eg forest plantation farmland etc) has been the mostdominant land cover over the past 26 years except for the 1 km buffer zone where mangrove was themost dominant land cover in the years of 1990 2010 and 2016 (Figure 5) Other vegetation coverageranged between (i) 27 in 1990 and 49 in 2000 within the 1 km buffer (ii) 39 in 1990 and 60 in2000 within 25 km buffer and (iii) 51 in 1990 and 69 in 2000 within 5 km buffer Waterwetlandcoverage ranged between 5 and 21 across years and buffer zones with more coverage closer to thecoastline Built area or bare soil ranged between 4 and 14 across space and time with minimumcoverage in 2000 and maximum coverage in 2010
In the Yawri Bay region mangroves covered the most area across the years and buffer zonesexcept for in 2000 with (i) both wetlandswater and other vegetation covering more area than themangroves within 1 km buffer and (ii) other vegetation covering more area in 5 km buffer (Figure 5)Waterwetland has declined over time (eg 14 in 1990 to 2 in 2016 within 1 km) within all three
Sensors 2018 18 12 10 of 15
buffer zones with an increase during 2000 Built areabare soil increased over time (19 to 27 within1 km 14 to 22 within 25 km and 11 to 18 within 5 km) with a decline in between for all threebuffer zones
As with the Scarcies region mangroves remained the dominant land cover in the Sherbro regionwith an estimated area covering 68 within 1 km 56 within 25 km and 44 within 5 km bufferzones in 2016 (Table 4) The only exception is within 5 km buffer zone in 2000 (Figure 5) when othervegetation covered more area (46) than mangroves (37) The other two land covers remainedrelatively stable throughout the years and covered less area (~10) compared to mangroves and othervegetation The findings from the field visits during summer 2016 showed that the Sherbro area iscovered with largest and oldest trees indicating less degradation over past decades than in other areasand explaining a relative stability of the mangrove cover over time
34 Spatiotemporal Changes in Mangrove Extents over the Last Three Decades
Table 5 shows the overall change in mangrove cover between 1990 and 2016 in each focus areafor different buffers The largest decline is observed in the Scarcies for all buffers up to 46 in the1 km buffer The SLRE has experienced an increase of about 22 in the 1 km buffer The Sherbro andYawri Bay regions experienced slight expansion (lt10) of the mangroves when the narrowest bufferclosest to the sea shore is considered These two regions witnessed modest decline (lt20) when largerbuffers are considered This comparison however does not capture the full history of fluctuations
Table 5 Summary of mangrove extents (area in sq km) during 1990 and 2016 for the four focus areasin the Sierra Leone coastal landscape complex Values in bold denote mangrove gain while values inred italic denote mangrove loss during 1990ndash2016 The lsquoSierra Leone coastal landscape complexrsquo refersto all the mangroves along the full length of the coast not only in the buffers in the four areas
Region 1 km Buffer 25 km Buffer 5 km Buffer
1990 2016Change(RelativeChange)
1990 2016Change(RelativeChange)
1990 2016Change(RelativeChange)
Scarcies RiverEstuary 3195 1735 minus1460
(minus46) 7343 4238 minus3105(minus42) 14258 9039 minus5219
(minus37)
Sierra LeoneRiver Estuary 13187 16071 2884
(22) 21302 24901 3599(17) 26169 29055 2886
(11)
Yawri Bay 1434 1543 109(8) 6011 5505 minus506
(minus8) 13830 11398 minus2432(minus18)
Sherbro RiverEstuary 33682 35578 1896
(6) 59148 60554 1406(2) 76826 76299 minus527
(minus1)
1990 2016 Overall change(Relative change)
Sierra Leonecoastal
landscapecomplex
243482 183432 minus6005 (minus25)
As shown in Figure 5 mangrovesrsquo relative extent is the lowest in 2000 in each region and eachbuffer which is also the year where the other types of vegetation and waterwetland combined coverthe largest area Subsequently in 2010 the relative mangrove extent increases back to the extents from1990 in nearly all cases with the exception of Yawri Bay Then it remains stable in Sherbro and YawriBay while it continues to increase in SLRE In the Scarcies on the other hand it decreases again in2016 to the extent similar to that in 2000
Figure 6 further highlights decadal changes in mangrove extents in the SLCLC The largest lossof mangroves in the Scarcies region is observed between 1990 and 2000 and is mostly located in thesouth-eastern part of the Scarcies region and along the Greater Scarcies River (Figure 6a) while the
Sensors 2018 18 12 11 of 15
loss between 2010 and 2016 mostly happened in the northern part of the region (Figure 6c) In otherparts of the SLCLC signs of non-clustered deforestation are present in pre- and post-2000 years withthe exception of Southern Yawri Bay In general the Scarcies and Yawri Bay seem to undergo largestmangrove fluctuations between years
Sensors 2018 18 12 11 of 15
Figure 6 Decadal changes in mangrove extents in the Sierra Leone coastal landscape complex (SLCLC) during (a) 1990ndash2000 (b) 2000ndash2010 (c) 2010ndash2016
4 Discussion and Conclusions
This study based on a discrete classification of Landsat pixels provides an estimate of 152642 km2 mangrove extent for 2000 that is similar to the estimates provided by [1] While a continuous classification approach can as argued by [41] provide more accurate estimates it is almost impossible to apply for historical land cover analyses in the absence of existing maps with known accuracy or extensive field data from earlier years Therefore it could not be applied in our study aimed at estimating the evolution of the mangrove extents in Sierra Leone Our study relies solely on dominant spectral signature within a single pixel (30 m times 30 m) for a discrete classification ie presenceabsence of a certain class While it is possible that our study overestimates mangrove coverage in the SLCLC because of the way discrete classification works our approach allows us to provide important insights into decadal changes in spatial patterns in mangrove forests Besides our findings agree with those from the past studies that showed an increase in mangrove extents after 2000 [541]
As shown in Figures 5 and 6b all four focus areas witnessed an increase in mangrove extents in all three buffer zones between 2000 and 2010 However only SLRE witnessed an increase in mangrove area post-2010 most probably as a result of reforestation efforts Considering the overall changes during 1990ndash2016 mangroves have declined only in the farthest buffer in the Sherbro and Yawri Bay regions pointing to the possible reclaiming of the land and expansion of agriculture by the communities living inland The Scarcies region underwent the most extensive mangrove loss among all the areas (Table 5) but in different locations for pre-2000 and post-2010 time periods (Figure 6) In both cases the most probable cause is the conversion of mangroves to rice paddies However the rapid recovery of the mangroves over a period of 10 years between 2000 and 2010 in some areas is more indicative of degradation or lsquothinning outrsquo during the periods prior to 2000 rather than a complete deforestation While causality is difficult to attribute the decade of the 1990s was also a period of civil war which may have heightened dependence on mangrove forests for fuel wood charcoal production and construction andor weakened conservation and protection measures These findings especially the overall patterns in change can particularly benefit regional andor national policy-makers in drafting coastal conservation policies
It is important to note that it is challenging to distinguish between wetlands and sparse mangrove forests because of the inherent limitations of optical remote sensing in terms of the spectral and spatial resolution especially in tropical countries with frequent cloud cover Hence it is possible that a pixel with sparse mangrove cover will record a spectral signature of the underlying water that is dominant within that pixel and thus be classified as waterwetland A validation check with high-resolution images from 2016 indeed confirms that the area along and surrounding the Scarcies river hosts young and sparsely distributed mangroves rather than a complete clear-cut of
Figure 6 Decadal changes in mangrove extents in the Sierra Leone coastal landscape complex (SLCLC)during (a) 1990ndash2000 (b) 2000ndash2010 (c) 2010ndash2016
4 Discussion and Conclusions
This study based on a discrete classification of Landsat pixels provides an estimate of 152642 km2
mangrove extent for 2000 that is similar to the estimates provided by [1] While a continuousclassification approach can as argued by [41] provide more accurate estimates it is almost impossibleto apply for historical land cover analyses in the absence of existing maps with known accuracyor extensive field data from earlier years Therefore it could not be applied in our study aimed atestimating the evolution of the mangrove extents in Sierra Leone Our study relies solely on dominantspectral signature within a single pixel (30 m times 30 m) for a discrete classification ie presenceabsenceof a certain class While it is possible that our study overestimates mangrove coverage in the SLCLCbecause of the way discrete classification works our approach allows us to provide important insightsinto decadal changes in spatial patterns in mangrove forests Besides our findings agree with thosefrom the past studies that showed an increase in mangrove extents after 2000 [541]
As shown in Figures 5 and 6b all four focus areas witnessed an increase in mangrove extents inall three buffer zones between 2000 and 2010 However only SLRE witnessed an increase in mangrovearea post-2010 most probably as a result of reforestation efforts Considering the overall changesduring 1990ndash2016 mangroves have declined only in the farthest buffer in the Sherbro and YawriBay regions pointing to the possible reclaiming of the land and expansion of agriculture by thecommunities living inland The Scarcies region underwent the most extensive mangrove loss amongall the areas (Table 5) but in different locations for pre-2000 and post-2010 time periods (Figure 6)In both cases the most probable cause is the conversion of mangroves to rice paddies However therapid recovery of the mangroves over a period of 10 years between 2000 and 2010 in some areas is moreindicative of degradation or lsquothinning outrsquo during the periods prior to 2000 rather than a completedeforestation While causality is difficult to attribute the decade of the 1990s was also a period of civilwar which may have heightened dependence on mangrove forests for fuel wood charcoal productionand construction andor weakened conservation and protection measures These findings especiallythe overall patterns in change can particularly benefit regional andor national policy-makers indrafting coastal conservation policies
Sensors 2018 18 12 12 of 15
It is important to note that it is challenging to distinguish between wetlands and sparse mangroveforests because of the inherent limitations of optical remote sensing in terms of the spectral and spatialresolution especially in tropical countries with frequent cloud cover Hence it is possible that a pixelwith sparse mangrove cover will record a spectral signature of the underlying water that is dominantwithin that pixel and thus be classified as waterwetland A validation check with high-resolutionimages from 2016 indeed confirms that the area along and surrounding the Scarcies river hosts youngand sparsely distributed mangroves rather than a complete clear-cut of dense mangrove forests Eventhough high-resolution satellite images do not exist for earlier years for validation purposes it ispossible that mangrove forests in the Scarcies region witnessed degradation or lsquothinning outrsquo during1990ndash2000 rather than a complete deforestation Thus the fluctuations in mangrove extents as shownin Figure 6 possibly represent alternate thinning and reforestation This is consistent with the highregeneration potential observed on field visits to the Scarcies region
To be useful at large scale satellite-based assessment of mangrove cover needs to be complementedby in-situ evaluation of the quality of the forests The field trips during summer 2016 indicate thatdespite degradation the remaining mangroves in the Scarcies region show higher species diversity(relative to other regions in Sierra Leone) and high regeneration level thus indicating human pressureon the forests but also high regeneration potential should human pressures be lowered or bettermanaged This is further supported by the fluctuations in mangrove forest cover from dense to sparseto dense estimated in this study The Sherbro area is on the opposite side of the spectrum with lowestspecies diversity highly dominated by Rhizophora racemosa These mangroves are also the oldest amongthe four areas and have the lowest regeneration rates with little disturbance in the forests Theseforests while with high commercial potential exhibit low adaptation potential to future potentiallyaltered climatic conditions The SLRE has the smallest trees with the lowest basal area pointing toyoungest forests sign of past and current exploitation of the forest as well as recent reforestation effortsThe Yawri Bay has fewer adult trees but the highest number of seedlings both showing signs of goodpotential for regeneration and sustainability
Overall despite a noticeable overall long term decrease of the mangrove cover in Sierra Leonea closer look at mangrove evolution shows a good potential for conservation if properly monitoredand managed Conserving the fluctuating mangroves in the SLCLC would require a carefullydesigned management plan involving current and alternative livelihood strategies sustainable resourcemanagement schemes at local and national levels and sensitization of the populations about mangroveservices and their value under climate change beyond responding to communitiesrsquo immediate needsAmong the coastal populations fishing communities are the ones that will be the most affected bythe decline in mangroves yet are also the ones who currently rely on mangroves the most for theirlivelihoods These populations exhibit low livelihood diversification mostly revolving around fishingand fish processing with some contribution from agriculture and petty trade [52] The SLRE hasslightly higher diversification of livelihood strategies largely due to the proximity of Freetown andslightly higher grounds In the Scarcies and Sherbro regions alternative or supplementary livelihoodopportunities are quasi non-existent In most of the communities visited during field trips mangrovesare also open-access and individuals can access ownership by lsquoadding valuersquo to the land which inmost cases translates into clearing the mangroves for rice cultivation Existing community-basedmanagement initiatives seem to be mostly geared towards short term economic benefits from landscovered by mangroves rather than driven by holistic long term plans that include a wide range ofservices provided to a wide range of populations that would insure sustainability of the resource andfishing livelihoods While projects aimed at mangrove conservation could benefit from the existingmanagement structures significant change to the management goals would be required
Acknowledgments This work is made possible by the generous support of the American People through theUnited States Agency for International Development (USAID) The contents of this work are the sole responsibilityof its authors and do not necessarily reflect the views of USAID or the United States Government We acknowledgethe contributions of Zebedee Njisuh Aiah Lebbie Samuel Weekes George Ganda Michael Balinga Paola
Sensors 2018 18 12 13 of 15
Kim-Blanco Valentina Mara Emilie Schnarr Malanding Jaiteh and the field research team We thank theanonymous reviewers for their constructive feedback
Author Contributions PM and AdS conceived and designed the study ST designed and conducted field-workPM analyzed the data PM and ST wrote the paper
Conflicts of Interest The authors declare no conflict of interest
References
1 Giri C Ochieng E Tieszen LL Zhu Z Singh A Loveland T Masek J Duke N Status and distributionof mangrove forests of the world using earth observation satellite data Glob Ecol Biogeogr 2011 20 154ndash159[CrossRef]
2 Murdiyarso D Purbopuspito J Kauffman JB Warren MW Sasmito SD Donato DC Manuri SKrisnawati H Taberima S Kurnianto S The potential of Indonesian mangrove forests for global climatechange mitigation Nat Clim Chang 2015 5 1089ndash1092 [CrossRef]
3 Danielsen F Soslashrensen MK Olwig MF Selvam V Parish F Burgess ND Hiraishi TKarunagaran VM Rasmussen MS Hansen LB The Asian tsunami A protective role for coastalvegetation Science 2005 310 643 [CrossRef] [PubMed]
4 Kathiresan K Rajendran N Coastal mangrove forests mitigated tsunami Estuar Coast Shelf Sci 2005 65601ndash606 [CrossRef]
5 FAO The Worldrsquos Mangroves 1980ndash2005 FAO Rome Italy 20076 Ellison JC Climate Change Vulnerability Assessment and Adaptation Planning for Mangrove Systems World
Wildlife Fund (WWF) Washington DC USA 20127 Blasco F Gauquelin T Rasolofoharinoro M Denis J Aizpuru M Caldairou V Recent advances in
mangrove studies using remote sensing data Mar Freshw Res 1998 49 287ndash296 [CrossRef]8 Giri C Observation and Monitoring of Mangrove Forests Using Remote Sensing Opportunities and
Challenges Remote Sens 2016 8 783 [CrossRef]9 Heumann BW Satellite remote sensing of mangrove forests Recent advances and future opportunities
Prog Phys Geogr 2011 35 87ndash108 [CrossRef]10 Almahasheer H Aljowair A Duarte CM Irigoien X Decadal stability of Red Sea mangroves Estuar
Coast Shelf Sci 2016 169 164ndash172 [CrossRef]11 Dan TT Chen CF Chiang SH Ogawa S Mapping and change analysis in mangrove forest by using
Landsat imagery In Xxiii Isprs Congress Commission Viii Halounova L Safar V Raju PLN Planka LZdimal V Kumar TS Faruque FS Kerr Y Ramasamy SM Comiso J et al Eds CopernicusGesellschaft MBH Gottingen Germany 2016 Volume 3 pp 109ndash116
12 Dutta D Das PK Paul S Sharma JR Dadhwal VK Assessment of ecological disturbance in themangrove forest of Sundarbans caused by cyclones using MODIS time-series data (2001ndash2011) Nat Hazards2015 79 775ndash790 [CrossRef]
13 Dutta D Das PK Paul S Sharma JR Dhadwal VK Spatio-temporal assessment of ecologicaldisturbance and its intensity in the mangrove forest using MODIS derived disturbance index In ISPRSTechnical Commission Viii Symposium Dadhwal VK Diwakar PG Seshasai MVR Raju PLN Hakeem AEds Copernicus Gesellschaft MBH Gottingen Germany 2014 Volume XL-8 pp 555ndash559
14 Fatoyinbo TE Simard M Washington-Allen RA Shugart HH Landscape-scale extent heightbiomass and carbon estimation of Mozambiquersquos mangrove forests with Landsat ETM+ and Shuttle RadarTopography Mission elevation data J Geophys Res Biogeosci 2008 113 [CrossRef]
15 Fromard F Vega C Proisy C Half a century of dynamic coastal change affecting mangrove shorelines ofFrench Guiana A case study based on remote sensing data analyses and field surveys Mar Geol 2004 208265ndash280 [CrossRef]
16 Ghosh MK Kumar L Roy C Mapping Long-Term Changes in Mangrove Species Composition andDistribution in the Sundarbans Forests 2016 7 305 [CrossRef]
17 Giri C Long J Abbas S Murali RM Qamer FM Pengra B Thau D Distribution and dynamics ofmangrove forests of South Asia J Environ Manag 2015 148 101ndash111 [CrossRef] [PubMed]
18 Giri C Muhlhausen J Mangrove forest distributions and dynamics in Madagascar (1975ndash2005) Sensors2008 8 2104ndash2117 [CrossRef] [PubMed]
Sensors 2018 18 12 14 of 15
19 Hamilton S Assessing the role of commercial aquaculture in displacing mangrove forest Bull Mar Sci2013 89 585ndash601 [CrossRef]
20 Hirata Y Tabuchi R Patanaponpaiboon P Poungparn S Yoneda R Fujioka Y Estimation ofaboveground biomass in mangrove forests using high-resolution satellite data J For Res 2014 19 34ndash41[CrossRef]
21 Kamal M Phinn S Johansen K Object-Based Approach for Multi-Scale Mangrove Composition MappingUsing Multi-Resolution Image Datasets Remote Sens 2015 7 4753ndash4783 [CrossRef]
22 Kamthonkiat D Rodfai C Saiwanrungkul A Koshimura S Matsuoka M Geoinformatics in mangrovemonitoring Damage and recovery after the 2004 Indian Ocean tsunami in Phang Nga Thailand Nat HazardsEarth Syst Sci 2011 11 1851ndash1862 [CrossRef]
23 Kanniah KD Sheikhi A Cracknell AP Goh HC Tan KP Ho CS Rasli FN Satellite Images forMonitoring Mangrove Cover Changes in a Fast Growing Economic Region in Southern Peninsular MalaysiaRemote Sens 2015 7 14360ndash14385 [CrossRef]
24 Kirui KB Kairo JG Bosire J Viergever KM Rudra S Huxham M Briers RA Mapping of mangroveforest land cover change along the Kenya coastline using Landsat imagery Ocean Coast Manag 2013 8319ndash24 [CrossRef]
25 Kovacs JM de Santiago FF Bastien J Lafrance P An Assessment of Mangroves in Guinea West AfricaUsing a Field and Remote Sensing Based Approach Wetlands 2010 30 773ndash782 [CrossRef]
26 Kuenzer C van Beijma S Gessner U Dech S Land surface dynamics and environmental challenges ofthe Niger Delta Africa Remote sensing-based analyses spanning three decades (1986ndash2013) Appl Geogr2014 53 354ndash368 [CrossRef]
27 Leimgruber P Kelly DS Steininger MK Brunner J Muller T Songer M Forest cover change patternsin Myanmar (Burma) 1990ndash2000 Environ Conserv 2005 32 356ndash364 [CrossRef]
28 LeMarie M van der Zaag P Menting G Bacluete E Schotanus D The use of remote sensing formonitoring environmental indicators The case of the Incomati estuary Mozambique Phys Chem Earth2006 31 857ndash863 [CrossRef]
29 Liu K Liu L Liu HX Li X Wang SG Exploring the effects of biophysical parameters on the spatialpattern of rare cold damage to mangrove forests Remote Sens Environ 2014 150 20ndash33 [CrossRef]
30 Macamo CCF Massuanganhe E Nicolau DK Bandeira SO Adams JB Mangroversquos response tocyclone Eline (2000) What is happening 14 years later Aquat Bot 2016 134 10ndash17 [CrossRef]
31 Manna S Mondal PP Mukhopadhyay A Akhand A Hazra S Mitra D Vegetation cover changeanalysis from multi-temporal satellite data in Jharkhali Island Sundarbans India Indian J Geo-Mar Sci2013 42 331ndash342
32 Misra A Murali RM Vethamony P Assessment of the land useland cover (LULC) and mangrovechanges along the Mandovi-Zuari estuarine complex of Goa India Arab J Geosci 2015 8 267ndash279[CrossRef]
33 Monzon AK Reyes SR Veridiano RK Tumaneng R De Alban JD Synergy of optical and SAR datafor mapping and monitoring mangroves In XXIII ISPRS Congress Commission VI Halounova L Safar VGong J Hanzl V Wu H Vyas A Wang L Musikhin I Tsai F Gruen A et al Eds CopernicusGesellschaft MBH Gottingen Germany 2016 Volume 41 pp 259ndash266
34 Omo-Irabor OO Olobaniyi SB Akunna J Venus V Maina JM Paradzayi C Mangrove vulnerabilitymodelling in parts of Western Niger Delta Nigeria using satellite images GIS techniques and SpatialMulti-Criteria Analysis (SMCA) Environ Monit Assess 2011 178 39ndash51 [CrossRef] [PubMed]
35 Otero V Quisthoudt K Koedam N Dahdouh-Guebas F Mangroves at Their Limits Detection and AreaEstimation of Mangroves along the Sahara Desert Coast Remote Sens 2016 8 512 [CrossRef]
36 Reddy CS Satish KV Pasha SV Jha CS Dadhwal VK Assessment and monitoring of deforestationand land-use changes (1976ndash2014) in Andaman and Nicobar Islands India using remote sensing and GISCurr Sci 2016 111 1492ndash1499 [CrossRef]
37 Salami AT Akinyede J de Gier A A preliminary assessment of NigeriaSat-1 for sustainable mangroveforest monitoring Int J Appl Earth Obs Geoinf 2010 12 S18ndashS22 [CrossRef]
38 Seto KC Fragkias M Mangrove conversion and aquaculture development in Vietnam A remotesensing-based approach for evaluating the Ramsar Convention on Wetlands Glob Environ Chang 2007 17486ndash500 [CrossRef]
Sensors 2018 18 12 15 of 15
39 Shapiro AC Trettin CC Kuchly H Alavinapanah S Bandeira S The Mangroves of the Zambezi DeltaIncrease in Extent Observed via Satellite from 1994 to 2013 Remote Sens 2015 7 16504ndash16518 [CrossRef]
40 Wang L Sousa WP Gong P Integration of object-based and pixel-based classification for mappingmangroves with IKONOS imagery Int J Remote Sens 2004 25 5655ndash5668 [CrossRef]
41 Hamilton SE Casey D Creation of a high spatio-temporal resolution global database of continuousmangrove forest cover for the 21st century (CGMFC-21) Glob Ecol Biogeogr 2016 25 729ndash738 [CrossRef]
42 Olson DM Dinerstein E Wikramanayake ED Burgess ND Powell GVN Underwood ECDrsquoamico JA Itoua I Strand HE Morrison JC et al Terrestrial ecoregions of the world A newmap of life on earth A new global map of terrestrial ecoregions provides an innovative tool for conservingbiodiversity BioScience 2001 51 933ndash938 [CrossRef]
43 Spalding M Kainuma M Collins L World Atlas of Mangroves Earthscan London UK 201044 Hansen MC Potapov PV Moore R Hancher M Turubanova SA Tyukavina A Thau D
Stehman SV Goetz SJ Loveland TR et al High-resolution global maps of 21st-century forest coverchange Science 2013 342 850ndash853 [CrossRef] [PubMed]
45 Fatoyinbo TE Simard M Height and biomass of mangroves in Africa from ICESatGLAS and SRTM Int JRemote Sens 2013 34 668ndash681 [CrossRef]
46 World Bank World Development Indicators Available online httpdatabankworldbankorgdatareportsaspxsource=2ampcountry=SLE (accessed on 31 July 2017)
47 Blinker L Country Environment Profile (CEP) Sierra Leone European Commission Cardiff UK 200648 GoSL (Government of Sierra Leone) Conservation and Wildlife Policy 2010 Government of Sierra Leone
Freetown Sierra Leone 201049 Heymans JJ Vakily JM Structure and Dynamics of the Marine Ecosystem off Sierra Leone for Three Time Periods
1964 1978 1990 Fisheries Centre UBC Vancouver BC Canada 200450 GCLME (Guinea Current Large Marine Ecosystem) Regional Coordinating Unit In Towards Ecosystem-Based
Management of the Guinea Current Large Marine Ecosystem United Nations Development Programme (UNDP)New York NY USA 2013
51 IUCN Strategies for Conservation and Sustainable Management of Mangrove Forest in Sierra Leone IUCN GlandSwitzerland 2007
52 Trzaska S de Sherbinin A Kim-Blanco P Mara V Schnarr E Jaiteh M Mondal P Climate ChangeVulnerability Assessment in Mangrove Regions of Sierra Leone USAID Washington DC USA 2017 Availableonline httpwwwciesincolumbiaeduwa-biccwa-bicc-ccva-abridged-ffpdf (accessed on 20 December2017)
53 Chander G Markham BL Helder DL Summary of current radiometric calibration coefficients for LandsatMSS TM ETM+ and EO-1 ALI sensors Remote Sens Environ 2009 113 893ndash903 [CrossRef]
54 Zhu Z Wang S Woodcock CE Improvement and expansion of the Fmask algorithm Cloud cloudshadow and snow detection for Landsats 4ndash7 8 and Sentinel 2 images Remote Sens Environ 2015 159269ndash277 [CrossRef]
55 Zhu Z Woodcock CE Object-based cloud and cloud shadow detection in Landsat imagery Remote SensEnviron 2012 118 83ndash94 [CrossRef]
56 GitHub fmask Available online httpsgithubcomprs021fmask (accessed on 31 July 2017)57 Arthur D Vassilvitskii S k-means++ The advantages of careful seeding In Proceedings of the eighteenth
Annual ACM-SIAM Symposium on Discrete Algorithms Society for Industrial and Applied MathematicsNew Orleans Louisiana 7ndash9 January 2007 pp 1027ndash1035
copy 2017 by the authors Licensee MDPI Basel Switzerland This article is an open accessarticle distributed under the terms and conditions of the Creative Commons Attribution(CC BY) license (httpcreativecommonsorglicensesby40)

Sensors 2018 18 12 8 of 15
away from the coastline are considered (Table 4) The Sherbro region has the largest area covered withmangroves among the four focus areas while mangrove cover has the smallest absolute extent in theScarcies region (except within 1 km buffer) Further investigation of the spatial distribution of themangroves shows that in SLRE and Sherbro regions considerable portions of the coastline is coveredwith mangroves (Figure 4bc) whereas in Yawri Bay mangroves are concentrated along the main rivers(Figure 4c)
Sensors 2018 18 12 8 of 15
covered with mangroves (Figure 4bc) whereas in Yawri Bay mangroves are concentrated along the main rivers (Figure 4c)
Figure 4 (a) Spatial distribution of the four land cover classes across the Sierra Leone coastal landscape complex for 2016 Panels show mangrove extents in (b) northern Sierra Leone (Scarcies River Estuary and Sierra Leone River Estuary) and (c) southern Sierra Leone (Yawri Bay and Sherbro River Estuary)
Table 4 Estimated mangrove cover in 2016 within different buffers for the four focus areas in Sierra Leone
Region 1 km Buffer 25 km Buffer 5 km Buffer
Mangrove
Area (sq km)
Relative Mangrove
Extent
Mangrove Area
(sq km)
Relative Mangrove
Extent
Mangrove Area
(sq km)
Relative Mangrove
Extent Scarcies River
Estuary 1735 36 4238 36 9039 37
Sierra Leone River Estuary
16071 48 24901 36 29055 26
Yawri Bay 1543 51 5505 51 11398 45 Sherbro River
Estuary 35578 68 60554 56 76299 44
33 Land Cover Changes within the Focus Areas
Figure 5 further summarizes the spatiotemporal changes of the different land cover classes between different time slices In the Scarcies region mangroves remained the most dominant land cover (Figure 5) However the Scarcies witnessed fluctuations in mangrove extents with more mangroves during 1990 (66 within 1 km 65 within 25 km 59 within 5 km) and 2010 (56 within 1 km 57 within 25 km 58 within 5 km) Mangrove extents declined in this region during 2000 (43 within 1 km 38 within 25 km 34 within 5 km) and 2016 (36 both within 1 km and 25 km 37 within 5 km) mostly owing to an increase in waterwetland (Figure 5) Built areabare
Figure 4 (a) Spatial distribution of the four land cover classes across the Sierra Leone coastal landscapecomplex for 2016 Panels show mangrove extents in (b) northern Sierra Leone (Scarcies River Estuaryand Sierra Leone River Estuary) and (c) southern Sierra Leone (Yawri Bay and Sherbro River Estuary)
Table 4 Estimated mangrove cover in 2016 within different buffers for the four focus areas inSierra Leone
Region 1 km Buffer 25 km Buffer 5 km Buffer
MangroveArea
(sq km)
RelativeMangrove
Extent
MangroveArea
(sq km)
RelativeMangrove
Extent
MangroveArea
(sq km)
RelativeMangrove
Extent
Scarcies RiverEstuary 1735 36 4238 36 9039 37
Sierra Leone RiverEstuary 16071 48 24901 36 29055 26
Yawri Bay 1543 51 5505 51 11398 45
Sherbro RiverEstuary 35578 68 60554 56 76299 44
Sensors 2018 18 12 9 of 15
33 Land Cover Changes within the Focus Areas
Figure 5 further summarizes the spatiotemporal changes of the different land cover classesbetween different time slices In the Scarcies region mangroves remained the most dominant land cover(Figure 5) However the Scarcies witnessed fluctuations in mangrove extents with more mangrovesduring 1990 (66 within 1 km 65 within 25 km 59 within 5 km) and 2010 (56 within 1 km57 within 25 km 58 within 5 km) Mangrove extents declined in this region during 2000 (43within 1 km 38 within 25 km 34 within 5 km) and 2016 (36 both within 1 km and 25 km 37within 5 km) mostly owing to an increase in waterwetland (Figure 5) Built areabare soil more thandoubled during post-2000 years increasing from 8 to 18 both within 1 km and 25 km and from 6to 14 within 5 km
Sensors 2018 18 12 9 of 15
soil more than doubled during post-2000 years increasing from 8 to 18 both within 1 km and 25 km and from 6 to 14 within 5 km
Figure 5 Relative extents of different land covers within the four focus areas during 1990ndash2016 Panels show mangrove extents within buffers of (a) 1 km (b) 25 km (c) 5 km extending inland from the coastline
In the SLRE region other vegetation (eg forest plantation farmland etc) has been the most dominant land cover over the past 26 years except for the 1 km buffer zone where mangrove was the most dominant land cover in the years of 1990 2010 and 2016 (Figure 5) Other vegetation coverage ranged between (i) 27 in 1990 and 49 in 2000 within the 1 km buffer (ii) 39 in 1990 and 60 in 2000 within 25 km buffer and (iii) 51 in 1990 and 69 in 2000 within 5 km buffer Waterwetland coverage ranged between 5 and 21 across years and buffer zones with more coverage closer to the coastline Built area or bare soil ranged between 4 and 14 across space and time with minimum coverage in 2000 and maximum coverage in 2010
In the Yawri Bay region mangroves covered the most area across the years and buffer zones except for in 2000 with (i) both wetlandswater and other vegetation covering more area than the mangroves within 1 km buffer and (ii) other vegetation covering more area in 5 km buffer (Figure 5) Waterwetland has declined over time (eg 14 in 1990 to 2 in 2016 within 1 km) within all three buffer zones with an increase during 2000 Built areabare soil increased over time (19 to 27 within 1 km 14 to 22 within 25 km and 11 to 18 within 5 km) with a decline in between for all three buffer zones
As with the Scarcies region mangroves remained the dominant land cover in the Sherbro region with an estimated area covering 68 within 1 km 56 within 25 km and 44 within 5 km buffer zones in 2016 (Table 4) The only exception is within 5 km buffer zone in 2000 (Figure 5) when other vegetation covered more area (46) than mangroves (37) The other two land covers remained relatively stable throughout the years and covered less area (~10) compared to mangroves and other vegetation The findings from the field visits during summer 2016 showed that
Figure 5 Relative extents of different land covers within the four focus areas during 1990ndash2016Panels show mangrove extents within buffers of (a) 1 km (b) 25 km (c) 5 km extending inland fromthe coastline
In the SLRE region other vegetation (eg forest plantation farmland etc) has been the mostdominant land cover over the past 26 years except for the 1 km buffer zone where mangrove was themost dominant land cover in the years of 1990 2010 and 2016 (Figure 5) Other vegetation coverageranged between (i) 27 in 1990 and 49 in 2000 within the 1 km buffer (ii) 39 in 1990 and 60 in2000 within 25 km buffer and (iii) 51 in 1990 and 69 in 2000 within 5 km buffer Waterwetlandcoverage ranged between 5 and 21 across years and buffer zones with more coverage closer to thecoastline Built area or bare soil ranged between 4 and 14 across space and time with minimumcoverage in 2000 and maximum coverage in 2010
In the Yawri Bay region mangroves covered the most area across the years and buffer zonesexcept for in 2000 with (i) both wetlandswater and other vegetation covering more area than themangroves within 1 km buffer and (ii) other vegetation covering more area in 5 km buffer (Figure 5)Waterwetland has declined over time (eg 14 in 1990 to 2 in 2016 within 1 km) within all three
Sensors 2018 18 12 10 of 15
buffer zones with an increase during 2000 Built areabare soil increased over time (19 to 27 within1 km 14 to 22 within 25 km and 11 to 18 within 5 km) with a decline in between for all threebuffer zones
As with the Scarcies region mangroves remained the dominant land cover in the Sherbro regionwith an estimated area covering 68 within 1 km 56 within 25 km and 44 within 5 km bufferzones in 2016 (Table 4) The only exception is within 5 km buffer zone in 2000 (Figure 5) when othervegetation covered more area (46) than mangroves (37) The other two land covers remainedrelatively stable throughout the years and covered less area (~10) compared to mangroves and othervegetation The findings from the field visits during summer 2016 showed that the Sherbro area iscovered with largest and oldest trees indicating less degradation over past decades than in other areasand explaining a relative stability of the mangrove cover over time
34 Spatiotemporal Changes in Mangrove Extents over the Last Three Decades
Table 5 shows the overall change in mangrove cover between 1990 and 2016 in each focus areafor different buffers The largest decline is observed in the Scarcies for all buffers up to 46 in the1 km buffer The SLRE has experienced an increase of about 22 in the 1 km buffer The Sherbro andYawri Bay regions experienced slight expansion (lt10) of the mangroves when the narrowest bufferclosest to the sea shore is considered These two regions witnessed modest decline (lt20) when largerbuffers are considered This comparison however does not capture the full history of fluctuations
Table 5 Summary of mangrove extents (area in sq km) during 1990 and 2016 for the four focus areasin the Sierra Leone coastal landscape complex Values in bold denote mangrove gain while values inred italic denote mangrove loss during 1990ndash2016 The lsquoSierra Leone coastal landscape complexrsquo refersto all the mangroves along the full length of the coast not only in the buffers in the four areas
Region 1 km Buffer 25 km Buffer 5 km Buffer
1990 2016Change(RelativeChange)
1990 2016Change(RelativeChange)
1990 2016Change(RelativeChange)
Scarcies RiverEstuary 3195 1735 minus1460
(minus46) 7343 4238 minus3105(minus42) 14258 9039 minus5219
(minus37)
Sierra LeoneRiver Estuary 13187 16071 2884
(22) 21302 24901 3599(17) 26169 29055 2886
(11)
Yawri Bay 1434 1543 109(8) 6011 5505 minus506
(minus8) 13830 11398 minus2432(minus18)
Sherbro RiverEstuary 33682 35578 1896
(6) 59148 60554 1406(2) 76826 76299 minus527
(minus1)
1990 2016 Overall change(Relative change)
Sierra Leonecoastal
landscapecomplex
243482 183432 minus6005 (minus25)
As shown in Figure 5 mangrovesrsquo relative extent is the lowest in 2000 in each region and eachbuffer which is also the year where the other types of vegetation and waterwetland combined coverthe largest area Subsequently in 2010 the relative mangrove extent increases back to the extents from1990 in nearly all cases with the exception of Yawri Bay Then it remains stable in Sherbro and YawriBay while it continues to increase in SLRE In the Scarcies on the other hand it decreases again in2016 to the extent similar to that in 2000
Figure 6 further highlights decadal changes in mangrove extents in the SLCLC The largest lossof mangroves in the Scarcies region is observed between 1990 and 2000 and is mostly located in thesouth-eastern part of the Scarcies region and along the Greater Scarcies River (Figure 6a) while the
Sensors 2018 18 12 11 of 15
loss between 2010 and 2016 mostly happened in the northern part of the region (Figure 6c) In otherparts of the SLCLC signs of non-clustered deforestation are present in pre- and post-2000 years withthe exception of Southern Yawri Bay In general the Scarcies and Yawri Bay seem to undergo largestmangrove fluctuations between years
Sensors 2018 18 12 11 of 15
Figure 6 Decadal changes in mangrove extents in the Sierra Leone coastal landscape complex (SLCLC) during (a) 1990ndash2000 (b) 2000ndash2010 (c) 2010ndash2016
4 Discussion and Conclusions
This study based on a discrete classification of Landsat pixels provides an estimate of 152642 km2 mangrove extent for 2000 that is similar to the estimates provided by [1] While a continuous classification approach can as argued by [41] provide more accurate estimates it is almost impossible to apply for historical land cover analyses in the absence of existing maps with known accuracy or extensive field data from earlier years Therefore it could not be applied in our study aimed at estimating the evolution of the mangrove extents in Sierra Leone Our study relies solely on dominant spectral signature within a single pixel (30 m times 30 m) for a discrete classification ie presenceabsence of a certain class While it is possible that our study overestimates mangrove coverage in the SLCLC because of the way discrete classification works our approach allows us to provide important insights into decadal changes in spatial patterns in mangrove forests Besides our findings agree with those from the past studies that showed an increase in mangrove extents after 2000 [541]
As shown in Figures 5 and 6b all four focus areas witnessed an increase in mangrove extents in all three buffer zones between 2000 and 2010 However only SLRE witnessed an increase in mangrove area post-2010 most probably as a result of reforestation efforts Considering the overall changes during 1990ndash2016 mangroves have declined only in the farthest buffer in the Sherbro and Yawri Bay regions pointing to the possible reclaiming of the land and expansion of agriculture by the communities living inland The Scarcies region underwent the most extensive mangrove loss among all the areas (Table 5) but in different locations for pre-2000 and post-2010 time periods (Figure 6) In both cases the most probable cause is the conversion of mangroves to rice paddies However the rapid recovery of the mangroves over a period of 10 years between 2000 and 2010 in some areas is more indicative of degradation or lsquothinning outrsquo during the periods prior to 2000 rather than a complete deforestation While causality is difficult to attribute the decade of the 1990s was also a period of civil war which may have heightened dependence on mangrove forests for fuel wood charcoal production and construction andor weakened conservation and protection measures These findings especially the overall patterns in change can particularly benefit regional andor national policy-makers in drafting coastal conservation policies
It is important to note that it is challenging to distinguish between wetlands and sparse mangrove forests because of the inherent limitations of optical remote sensing in terms of the spectral and spatial resolution especially in tropical countries with frequent cloud cover Hence it is possible that a pixel with sparse mangrove cover will record a spectral signature of the underlying water that is dominant within that pixel and thus be classified as waterwetland A validation check with high-resolution images from 2016 indeed confirms that the area along and surrounding the Scarcies river hosts young and sparsely distributed mangroves rather than a complete clear-cut of
Figure 6 Decadal changes in mangrove extents in the Sierra Leone coastal landscape complex (SLCLC)during (a) 1990ndash2000 (b) 2000ndash2010 (c) 2010ndash2016
4 Discussion and Conclusions
This study based on a discrete classification of Landsat pixels provides an estimate of 152642 km2
mangrove extent for 2000 that is similar to the estimates provided by [1] While a continuousclassification approach can as argued by [41] provide more accurate estimates it is almost impossibleto apply for historical land cover analyses in the absence of existing maps with known accuracyor extensive field data from earlier years Therefore it could not be applied in our study aimed atestimating the evolution of the mangrove extents in Sierra Leone Our study relies solely on dominantspectral signature within a single pixel (30 m times 30 m) for a discrete classification ie presenceabsenceof a certain class While it is possible that our study overestimates mangrove coverage in the SLCLCbecause of the way discrete classification works our approach allows us to provide important insightsinto decadal changes in spatial patterns in mangrove forests Besides our findings agree with thosefrom the past studies that showed an increase in mangrove extents after 2000 [541]
As shown in Figures 5 and 6b all four focus areas witnessed an increase in mangrove extents inall three buffer zones between 2000 and 2010 However only SLRE witnessed an increase in mangrovearea post-2010 most probably as a result of reforestation efforts Considering the overall changesduring 1990ndash2016 mangroves have declined only in the farthest buffer in the Sherbro and YawriBay regions pointing to the possible reclaiming of the land and expansion of agriculture by thecommunities living inland The Scarcies region underwent the most extensive mangrove loss amongall the areas (Table 5) but in different locations for pre-2000 and post-2010 time periods (Figure 6)In both cases the most probable cause is the conversion of mangroves to rice paddies However therapid recovery of the mangroves over a period of 10 years between 2000 and 2010 in some areas is moreindicative of degradation or lsquothinning outrsquo during the periods prior to 2000 rather than a completedeforestation While causality is difficult to attribute the decade of the 1990s was also a period of civilwar which may have heightened dependence on mangrove forests for fuel wood charcoal productionand construction andor weakened conservation and protection measures These findings especiallythe overall patterns in change can particularly benefit regional andor national policy-makers indrafting coastal conservation policies
Sensors 2018 18 12 12 of 15
It is important to note that it is challenging to distinguish between wetlands and sparse mangroveforests because of the inherent limitations of optical remote sensing in terms of the spectral and spatialresolution especially in tropical countries with frequent cloud cover Hence it is possible that a pixelwith sparse mangrove cover will record a spectral signature of the underlying water that is dominantwithin that pixel and thus be classified as waterwetland A validation check with high-resolutionimages from 2016 indeed confirms that the area along and surrounding the Scarcies river hosts youngand sparsely distributed mangroves rather than a complete clear-cut of dense mangrove forests Eventhough high-resolution satellite images do not exist for earlier years for validation purposes it ispossible that mangrove forests in the Scarcies region witnessed degradation or lsquothinning outrsquo during1990ndash2000 rather than a complete deforestation Thus the fluctuations in mangrove extents as shownin Figure 6 possibly represent alternate thinning and reforestation This is consistent with the highregeneration potential observed on field visits to the Scarcies region
To be useful at large scale satellite-based assessment of mangrove cover needs to be complementedby in-situ evaluation of the quality of the forests The field trips during summer 2016 indicate thatdespite degradation the remaining mangroves in the Scarcies region show higher species diversity(relative to other regions in Sierra Leone) and high regeneration level thus indicating human pressureon the forests but also high regeneration potential should human pressures be lowered or bettermanaged This is further supported by the fluctuations in mangrove forest cover from dense to sparseto dense estimated in this study The Sherbro area is on the opposite side of the spectrum with lowestspecies diversity highly dominated by Rhizophora racemosa These mangroves are also the oldest amongthe four areas and have the lowest regeneration rates with little disturbance in the forests Theseforests while with high commercial potential exhibit low adaptation potential to future potentiallyaltered climatic conditions The SLRE has the smallest trees with the lowest basal area pointing toyoungest forests sign of past and current exploitation of the forest as well as recent reforestation effortsThe Yawri Bay has fewer adult trees but the highest number of seedlings both showing signs of goodpotential for regeneration and sustainability
Overall despite a noticeable overall long term decrease of the mangrove cover in Sierra Leonea closer look at mangrove evolution shows a good potential for conservation if properly monitoredand managed Conserving the fluctuating mangroves in the SLCLC would require a carefullydesigned management plan involving current and alternative livelihood strategies sustainable resourcemanagement schemes at local and national levels and sensitization of the populations about mangroveservices and their value under climate change beyond responding to communitiesrsquo immediate needsAmong the coastal populations fishing communities are the ones that will be the most affected bythe decline in mangroves yet are also the ones who currently rely on mangroves the most for theirlivelihoods These populations exhibit low livelihood diversification mostly revolving around fishingand fish processing with some contribution from agriculture and petty trade [52] The SLRE hasslightly higher diversification of livelihood strategies largely due to the proximity of Freetown andslightly higher grounds In the Scarcies and Sherbro regions alternative or supplementary livelihoodopportunities are quasi non-existent In most of the communities visited during field trips mangrovesare also open-access and individuals can access ownership by lsquoadding valuersquo to the land which inmost cases translates into clearing the mangroves for rice cultivation Existing community-basedmanagement initiatives seem to be mostly geared towards short term economic benefits from landscovered by mangroves rather than driven by holistic long term plans that include a wide range ofservices provided to a wide range of populations that would insure sustainability of the resource andfishing livelihoods While projects aimed at mangrove conservation could benefit from the existingmanagement structures significant change to the management goals would be required
Acknowledgments This work is made possible by the generous support of the American People through theUnited States Agency for International Development (USAID) The contents of this work are the sole responsibilityof its authors and do not necessarily reflect the views of USAID or the United States Government We acknowledgethe contributions of Zebedee Njisuh Aiah Lebbie Samuel Weekes George Ganda Michael Balinga Paola
Sensors 2018 18 12 13 of 15
Kim-Blanco Valentina Mara Emilie Schnarr Malanding Jaiteh and the field research team We thank theanonymous reviewers for their constructive feedback
Author Contributions PM and AdS conceived and designed the study ST designed and conducted field-workPM analyzed the data PM and ST wrote the paper
Conflicts of Interest The authors declare no conflict of interest
References
1 Giri C Ochieng E Tieszen LL Zhu Z Singh A Loveland T Masek J Duke N Status and distributionof mangrove forests of the world using earth observation satellite data Glob Ecol Biogeogr 2011 20 154ndash159[CrossRef]
2 Murdiyarso D Purbopuspito J Kauffman JB Warren MW Sasmito SD Donato DC Manuri SKrisnawati H Taberima S Kurnianto S The potential of Indonesian mangrove forests for global climatechange mitigation Nat Clim Chang 2015 5 1089ndash1092 [CrossRef]
3 Danielsen F Soslashrensen MK Olwig MF Selvam V Parish F Burgess ND Hiraishi TKarunagaran VM Rasmussen MS Hansen LB The Asian tsunami A protective role for coastalvegetation Science 2005 310 643 [CrossRef] [PubMed]
4 Kathiresan K Rajendran N Coastal mangrove forests mitigated tsunami Estuar Coast Shelf Sci 2005 65601ndash606 [CrossRef]
5 FAO The Worldrsquos Mangroves 1980ndash2005 FAO Rome Italy 20076 Ellison JC Climate Change Vulnerability Assessment and Adaptation Planning for Mangrove Systems World
Wildlife Fund (WWF) Washington DC USA 20127 Blasco F Gauquelin T Rasolofoharinoro M Denis J Aizpuru M Caldairou V Recent advances in
mangrove studies using remote sensing data Mar Freshw Res 1998 49 287ndash296 [CrossRef]8 Giri C Observation and Monitoring of Mangrove Forests Using Remote Sensing Opportunities and
Challenges Remote Sens 2016 8 783 [CrossRef]9 Heumann BW Satellite remote sensing of mangrove forests Recent advances and future opportunities
Prog Phys Geogr 2011 35 87ndash108 [CrossRef]10 Almahasheer H Aljowair A Duarte CM Irigoien X Decadal stability of Red Sea mangroves Estuar
Coast Shelf Sci 2016 169 164ndash172 [CrossRef]11 Dan TT Chen CF Chiang SH Ogawa S Mapping and change analysis in mangrove forest by using
Landsat imagery In Xxiii Isprs Congress Commission Viii Halounova L Safar V Raju PLN Planka LZdimal V Kumar TS Faruque FS Kerr Y Ramasamy SM Comiso J et al Eds CopernicusGesellschaft MBH Gottingen Germany 2016 Volume 3 pp 109ndash116
12 Dutta D Das PK Paul S Sharma JR Dadhwal VK Assessment of ecological disturbance in themangrove forest of Sundarbans caused by cyclones using MODIS time-series data (2001ndash2011) Nat Hazards2015 79 775ndash790 [CrossRef]
13 Dutta D Das PK Paul S Sharma JR Dhadwal VK Spatio-temporal assessment of ecologicaldisturbance and its intensity in the mangrove forest using MODIS derived disturbance index In ISPRSTechnical Commission Viii Symposium Dadhwal VK Diwakar PG Seshasai MVR Raju PLN Hakeem AEds Copernicus Gesellschaft MBH Gottingen Germany 2014 Volume XL-8 pp 555ndash559
14 Fatoyinbo TE Simard M Washington-Allen RA Shugart HH Landscape-scale extent heightbiomass and carbon estimation of Mozambiquersquos mangrove forests with Landsat ETM+ and Shuttle RadarTopography Mission elevation data J Geophys Res Biogeosci 2008 113 [CrossRef]
15 Fromard F Vega C Proisy C Half a century of dynamic coastal change affecting mangrove shorelines ofFrench Guiana A case study based on remote sensing data analyses and field surveys Mar Geol 2004 208265ndash280 [CrossRef]
16 Ghosh MK Kumar L Roy C Mapping Long-Term Changes in Mangrove Species Composition andDistribution in the Sundarbans Forests 2016 7 305 [CrossRef]
17 Giri C Long J Abbas S Murali RM Qamer FM Pengra B Thau D Distribution and dynamics ofmangrove forests of South Asia J Environ Manag 2015 148 101ndash111 [CrossRef] [PubMed]
18 Giri C Muhlhausen J Mangrove forest distributions and dynamics in Madagascar (1975ndash2005) Sensors2008 8 2104ndash2117 [CrossRef] [PubMed]
Sensors 2018 18 12 14 of 15
19 Hamilton S Assessing the role of commercial aquaculture in displacing mangrove forest Bull Mar Sci2013 89 585ndash601 [CrossRef]
20 Hirata Y Tabuchi R Patanaponpaiboon P Poungparn S Yoneda R Fujioka Y Estimation ofaboveground biomass in mangrove forests using high-resolution satellite data J For Res 2014 19 34ndash41[CrossRef]
21 Kamal M Phinn S Johansen K Object-Based Approach for Multi-Scale Mangrove Composition MappingUsing Multi-Resolution Image Datasets Remote Sens 2015 7 4753ndash4783 [CrossRef]
22 Kamthonkiat D Rodfai C Saiwanrungkul A Koshimura S Matsuoka M Geoinformatics in mangrovemonitoring Damage and recovery after the 2004 Indian Ocean tsunami in Phang Nga Thailand Nat HazardsEarth Syst Sci 2011 11 1851ndash1862 [CrossRef]
23 Kanniah KD Sheikhi A Cracknell AP Goh HC Tan KP Ho CS Rasli FN Satellite Images forMonitoring Mangrove Cover Changes in a Fast Growing Economic Region in Southern Peninsular MalaysiaRemote Sens 2015 7 14360ndash14385 [CrossRef]
24 Kirui KB Kairo JG Bosire J Viergever KM Rudra S Huxham M Briers RA Mapping of mangroveforest land cover change along the Kenya coastline using Landsat imagery Ocean Coast Manag 2013 8319ndash24 [CrossRef]
25 Kovacs JM de Santiago FF Bastien J Lafrance P An Assessment of Mangroves in Guinea West AfricaUsing a Field and Remote Sensing Based Approach Wetlands 2010 30 773ndash782 [CrossRef]
26 Kuenzer C van Beijma S Gessner U Dech S Land surface dynamics and environmental challenges ofthe Niger Delta Africa Remote sensing-based analyses spanning three decades (1986ndash2013) Appl Geogr2014 53 354ndash368 [CrossRef]
27 Leimgruber P Kelly DS Steininger MK Brunner J Muller T Songer M Forest cover change patternsin Myanmar (Burma) 1990ndash2000 Environ Conserv 2005 32 356ndash364 [CrossRef]
28 LeMarie M van der Zaag P Menting G Bacluete E Schotanus D The use of remote sensing formonitoring environmental indicators The case of the Incomati estuary Mozambique Phys Chem Earth2006 31 857ndash863 [CrossRef]
29 Liu K Liu L Liu HX Li X Wang SG Exploring the effects of biophysical parameters on the spatialpattern of rare cold damage to mangrove forests Remote Sens Environ 2014 150 20ndash33 [CrossRef]
30 Macamo CCF Massuanganhe E Nicolau DK Bandeira SO Adams JB Mangroversquos response tocyclone Eline (2000) What is happening 14 years later Aquat Bot 2016 134 10ndash17 [CrossRef]
31 Manna S Mondal PP Mukhopadhyay A Akhand A Hazra S Mitra D Vegetation cover changeanalysis from multi-temporal satellite data in Jharkhali Island Sundarbans India Indian J Geo-Mar Sci2013 42 331ndash342
32 Misra A Murali RM Vethamony P Assessment of the land useland cover (LULC) and mangrovechanges along the Mandovi-Zuari estuarine complex of Goa India Arab J Geosci 2015 8 267ndash279[CrossRef]
33 Monzon AK Reyes SR Veridiano RK Tumaneng R De Alban JD Synergy of optical and SAR datafor mapping and monitoring mangroves In XXIII ISPRS Congress Commission VI Halounova L Safar VGong J Hanzl V Wu H Vyas A Wang L Musikhin I Tsai F Gruen A et al Eds CopernicusGesellschaft MBH Gottingen Germany 2016 Volume 41 pp 259ndash266
34 Omo-Irabor OO Olobaniyi SB Akunna J Venus V Maina JM Paradzayi C Mangrove vulnerabilitymodelling in parts of Western Niger Delta Nigeria using satellite images GIS techniques and SpatialMulti-Criteria Analysis (SMCA) Environ Monit Assess 2011 178 39ndash51 [CrossRef] [PubMed]
35 Otero V Quisthoudt K Koedam N Dahdouh-Guebas F Mangroves at Their Limits Detection and AreaEstimation of Mangroves along the Sahara Desert Coast Remote Sens 2016 8 512 [CrossRef]
36 Reddy CS Satish KV Pasha SV Jha CS Dadhwal VK Assessment and monitoring of deforestationand land-use changes (1976ndash2014) in Andaman and Nicobar Islands India using remote sensing and GISCurr Sci 2016 111 1492ndash1499 [CrossRef]
37 Salami AT Akinyede J de Gier A A preliminary assessment of NigeriaSat-1 for sustainable mangroveforest monitoring Int J Appl Earth Obs Geoinf 2010 12 S18ndashS22 [CrossRef]
38 Seto KC Fragkias M Mangrove conversion and aquaculture development in Vietnam A remotesensing-based approach for evaluating the Ramsar Convention on Wetlands Glob Environ Chang 2007 17486ndash500 [CrossRef]
Sensors 2018 18 12 15 of 15
39 Shapiro AC Trettin CC Kuchly H Alavinapanah S Bandeira S The Mangroves of the Zambezi DeltaIncrease in Extent Observed via Satellite from 1994 to 2013 Remote Sens 2015 7 16504ndash16518 [CrossRef]
40 Wang L Sousa WP Gong P Integration of object-based and pixel-based classification for mappingmangroves with IKONOS imagery Int J Remote Sens 2004 25 5655ndash5668 [CrossRef]
41 Hamilton SE Casey D Creation of a high spatio-temporal resolution global database of continuousmangrove forest cover for the 21st century (CGMFC-21) Glob Ecol Biogeogr 2016 25 729ndash738 [CrossRef]
42 Olson DM Dinerstein E Wikramanayake ED Burgess ND Powell GVN Underwood ECDrsquoamico JA Itoua I Strand HE Morrison JC et al Terrestrial ecoregions of the world A newmap of life on earth A new global map of terrestrial ecoregions provides an innovative tool for conservingbiodiversity BioScience 2001 51 933ndash938 [CrossRef]
43 Spalding M Kainuma M Collins L World Atlas of Mangroves Earthscan London UK 201044 Hansen MC Potapov PV Moore R Hancher M Turubanova SA Tyukavina A Thau D
Stehman SV Goetz SJ Loveland TR et al High-resolution global maps of 21st-century forest coverchange Science 2013 342 850ndash853 [CrossRef] [PubMed]
45 Fatoyinbo TE Simard M Height and biomass of mangroves in Africa from ICESatGLAS and SRTM Int JRemote Sens 2013 34 668ndash681 [CrossRef]
46 World Bank World Development Indicators Available online httpdatabankworldbankorgdatareportsaspxsource=2ampcountry=SLE (accessed on 31 July 2017)
47 Blinker L Country Environment Profile (CEP) Sierra Leone European Commission Cardiff UK 200648 GoSL (Government of Sierra Leone) Conservation and Wildlife Policy 2010 Government of Sierra Leone
Freetown Sierra Leone 201049 Heymans JJ Vakily JM Structure and Dynamics of the Marine Ecosystem off Sierra Leone for Three Time Periods
1964 1978 1990 Fisheries Centre UBC Vancouver BC Canada 200450 GCLME (Guinea Current Large Marine Ecosystem) Regional Coordinating Unit In Towards Ecosystem-Based
Management of the Guinea Current Large Marine Ecosystem United Nations Development Programme (UNDP)New York NY USA 2013
51 IUCN Strategies for Conservation and Sustainable Management of Mangrove Forest in Sierra Leone IUCN GlandSwitzerland 2007
52 Trzaska S de Sherbinin A Kim-Blanco P Mara V Schnarr E Jaiteh M Mondal P Climate ChangeVulnerability Assessment in Mangrove Regions of Sierra Leone USAID Washington DC USA 2017 Availableonline httpwwwciesincolumbiaeduwa-biccwa-bicc-ccva-abridged-ffpdf (accessed on 20 December2017)
53 Chander G Markham BL Helder DL Summary of current radiometric calibration coefficients for LandsatMSS TM ETM+ and EO-1 ALI sensors Remote Sens Environ 2009 113 893ndash903 [CrossRef]
54 Zhu Z Wang S Woodcock CE Improvement and expansion of the Fmask algorithm Cloud cloudshadow and snow detection for Landsats 4ndash7 8 and Sentinel 2 images Remote Sens Environ 2015 159269ndash277 [CrossRef]
55 Zhu Z Woodcock CE Object-based cloud and cloud shadow detection in Landsat imagery Remote SensEnviron 2012 118 83ndash94 [CrossRef]
56 GitHub fmask Available online httpsgithubcomprs021fmask (accessed on 31 July 2017)57 Arthur D Vassilvitskii S k-means++ The advantages of careful seeding In Proceedings of the eighteenth
Annual ACM-SIAM Symposium on Discrete Algorithms Society for Industrial and Applied MathematicsNew Orleans Louisiana 7ndash9 January 2007 pp 1027ndash1035
copy 2017 by the authors Licensee MDPI Basel Switzerland This article is an open accessarticle distributed under the terms and conditions of the Creative Commons Attribution(CC BY) license (httpcreativecommonsorglicensesby40)

Sensors 2018 18 12 9 of 15
33 Land Cover Changes within the Focus Areas
Figure 5 further summarizes the spatiotemporal changes of the different land cover classesbetween different time slices In the Scarcies region mangroves remained the most dominant land cover(Figure 5) However the Scarcies witnessed fluctuations in mangrove extents with more mangrovesduring 1990 (66 within 1 km 65 within 25 km 59 within 5 km) and 2010 (56 within 1 km57 within 25 km 58 within 5 km) Mangrove extents declined in this region during 2000 (43within 1 km 38 within 25 km 34 within 5 km) and 2016 (36 both within 1 km and 25 km 37within 5 km) mostly owing to an increase in waterwetland (Figure 5) Built areabare soil more thandoubled during post-2000 years increasing from 8 to 18 both within 1 km and 25 km and from 6to 14 within 5 km
Sensors 2018 18 12 9 of 15
soil more than doubled during post-2000 years increasing from 8 to 18 both within 1 km and 25 km and from 6 to 14 within 5 km
Figure 5 Relative extents of different land covers within the four focus areas during 1990ndash2016 Panels show mangrove extents within buffers of (a) 1 km (b) 25 km (c) 5 km extending inland from the coastline
In the SLRE region other vegetation (eg forest plantation farmland etc) has been the most dominant land cover over the past 26 years except for the 1 km buffer zone where mangrove was the most dominant land cover in the years of 1990 2010 and 2016 (Figure 5) Other vegetation coverage ranged between (i) 27 in 1990 and 49 in 2000 within the 1 km buffer (ii) 39 in 1990 and 60 in 2000 within 25 km buffer and (iii) 51 in 1990 and 69 in 2000 within 5 km buffer Waterwetland coverage ranged between 5 and 21 across years and buffer zones with more coverage closer to the coastline Built area or bare soil ranged between 4 and 14 across space and time with minimum coverage in 2000 and maximum coverage in 2010
In the Yawri Bay region mangroves covered the most area across the years and buffer zones except for in 2000 with (i) both wetlandswater and other vegetation covering more area than the mangroves within 1 km buffer and (ii) other vegetation covering more area in 5 km buffer (Figure 5) Waterwetland has declined over time (eg 14 in 1990 to 2 in 2016 within 1 km) within all three buffer zones with an increase during 2000 Built areabare soil increased over time (19 to 27 within 1 km 14 to 22 within 25 km and 11 to 18 within 5 km) with a decline in between for all three buffer zones
As with the Scarcies region mangroves remained the dominant land cover in the Sherbro region with an estimated area covering 68 within 1 km 56 within 25 km and 44 within 5 km buffer zones in 2016 (Table 4) The only exception is within 5 km buffer zone in 2000 (Figure 5) when other vegetation covered more area (46) than mangroves (37) The other two land covers remained relatively stable throughout the years and covered less area (~10) compared to mangroves and other vegetation The findings from the field visits during summer 2016 showed that
Figure 5 Relative extents of different land covers within the four focus areas during 1990ndash2016Panels show mangrove extents within buffers of (a) 1 km (b) 25 km (c) 5 km extending inland fromthe coastline
In the SLRE region other vegetation (eg forest plantation farmland etc) has been the mostdominant land cover over the past 26 years except for the 1 km buffer zone where mangrove was themost dominant land cover in the years of 1990 2010 and 2016 (Figure 5) Other vegetation coverageranged between (i) 27 in 1990 and 49 in 2000 within the 1 km buffer (ii) 39 in 1990 and 60 in2000 within 25 km buffer and (iii) 51 in 1990 and 69 in 2000 within 5 km buffer Waterwetlandcoverage ranged between 5 and 21 across years and buffer zones with more coverage closer to thecoastline Built area or bare soil ranged between 4 and 14 across space and time with minimumcoverage in 2000 and maximum coverage in 2010
In the Yawri Bay region mangroves covered the most area across the years and buffer zonesexcept for in 2000 with (i) both wetlandswater and other vegetation covering more area than themangroves within 1 km buffer and (ii) other vegetation covering more area in 5 km buffer (Figure 5)Waterwetland has declined over time (eg 14 in 1990 to 2 in 2016 within 1 km) within all three
Sensors 2018 18 12 10 of 15
buffer zones with an increase during 2000 Built areabare soil increased over time (19 to 27 within1 km 14 to 22 within 25 km and 11 to 18 within 5 km) with a decline in between for all threebuffer zones
As with the Scarcies region mangroves remained the dominant land cover in the Sherbro regionwith an estimated area covering 68 within 1 km 56 within 25 km and 44 within 5 km bufferzones in 2016 (Table 4) The only exception is within 5 km buffer zone in 2000 (Figure 5) when othervegetation covered more area (46) than mangroves (37) The other two land covers remainedrelatively stable throughout the years and covered less area (~10) compared to mangroves and othervegetation The findings from the field visits during summer 2016 showed that the Sherbro area iscovered with largest and oldest trees indicating less degradation over past decades than in other areasand explaining a relative stability of the mangrove cover over time
34 Spatiotemporal Changes in Mangrove Extents over the Last Three Decades
Table 5 shows the overall change in mangrove cover between 1990 and 2016 in each focus areafor different buffers The largest decline is observed in the Scarcies for all buffers up to 46 in the1 km buffer The SLRE has experienced an increase of about 22 in the 1 km buffer The Sherbro andYawri Bay regions experienced slight expansion (lt10) of the mangroves when the narrowest bufferclosest to the sea shore is considered These two regions witnessed modest decline (lt20) when largerbuffers are considered This comparison however does not capture the full history of fluctuations
Table 5 Summary of mangrove extents (area in sq km) during 1990 and 2016 for the four focus areasin the Sierra Leone coastal landscape complex Values in bold denote mangrove gain while values inred italic denote mangrove loss during 1990ndash2016 The lsquoSierra Leone coastal landscape complexrsquo refersto all the mangroves along the full length of the coast not only in the buffers in the four areas
Region 1 km Buffer 25 km Buffer 5 km Buffer
1990 2016Change(RelativeChange)
1990 2016Change(RelativeChange)
1990 2016Change(RelativeChange)
Scarcies RiverEstuary 3195 1735 minus1460
(minus46) 7343 4238 minus3105(minus42) 14258 9039 minus5219
(minus37)
Sierra LeoneRiver Estuary 13187 16071 2884
(22) 21302 24901 3599(17) 26169 29055 2886
(11)
Yawri Bay 1434 1543 109(8) 6011 5505 minus506
(minus8) 13830 11398 minus2432(minus18)
Sherbro RiverEstuary 33682 35578 1896
(6) 59148 60554 1406(2) 76826 76299 minus527
(minus1)
1990 2016 Overall change(Relative change)
Sierra Leonecoastal
landscapecomplex
243482 183432 minus6005 (minus25)
As shown in Figure 5 mangrovesrsquo relative extent is the lowest in 2000 in each region and eachbuffer which is also the year where the other types of vegetation and waterwetland combined coverthe largest area Subsequently in 2010 the relative mangrove extent increases back to the extents from1990 in nearly all cases with the exception of Yawri Bay Then it remains stable in Sherbro and YawriBay while it continues to increase in SLRE In the Scarcies on the other hand it decreases again in2016 to the extent similar to that in 2000
Figure 6 further highlights decadal changes in mangrove extents in the SLCLC The largest lossof mangroves in the Scarcies region is observed between 1990 and 2000 and is mostly located in thesouth-eastern part of the Scarcies region and along the Greater Scarcies River (Figure 6a) while the
Sensors 2018 18 12 11 of 15
loss between 2010 and 2016 mostly happened in the northern part of the region (Figure 6c) In otherparts of the SLCLC signs of non-clustered deforestation are present in pre- and post-2000 years withthe exception of Southern Yawri Bay In general the Scarcies and Yawri Bay seem to undergo largestmangrove fluctuations between years
Sensors 2018 18 12 11 of 15
Figure 6 Decadal changes in mangrove extents in the Sierra Leone coastal landscape complex (SLCLC) during (a) 1990ndash2000 (b) 2000ndash2010 (c) 2010ndash2016
4 Discussion and Conclusions
This study based on a discrete classification of Landsat pixels provides an estimate of 152642 km2 mangrove extent for 2000 that is similar to the estimates provided by [1] While a continuous classification approach can as argued by [41] provide more accurate estimates it is almost impossible to apply for historical land cover analyses in the absence of existing maps with known accuracy or extensive field data from earlier years Therefore it could not be applied in our study aimed at estimating the evolution of the mangrove extents in Sierra Leone Our study relies solely on dominant spectral signature within a single pixel (30 m times 30 m) for a discrete classification ie presenceabsence of a certain class While it is possible that our study overestimates mangrove coverage in the SLCLC because of the way discrete classification works our approach allows us to provide important insights into decadal changes in spatial patterns in mangrove forests Besides our findings agree with those from the past studies that showed an increase in mangrove extents after 2000 [541]
As shown in Figures 5 and 6b all four focus areas witnessed an increase in mangrove extents in all three buffer zones between 2000 and 2010 However only SLRE witnessed an increase in mangrove area post-2010 most probably as a result of reforestation efforts Considering the overall changes during 1990ndash2016 mangroves have declined only in the farthest buffer in the Sherbro and Yawri Bay regions pointing to the possible reclaiming of the land and expansion of agriculture by the communities living inland The Scarcies region underwent the most extensive mangrove loss among all the areas (Table 5) but in different locations for pre-2000 and post-2010 time periods (Figure 6) In both cases the most probable cause is the conversion of mangroves to rice paddies However the rapid recovery of the mangroves over a period of 10 years between 2000 and 2010 in some areas is more indicative of degradation or lsquothinning outrsquo during the periods prior to 2000 rather than a complete deforestation While causality is difficult to attribute the decade of the 1990s was also a period of civil war which may have heightened dependence on mangrove forests for fuel wood charcoal production and construction andor weakened conservation and protection measures These findings especially the overall patterns in change can particularly benefit regional andor national policy-makers in drafting coastal conservation policies
It is important to note that it is challenging to distinguish between wetlands and sparse mangrove forests because of the inherent limitations of optical remote sensing in terms of the spectral and spatial resolution especially in tropical countries with frequent cloud cover Hence it is possible that a pixel with sparse mangrove cover will record a spectral signature of the underlying water that is dominant within that pixel and thus be classified as waterwetland A validation check with high-resolution images from 2016 indeed confirms that the area along and surrounding the Scarcies river hosts young and sparsely distributed mangroves rather than a complete clear-cut of
Figure 6 Decadal changes in mangrove extents in the Sierra Leone coastal landscape complex (SLCLC)during (a) 1990ndash2000 (b) 2000ndash2010 (c) 2010ndash2016
4 Discussion and Conclusions
This study based on a discrete classification of Landsat pixels provides an estimate of 152642 km2
mangrove extent for 2000 that is similar to the estimates provided by [1] While a continuousclassification approach can as argued by [41] provide more accurate estimates it is almost impossibleto apply for historical land cover analyses in the absence of existing maps with known accuracyor extensive field data from earlier years Therefore it could not be applied in our study aimed atestimating the evolution of the mangrove extents in Sierra Leone Our study relies solely on dominantspectral signature within a single pixel (30 m times 30 m) for a discrete classification ie presenceabsenceof a certain class While it is possible that our study overestimates mangrove coverage in the SLCLCbecause of the way discrete classification works our approach allows us to provide important insightsinto decadal changes in spatial patterns in mangrove forests Besides our findings agree with thosefrom the past studies that showed an increase in mangrove extents after 2000 [541]
As shown in Figures 5 and 6b all four focus areas witnessed an increase in mangrove extents inall three buffer zones between 2000 and 2010 However only SLRE witnessed an increase in mangrovearea post-2010 most probably as a result of reforestation efforts Considering the overall changesduring 1990ndash2016 mangroves have declined only in the farthest buffer in the Sherbro and YawriBay regions pointing to the possible reclaiming of the land and expansion of agriculture by thecommunities living inland The Scarcies region underwent the most extensive mangrove loss amongall the areas (Table 5) but in different locations for pre-2000 and post-2010 time periods (Figure 6)In both cases the most probable cause is the conversion of mangroves to rice paddies However therapid recovery of the mangroves over a period of 10 years between 2000 and 2010 in some areas is moreindicative of degradation or lsquothinning outrsquo during the periods prior to 2000 rather than a completedeforestation While causality is difficult to attribute the decade of the 1990s was also a period of civilwar which may have heightened dependence on mangrove forests for fuel wood charcoal productionand construction andor weakened conservation and protection measures These findings especiallythe overall patterns in change can particularly benefit regional andor national policy-makers indrafting coastal conservation policies
Sensors 2018 18 12 12 of 15
It is important to note that it is challenging to distinguish between wetlands and sparse mangroveforests because of the inherent limitations of optical remote sensing in terms of the spectral and spatialresolution especially in tropical countries with frequent cloud cover Hence it is possible that a pixelwith sparse mangrove cover will record a spectral signature of the underlying water that is dominantwithin that pixel and thus be classified as waterwetland A validation check with high-resolutionimages from 2016 indeed confirms that the area along and surrounding the Scarcies river hosts youngand sparsely distributed mangroves rather than a complete clear-cut of dense mangrove forests Eventhough high-resolution satellite images do not exist for earlier years for validation purposes it ispossible that mangrove forests in the Scarcies region witnessed degradation or lsquothinning outrsquo during1990ndash2000 rather than a complete deforestation Thus the fluctuations in mangrove extents as shownin Figure 6 possibly represent alternate thinning and reforestation This is consistent with the highregeneration potential observed on field visits to the Scarcies region
To be useful at large scale satellite-based assessment of mangrove cover needs to be complementedby in-situ evaluation of the quality of the forests The field trips during summer 2016 indicate thatdespite degradation the remaining mangroves in the Scarcies region show higher species diversity(relative to other regions in Sierra Leone) and high regeneration level thus indicating human pressureon the forests but also high regeneration potential should human pressures be lowered or bettermanaged This is further supported by the fluctuations in mangrove forest cover from dense to sparseto dense estimated in this study The Sherbro area is on the opposite side of the spectrum with lowestspecies diversity highly dominated by Rhizophora racemosa These mangroves are also the oldest amongthe four areas and have the lowest regeneration rates with little disturbance in the forests Theseforests while with high commercial potential exhibit low adaptation potential to future potentiallyaltered climatic conditions The SLRE has the smallest trees with the lowest basal area pointing toyoungest forests sign of past and current exploitation of the forest as well as recent reforestation effortsThe Yawri Bay has fewer adult trees but the highest number of seedlings both showing signs of goodpotential for regeneration and sustainability
Overall despite a noticeable overall long term decrease of the mangrove cover in Sierra Leonea closer look at mangrove evolution shows a good potential for conservation if properly monitoredand managed Conserving the fluctuating mangroves in the SLCLC would require a carefullydesigned management plan involving current and alternative livelihood strategies sustainable resourcemanagement schemes at local and national levels and sensitization of the populations about mangroveservices and their value under climate change beyond responding to communitiesrsquo immediate needsAmong the coastal populations fishing communities are the ones that will be the most affected bythe decline in mangroves yet are also the ones who currently rely on mangroves the most for theirlivelihoods These populations exhibit low livelihood diversification mostly revolving around fishingand fish processing with some contribution from agriculture and petty trade [52] The SLRE hasslightly higher diversification of livelihood strategies largely due to the proximity of Freetown andslightly higher grounds In the Scarcies and Sherbro regions alternative or supplementary livelihoodopportunities are quasi non-existent In most of the communities visited during field trips mangrovesare also open-access and individuals can access ownership by lsquoadding valuersquo to the land which inmost cases translates into clearing the mangroves for rice cultivation Existing community-basedmanagement initiatives seem to be mostly geared towards short term economic benefits from landscovered by mangroves rather than driven by holistic long term plans that include a wide range ofservices provided to a wide range of populations that would insure sustainability of the resource andfishing livelihoods While projects aimed at mangrove conservation could benefit from the existingmanagement structures significant change to the management goals would be required
Acknowledgments This work is made possible by the generous support of the American People through theUnited States Agency for International Development (USAID) The contents of this work are the sole responsibilityof its authors and do not necessarily reflect the views of USAID or the United States Government We acknowledgethe contributions of Zebedee Njisuh Aiah Lebbie Samuel Weekes George Ganda Michael Balinga Paola
Sensors 2018 18 12 13 of 15
Kim-Blanco Valentina Mara Emilie Schnarr Malanding Jaiteh and the field research team We thank theanonymous reviewers for their constructive feedback
Author Contributions PM and AdS conceived and designed the study ST designed and conducted field-workPM analyzed the data PM and ST wrote the paper
Conflicts of Interest The authors declare no conflict of interest
References
1 Giri C Ochieng E Tieszen LL Zhu Z Singh A Loveland T Masek J Duke N Status and distributionof mangrove forests of the world using earth observation satellite data Glob Ecol Biogeogr 2011 20 154ndash159[CrossRef]
2 Murdiyarso D Purbopuspito J Kauffman JB Warren MW Sasmito SD Donato DC Manuri SKrisnawati H Taberima S Kurnianto S The potential of Indonesian mangrove forests for global climatechange mitigation Nat Clim Chang 2015 5 1089ndash1092 [CrossRef]
3 Danielsen F Soslashrensen MK Olwig MF Selvam V Parish F Burgess ND Hiraishi TKarunagaran VM Rasmussen MS Hansen LB The Asian tsunami A protective role for coastalvegetation Science 2005 310 643 [CrossRef] [PubMed]
4 Kathiresan K Rajendran N Coastal mangrove forests mitigated tsunami Estuar Coast Shelf Sci 2005 65601ndash606 [CrossRef]
5 FAO The Worldrsquos Mangroves 1980ndash2005 FAO Rome Italy 20076 Ellison JC Climate Change Vulnerability Assessment and Adaptation Planning for Mangrove Systems World
Wildlife Fund (WWF) Washington DC USA 20127 Blasco F Gauquelin T Rasolofoharinoro M Denis J Aizpuru M Caldairou V Recent advances in
mangrove studies using remote sensing data Mar Freshw Res 1998 49 287ndash296 [CrossRef]8 Giri C Observation and Monitoring of Mangrove Forests Using Remote Sensing Opportunities and
Challenges Remote Sens 2016 8 783 [CrossRef]9 Heumann BW Satellite remote sensing of mangrove forests Recent advances and future opportunities
Prog Phys Geogr 2011 35 87ndash108 [CrossRef]10 Almahasheer H Aljowair A Duarte CM Irigoien X Decadal stability of Red Sea mangroves Estuar
Coast Shelf Sci 2016 169 164ndash172 [CrossRef]11 Dan TT Chen CF Chiang SH Ogawa S Mapping and change analysis in mangrove forest by using
Landsat imagery In Xxiii Isprs Congress Commission Viii Halounova L Safar V Raju PLN Planka LZdimal V Kumar TS Faruque FS Kerr Y Ramasamy SM Comiso J et al Eds CopernicusGesellschaft MBH Gottingen Germany 2016 Volume 3 pp 109ndash116
12 Dutta D Das PK Paul S Sharma JR Dadhwal VK Assessment of ecological disturbance in themangrove forest of Sundarbans caused by cyclones using MODIS time-series data (2001ndash2011) Nat Hazards2015 79 775ndash790 [CrossRef]
13 Dutta D Das PK Paul S Sharma JR Dhadwal VK Spatio-temporal assessment of ecologicaldisturbance and its intensity in the mangrove forest using MODIS derived disturbance index In ISPRSTechnical Commission Viii Symposium Dadhwal VK Diwakar PG Seshasai MVR Raju PLN Hakeem AEds Copernicus Gesellschaft MBH Gottingen Germany 2014 Volume XL-8 pp 555ndash559
14 Fatoyinbo TE Simard M Washington-Allen RA Shugart HH Landscape-scale extent heightbiomass and carbon estimation of Mozambiquersquos mangrove forests with Landsat ETM+ and Shuttle RadarTopography Mission elevation data J Geophys Res Biogeosci 2008 113 [CrossRef]
15 Fromard F Vega C Proisy C Half a century of dynamic coastal change affecting mangrove shorelines ofFrench Guiana A case study based on remote sensing data analyses and field surveys Mar Geol 2004 208265ndash280 [CrossRef]
16 Ghosh MK Kumar L Roy C Mapping Long-Term Changes in Mangrove Species Composition andDistribution in the Sundarbans Forests 2016 7 305 [CrossRef]
17 Giri C Long J Abbas S Murali RM Qamer FM Pengra B Thau D Distribution and dynamics ofmangrove forests of South Asia J Environ Manag 2015 148 101ndash111 [CrossRef] [PubMed]
18 Giri C Muhlhausen J Mangrove forest distributions and dynamics in Madagascar (1975ndash2005) Sensors2008 8 2104ndash2117 [CrossRef] [PubMed]
Sensors 2018 18 12 14 of 15
19 Hamilton S Assessing the role of commercial aquaculture in displacing mangrove forest Bull Mar Sci2013 89 585ndash601 [CrossRef]
20 Hirata Y Tabuchi R Patanaponpaiboon P Poungparn S Yoneda R Fujioka Y Estimation ofaboveground biomass in mangrove forests using high-resolution satellite data J For Res 2014 19 34ndash41[CrossRef]
21 Kamal M Phinn S Johansen K Object-Based Approach for Multi-Scale Mangrove Composition MappingUsing Multi-Resolution Image Datasets Remote Sens 2015 7 4753ndash4783 [CrossRef]
22 Kamthonkiat D Rodfai C Saiwanrungkul A Koshimura S Matsuoka M Geoinformatics in mangrovemonitoring Damage and recovery after the 2004 Indian Ocean tsunami in Phang Nga Thailand Nat HazardsEarth Syst Sci 2011 11 1851ndash1862 [CrossRef]
23 Kanniah KD Sheikhi A Cracknell AP Goh HC Tan KP Ho CS Rasli FN Satellite Images forMonitoring Mangrove Cover Changes in a Fast Growing Economic Region in Southern Peninsular MalaysiaRemote Sens 2015 7 14360ndash14385 [CrossRef]
24 Kirui KB Kairo JG Bosire J Viergever KM Rudra S Huxham M Briers RA Mapping of mangroveforest land cover change along the Kenya coastline using Landsat imagery Ocean Coast Manag 2013 8319ndash24 [CrossRef]
25 Kovacs JM de Santiago FF Bastien J Lafrance P An Assessment of Mangroves in Guinea West AfricaUsing a Field and Remote Sensing Based Approach Wetlands 2010 30 773ndash782 [CrossRef]
26 Kuenzer C van Beijma S Gessner U Dech S Land surface dynamics and environmental challenges ofthe Niger Delta Africa Remote sensing-based analyses spanning three decades (1986ndash2013) Appl Geogr2014 53 354ndash368 [CrossRef]
27 Leimgruber P Kelly DS Steininger MK Brunner J Muller T Songer M Forest cover change patternsin Myanmar (Burma) 1990ndash2000 Environ Conserv 2005 32 356ndash364 [CrossRef]
28 LeMarie M van der Zaag P Menting G Bacluete E Schotanus D The use of remote sensing formonitoring environmental indicators The case of the Incomati estuary Mozambique Phys Chem Earth2006 31 857ndash863 [CrossRef]
29 Liu K Liu L Liu HX Li X Wang SG Exploring the effects of biophysical parameters on the spatialpattern of rare cold damage to mangrove forests Remote Sens Environ 2014 150 20ndash33 [CrossRef]
30 Macamo CCF Massuanganhe E Nicolau DK Bandeira SO Adams JB Mangroversquos response tocyclone Eline (2000) What is happening 14 years later Aquat Bot 2016 134 10ndash17 [CrossRef]
31 Manna S Mondal PP Mukhopadhyay A Akhand A Hazra S Mitra D Vegetation cover changeanalysis from multi-temporal satellite data in Jharkhali Island Sundarbans India Indian J Geo-Mar Sci2013 42 331ndash342
32 Misra A Murali RM Vethamony P Assessment of the land useland cover (LULC) and mangrovechanges along the Mandovi-Zuari estuarine complex of Goa India Arab J Geosci 2015 8 267ndash279[CrossRef]
33 Monzon AK Reyes SR Veridiano RK Tumaneng R De Alban JD Synergy of optical and SAR datafor mapping and monitoring mangroves In XXIII ISPRS Congress Commission VI Halounova L Safar VGong J Hanzl V Wu H Vyas A Wang L Musikhin I Tsai F Gruen A et al Eds CopernicusGesellschaft MBH Gottingen Germany 2016 Volume 41 pp 259ndash266
34 Omo-Irabor OO Olobaniyi SB Akunna J Venus V Maina JM Paradzayi C Mangrove vulnerabilitymodelling in parts of Western Niger Delta Nigeria using satellite images GIS techniques and SpatialMulti-Criteria Analysis (SMCA) Environ Monit Assess 2011 178 39ndash51 [CrossRef] [PubMed]
35 Otero V Quisthoudt K Koedam N Dahdouh-Guebas F Mangroves at Their Limits Detection and AreaEstimation of Mangroves along the Sahara Desert Coast Remote Sens 2016 8 512 [CrossRef]
36 Reddy CS Satish KV Pasha SV Jha CS Dadhwal VK Assessment and monitoring of deforestationand land-use changes (1976ndash2014) in Andaman and Nicobar Islands India using remote sensing and GISCurr Sci 2016 111 1492ndash1499 [CrossRef]
37 Salami AT Akinyede J de Gier A A preliminary assessment of NigeriaSat-1 for sustainable mangroveforest monitoring Int J Appl Earth Obs Geoinf 2010 12 S18ndashS22 [CrossRef]
38 Seto KC Fragkias M Mangrove conversion and aquaculture development in Vietnam A remotesensing-based approach for evaluating the Ramsar Convention on Wetlands Glob Environ Chang 2007 17486ndash500 [CrossRef]
Sensors 2018 18 12 15 of 15
39 Shapiro AC Trettin CC Kuchly H Alavinapanah S Bandeira S The Mangroves of the Zambezi DeltaIncrease in Extent Observed via Satellite from 1994 to 2013 Remote Sens 2015 7 16504ndash16518 [CrossRef]
40 Wang L Sousa WP Gong P Integration of object-based and pixel-based classification for mappingmangroves with IKONOS imagery Int J Remote Sens 2004 25 5655ndash5668 [CrossRef]
41 Hamilton SE Casey D Creation of a high spatio-temporal resolution global database of continuousmangrove forest cover for the 21st century (CGMFC-21) Glob Ecol Biogeogr 2016 25 729ndash738 [CrossRef]
42 Olson DM Dinerstein E Wikramanayake ED Burgess ND Powell GVN Underwood ECDrsquoamico JA Itoua I Strand HE Morrison JC et al Terrestrial ecoregions of the world A newmap of life on earth A new global map of terrestrial ecoregions provides an innovative tool for conservingbiodiversity BioScience 2001 51 933ndash938 [CrossRef]
43 Spalding M Kainuma M Collins L World Atlas of Mangroves Earthscan London UK 201044 Hansen MC Potapov PV Moore R Hancher M Turubanova SA Tyukavina A Thau D
Stehman SV Goetz SJ Loveland TR et al High-resolution global maps of 21st-century forest coverchange Science 2013 342 850ndash853 [CrossRef] [PubMed]
45 Fatoyinbo TE Simard M Height and biomass of mangroves in Africa from ICESatGLAS and SRTM Int JRemote Sens 2013 34 668ndash681 [CrossRef]
46 World Bank World Development Indicators Available online httpdatabankworldbankorgdatareportsaspxsource=2ampcountry=SLE (accessed on 31 July 2017)
47 Blinker L Country Environment Profile (CEP) Sierra Leone European Commission Cardiff UK 200648 GoSL (Government of Sierra Leone) Conservation and Wildlife Policy 2010 Government of Sierra Leone
Freetown Sierra Leone 201049 Heymans JJ Vakily JM Structure and Dynamics of the Marine Ecosystem off Sierra Leone for Three Time Periods
1964 1978 1990 Fisheries Centre UBC Vancouver BC Canada 200450 GCLME (Guinea Current Large Marine Ecosystem) Regional Coordinating Unit In Towards Ecosystem-Based
Management of the Guinea Current Large Marine Ecosystem United Nations Development Programme (UNDP)New York NY USA 2013
51 IUCN Strategies for Conservation and Sustainable Management of Mangrove Forest in Sierra Leone IUCN GlandSwitzerland 2007
52 Trzaska S de Sherbinin A Kim-Blanco P Mara V Schnarr E Jaiteh M Mondal P Climate ChangeVulnerability Assessment in Mangrove Regions of Sierra Leone USAID Washington DC USA 2017 Availableonline httpwwwciesincolumbiaeduwa-biccwa-bicc-ccva-abridged-ffpdf (accessed on 20 December2017)
53 Chander G Markham BL Helder DL Summary of current radiometric calibration coefficients for LandsatMSS TM ETM+ and EO-1 ALI sensors Remote Sens Environ 2009 113 893ndash903 [CrossRef]
54 Zhu Z Wang S Woodcock CE Improvement and expansion of the Fmask algorithm Cloud cloudshadow and snow detection for Landsats 4ndash7 8 and Sentinel 2 images Remote Sens Environ 2015 159269ndash277 [CrossRef]
55 Zhu Z Woodcock CE Object-based cloud and cloud shadow detection in Landsat imagery Remote SensEnviron 2012 118 83ndash94 [CrossRef]
56 GitHub fmask Available online httpsgithubcomprs021fmask (accessed on 31 July 2017)57 Arthur D Vassilvitskii S k-means++ The advantages of careful seeding In Proceedings of the eighteenth
Annual ACM-SIAM Symposium on Discrete Algorithms Society for Industrial and Applied MathematicsNew Orleans Louisiana 7ndash9 January 2007 pp 1027ndash1035
copy 2017 by the authors Licensee MDPI Basel Switzerland This article is an open accessarticle distributed under the terms and conditions of the Creative Commons Attribution(CC BY) license (httpcreativecommonsorglicensesby40)

Sensors 2018 18 12 11 of 15
loss between 2010 and 2016 mostly happened in the northern part of the region (Figure 6c) In otherparts of the SLCLC signs of non-clustered deforestation are present in pre- and post-2000 years withthe exception of Southern Yawri Bay In general the Scarcies and Yawri Bay seem to undergo largestmangrove fluctuations between years
Sensors 2018 18 12 11 of 15
Figure 6 Decadal changes in mangrove extents in the Sierra Leone coastal landscape complex (SLCLC) during (a) 1990ndash2000 (b) 2000ndash2010 (c) 2010ndash2016
4 Discussion and Conclusions
This study based on a discrete classification of Landsat pixels provides an estimate of 152642 km2 mangrove extent for 2000 that is similar to the estimates provided by [1] While a continuous classification approach can as argued by [41] provide more accurate estimates it is almost impossible to apply for historical land cover analyses in the absence of existing maps with known accuracy or extensive field data from earlier years Therefore it could not be applied in our study aimed at estimating the evolution of the mangrove extents in Sierra Leone Our study relies solely on dominant spectral signature within a single pixel (30 m times 30 m) for a discrete classification ie presenceabsence of a certain class While it is possible that our study overestimates mangrove coverage in the SLCLC because of the way discrete classification works our approach allows us to provide important insights into decadal changes in spatial patterns in mangrove forests Besides our findings agree with those from the past studies that showed an increase in mangrove extents after 2000 [541]
As shown in Figures 5 and 6b all four focus areas witnessed an increase in mangrove extents in all three buffer zones between 2000 and 2010 However only SLRE witnessed an increase in mangrove area post-2010 most probably as a result of reforestation efforts Considering the overall changes during 1990ndash2016 mangroves have declined only in the farthest buffer in the Sherbro and Yawri Bay regions pointing to the possible reclaiming of the land and expansion of agriculture by the communities living inland The Scarcies region underwent the most extensive mangrove loss among all the areas (Table 5) but in different locations for pre-2000 and post-2010 time periods (Figure 6) In both cases the most probable cause is the conversion of mangroves to rice paddies However the rapid recovery of the mangroves over a period of 10 years between 2000 and 2010 in some areas is more indicative of degradation or lsquothinning outrsquo during the periods prior to 2000 rather than a complete deforestation While causality is difficult to attribute the decade of the 1990s was also a period of civil war which may have heightened dependence on mangrove forests for fuel wood charcoal production and construction andor weakened conservation and protection measures These findings especially the overall patterns in change can particularly benefit regional andor national policy-makers in drafting coastal conservation policies
It is important to note that it is challenging to distinguish between wetlands and sparse mangrove forests because of the inherent limitations of optical remote sensing in terms of the spectral and spatial resolution especially in tropical countries with frequent cloud cover Hence it is possible that a pixel with sparse mangrove cover will record a spectral signature of the underlying water that is dominant within that pixel and thus be classified as waterwetland A validation check with high-resolution images from 2016 indeed confirms that the area along and surrounding the Scarcies river hosts young and sparsely distributed mangroves rather than a complete clear-cut of
Figure 6 Decadal changes in mangrove extents in the Sierra Leone coastal landscape complex (SLCLC)during (a) 1990ndash2000 (b) 2000ndash2010 (c) 2010ndash2016
4 Discussion and Conclusions
This study based on a discrete classification of Landsat pixels provides an estimate of 152642 km2
mangrove extent for 2000 that is similar to the estimates provided by [1] While a continuousclassification approach can as argued by [41] provide more accurate estimates it is almost impossibleto apply for historical land cover analyses in the absence of existing maps with known accuracyor extensive field data from earlier years Therefore it could not be applied in our study aimed atestimating the evolution of the mangrove extents in Sierra Leone Our study relies solely on dominantspectral signature within a single pixel (30 m times 30 m) for a discrete classification ie presenceabsenceof a certain class While it is possible that our study overestimates mangrove coverage in the SLCLCbecause of the way discrete classification works our approach allows us to provide important insightsinto decadal changes in spatial patterns in mangrove forests Besides our findings agree with thosefrom the past studies that showed an increase in mangrove extents after 2000 [541]
As shown in Figures 5 and 6b all four focus areas witnessed an increase in mangrove extents inall three buffer zones between 2000 and 2010 However only SLRE witnessed an increase in mangrovearea post-2010 most probably as a result of reforestation efforts Considering the overall changesduring 1990ndash2016 mangroves have declined only in the farthest buffer in the Sherbro and YawriBay regions pointing to the possible reclaiming of the land and expansion of agriculture by thecommunities living inland The Scarcies region underwent the most extensive mangrove loss amongall the areas (Table 5) but in different locations for pre-2000 and post-2010 time periods (Figure 6)In both cases the most probable cause is the conversion of mangroves to rice paddies However therapid recovery of the mangroves over a period of 10 years between 2000 and 2010 in some areas is moreindicative of degradation or lsquothinning outrsquo during the periods prior to 2000 rather than a completedeforestation While causality is difficult to attribute the decade of the 1990s was also a period of civilwar which may have heightened dependence on mangrove forests for fuel wood charcoal productionand construction andor weakened conservation and protection measures These findings especiallythe overall patterns in change can particularly benefit regional andor national policy-makers indrafting coastal conservation policies
Sensors 2018 18 12 12 of 15
It is important to note that it is challenging to distinguish between wetlands and sparse mangroveforests because of the inherent limitations of optical remote sensing in terms of the spectral and spatialresolution especially in tropical countries with frequent cloud cover Hence it is possible that a pixelwith sparse mangrove cover will record a spectral signature of the underlying water that is dominantwithin that pixel and thus be classified as waterwetland A validation check with high-resolutionimages from 2016 indeed confirms that the area along and surrounding the Scarcies river hosts youngand sparsely distributed mangroves rather than a complete clear-cut of dense mangrove forests Eventhough high-resolution satellite images do not exist for earlier years for validation purposes it ispossible that mangrove forests in the Scarcies region witnessed degradation or lsquothinning outrsquo during1990ndash2000 rather than a complete deforestation Thus the fluctuations in mangrove extents as shownin Figure 6 possibly represent alternate thinning and reforestation This is consistent with the highregeneration potential observed on field visits to the Scarcies region
To be useful at large scale satellite-based assessment of mangrove cover needs to be complementedby in-situ evaluation of the quality of the forests The field trips during summer 2016 indicate thatdespite degradation the remaining mangroves in the Scarcies region show higher species diversity(relative to other regions in Sierra Leone) and high regeneration level thus indicating human pressureon the forests but also high regeneration potential should human pressures be lowered or bettermanaged This is further supported by the fluctuations in mangrove forest cover from dense to sparseto dense estimated in this study The Sherbro area is on the opposite side of the spectrum with lowestspecies diversity highly dominated by Rhizophora racemosa These mangroves are also the oldest amongthe four areas and have the lowest regeneration rates with little disturbance in the forests Theseforests while with high commercial potential exhibit low adaptation potential to future potentiallyaltered climatic conditions The SLRE has the smallest trees with the lowest basal area pointing toyoungest forests sign of past and current exploitation of the forest as well as recent reforestation effortsThe Yawri Bay has fewer adult trees but the highest number of seedlings both showing signs of goodpotential for regeneration and sustainability
Overall despite a noticeable overall long term decrease of the mangrove cover in Sierra Leonea closer look at mangrove evolution shows a good potential for conservation if properly monitoredand managed Conserving the fluctuating mangroves in the SLCLC would require a carefullydesigned management plan involving current and alternative livelihood strategies sustainable resourcemanagement schemes at local and national levels and sensitization of the populations about mangroveservices and their value under climate change beyond responding to communitiesrsquo immediate needsAmong the coastal populations fishing communities are the ones that will be the most affected bythe decline in mangroves yet are also the ones who currently rely on mangroves the most for theirlivelihoods These populations exhibit low livelihood diversification mostly revolving around fishingand fish processing with some contribution from agriculture and petty trade [52] The SLRE hasslightly higher diversification of livelihood strategies largely due to the proximity of Freetown andslightly higher grounds In the Scarcies and Sherbro regions alternative or supplementary livelihoodopportunities are quasi non-existent In most of the communities visited during field trips mangrovesare also open-access and individuals can access ownership by lsquoadding valuersquo to the land which inmost cases translates into clearing the mangroves for rice cultivation Existing community-basedmanagement initiatives seem to be mostly geared towards short term economic benefits from landscovered by mangroves rather than driven by holistic long term plans that include a wide range ofservices provided to a wide range of populations that would insure sustainability of the resource andfishing livelihoods While projects aimed at mangrove conservation could benefit from the existingmanagement structures significant change to the management goals would be required
Acknowledgments This work is made possible by the generous support of the American People through theUnited States Agency for International Development (USAID) The contents of this work are the sole responsibilityof its authors and do not necessarily reflect the views of USAID or the United States Government We acknowledgethe contributions of Zebedee Njisuh Aiah Lebbie Samuel Weekes George Ganda Michael Balinga Paola
Sensors 2018 18 12 13 of 15
Kim-Blanco Valentina Mara Emilie Schnarr Malanding Jaiteh and the field research team We thank theanonymous reviewers for their constructive feedback
Author Contributions PM and AdS conceived and designed the study ST designed and conducted field-workPM analyzed the data PM and ST wrote the paper
Conflicts of Interest The authors declare no conflict of interest
References
1 Giri C Ochieng E Tieszen LL Zhu Z Singh A Loveland T Masek J Duke N Status and distributionof mangrove forests of the world using earth observation satellite data Glob Ecol Biogeogr 2011 20 154ndash159[CrossRef]
2 Murdiyarso D Purbopuspito J Kauffman JB Warren MW Sasmito SD Donato DC Manuri SKrisnawati H Taberima S Kurnianto S The potential of Indonesian mangrove forests for global climatechange mitigation Nat Clim Chang 2015 5 1089ndash1092 [CrossRef]
3 Danielsen F Soslashrensen MK Olwig MF Selvam V Parish F Burgess ND Hiraishi TKarunagaran VM Rasmussen MS Hansen LB The Asian tsunami A protective role for coastalvegetation Science 2005 310 643 [CrossRef] [PubMed]
4 Kathiresan K Rajendran N Coastal mangrove forests mitigated tsunami Estuar Coast Shelf Sci 2005 65601ndash606 [CrossRef]
5 FAO The Worldrsquos Mangroves 1980ndash2005 FAO Rome Italy 20076 Ellison JC Climate Change Vulnerability Assessment and Adaptation Planning for Mangrove Systems World
Wildlife Fund (WWF) Washington DC USA 20127 Blasco F Gauquelin T Rasolofoharinoro M Denis J Aizpuru M Caldairou V Recent advances in
mangrove studies using remote sensing data Mar Freshw Res 1998 49 287ndash296 [CrossRef]8 Giri C Observation and Monitoring of Mangrove Forests Using Remote Sensing Opportunities and
Challenges Remote Sens 2016 8 783 [CrossRef]9 Heumann BW Satellite remote sensing of mangrove forests Recent advances and future opportunities
Prog Phys Geogr 2011 35 87ndash108 [CrossRef]10 Almahasheer H Aljowair A Duarte CM Irigoien X Decadal stability of Red Sea mangroves Estuar
Coast Shelf Sci 2016 169 164ndash172 [CrossRef]11 Dan TT Chen CF Chiang SH Ogawa S Mapping and change analysis in mangrove forest by using
Landsat imagery In Xxiii Isprs Congress Commission Viii Halounova L Safar V Raju PLN Planka LZdimal V Kumar TS Faruque FS Kerr Y Ramasamy SM Comiso J et al Eds CopernicusGesellschaft MBH Gottingen Germany 2016 Volume 3 pp 109ndash116
12 Dutta D Das PK Paul S Sharma JR Dadhwal VK Assessment of ecological disturbance in themangrove forest of Sundarbans caused by cyclones using MODIS time-series data (2001ndash2011) Nat Hazards2015 79 775ndash790 [CrossRef]
13 Dutta D Das PK Paul S Sharma JR Dhadwal VK Spatio-temporal assessment of ecologicaldisturbance and its intensity in the mangrove forest using MODIS derived disturbance index In ISPRSTechnical Commission Viii Symposium Dadhwal VK Diwakar PG Seshasai MVR Raju PLN Hakeem AEds Copernicus Gesellschaft MBH Gottingen Germany 2014 Volume XL-8 pp 555ndash559
14 Fatoyinbo TE Simard M Washington-Allen RA Shugart HH Landscape-scale extent heightbiomass and carbon estimation of Mozambiquersquos mangrove forests with Landsat ETM+ and Shuttle RadarTopography Mission elevation data J Geophys Res Biogeosci 2008 113 [CrossRef]
15 Fromard F Vega C Proisy C Half a century of dynamic coastal change affecting mangrove shorelines ofFrench Guiana A case study based on remote sensing data analyses and field surveys Mar Geol 2004 208265ndash280 [CrossRef]
16 Ghosh MK Kumar L Roy C Mapping Long-Term Changes in Mangrove Species Composition andDistribution in the Sundarbans Forests 2016 7 305 [CrossRef]
17 Giri C Long J Abbas S Murali RM Qamer FM Pengra B Thau D Distribution and dynamics ofmangrove forests of South Asia J Environ Manag 2015 148 101ndash111 [CrossRef] [PubMed]
18 Giri C Muhlhausen J Mangrove forest distributions and dynamics in Madagascar (1975ndash2005) Sensors2008 8 2104ndash2117 [CrossRef] [PubMed]
Sensors 2018 18 12 14 of 15
19 Hamilton S Assessing the role of commercial aquaculture in displacing mangrove forest Bull Mar Sci2013 89 585ndash601 [CrossRef]
20 Hirata Y Tabuchi R Patanaponpaiboon P Poungparn S Yoneda R Fujioka Y Estimation ofaboveground biomass in mangrove forests using high-resolution satellite data J For Res 2014 19 34ndash41[CrossRef]
21 Kamal M Phinn S Johansen K Object-Based Approach for Multi-Scale Mangrove Composition MappingUsing Multi-Resolution Image Datasets Remote Sens 2015 7 4753ndash4783 [CrossRef]
22 Kamthonkiat D Rodfai C Saiwanrungkul A Koshimura S Matsuoka M Geoinformatics in mangrovemonitoring Damage and recovery after the 2004 Indian Ocean tsunami in Phang Nga Thailand Nat HazardsEarth Syst Sci 2011 11 1851ndash1862 [CrossRef]
23 Kanniah KD Sheikhi A Cracknell AP Goh HC Tan KP Ho CS Rasli FN Satellite Images forMonitoring Mangrove Cover Changes in a Fast Growing Economic Region in Southern Peninsular MalaysiaRemote Sens 2015 7 14360ndash14385 [CrossRef]
24 Kirui KB Kairo JG Bosire J Viergever KM Rudra S Huxham M Briers RA Mapping of mangroveforest land cover change along the Kenya coastline using Landsat imagery Ocean Coast Manag 2013 8319ndash24 [CrossRef]
25 Kovacs JM de Santiago FF Bastien J Lafrance P An Assessment of Mangroves in Guinea West AfricaUsing a Field and Remote Sensing Based Approach Wetlands 2010 30 773ndash782 [CrossRef]
26 Kuenzer C van Beijma S Gessner U Dech S Land surface dynamics and environmental challenges ofthe Niger Delta Africa Remote sensing-based analyses spanning three decades (1986ndash2013) Appl Geogr2014 53 354ndash368 [CrossRef]
27 Leimgruber P Kelly DS Steininger MK Brunner J Muller T Songer M Forest cover change patternsin Myanmar (Burma) 1990ndash2000 Environ Conserv 2005 32 356ndash364 [CrossRef]
28 LeMarie M van der Zaag P Menting G Bacluete E Schotanus D The use of remote sensing formonitoring environmental indicators The case of the Incomati estuary Mozambique Phys Chem Earth2006 31 857ndash863 [CrossRef]
29 Liu K Liu L Liu HX Li X Wang SG Exploring the effects of biophysical parameters on the spatialpattern of rare cold damage to mangrove forests Remote Sens Environ 2014 150 20ndash33 [CrossRef]
30 Macamo CCF Massuanganhe E Nicolau DK Bandeira SO Adams JB Mangroversquos response tocyclone Eline (2000) What is happening 14 years later Aquat Bot 2016 134 10ndash17 [CrossRef]
31 Manna S Mondal PP Mukhopadhyay A Akhand A Hazra S Mitra D Vegetation cover changeanalysis from multi-temporal satellite data in Jharkhali Island Sundarbans India Indian J Geo-Mar Sci2013 42 331ndash342
32 Misra A Murali RM Vethamony P Assessment of the land useland cover (LULC) and mangrovechanges along the Mandovi-Zuari estuarine complex of Goa India Arab J Geosci 2015 8 267ndash279[CrossRef]
33 Monzon AK Reyes SR Veridiano RK Tumaneng R De Alban JD Synergy of optical and SAR datafor mapping and monitoring mangroves In XXIII ISPRS Congress Commission VI Halounova L Safar VGong J Hanzl V Wu H Vyas A Wang L Musikhin I Tsai F Gruen A et al Eds CopernicusGesellschaft MBH Gottingen Germany 2016 Volume 41 pp 259ndash266
34 Omo-Irabor OO Olobaniyi SB Akunna J Venus V Maina JM Paradzayi C Mangrove vulnerabilitymodelling in parts of Western Niger Delta Nigeria using satellite images GIS techniques and SpatialMulti-Criteria Analysis (SMCA) Environ Monit Assess 2011 178 39ndash51 [CrossRef] [PubMed]
35 Otero V Quisthoudt K Koedam N Dahdouh-Guebas F Mangroves at Their Limits Detection and AreaEstimation of Mangroves along the Sahara Desert Coast Remote Sens 2016 8 512 [CrossRef]
36 Reddy CS Satish KV Pasha SV Jha CS Dadhwal VK Assessment and monitoring of deforestationand land-use changes (1976ndash2014) in Andaman and Nicobar Islands India using remote sensing and GISCurr Sci 2016 111 1492ndash1499 [CrossRef]
37 Salami AT Akinyede J de Gier A A preliminary assessment of NigeriaSat-1 for sustainable mangroveforest monitoring Int J Appl Earth Obs Geoinf 2010 12 S18ndashS22 [CrossRef]
38 Seto KC Fragkias M Mangrove conversion and aquaculture development in Vietnam A remotesensing-based approach for evaluating the Ramsar Convention on Wetlands Glob Environ Chang 2007 17486ndash500 [CrossRef]
Sensors 2018 18 12 15 of 15
39 Shapiro AC Trettin CC Kuchly H Alavinapanah S Bandeira S The Mangroves of the Zambezi DeltaIncrease in Extent Observed via Satellite from 1994 to 2013 Remote Sens 2015 7 16504ndash16518 [CrossRef]
40 Wang L Sousa WP Gong P Integration of object-based and pixel-based classification for mappingmangroves with IKONOS imagery Int J Remote Sens 2004 25 5655ndash5668 [CrossRef]
41 Hamilton SE Casey D Creation of a high spatio-temporal resolution global database of continuousmangrove forest cover for the 21st century (CGMFC-21) Glob Ecol Biogeogr 2016 25 729ndash738 [CrossRef]
42 Olson DM Dinerstein E Wikramanayake ED Burgess ND Powell GVN Underwood ECDrsquoamico JA Itoua I Strand HE Morrison JC et al Terrestrial ecoregions of the world A newmap of life on earth A new global map of terrestrial ecoregions provides an innovative tool for conservingbiodiversity BioScience 2001 51 933ndash938 [CrossRef]
43 Spalding M Kainuma M Collins L World Atlas of Mangroves Earthscan London UK 201044 Hansen MC Potapov PV Moore R Hancher M Turubanova SA Tyukavina A Thau D
Stehman SV Goetz SJ Loveland TR et al High-resolution global maps of 21st-century forest coverchange Science 2013 342 850ndash853 [CrossRef] [PubMed]
45 Fatoyinbo TE Simard M Height and biomass of mangroves in Africa from ICESatGLAS and SRTM Int JRemote Sens 2013 34 668ndash681 [CrossRef]
46 World Bank World Development Indicators Available online httpdatabankworldbankorgdatareportsaspxsource=2ampcountry=SLE (accessed on 31 July 2017)
47 Blinker L Country Environment Profile (CEP) Sierra Leone European Commission Cardiff UK 200648 GoSL (Government of Sierra Leone) Conservation and Wildlife Policy 2010 Government of Sierra Leone
Freetown Sierra Leone 201049 Heymans JJ Vakily JM Structure and Dynamics of the Marine Ecosystem off Sierra Leone for Three Time Periods
1964 1978 1990 Fisheries Centre UBC Vancouver BC Canada 200450 GCLME (Guinea Current Large Marine Ecosystem) Regional Coordinating Unit In Towards Ecosystem-Based
Management of the Guinea Current Large Marine Ecosystem United Nations Development Programme (UNDP)New York NY USA 2013
51 IUCN Strategies for Conservation and Sustainable Management of Mangrove Forest in Sierra Leone IUCN GlandSwitzerland 2007
52 Trzaska S de Sherbinin A Kim-Blanco P Mara V Schnarr E Jaiteh M Mondal P Climate ChangeVulnerability Assessment in Mangrove Regions of Sierra Leone USAID Washington DC USA 2017 Availableonline httpwwwciesincolumbiaeduwa-biccwa-bicc-ccva-abridged-ffpdf (accessed on 20 December2017)
53 Chander G Markham BL Helder DL Summary of current radiometric calibration coefficients for LandsatMSS TM ETM+ and EO-1 ALI sensors Remote Sens Environ 2009 113 893ndash903 [CrossRef]
54 Zhu Z Wang S Woodcock CE Improvement and expansion of the Fmask algorithm Cloud cloudshadow and snow detection for Landsats 4ndash7 8 and Sentinel 2 images Remote Sens Environ 2015 159269ndash277 [CrossRef]
55 Zhu Z Woodcock CE Object-based cloud and cloud shadow detection in Landsat imagery Remote SensEnviron 2012 118 83ndash94 [CrossRef]
56 GitHub fmask Available online httpsgithubcomprs021fmask (accessed on 31 July 2017)57 Arthur D Vassilvitskii S k-means++ The advantages of careful seeding In Proceedings of the eighteenth
Annual ACM-SIAM Symposium on Discrete Algorithms Society for Industrial and Applied MathematicsNew Orleans Louisiana 7ndash9 January 2007 pp 1027ndash1035
copy 2017 by the authors Licensee MDPI Basel Switzerland This article is an open accessarticle distributed under the terms and conditions of the Creative Commons Attribution(CC BY) license (httpcreativecommonsorglicensesby40)