Embed Size (px)
Citation preview
BioOne sees sustainable scholarly publishing as an inherently collaborative enterprise connecting authors, nonprofit publishers, academic institutions, researchlibraries, and research funders in the common goal of maximizing access to critical research.
Land Use–Land Cover Changes in the Lower Eastern Shore Watersheds andCoastal Bays of Maryland: 1986–2006Author(s): Osarodion K. Nosakhare, Isoken T. Aighewi, Albert Y. Chi, Ali B. Ishaque, and GodwinMbamaluSource: Journal of Coastal Research, 28(1A):54-62. 2012.Published By: Coastal Education and Research FoundationDOI: http://dx.doi.org/10.2112/JCOASTRES-D-09-00074.1URL: http://www.bioone.org/doi/full/10.2112/JCOASTRES-D-09-00074.1
BioOne (www.bioone.org) is a nonprofit, online aggregation of core research in the biological, ecological, andenvironmental sciences. BioOne provides a sustainable online platform for over 170 journals and books publishedby nonprofit societies, associations, museums, institutions, and presses.
Your use of this PDF, the BioOne Web site, and all posted and associated content indicates your acceptance ofBioOne’s Terms of Use, available at www.bioone.org/page/terms_of_use.
Usage of BioOne content is strictly limited to personal, educational, and non-commercial use. Commercial inquiriesor rights and permissions requests should be directed to the individual publisher as copyright holder.

www.cerf-jcr.org
Land Use–Land Cover Changes in the Lower Eastern ShoreWatersheds and Coastal Bays of Maryland: 1986–2006
Osarodion K. Nosakhare{*, Isoken T. Aighewi{**, Albert Y. Chi1, Ali B. Ishaque{, andGodwin Mbamalu{
{Department of Natural SciencesUniversity of Maryland Eastern ShorePrincess Anne, MD 21835
{Benedict CollegeDepartment of BiologyChemistry and Environmental Health
Science1600 Harden StreetColumbia, SC [email protected]
1Department of Mathematics and ComputerScience
University of Maryland Eastern ShorePrincess Anne, MD 21853
ABSTRACT
NOSAKHARE, O.K.; AIGHEWI, I.T.; CHI, A.Y.; ISHAQUE, A.B., and MBAMALU, G., 2012. Land use–land coverchanges in the lower Eastern Shore watersheds and coastal bays of Maryland: 1986–2006. Journal of Coastal Research,28(1A), 54–62. West Palm Beach (Florida), ISSN 0749-0208.
Changes in land use influence surface-water quality and thus present a potential threat to coastal ecosystem health.Land use–land cover changes (LULCC) in the lower Eastern Shore watersheds of Maryland have been rapid in the lastdecade, with increase in real estate development an obvious indicator. The objective of this study was to evaluate theextent of historical LULCC in the lower Eastern Shore watershed and coastal bays of Maryland from 1986 to 2006. Landuse–land cover data were derived by supervised classification of Landsat TM 5 satellite imagery acquired in 1986, 1996,and 2006 using the Anderson level-1 classification system in Environment for Visualizing Images (ENVI 4.5), whileLULCCs were detected in an Arc-GIS 9.2 environment.
The results showed that while urban and forest lands increased by 121.8% and 8.5%, respectively, in the lower EasternShore from 1986 to 2006, croplands and wetlands decreased by 19.6% and 21.3%, respectively. Area covered by surface waterincreased by 10%, submerging mostly wetlands of 150 km2 in 17 of the 23 subwatersheds studied. The loss of these coastalwetlands is attributable in part to the changing climate and the resultant sea-level rise and in part to the activities of theinvasive rodent Nutria (Myocastor coypus), reported to be a major menace in Maryland’s Eastern Shore. The decliningwetlands have serious ecological health implications for the Chesapeake Bay and its watersheds for several species and thusrequire urgent attention. More intensive and frequent monitoring of this delicate estuarine ecosystem is suggested.
www.JCRonline.org
INTRODUCTION
Land use and water resources are intimately liked. Indeed,
one of the most important factors that can affect the quality of a
surface-water body is the land use within its watershed. Land
use and land cover largely determine the type and amount of
contaminants entering streams, lakes, and underground
pathways (Dale et al., 2000; Gergel et al., 2002). In addition,
increasing human population density can directly and indi-
rectly influence waste generation and discharge and thus
influence the concentration of chloride, nitrate, and a variety of
pesticides in streams that drain urban and suburban settings.
The watershed of the Chesapeake Bay, the largest estuary in
the United States, drains 166,534 km2 of land in six states:
Maryland, Virginia, Delaware, Pennsylvania, West Virginia,
and New York, as well as the District of Columbia. The
population of this area has increased over the years, resulting
in negative effects on the surface-water systems and the fragile
coastal ecosystem. Approximately 17 million people live in the
Chesapeake watershed, and about 10 million people live along
its shores or near them. Between 1950 and 1980, approximately
1.09 million hectares of land was lost to development
(Chesapeake Eco-Check, 2009). Such changes in land use have
been specifically correlated with the degradation of biological,
chemical, and physical properties of streams within the
Chesapeake Bay watershed (Palmer et al., 2002). The lower
Eastern Shore watershed and coastal bays of Maryland
(subsets of the Chesapeake Bay watershed) in particular have
experienced several episodes of hypoxia during the summer
months as a result of such nutrient loading from natural and
anthropogenic activities (Chesapeake Bay Program, 2010).
Jantz, Goetz, and Jantz (2004) observed a 61% increase in
developed land within the Chesapeake Bay watershed between
1990 and 2000, with 64% of the new development occurring on
agricultural lands and grasslands, while 33% occurred on
forested lands. The U.S. Environmental Protection Agency
(Boward et al., 1999) has since confirmed these statistics and
has stated that if the rate of urban sprawl continued, more
streams will likely degrade. In 1999, about 16% of Maryland’s
land area was urban, and urban area was expected to grow to
21% in the next 25 years, while only 42% of the state was
forested. The availability of remotely sensed satellite data from
DOI: 10.2112/JCOASTRES-D-09-00074.1 received 28 June 2009;accepted in revision 25 March 2010.* Present address: Purdue University, West Lafayette, IN 47904.** Corresponding author.’ Coastal Education & Research Foundation 2012
Journal of Coastal Research 28 1A 54–62 West Palm Beach, Florida January 2012

satellites such as Landsat, SPOT, and IKONOS, as well as the
evolving geospatial technologies–remote sensing and geo-
graphic information systems (GIS), is creating new opportuni-
ties for enhanced evaluation of land use changes and impact on
ecosystems worldwide. For example, these data have been used
for assessing land use change impact on water quality in
several studies worldwide, e.g., in Alabama (Bhuttarai et al.,
2008) and California (Charbonneau and Kondolf, 2006) in the
United States; in China (Liu et al., 2003); in Turkey
(Baspehlivan et al., 2004); and in several other areas. In the
United States, a geospatial technology–based Coastal Change
Analysis Program was initiated by the National Oceanic and
Atmospheric Administration (NOAA) for monitoring land use–
land cover (LULC) changes of the coastal regions on a 5-year
basis starting from 1996 (NOAA, 2007) and is currently
investigating techniques for trend analysis as they apply to
land cover change data. Similarly, the Multi-Resolution Land
Characteristics Consortium (MRLC) national land cover data
also exist for 1973, 1992, and 2001 (MRLC, 2008). However, no
published analysis of long-term trends in LULC exists—
particularly in view of the rapidly changing demography and
in view of changes in the agronomic and poultry industries of
the coastal Eastern Shore of Maryland since the 1980s. This
study was therefore initiated to quantify the historical LULC
changes in the lower Eastern Shore watersheds of Maryland
over a 20-year period (1986–2006) using remote sensing
techniques as a possible strategy for driving future manage-
ment decisions of this fragile ecosystem.
STUDY AREA
This study was conducted in the lower Eastern Shore
watershed and coastal bays of Maryland, which lies between
longitudes 74u59915.20W and 76u1795.60W and latitudes
37u54912.40N and 38u53910.70N. This study area is located
between the Atlantic Ocean and the Chesapeake Bay and
drains approximately 5596.69 km2 in Wicomico, Somerset, and
Worcester counties, and some portions of Caroline and
Dorchester counties. The major land use in this area includes
cropland, forestry, pasture, and urban; and water bodies
include estuary, river/stream, and abundant wetlands. The
area that is less than 30.5 meters above sea level includes a
total of 23 subwatersheds (U.S. EPA, 2009) (see Figure 1). The
main economic activities in the lower Eastern Shore are poultry
production and grain farming of corn, soybeans, and barley.
Other important economic activities include a declining fishing
industry, which remains important in the Chesapeake Bay
area, as well as tourism.
DATA AND METHODS
Satellite Image Data Acquisition
Landsat 5 TM satellite data of Maryland (Path 14, rows 33
and 34) for 1986 (May 6), 1996 (May 1), and 2006 (April 27)
were obtained in geotiff format from the U.S. Geological Survey
(USGS) Center for Earth Resources Observation and Science.
These images were of 10 days temporal variability (1986–2006)
due to cloud cover and were systematically corrected; the
data were of very high acquisition quality and had been
georeferenced and atmospherically corrected. The reflective
bands 1–5 and 7 were of pixel size of 30 m, while the thermal
band 6 was 60 m. All maps were projected using NAD83
Universal Transverse Mercator Zone 18.
Classification and Geospatial Analysis
Study area LULC classification was done in Environment for
Visualizing Images (ENVI 4.5) acquired from ITT Visual
Information Solutions (ITT VIS, 2008). Bands 7, 4, and 2 were
selected for supervised classification using the Mahalanobis
distance method after several trials. The reference group or
regions of interest selection was guided by aerial photos, Google
Earth (2009), and some ground truthing and personal
knowledge of the study area. The LULC classification system
of Anderson et al. (1976) was used. It classifies LULC into nine
major categories: urban or built-up land, agricultural land,
rangeland, forest land, water, wetland, barren land, tundra,
and perennial snow or ice at the level 1. However, range-
land, tundra, and perennial snow land cover types are absent
in the study location and were eliminated from the classifica-
tion scheme. The classified images were exported into a
GIS environment (ESRI, 2007), where spatial analysis was
completed.
The 1986 Landsat images for rows 33 and 34 were merged,
and each subwatershed was masked and extracted. Areas of
various land use in each watershed were quantified by
multiplying the number of pixels for each land use by the
spatial resolution (30 m 3 30 m) of the Landsat images from
which the LULC data were derived. Land use changes at 10-
year intervals (1986–1996 and 1996–2006) and 20-year
interval (1986–2006) were derived by overlaying the respective
LULC maps for each interval. The Kruskal-Wallis one-way
nonparametric analysis of variance test and the post hoc paired
test were employed to evaluate the how significantly the LULC
changed between each time interval for the same area.
Figure 1. Study area showing the lower Eastern Shore subwatersheds
of Maryland.
Land use changes in Maryland’s Eastern Shore 55
Journal of Coastal Research, Vol. 28, No. 1A (Supplement), 2012
RESULTS AND DISCUSSION
The LULC of the lower Eastern Shore subwatersheds for
1986, 1996, and 2006 are shown in Figures 2, 3, and 4,
respectively. The extent of LULC change by class from 1986 to
2006 is shown in Figure 5 and summarized in Table 1. During
this period, forestlands and area covered by water increased by
8.5% and 10%, respectively, while urban land increased by
121.8%. However, there was a net loss of agricultural lands
(19.6%), wetlands (21.3%), and barren lands (51.3%) within the
same period. The following sections outline specific changes
that occurred in the subwatersheds with respect to the major
LULC.
Urban Land Use of Subwatersheds
All the subwatersheds in the study area experienced an
increase in urban land use between 1986 and 2006 (Fig. 6)
except the narrow coastal bays bordering the Atlantic Ocean
consisting of basically water (99.6%) and beaches (0.2%). The
largest net gain in urban land occurred in the Lower Wicomico
subwatershed. Urban land increased by 18.26 km2 in the Lower
Wicomico River subwatershed during the study period
(11.37%). Using the Kruskal-Wallis test and the post hoc
paired comparisons, this subwatershed increased significantly
(p , 0.05, H 5 9.87, n 5 23) in urban land area between 1986
and 2006 after a total of 227.29 km2 of other land uses were
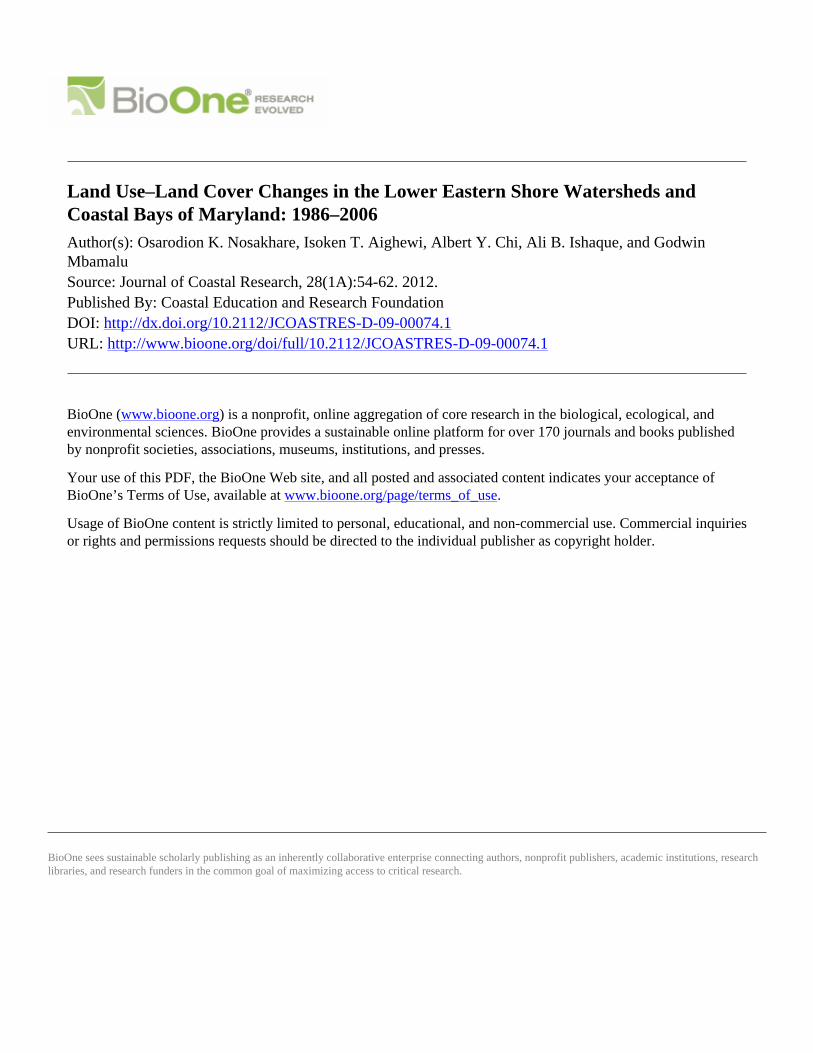
Figure 2. Land and use–land cover of the lower Eastern Shore of
Maryland in 1986.
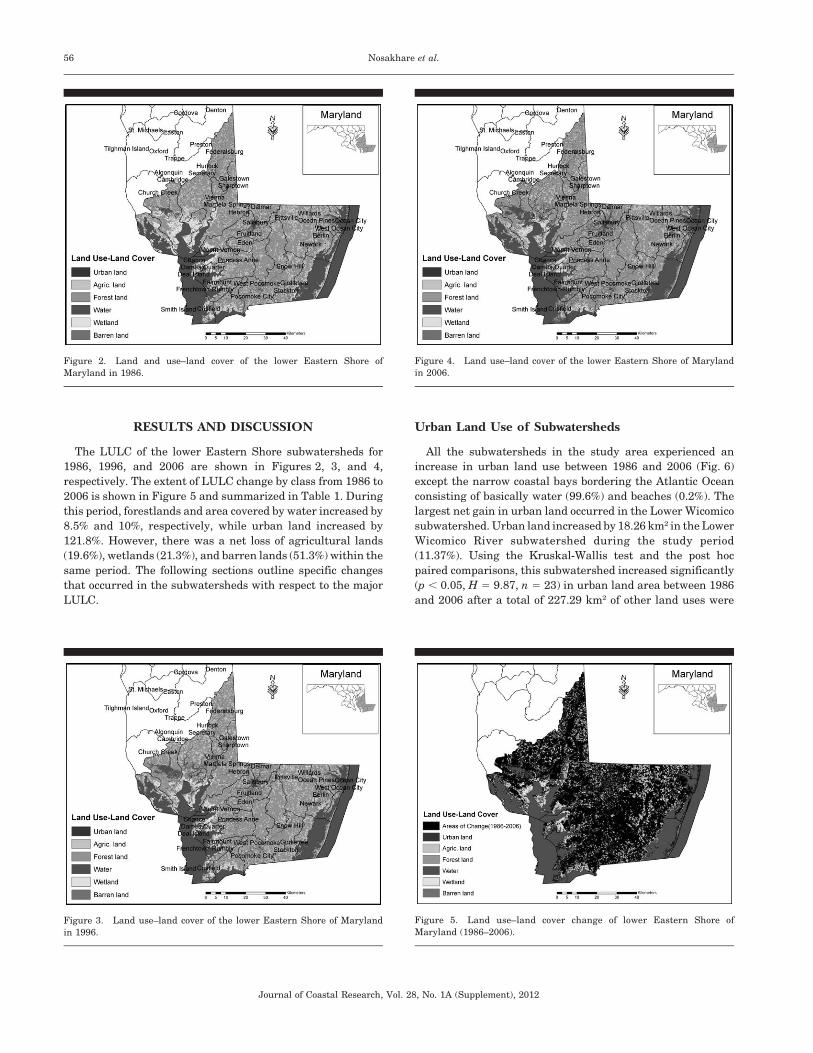
Figure 3. Land use–land cover of the lower Eastern Shore of Maryland
in 1996.
Figure 4. Land use–land cover of the lower Eastern Shore of Maryland
in 2006.
Figure 5. Land use–land cover change of lower Eastern Shore of
Maryland (1986–2006).
56 Nosakhare et al.
Journal of Coastal Research, Vol. 28, No. 1A (Supplement), 2012
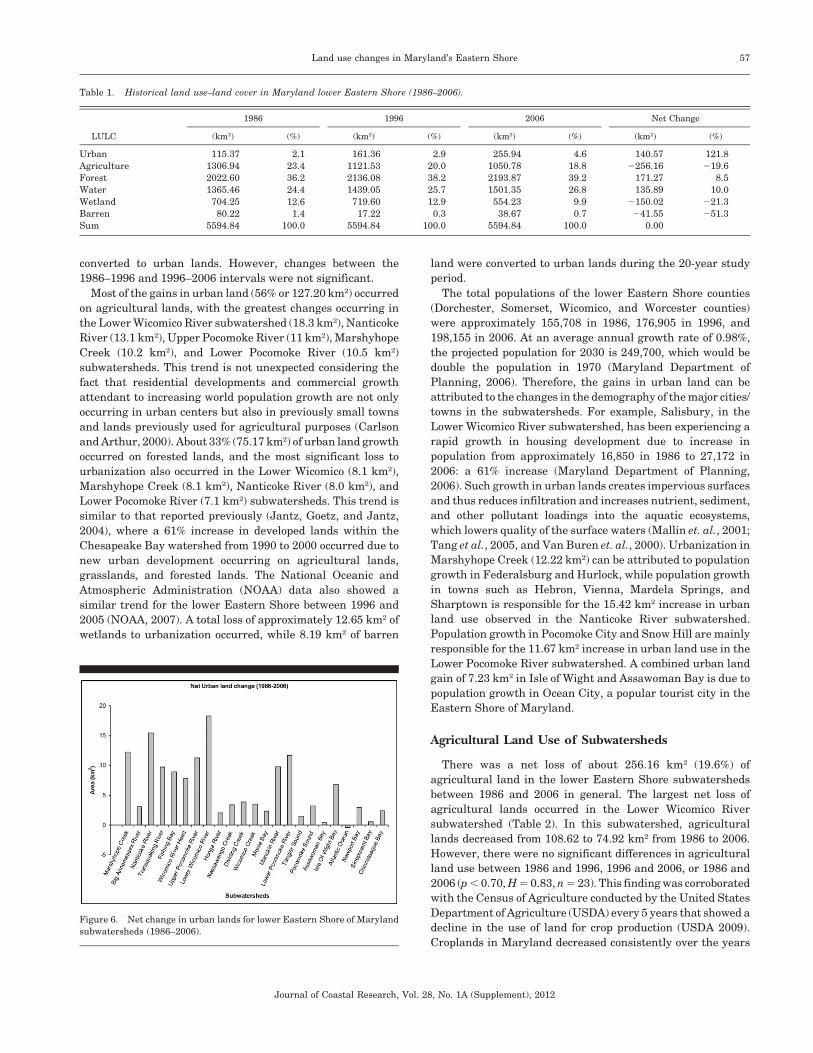
converted to urban lands. However, changes between the
1986–1996 and 1996–2006 intervals were not significant.
Most of the gains in urban land (56% or 127.20 km2) occurred
on agricultural lands, with the greatest changes occurring in
the Lower Wicomico River subwatershed (18.3 km2), Nanticoke
River (13.1 km2), Upper Pocomoke River (11 km2), Marshyhope
Creek (10.2 km2), and Lower Pocomoke River (10.5 km2)
subwatersheds. This trend is not unexpected considering the
fact that residential developments and commercial growth
attendant to increasing world population growth are not only
occurring in urban centers but also in previously small towns
and lands previously used for agricultural purposes (Carlson
and Arthur, 2000). About 33% (75.17 km2) of urban land growth
occurred on forested lands, and the most significant loss to
urbanization also occurred in the Lower Wicomico (8.1 km2),
Marshyhope Creek (8.1 km2), Nanticoke River (8.0 km2), and
Lower Pocomoke River (7.1 km2) subwatersheds. This trend is
similar to that reported previously (Jantz, Goetz, and Jantz,
2004), where a 61% increase in developed lands within the
Chesapeake Bay watershed from 1990 to 2000 occurred due to
new urban development occurring on agricultural lands,
grasslands, and forested lands. The National Oceanic and
Atmospheric Administration (NOAA) data also showed a
similar trend for the lower Eastern Shore between 1996 and
2005 (NOAA, 2007). A total loss of approximately 12.65 km2 of
wetlands to urbanization occurred, while 8.19 km2 of barren
land were converted to urban lands during the 20-year study
period.
The total populations of the lower Eastern Shore counties
(Dorchester, Somerset, Wicomico, and Worcester counties)
were approximately 155,708 in 1986, 176,905 in 1996, and
198,155 in 2006. At an average annual growth rate of 0.98%,
the projected population for 2030 is 249,700, which would be
double the population in 1970 (Maryland Department of
Planning, 2006). Therefore, the gains in urban land can be
attributed to the changes in the demography of the major cities/
towns in the subwatersheds. For example, Salisbury, in the
Lower Wicomico River subwatershed, has been experiencing a
rapid growth in housing development due to increase in
population from approximately 16,850 in 1986 to 27,172 in
2006: a 61% increase (Maryland Department of Planning,
2006). Such growth in urban lands creates impervious surfaces
and thus reduces infiltration and increases nutrient, sediment,
and other pollutant loadings into the aquatic ecosystems,
which lowers quality of the surface waters (Mallin et. al., 2001;
Tang et al., 2005, and Van Buren et. al., 2000). Urbanization in
Marshyhope Creek (12.22 km2) can be attributed to population
growth in Federalsburg and Hurlock, while population growth
in towns such as Hebron, Vienna, Mardela Springs, and
Sharptown is responsible for the 15.42 km2 increase in urban
land use observed in the Nanticoke River subwatershed.
Population growth in Pocomoke City and Snow Hill are mainly
responsible for the 11.67 km2 increase in urban land use in the
Lower Pocomoke River subwatershed. A combined urban land
gain of 7.23 km2 in Isle of Wight and Assawoman Bay is due to
population growth in Ocean City, a popular tourist city in the
Eastern Shore of Maryland.
Agricultural Land Use of Subwatersheds
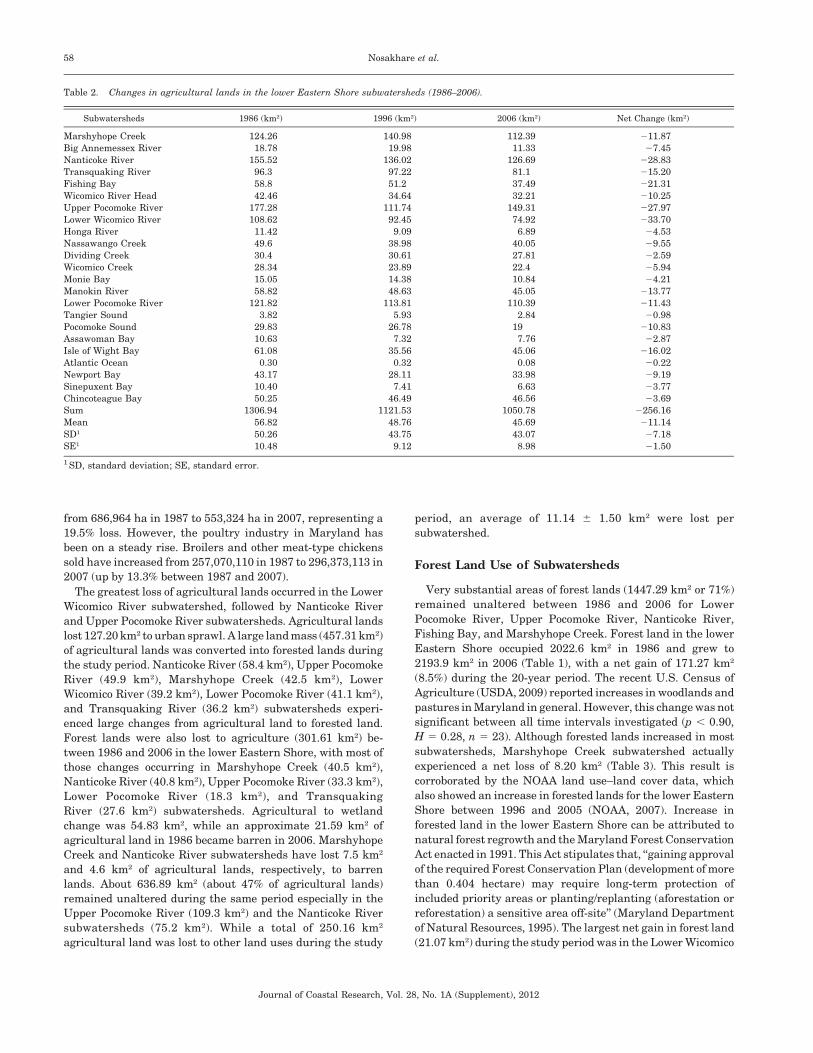
There was a net loss of about 256.16 km2 (19.6%) of
agricultural land in the lower Eastern Shore subwatersheds
between 1986 and 2006 in general. The largest net loss of
agricultural lands occurred in the Lower Wicomico River
subwatershed (Table 2). In this subwatershed, agricultural
lands decreased from 108.62 to 74.92 km2 from 1986 to 2006.
However, there were no significant differences in agricultural
land use between 1986 and 1996, 1996 and 2006, or 1986 and
2006 (p , 0.70, H 5 0.83, n 5 23). This finding was corroborated
with the Census of Agriculture conducted by the United States
Department of Agriculture (USDA) every 5 years that showed a
decline in the use of land for crop production (USDA 2009).
Croplands in Maryland decreased consistently over the years
Figure 6. Net change in urban lands for lower Eastern Shore of Maryland
subwatersheds (1986–2006).
Table 1. Historical land use–land cover in Maryland lower Eastern Shore (1986–2006).
LULC
1986 1996 2006 Net Change
(km2) (%) (km2) (%) (km2) (%) (km2) (%)
Urban 115.37 2.1 161.36 2.9 255.94 4.6 140.57 121.8
Agriculture 1306.94 23.4 1121.53 20.0 1050.78 18.8 2256.16 219.6
Forest 2022.60 36.2 2136.08 38.2 2193.87 39.2 171.27 8.5
Water 1365.46 24.4 1439.05 25.7 1501.35 26.8 135.89 10.0
Wetland 704.25 12.6 719.60 12.9 554.23 9.9 2150.02 221.3
Barren 80.22 1.4 17.22 0.3 38.67 0.7 241.55 251.3
Sum 5594.84 100.0 5594.84 100.0 5594.84 100.0 0.00
Land use changes in Maryland’s Eastern Shore 57
Journal of Coastal Research, Vol. 28, No. 1A (Supplement), 2012
from 686,964 ha in 1987 to 553,324 ha in 2007, representing a
19.5% loss. However, the poultry industry in Maryland has
been on a steady rise. Broilers and other meat-type chickens
sold have increased from 257,070,110 in 1987 to 296,373,113 in
2007 (up by 13.3% between 1987 and 2007).
The greatest loss of agricultural lands occurred in the Lower
Wicomico River subwatershed, followed by Nanticoke River
and Upper Pocomoke River subwatersheds. Agricultural lands
lost 127.20 km2 to urban sprawl. A large land mass (457.31 km2)
of agricultural lands was converted into forested lands during
the study period. Nanticoke River (58.4 km2), Upper Pocomoke
River (49.9 km2), Marshyhope Creek (42.5 km2), Lower
Wicomico River (39.2 km2), Lower Pocomoke River (41.1 km2),
and Transquaking River (36.2 km2) subwatersheds experi-
enced large changes from agricultural land to forested land.
Forest lands were also lost to agriculture (301.61 km2) be-
tween 1986 and 2006 in the lower Eastern Shore, with most of
those changes occurring in Marshyhope Creek (40.5 km2),
Nanticoke River (40.8 km2), Upper Pocomoke River (33.3 km2),
Lower Pocomoke River (18.3 km2), and Transquaking
River (27.6 km2) subwatersheds. Agricultural to wetland
change was 54.83 km2, while an approximate 21.59 km2 of
agricultural land in 1986 became barren in 2006. Marshyhope
Creek and Nanticoke River subwatersheds have lost 7.5 km2
and 4.6 km2 of agricultural lands, respectively, to barren
lands. About 636.89 km2 (about 47% of agricultural lands)
remained unaltered during the same period especially in the
Upper Pocomoke River (109.3 km2) and the Nanticoke River
subwatersheds (75.2 km2). While a total of 250.16 km2
agricultural land was lost to other land uses during the study
period, an average of 11.14 6 1.50 km2 were lost per
subwatershed.
Forest Land Use of Subwatersheds
Very substantial areas of forest lands (1447.29 km2 or 71%)
remained unaltered between 1986 and 2006 for Lower
Pocomoke River, Upper Pocomoke River, Nanticoke River,
Fishing Bay, and Marshyhope Creek. Forest land in the lower
Eastern Shore occupied 2022.6 km2 in 1986 and grew to
2193.9 km2 in 2006 (Table 1), with a net gain of 171.27 km2
(8.5%) during the 20-year period. The recent U.S. Census of
Agriculture (USDA, 2009) reported increases in woodlands and
pastures in Maryland in general. However, this change was not
significant between all time intervals investigated (p , 0.90,
H 5 0.28, n 5 23). Although forested lands increased in most
subwatersheds, Marshyhope Creek subwatershed actually
experienced a net loss of 8.20 km2 (Table 3). This result is
corroborated by the NOAA land use–land cover data, which
also showed an increase in forested lands for the lower Eastern
Shore between 1996 and 2005 (NOAA, 2007). Increase in
forested land in the lower Eastern Shore can be attributed to
natural forest regrowth and the Maryland Forest Conservation
Act enacted in 1991. This Act stipulates that, ‘‘gaining approval
of the required Forest Conservation Plan (development of more
than 0.404 hectare) may require long-term protection of
included priority areas or planting/replanting (aforestation or
reforestation) a sensitive area off-site’’ (Maryland Department
of Natural Resources, 1995). The largest net gain in forest land
(21.07 km2) during the study period was in the Lower Wicomico
Table 2. Changes in agricultural lands in the lower Eastern Shore subwatersheds (1986–2006).
Subwatersheds 1986 (km2) 1996 (km2) 2006 (km2) Net Change (km2)
Marshyhope Creek 124.26 140.98 112.39 211.87
Big Annemessex River 18.78 19.98 11.33 27.45
Nanticoke River 155.52 136.02 126.69 228.83
Transquaking River 96.3 97.22 81.1 215.20
Fishing Bay 58.8 51.2 37.49 221.31
Wicomico River Head 42.46 34.64 32.21 210.25
Upper Pocomoke River 177.28 111.74 149.31 227.97
Lower Wicomico River 108.62 92.45 74.92 233.70
Honga River 11.42 9.09 6.89 24.53
Nassawango Creek 49.6 38.98 40.05 29.55
Dividing Creek 30.4 30.61 27.81 22.59
Wicomico Creek 28.34 23.89 22.4 25.94
Monie Bay 15.05 14.38 10.84 24.21
Manokin River 58.82 48.63 45.05 213.77
Lower Pocomoke River 121.82 113.81 110.39 211.43
Tangier Sound 3.82 5.93 2.84 20.98
Pocomoke Sound 29.83 26.78 19 210.83
Assawoman Bay 10.63 7.32 7.76 22.87
Isle of Wight Bay 61.08 35.56 45.06 216.02
Atlantic Ocean 0.30 0.32 0.08 20.22
Newport Bay 43.17 28.11 33.98 29.19
Sinepuxent Bay 10.40 7.41 6.63 23.77
Chincoteague Bay 50.25 46.49 46.56 23.69
Sum 1306.94 1121.53 1050.78 2256.16
Mean 56.82 48.76 45.69 211.14
SD1 50.26 43.75 43.07 27.18
SE1 10.48 9.12 8.98 21.50
1 SD, standard deviation; SE, standard error.
58 Nosakhare et al.
Journal of Coastal Research, Vol. 28, No. 1A (Supplement), 2012

subwatershed. Gains in forest land from other land uses
decreased in the following order: agricultural land to forest
(457.31 km2), wetland to forest (204.45 km2), urban to forest
(38.48 km2), water to forest (27.53 km2), and barren land to
forest (19.38 km2).
Surface-Water Cover
There was a net gain of about 135.89 km2 (10%) of areas
covered by water in the lower Eastern Shore subwatersheds
between 1986 and 2006. During the study period, however,
154.61 km2 of wetlands became inundated. Most of this
inundation occurred in Fishing Bay (55.77 km2) (Fig. 7 and 8)
situated at the edge of Chesapeake Bay in Dorchester county.
Conversely, only 31.44 km2 of water-covered areas in 1986
became wetlands in 2006, with Fishing Bay also experiencing
the most change of 6.4 km2. Some forested lands (32.2 km2)
were also inundated by water during the study period, while
9.6 km2 of agricultural lands also became inundated with
water. About 6.6 km2 of urban lands similarly became
inundated by water, while a total change from barren land to
water in the lower Eastern Shore was 1.63 km2 during the
study period. New areas covered by land between 1986 and
2006 are shown in Figure 8. Increase in water cover in the
lower Eastern Shore of Maryland is due in part to sea-level
rise—perhaps a global warming effect on the estuarine
tributaries of the Chesapeake Bay, which empties into the
Atlantic Ocean. This rise is indicated by the decrease in the
extent of wetlands and salt marshes (by 22%) through
submergence, and a decrease in barren land (by 2%) during
the study period. Hilbert (2006) reported a similar trend in the
Grand Bay National Estuarine Research Reserve area of
Mississippi in the northern coast of the Gulf of Mexico from
1974 to 2001.
Wetlands
Loss of wetlands was observed in 17 out of the 23
subwatersheds in the study area (Table 4). There was a 23%
net loss (150.02 km2) of wetlands from 1986 to 2006 in the study
area (Table 2). But these losses were not significant (p , 0.50,
H 5 1.80, n 5 23) for the periods between 1986 and 1996, 1996
and 2006, or 1986 and 2006. Similar results were observed in
Table 3. Changes in forest land in the lower Eastern Shore subwatersheds (1986–2006).
Subwatersheds 1986 (km2) 1996 (km2) 2006 (km2) Net Change (km2)
Marshyhope Creek 171.38 143.48 163.18 28.20
Big Annemessex River 42.67 45.89 51.39 8.72
Nanticoke River 214.78 232.33 232.6 17.82
Transquaking River 139.28 134.27 146.86 7.58
Fishing Bay 153.47 194.07 165.15 11.68
Wicomico River Head 47.86 50.03 49.01 1.15
Upper Pocomoke River 194.21 199.28 200.05 5.84
Lower Wicomico River 126.77 138.49 147.84 21.07
Honga River 30.86 30.09 38.94 8.08
Nassawango Creek 109.95 108.32 113.72 3.77
Dividing Creek 111.84 111.4 112.87 1.03
Wicomico Creek 40.64 43.88 45.92 5.28
Monie Bay 38.1 42.03 43.8 5.70
Manokin River 113.41 127.96 131.34 17.93
Lower Pocomoke River 225.73 239.89 245.98 20.25
Tangier Sound 13.89 14.66 21.92 8.03
Pocomoke Sound 66.67 69.18 73.66 6.99
Assawoman Bay 5.72 8.52 7.11 1.40
Isle of Wight Bay 55.76 66.16 61.89 6.13
Atlantic Ocean 0.01 0.08 0.01 0.00
Newport Bay 48.71 51.91 52.88 4.17
Sinepuxent Bay 8.67 9.10 9.75 1.08
Chincoteague Bay 62.23 75.07 78.01 15.77
Sum 2022.60 2136.08 2193.87 171.27
Mean 87.94 92.87 95.39 7.45
SD 69.10 72.58 72.29 3.18
SE 14.41 15.13 15.07 0.66
Figure 7. Net surface-water cover change in lower Eastern Shore
subwatersheds of Maryland (1986–2006).
Land use changes in Maryland’s Eastern Shore 59
Journal of Coastal Research, Vol. 28, No. 1A (Supplement), 2012
NOAA LULC data, which also showed loss of wetlands for the
lower Eastern Shore between 1996 and 2005 (NOAA, 2007).
The vital ecological functions of wetlands, which include water
quality improvement/preservation, fish and wildlife habitats,
reduction of flood damage, shoreline erosion protection, etc.,
make their decline of great ecological concern. The Congaree
Bottomland Hardwood Swamp in South Carolina was estimat-
ed to remove pollutants equivalent to what is removed annually
by a $5 million wastewater treatment plant (U.S. EPA, 2008).
The decreasing extent of wetlands in the lower Eastern Shore
has the potential to compromise several ecological services
performed by this habitat.
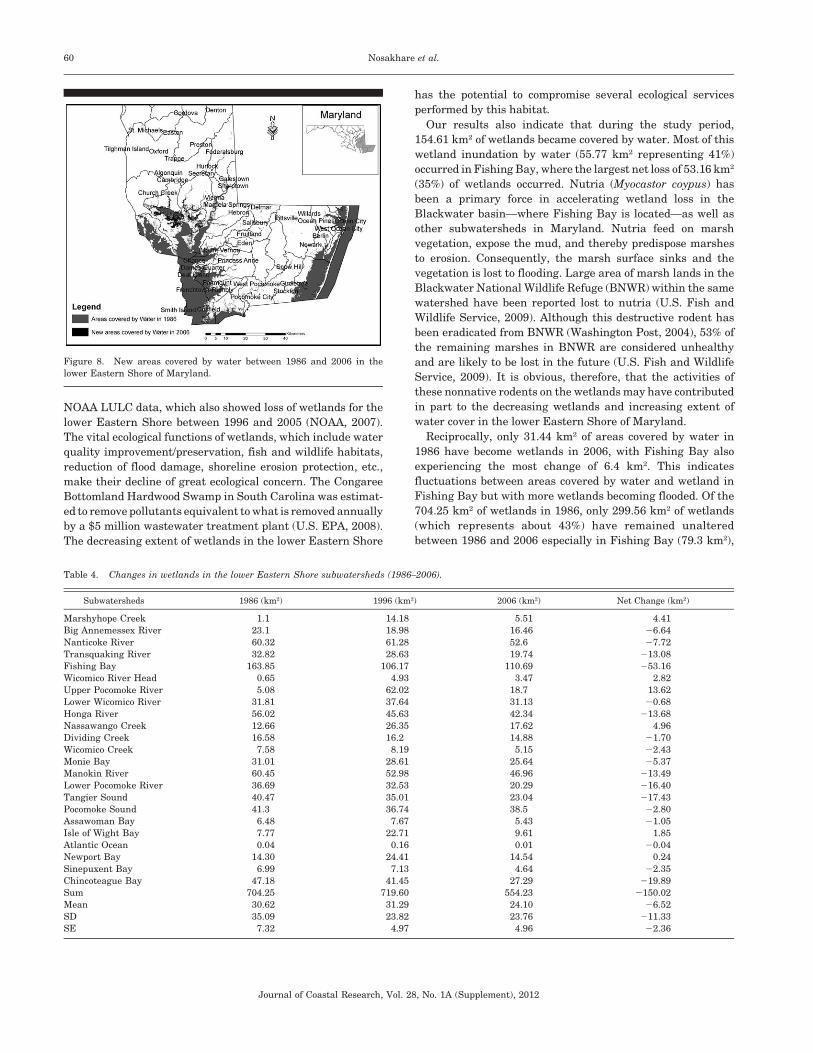
Our results also indicate that during the study period,
154.61 km2 of wetlands became covered by water. Most of this
wetland inundation by water (55.77 km2 representing 41%)
occurred in Fishing Bay, where the largest net loss of 53.16 km2
(35%) of wetlands occurred. Nutria (Myocastor coypus) has
been a primary force in accelerating wetland loss in the
Blackwater basin—where Fishing Bay is located—as well as
other subwatersheds in Maryland. Nutria feed on marsh
vegetation, expose the mud, and thereby predispose marshes
to erosion. Consequently, the marsh surface sinks and the
vegetation is lost to flooding. Large area of marsh lands in the
Blackwater National Wildlife Refuge (BNWR) within the same
watershed have been reported lost to nutria (U.S. Fish and
Wildlife Service, 2009). Although this destructive rodent has
been eradicated from BNWR (Washington Post, 2004), 53% of
the remaining marshes in BNWR are considered unhealthy
and are likely to be lost in the future (U.S. Fish and Wildlife
Service, 2009). It is obvious, therefore, that the activities of
these nonnative rodents on the wetlands may have contributed
in part to the decreasing wetlands and increasing extent of
water cover in the lower Eastern Shore of Maryland.
Reciprocally, only 31.44 km2 of areas covered by water in
1986 have become wetlands in 2006, with Fishing Bay also
experiencing the most change of 6.4 km2. This indicates
fluctuations between areas covered by water and wetland in
Fishing Bay but with more wetlands becoming flooded. Of the
704.25 km2 of wetlands in 1986, only 299.56 km2 of wetlands
(which represents about 43%) have remained unaltered
between 1986 and 2006 especially in Fishing Bay (79.3 km2),
Figure 8. New areas covered by water between 1986 and 2006 in the
lower Eastern Shore of Maryland.
Table 4. Changes in wetlands in the lower Eastern Shore subwatersheds (1986–2006).
Subwatersheds 1986 (km2) 1996 (km2) 2006 (km2) Net Change (km2)
Marshyhope Creek 1.1 14.18 5.51 4.41
Big Annemessex River 23.1 18.98 16.46 26.64
Nanticoke River 60.32 61.28 52.6 27.72
Transquaking River 32.82 28.63 19.74 213.08
Fishing Bay 163.85 106.17 110.69 253.16
Wicomico River Head 0.65 4.93 3.47 2.82
Upper Pocomoke River 5.08 62.02 18.7 13.62
Lower Wicomico River 31.81 37.64 31.13 20.68
Honga River 56.02 45.63 42.34 213.68
Nassawango Creek 12.66 26.35 17.62 4.96
Dividing Creek 16.58 16.2 14.88 21.70
Wicomico Creek 7.58 8.19 5.15 22.43
Monie Bay 31.01 28.61 25.64 25.37
Manokin River 60.45 52.98 46.96 213.49
Lower Pocomoke River 36.69 32.53 20.29 216.40
Tangier Sound 40.47 35.01 23.04 217.43
Pocomoke Sound 41.3 36.74 38.5 22.80
Assawoman Bay 6.48 7.67 5.43 21.05
Isle of Wight Bay 7.77 22.71 9.61 1.85
Atlantic Ocean 0.04 0.16 0.01 20.04
Newport Bay 14.30 24.41 14.54 0.24
Sinepuxent Bay 6.99 7.13 4.64 22.35
Chincoteague Bay 47.18 41.45 27.29 219.89
Sum 704.25 719.60 554.23 2150.02
Mean 30.62 31.29 24.10 26.52
SD 35.09 23.82 23.76 211.33
SE 7.32 4.97 4.96 22.36
60 Nosakhare et al.
Journal of Coastal Research, Vol. 28, No. 1A (Supplement), 2012
Nanticoke River (35.4 km2), Honga River (29.6 km2), and
Manokin River (25.9 km2) subwatersheds. Approximately
204.45 km2 of wetlands became forested between 1986 and
2006. Most of this change has occurred in the Lower Pocomoke
River (25 km2) and Manokin River (23.7 km2) watersheds, as
well as Fishing Bay (21.6 km2). A total of 34.09 km2 of wetlands
was lost to agricultural land use in the study region between
1986 and 2006. Small areas of wetlands also changed to
agricultural land in the Lower Pocomoke River (5.4 km2),
Manokin River (3.4 km2), and Fishing Bay (3.0 km2). About
12.65 km2 of wetlands became urbanized in 2006. Lost areas of
wetland between 1986 and 2006 are shown in Figure 9.
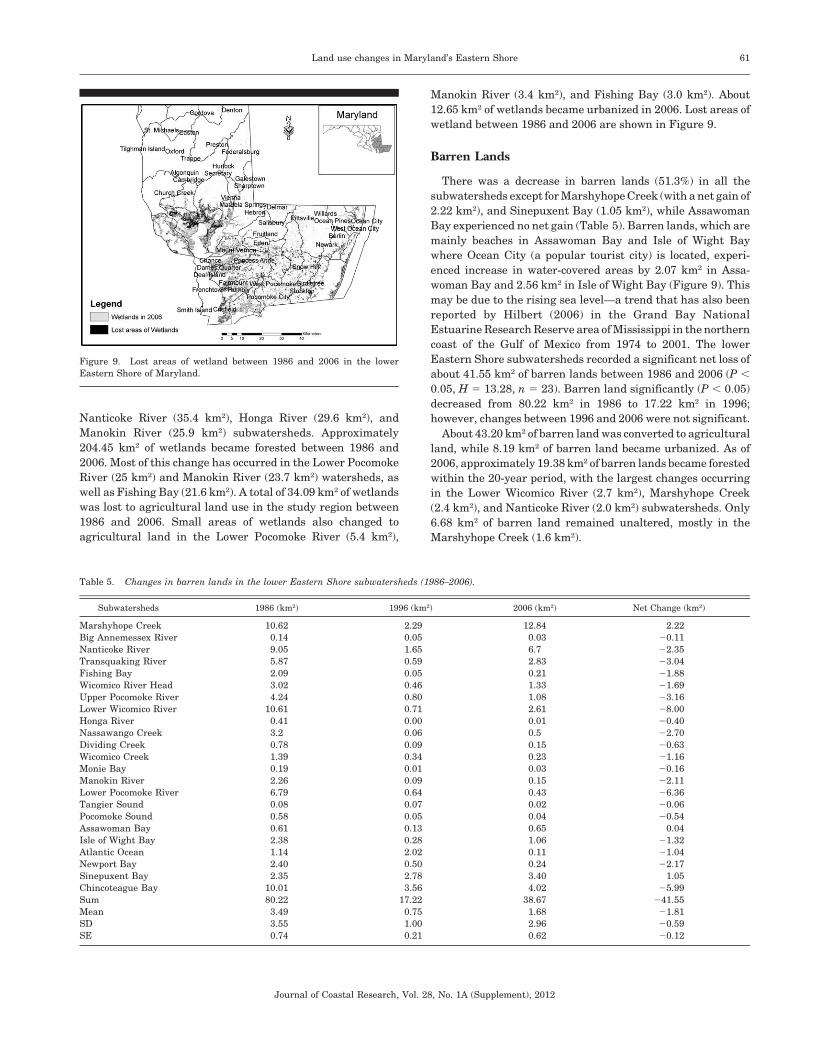
Barren Lands
There was a decrease in barren lands (51.3%) in all the
subwatersheds except for Marshyhope Creek (with a net gain of
2.22 km2), and Sinepuxent Bay (1.05 km2), while Assawoman
Bay experienced no net gain (Table 5). Barren lands, which are
mainly beaches in Assawoman Bay and Isle of Wight Bay
where Ocean City (a popular tourist city) is located, experi-
enced increase in water-covered areas by 2.07 km2 in Assa-
woman Bay and 2.56 km2 in Isle of Wight Bay (Figure 9). This
may be due to the rising sea level—a trend that has also been
reported by Hilbert (2006) in the Grand Bay National
Estuarine Research Reserve area of Mississippi in the northern
coast of the Gulf of Mexico from 1974 to 2001. The lower
Eastern Shore subwatersheds recorded a significant net loss of
about 41.55 km2 of barren lands between 1986 and 2006 (P ,
0.05, H 5 13.28, n 5 23). Barren land significantly (P , 0.05)
decreased from 80.22 km2 in 1986 to 17.22 km2 in 1996;
however, changes between 1996 and 2006 were not significant.
About 43.20 km2 of barren land was converted to agricultural
land, while 8.19 km2 of barren land became urbanized. As of
2006, approximately 19.38 km2 of barren lands became forested
within the 20-year period, with the largest changes occurring
in the Lower Wicomico River (2.7 km2), Marshyhope Creek
(2.4 km2), and Nanticoke River (2.0 km2) subwatersheds. Only
6.68 km2 of barren land remained unaltered, mostly in the
Marshyhope Creek (1.6 km2).
Figure 9. Lost areas of wetland between 1986 and 2006 in the lower
Eastern Shore of Maryland.
Table 5. Changes in barren lands in the lower Eastern Shore subwatersheds (1986–2006).
Subwatersheds 1986 (km2) 1996 (km2) 2006 (km2) Net Change (km2)
Marshyhope Creek 10.62 2.29 12.84 2.22
Big Annemessex River 0.14 0.05 0.03 20.11
Nanticoke River 9.05 1.65 6.7 22.35
Transquaking River 5.87 0.59 2.83 23.04
Fishing Bay 2.09 0.05 0.21 21.88
Wicomico River Head 3.02 0.46 1.33 21.69
Upper Pocomoke River 4.24 0.80 1.08 23.16
Lower Wicomico River 10.61 0.71 2.61 28.00
Honga River 0.41 0.00 0.01 20.40
Nassawango Creek 3.2 0.06 0.5 22.70
Dividing Creek 0.78 0.09 0.15 20.63
Wicomico Creek 1.39 0.34 0.23 21.16
Monie Bay 0.19 0.01 0.03 20.16
Manokin River 2.26 0.09 0.15 22.11
Lower Pocomoke River 6.79 0.64 0.43 26.36
Tangier Sound 0.08 0.07 0.02 20.06
Pocomoke Sound 0.58 0.05 0.04 20.54
Assawoman Bay 0.61 0.13 0.65 0.04
Isle of Wight Bay 2.38 0.28 1.06 21.32
Atlantic Ocean 1.14 2.02 0.11 21.04
Newport Bay 2.40 0.50 0.24 22.17
Sinepuxent Bay 2.35 2.78 3.40 1.05
Chincoteague Bay 10.01 3.56 4.02 25.99
Sum 80.22 17.22 38.67 241.55
Mean 3.49 0.75 1.68 21.81
SD 3.55 1.00 2.96 20.59
SE 0.74 0.21 0.62 20.12
Land use changes in Maryland’s Eastern Shore 61
Journal of Coastal Research, Vol. 28, No. 1A (Supplement), 2012

CONCLUSIONS
Urban land increased by an average of 121.8%, followed by
areas covered by water (10%) and forest lands (8.5%) in the
lower Eastern Shore watersheds from 1986 to 2006. There were
net losses of agricultural land (19.6%), wetlands (21.3%), and
barren land (51.3%) in the past 20 years in the study area. Most
of the urban land gain (56% equivalent to 127.2 km2) occurred
on agricultural land, while 33% (75.17 km2) occurred on
forested land. The largest gains in urban land, as well as loss
of agricultural, forest, and barren lands, occurred in Lower
Wicomico River subwatershed. Net area covered by water
increased by 135.9 km2 from 1986 to 2006 for all subwater-
sheds, and 154.61 km2 of wetlands was inundated or covered by
water. Most of such coverage (41%) occurred in Fishing Bay, in
Dorchester County, and was attributed to the rising sea level,
since these tributaries of the Chesapeake Bay empty into the
Atlantic Ocean. Seventeen out of 23 subwatersheds in the
lower Eastern Shore experienced decreased wetlands areas
from 1986 to 2006. The net area of wetlands lost was 150 km2,
especially in Fishing Bay (35%) where BNWR is located. This
signals change in the coastal ecology attributable in part to
global climate change and the consequent sea-level rise, as well
as wetland subsidence due to the destructive feeding activities
of M. coypus (Nutria)—a nonnative rodent species that feeds on
marsh vegetation. Declining wetlands have serious ecological
implications with respect to the various ecological services
wetlands provide, e.g., habitat for shellfish and waterfowls,
flood buffer, and wastes filter.
LITERATURE CITED
Anderson, J.R.; Hardy, E.E.; Roach, J.T., and Witmer, R.T., 1976. ALand Use and Land Cover Classification System for Use with theRemote Sensor Data. Geological Survey Professional Paper 964. Arevision of the land use classification system as presented in U.S.Geological Survey Circular, p. 671.
Baspehlivan, C.; Sarikaya, O.V.; Karaburun, A., and Doker, M.F.,2004. Land use change detection and water quality management inIstanbul’s water basins by using Ikonos imagery. InternationalArchives of Photogrammetry Remote Sensing and Spatial Informa-tion Sciences, 35(7), 509–512.
Bhuttarai, G.R.; Srivastava, P.; Marzen, L.; Hite, D., and Hatch, U.,2008. Assessment of economic and water quality impacts of landuse change using a simple bioeconomic model. EnvironmentalManagement, 42(1), 122–131.
Boward, D.M.; Kazyak, P.F.; Stranko, S.A.; Hurd, M.K., andProchaska, T.P., 1999. From the Mountains to the Sea: The Stateof Maryland’s Freshwater Streams. U.S. EPA Report 903-R-99-023.Annapolis, Maryland: Maryland Department of Natural Resources,64p.
Carlson, T.N. and Arthur, S.T., 2000. The impact of land use-landcover changes due to urbanization on surface microclimate andhydrology: a satellite perspective. Global and Planetary Change,25(2), 49–65.
Charbonneau, R. and Kondolf, G.M., 2006. Land use change inCalifornia, U.S.A.: nonpoint source water quality impacts. Envi-ronmental Management, 17(4), 453–460.
Chesapeake Eco-Check, 2009. Health Report Card—Chesapeake Eco-Check. http://www.eco-check.org/reportcard/chesapeake/2008 (ac-cessed February 20, 2010).
Chesapeake Bay Foundation, 2010. Bay Area Facts. http://www.cbf.org (accessed February 20, 2010).
Dale, V.H.; Brown, S.; Haeuber, R.; Hobbs, N.T.; Huntly, N.; Naiman,R.J.; Riebsame, W.E.; Turner, M.G., and Valone T., 2000. Ecologicalprinciples and guidelines for managing the use of land. EcologicalApplications, 10(3), 639–670.
ESRI (Environmental Systems Research Institute), 2007. ArcGIS 9.2.Redlands, CA: ESRI.
Gergel, S.E.; Turner, M.G.; Miller, J.R.; Melack, J.M., and Stanley,E.H., 2002. Landscape indicators of human impacts to riverinesystems. Aquatic Science, 64, 118–128.
Google EarthH, 2009. http://earth.google.com (accessed October 2, 2008).Hilbert, W.K., 2006. Land cover change within the Grand Bay
National Estuarine Research Reserve: 1974–2001. Journal ofCoastal Research, 22(6), 1552–1557.
ITT VIS (ITT Visual Information Solutions), 2008. Environment forVisualizing Images. ENVI 4.5. www.itt.com/productservices/ENVI/ENVEX.aspx (accessed February 2, 2008).
Jantz, P.; Goetz, S., and Jantz, C.A., 2004. Urbanization and the lossof resource lands within the Chesapeake Bay watershed. Environ-mental Management, 36(6), 808–825.
Liu, J.; Liu, M.; Zhang, D.; Zhang, Z., and Deng, X., 2003. Study onspatial pattern of land-use change in China during 1995–2000.Science in China Series D: Earth Sciences, 46(4), 373–384.
Mallin, M.A.; Ensign, S.H.; McIver, M.R.; Shank, G.C., and Fowler,P.K., 2001. Demographic, landscape, and meteorological factorscontrolling the microbial pollution of coastal waters. Hydrobiologia,460, 185–193.
Maryland Department of Natural Resources, 1995. Forest Service:Urban and Community Forestry. Forest Conservation Act. http://www.dnr.state.md.us/forests/programapps/newFCA.asp (accessedMay 6, 2009).
Maryland Department of Planning, 2006. Historical and ProjectedTotal Population for Maryland’s Jurisdictions. Planning DataServices. http://www.mdp.state.md.us/msdc/popproj/TOTPOP_PROJ06.pdf (accessed October 1, 2008).
MRLC (Multi-Resolution Land Characteristics Consorutium), 2008.National Land Cover Database. http://www.mrlc.gov/index.php(accessed May 5, 2008).
NOAA (National Oceanic and Atmospheric Administration), 2007.Coastal Services Center. Land Cover Analysis: Northeast LandCover. http://www.csc.noaa.gov/crs/lca/northeast.html (accessedMay 5, 2009).
Palmer, M.A.; Moglen, G.E.; Bockstael, N.E.; Brooks, S.; Pizzuto, J.E.;Wiegand, C., and VanNess, K., 2002. The ecological consequences ofchanging land use for running waters: the suburban Marylandcase. Yale Bulletin of Environmental Science, 107, 85–113.
Tang, Z.; Engel, B.A.; Pijanowski, B.C., and Lim, K.J., 2005.Forecasting land use change and its environmental impact at awatershed scale. Journal of Environmental Management, 76(1), 35–45.
USDA (U.S. Department of Agriculture), 2009. Census of Agriculture.http://www.agcensus.usda.gov./Publications/2007/Full_Report/Volume_1,_Chapter_1_State_Level/Maryland/st24_1_001_001.pdf(accessed November 7, 2008).
U.S. EPA (U.S. Environmental Protection Agency), 2008. WatershedsAcademy: Wetland Functions and Values. http://www.epa.gov/watertrain/wetlands/index.htm (accessed November 7, 2008).
U.S. EPA, 2009. U.S Environmental Protection Agency Surf YourWatershed. http://cfpub.epa.gov/surf/locate/hucperstate_search.cfm?statepostal5MD (accessed May 6, 2009).
U.S. Fish and Wildlife Service, 2009. Blackwater National Wild-life Refuge: Nutria and Blackwater Refuge. http://www.fws.gov/blackwater/nutriafact.html#damage (accessed May 6, 2009).
Van Buren, M.A.; Watt, W.E.; Marsalek, J., and Anderson, B., 2000.Thermal enhancement of storm water runoff by paved surfaces.Water Research, 34, 1359–1371.
Washington Post, 2004. Blackwater Refuge Now Nutria-Free: Marsh-Demolishing Rodent Fended Off Earlier Efforts, by Fahrenthold, D.A.Nov. 17, 2004 Issue, Page B01. http://www.washingtonpost.com/wp-dyn/articles/A55356-2004Nov16.html (accessed May 8, 2009).
62 Nosakhare et al.
Journal of Coastal Research, Vol. 28, No. 1A (Supplement), 2012