Embed Size (px)
DESCRIPTION
Land Use Plan for Kingston,TN
Citation preview

Land Use and Transportation
Policy Plan
2014-2024


LAND USE AND TRANSPORTATION POLICY PLAN
KINGSTON, TENNESSEE
2014-2024
Developed by
The Kingston Municipal/Regional Planning Commission
Assisted by the
East Tennessee Development District Planning Advisory Service
Alcoa, TN
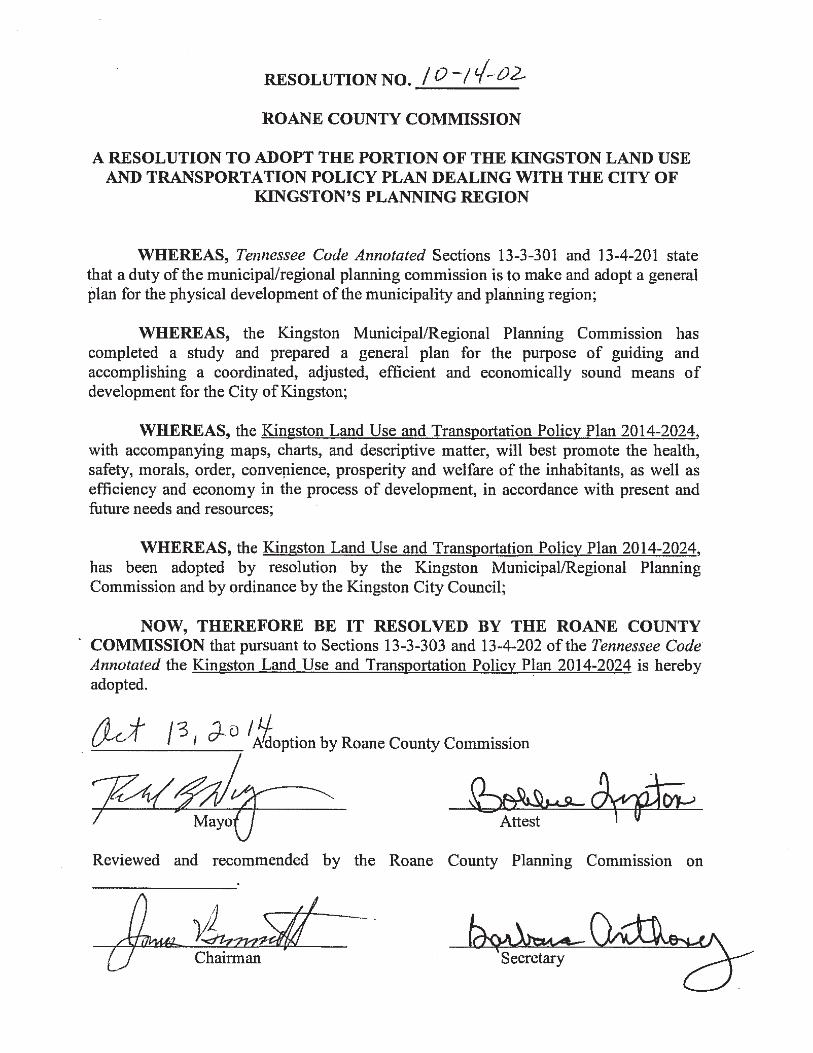
Adopted April 2014

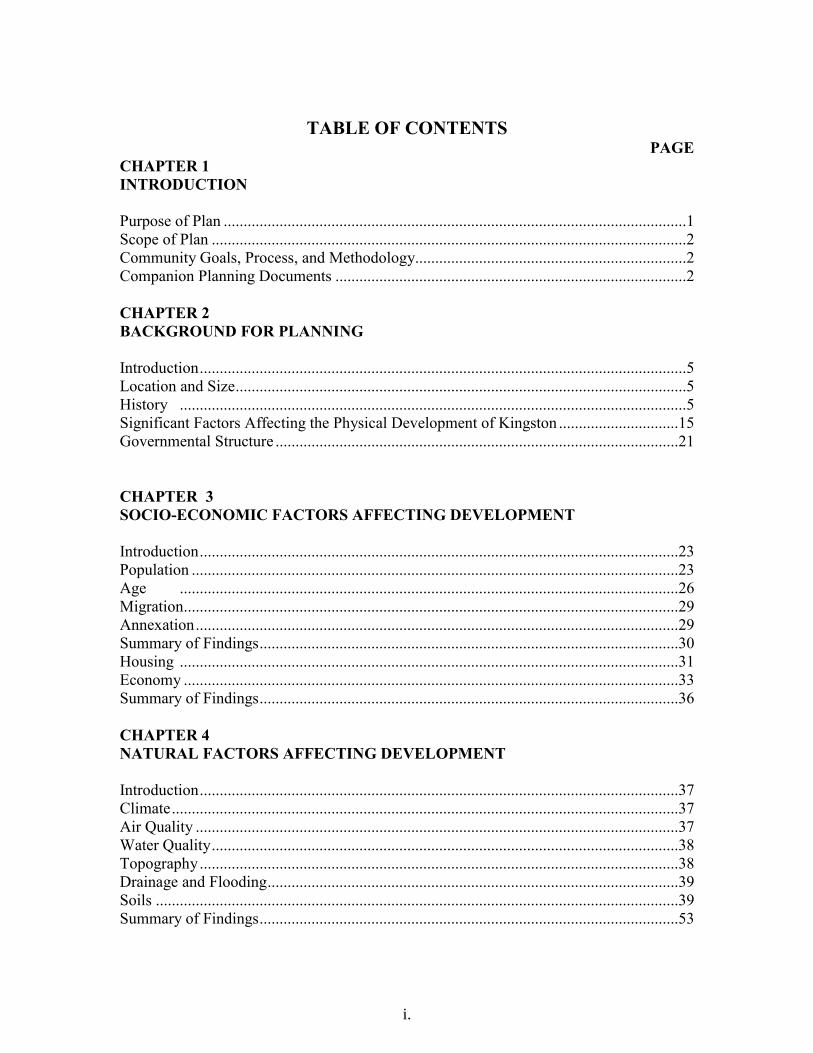
TABLE OF CONTENTS
PAGE CHAPTER 1 INTRODUCTION Purpose of Plan ....................................................................................................................1 Scope of Plan .......................................................................................................................2 Community Goals, Process, and Methodology....................................................................2 Companion Planning Documents ........................................................................................2 CHAPTER 2 BACKGROUND FOR PLANNING Introduction ..........................................................................................................................5 Location and Size .................................................................................................................5 History ...............................................................................................................................5 Significant Factors Affecting the Physical Development of Kingston ..............................15 Governmental Structure .....................................................................................................21 CHAPTER 3SOCIO-ECONOMIC FACTORS AFFECTING DEVELOPMENT Introduction ........................................................................................................................23 Population ..........................................................................................................................23 Age .............................................................................................................................26 Migration............................................................................................................................29 Annexation .........................................................................................................................29 Summary of Findings .........................................................................................................30 Housing .............................................................................................................................31 Economy ............................................................................................................................33 Summary of Findings .........................................................................................................36 CHAPTER 4 NATURAL FACTORS AFFECTING DEVELOPMENT Introduction ........................................................................................................................37 Climate ...............................................................................................................................37 Air Quality .........................................................................................................................37 Water Quality .....................................................................................................................38 Topography ........................................................................................................................38 Drainage and Flooding .......................................................................................................39 Soils ...................................................................................................................................39 Summary of Findings .........................................................................................................53
i.
CHAPTER 5 EXISTING LAND USE AND TRANSPORTATION ANALYSIS Introduction ........................................................................................................................55 Existing Land Use and Transportation ..............................................................................55 Land Use Analysis Corporate Limits .................................................................................59 Residential ..................................................................................................................59 Commercial .................................................................................................................59 Industrial .....................................................................................................................60 Agriculture and Timber ..............................................................................................60
Public and Semi Public Land .....................................................................................60 Water ..........................................................................................................................60 Transportation ............................................................................................................60
Vacant Land ................................................................................................................60 Re-development and Re-use Potential .......................................................................60
Land Use Analysis Urban Growth Boundary ....................................................................62 Residential ..................................................................................................................62 Commercial .................................................................................................................62 Industrial .....................................................................................................................62 Agriculture and Timber ..............................................................................................62
Public and Semi Public Land .....................................................................................63 Water ..........................................................................................................................63 Transportation ............................................................................................................63
Vacant Land ................................................................................................................63 Re-development and Re-use Potential .......................................................................63
Transportation Analysis .....................................................................................................67 Thoroughfare Classification .......................................................................................67
Traffic Circulation Patterns ........................................................................................71 Traffic Generators .......................................................................................................77 Impediments to Traffic ...............................................................................................77
Pedestrian / Non-Vehicular Circulation .....................................................................77 Air/Rail/Port ...............................................................................................................77 Summary of Findings .........................................................................................................77 CHAPTER 6 THE DEVELOPMENT PLAN Introduction ........................................................................................................................79 Major Assumptions, Factors, Issues & Trends ..................................................................79 Development Goals ............................................................................................................80 Objectives and Development Policies ...............................................................................81 General Development & Growth Management .................................................................81 Residential - Housing .........................................................................................................82 Residential – Population Growth .......................................................................................83 Residential – Affordable Housing .....................................................................................84 Residential – Historic Preservation ....................................................................................85 Commercial ........................................................................................................................86 Industrial ............................................................................................................................87
ii.

Public and Semi-public ......................................................................................................88 Transportation, Communication, and Utilities...................................................................90 Vacant Land, Underdeveloped Land, Agriculture/Timber, and Open Space .....................91 CHAPTER 7 PLAN IMPLEMENTATION Introduction ........................................................................................................................93 Methods for Implementation..............................................................................................93 Mandatory Referral .....................................................................................................93 Local Government Actions .........................................................................................93 Planning Commission Actions ...................................................................................93 Zoning .........................................................................................................................93 Subdivision Regulations .............................................................................................93 Building and Other Codes ..........................................................................................94 Public Improvement Program and Capital Budget .....................................................94 Implementation Schedule ..................................................................................................94 ILLUSTRATIONS AND TABLES 1 Regional Location Map.........................................................................................7 2 Original Plat of Kingston ......................................................................................9 3 Original Plat of Kingston with Current Land Use Overlay ................................11 4 Important Events in the History of Kingston ......................................................13 5 Population in Kingston and Comparable Areas 1960-2040 ...............................25 6 Population Pyramids for Kingston and Roane County 1980-2040 .....................26 7 Population Impact of Annexation 1970-2012 .....................................................30 8 Housing ...............................................................................................................31 9 Household Ages 1990-2012 ................................................................................32 10 Migration Pattern ................................................................................................33 11 Migration Distance and Direction .......................................................................34 12 Industry Data 1990-2010 ....................................................................................34 13 Income.................................................................................................................35 14 Air Pollution (PM2.5) Nonattainment Map ........................................................38 15 Natural Factors Affecting Development .............................................................41 16 Soil Types for Roane County ..............................................................................43 17 Soils Map ............................................................................................................47 18 Soil Corrosion of Concrete Potential ..................................................................49 19 Soil Corrosion of Steel Potential.........................................................................51 20 Existing Land Use – Kingston and Urban Growth Boundary ............................57 21 Existing Land Use – Kingston Corporate Limits ................................................61 22 Existing Land Use – Urban Growth Boundary ...................................................65 23 Roadway Classification ......................................................................................69 24 Average Daily Traffic Counts .............................................................................71 25 Average Daily Traffic Counts and Land Use .....................................................73 26 Traffic Flow Rates 1985-2012 ............................................................................75 27 Implementation Schedule ....................................................................................95
iii.

CHAPTER 1
INTRODUCTION
PURPOSE OF PLAN
The purpose of this document is to provide Kingston, Tennessee with an updated policy plan for the future development of land and transportation facilities. Kingston’s existing Land Use and Transportation Plan was adopted in 1975. The 1975 plan is, at this point, very outdated, but does contain information that is still applicable; some of which is presented herein. A Land Use and Transportation Policy Plan is only one component of a General Plan, but it is an essential planning instrument for a community with the primary purpose of identifying land use goals and strategies for implementing them. The objective of such a plan, as outlined in Section 13-3-302 of the Tennessee Code
Annotated, is to serve as a guide for “coordinated, adjusted, efficient and economic development of the region which will, in accordance with present and future needs and resources, best promote the health, safety, morals, order, convenience, prosperity and welfare of the inhabitants, as well as efficiency and economy in the process of development, including, among other things, such distribution of population and of the uses of the land for urbanization, trade, industry, habitation, recreation, agriculture, forestry and other uses as will tend to create conditions favorable to transportation, health, safety, civic activities and educational and cultural opportunities, reduce the wastes of financial and human resources which result from either excessive congestion or excessive scattering of population, and tend toward an efficient and economic utilization, conservation and production of the supply of food, water, minerals, drainage, sanitary and other facilities and resources, and identify areas where there are inadequate or nonexistent publicly or privately owned and maintained services and facilities when the planning commission has determined that the services are necessary in order for development to occur.”
This Kingston Land Use and Transportation Policy Plan covers a planning period of approximately ten years, from 2014 to 2024. The information presented in this plan should be used as a framework to guide municipal and county officials, community leaders, businessmen, industrialists, and others as they make decisions that affect the future growth and development of Kingston and its planning region. The plan is not intended to supersede the responsibility or authority of local officials and employees. Instead, it is designed to give the public and private sectors a common set of goals, policies, and expectations to work toward in the community. The development goals, objectives, policies, and the implementation strategies present in this plan should be periodically reviewed, and when necessary, updated to reflect unanticipated occurrences or trends.
1

SCOPE OF PLAN
This Land Use and Transportation Policy Plan is designed to formulate a coordinated, long-term development program for the City of Kingston and its planning region. The preparation of a development program requires gathering and analyzing a vast array of information. Due to the nature of the information used in this plan, some may be available only at the county level, some will be available to the city level, and some will be available for the city’s planning region. Data selected for presentation will be presented with as much detail as possible. The historic events, governmental structure, natural factors, and socio-economic characteristics of Kingston are studied to determine how these have affected and will affect land uses and transportation facilities. Existing land uses and transportation facilities are analyzed to identify important characteristics, relationships, patterns, and trends. From these analyses, pertinent problems, needs, and issues relative to land use and transportation in Kingston are identified. An amalgamation of this information is utilized to produce a Major Thoroughfare Plan and a Development Plan. The Development Plan, as present herein, consists of the identification of development goals and objectives and the establishment of policies for achieving them. To achieve the goals and objectives identified in the Development Plan, specific strategies or measures are outlined in an implementation schedule.
COMMUNITY GOALS, PROCESS, AND METHODOLOGIES
The development of community goals and objectives is a primary product of this Land Use and Transportation Policy Plan. Essential to the development of these goals and objectives are local leadership and citizen participation. Participation from these groups is necessary to identify local needs and problems perceived by the community at large. Several methodologies are available for obtaining valuable input. The methodologies utilized in this Plan include presentations, interviews, and workshops. From citizen participation, goals and objectives were identified, needs were recognized, and problems were identified. These goals and objectives are presented within Chapter 6 of this plan.
COMPANION PLANNING DOCUMENTS
A number of companion planning documents should be used in conjunction with this Kingston Land Use and Transportation Policy Plan. They include:
1. Urban Growth Boundary Report for the City of Kingston, Tennessee: August 30, 1999; amended October 28, 2005. State of Tennessee Local Planning Assistance Office.
2. Kingston Community Development Plan: 1995 - 2010. University of Tennessee
School of Planning.
2
3. Kingston Tomorrow “A Design for Change”: May 1987. Kingston Tomorrow Group.
4. 201 Facilities Plan for the Kingston 201 Area: May 1978. Whitsitt, Gavin,
Holcomb Engineers-Architects. 5. Comprehensive Development Plan - Land Use and Transportation Elements for
Kingston, Tennessee: June 1975. Tennessee State Planning Office and Kingston Regional Planning Commission.
3

Page intentionally left blank.
4
CHAPTER 2
BACKGROUND FOR PLANNING
INTRODUCTION
There are many factors that influence a city’s shape, form, and arrangement. An examination of these factors can reveal the underlying causes of current conditions. This information will allow the city to maintain desirable characteristics and plan for the best way to mitigate the undesirable characteristics. This chapter will begin this examination with the history of the City of Kingston and present major events that have influenced the development of the city.
LOCATION AND SIZE The City of Kingston, comprising a total land area of approximately 5,183 acres,
is situated in Roane County. The community is located 20 miles southwest of Oak Ridge, 30 miles east of Crossville, 34 miles west of Knoxville, and 72 miles north of Chattanooga. The location of Kingston is shown on Illustration 1, which follows.
HISTORY
While Kingston is named after Major Robert King (he was the original land owner), it could have just as easily been named any of an assortment of names that relate to being a river town. The largest factor in any category that affected the development of Kingston is its proximity to the Clinch, Emory, and Tennessee Rivers. Without these rivers, the boundary between Native American land and settler’s land may have been located elsewhere. Fort Southwest Point may not have been built, which would have made settlement in the area more difficult, if not impossible. The early businessmen would not have been able to capitalize on the ability to move goods by raft or establish the ferries that further fueled the early economic base of the area. The effect of the river on commerce was diminished as railroads were established, bridges were built, and paths through the wilderness began to develop into roads for automobile traffic. The impact of the rivers on the area didn’t end there though. Watts Bar Dam threatened to flood the downtown until a controversial dike was constructed. The ability of the Tennessee Valley Authority (TVA) to use the river for inexpensive electricity production attracted numerous industries to the area, including the Manhattan Project. Both TVA and the operations that formed out of the Manhattan Project supply numerous jobs to the area and helped Kingston develop into the city it is today.
5

Page intentionally left blank.
6

.ILLUSTRATION 1
3 0 31.5
Miles
Kingston
REGIONAL LOCATIONKINGSTON, TENNESSEE
HarrimanOak Ridge
Rockwood
OliverSprings
7

Page intentionally left blank.
8

In 1799, the Town of Kingston was established. The original plat for the town divided the land into 22 blocks with 85 lots, one of which was designated as a community graveyard. Illustrations 2 and 3 show the original layout of the city and how the current development pattern has followed the original design.
Illustration 2 –Original Plat of Kingston
*From: Valley of Challenge and Change, 1986
9

Page intentionally left blank.
10

SOURCE STATEMENT: This land used was derived by the Local Planning Assistance Office by associatingdigital parcel boundaries from the Tennessee Base Mapping Program (BMP) with parcel attribute data maintainedin the Comptroller of the Treasury’s Computer Assisted Appraisal System (CAAS) database. Each parcel wasassigned to one of the land use classes based on attributes contained in these two data sources or fromexamination and assignment by planning staff. Data Sources: Base Mapping Program dataset, July 12 2010;Computer Assisted Appraisal System database, December 6, 2010.
KINGSTON, TENNESSEEEXISTING LAND USE
(Based on 2010 Land Use Data)
Land Use Code!( Residence on Timber or Agricultural Tract
SFR < 5 acresSFR >= 5 acresDuplex (2 units)Multifamily (3 or more units)Mobile Home (1-4)Mobile Home Park (5 or more)Resort ResidentialGeneral CommercialOffice (Prof/Medical/Gen)Misc Commercial;Light Industrial / Warehousing
Heavy IndustrialPublic UseSemi-Public UseUtilitiesVacantAgricultural Tract Timber TractWater FeatureRoad/Rail ROWUnclassified improvements <$30,000Unclassified improvements >=$30,000CAAS data unavailable for parcelUncoded by Land Use Model
11 Illustration 3

Page intentionally left blank.
12

18201810180017901780
Important Events in the History of Kingston
188018701860185018401830 1910 1920 1930 194019001890 1990 2000 2010 20201950 1960 1970 1980
1804 Construction of the Federal Road began (Kingston to Georgia)
1804 The first Roane
County Court House built
1805 Treaty with the Cherokee signed (Fort Southwest Point and other property ceded to the United
States)
1783 Revolutionary War ends
1787 Construction of
Avery's Trace began(Knoxville to Nashville)
1790Thomas N. Clark
purchased area land and established a ferry across the Clinch River
1792 Tennessee Militia
establishedpresence as a
protective force against Indian
attack
1796 Tennessee becomes a
state
1799 Construction of
Walton Road began (Fort Southwest Point to Middle Tennessee)
1799 Town of Kingston
established
1801 Roane County established
1806 First school constructed
1807 Kingston named State Capitol for one day
1812‐1815 War of 1812
1797 Federal troops replaced
Tennessee Militiamen and established Fort Southwest
Point
1818 Bethel Presbyterian Church established
1846‐1846Mexican‐American
War
1856 Second Roane County
Courthouse constructed
1861‐1865American Civil
War
1898First Bridge
across the Clinch River
constructed
1898 Spanish‐
American War
1920's Kingston/Roane County became second largest
peach producer in the U.S.
1914‐1918 World War I
1940 First Kingston
PlanningCommission established
1941‐1945 World War II
1942 Kingston Demolition
Range created
1942Watts Bar Reservoir
opened for navigation
1943Kingston Demolition
Range renamed Clinton
Engineering Works
1951Constructionbegan on the Kingston Steam
Plant
1955Construction of the Kingston Steam Plant completed
1959‐1975Vietnam War
1950‐1953 KoreanWar
1974Third Roane County
Courthouse constructed
1974Restoration of Fort Southwest Point
began1990‐1991Gulf War
2003‐2011Iraq War
2001‐PresentAfghanistan War 2012
Kingston purchased new
City Hall
1960I‐40 opened from Lawnville Road to Alcoa Highway
1969I‐40 opened from Lawnville Road to
Highway 61
1974I‐40 opened from Westel Road to Highway 61
1972Kingston changed
to a Council/Manager
governance
Fort Southwest Point
K‐25 Gaseous Diffusion Plant
Third Roane County Courthouse
Kingston Steam Plant
Second Roane County Courthouse
W. T. Gallaher Steamboat on the Clinch River
Watts Bar Dam
http://mdgroover.iweb.bsu.edu/GPR%20FSWP%20Map.JPG
http://www.nps.gov/nr/publications/guidance/K‐25_Section_213_Final_Report_3_23_12.pdf
http://roane.countycriminal.com/img/court_photos/lg/photo_2399.jpg?width=713&height=400
http://www.flickr.com/photos/stelladolce/3604752321/
http://www.roanetnheritage.com/images/join.h1.gif
http://images.wisconsinhistory.org/700009330012/0933000271‐l.jpg
http://upload.wikimedia.org/wikipedia/commons/e/e2/I‐40.svg
http://newdeal.feri.org/images/r57.gif
First Bridge Across the Clinch River
The Roane County Heritage Commission
13 Illustration 4

14

SIGNIFICANT FACTORS AFFECTING THE PHYSICAL DEVELOPMENT OF KINGSTON
Fort Southwest Point (1792- )
By the end of the Revolutionary War, settlers were interested in exploring the vast new world that lay to the west. The exploration and subsequent arrival of immigrants saw an increase in the hostility between Native Americans and the settlers. As a result of this hostility, the Tennessee Militia established a protective force in the area. The fort was built in 1792 and was named Fort Southwest Point due to the similarity of its location (at the confluence of two rivers) to Fort West Point in New York. These two rivers are the Clinch and Tennessee. The presence of a fort in the area made settlement possible by protecting the nearby settlers from Native American attack; however, before the operations of the fort ended, the soldiers were protecting the Native Americans from the settlers. Through a treaty with the Cherokee Indians, the land that was used for the fort was approximately a mile from the settlement that became Kingston. This is peculiar to development of the time in that the settlement usually surrounded the fort so settlers could quickly take shelter inside the fort during attack. Eventually, the Native American Territory was retracted westward to the opposite bank of the rivers from the fort. As settlement of the area increased, the fort became the economic base of the community. It served as a stopover point for travelers and a safe place to conduct trade.
Clinch and Tennessee Rivers As stated earlier, the rivers are probably the most significant factor affecting the physical development of the City of Kingston. Being the first highways of the frontier, rivers determined the location of the first fort in the area, Fort Southwest Point. The protection afforded by the fort allowed development to occur in the area. The western banks of the river served as the boundary between Native American and settler’s land. The later construction of Watt’s Bar Dam threatened to flood downtown Kingston, thus requiring a dike to keep the water out of downtown. Because the national defense program implemented after World War II identified the need for additional electrical generation capacity, the Kingston Steam Plant was constructed. The availability of abundant electricity has attracted industry to the area resulting in thousands of jobs. While this industry is not concentrated in the City of Kingston, it does present job opportunities for the residents of Kingston. This pattern has reinforced the transition of Kingston into a bedroom community.
Ferries (1790-1987) Thomas N. Clark established the first ferry to cross the Clinch River at Fort Southwest Point. Due to his ability to transport goods on the river, Mr. Clark became the main supplier of goods to the fort. In the late 1800’s, rail and automobile traffic began to replace ferries. In 1898, the first bridge crossing the Clinch River was completed. This new bridge significantly reduced the demand
15

for ferries. Ferries continued to operate until 1987, when the bridge was built at Center’s Ferry.
Early Roads (1787-1803)
Avery Trace In 1787, the North Carolina General Assembly ordered the construction of a road that would allow settlers easier access to the Cumberland Settlements. Peter Avery was hired to mark the path that the road would follow. Much of the trail followed buffalo trails that were also used by the Cherokee as war paths. The road went from Fort Southwest Point in Kingston to Fort Blount in Jackson County, Bledsoe’s Fort at the Castalian Springs, Mansker’s Fort in Goodlettsville, and Fort Nashborough in Nashville. Having the forts along the way afforded some protection to the settlers as they traveled. The path was ten feet wide when it was originally built. For several years after it was completed, it was still difficult to travel on and only pack horses could follow the trail. A portion of the road was in Cherokee Territory and the Cherokee demanded a toll for using the road. As tensions between the settlers and the Cherokee grew, a 50-man protection force was sent with every group of travelers. Travelers were required to wait until a large enough group had assembled before setting off for destinations west. In the 1790’s the road was widened to allow wagons; however, several portions of the road were quite treacherous. One section near Spencer’s Mountain was so steep, wagons had to lock all four brakes and cut down a tree to drag behind the wagon. It was noted that the mountain top was “quite denuded of trees”. The road has also been known as The North Carolina Road and The Wilderness Road. With the starting point of this road being near Kingston, the travelers passing through and waiting for a group to assemble would have contributed to the local economy. Walton’s Road opened in 1795 and offered an alternate route to reach the Cumberland Settlements. Walton’s road was built under the supervision of William Walton of Carthage. The road connected the junction of the Clinch and Tennessee Rivers with the junction of Caney Fork and Cumberland Rivers. These two river junctions were the state’s most active overwater transportation channels. The Cumberland Turnpike Company operated the road as a toll road from 1802 to 1811. After 1811, the road reverted to state control; however, some sections were allowed to operate as a toll road to pay for the maintenance of the road. Like the Avery Trace, the location of the terminus in Kingston brought travelers through the city and served as a terminal for overland transport of cargo to the Cumberland River. Federal Road In 1803, the Cherokee Indians agreed to allow construction of a wagon road less than sixty feet in width that would connect Fort Southwest Point and Athens Georgia. The path of the road crossed the Cherokee Nation. The reason for the road was to connect dispersed white settlements; allow Tennesseans to access markets in Augusta and Savannah, Georgia; and create access to the Cherokee Nation. The route roughly followed the Cherokee Middle Path. The Cherokees reserved the right to control the collection of tolls and fees
16

for ferries, as well as to construct inns and establish trade along the route. The agreement required that a ferry be maintained at Fort Southwest Point, Tellico, and the Chattahoochee River in Georgia. Using the other roads that connected to Fort Southwest Point, the emerging road network would allow easier travel and the transportation of goods from the Cumberland Settlements and all points north and east of Kingston.
Civil War (1861-1865) The Civil War years changed the country forever. The residents of Kingston were divided between supporting the Union and supporting the Confederacy. Many residents left the area for other parts of the country to live among others with allegiances more similar to theirs. Many of the residents wanted to remain neutral and stayed in and around Kingston until the Confederacy started drafting citizens to help with the war effort. The Confederate draft caused many families from Roane County to go to places that were still in the Union, and they remained there until the war in East Tennessee ended; approximately at the end of 1863. No major battles were fought in Roane County but there were a few skirmishes, some of which were neighbors taking shots at each other. The planning-related effects of the War could best be summarized as slowing down the development of the area due to so many people leaving the area and the number killed. After the war, the area saw more success with industry (see below).
Railroad (Post Civil War)
The 1880’s saw a major expansion of railroads in Tennessee. The railroad network, based on miles of track, nearly tripled its prewar size. The Cincinnati Southern rail line was completed in Roane County in 1879, which expanded the area for which crops and goods could be transported for sale. It also expanded the available suppliers for goods. The railroad also carried passenger cars, which made travel to and from the north much more convenient.
Early Industry (Post Civil War)
The City of Kingston was not the center of industry in the county in the years following the Civil War. It did see a resurgence in steam boat traffic carrying passengers and cargo up and down the river. With the various crossroads and rivers all converging on Kingston, a large volume of goods and travelers passed through Kingston, giving the hotels, inns, and stores a larger pool of customers.
Bridge (1898)
The first bridge built across the Clinch River was completed in 1898. The bridge had a significant effect on the ferry business in Kingston and allowed for more efficient travel across the river.
Watts Bar Dam (1939- )
Construction of the dam began in 1939 and was competed in 1942. The dam is a part of nine Tennessee Valley Authority (TVA) projects on the Tennessee River that serve to prevent flooding downstream and to generate hydroelectric power. TVA projects in the area provide a large number of jobs for the residents of
17

Roane and surrounding counties. The most notable impact of the dam’s construction on Kingston would be the encroachment of the water on the city as the reservoir reached full pool. Anytime a river is impounded, the land on the river banks becomes permanently flooded. This land is often prime farmland, but in Kingston’s case the flooding would have been in the downtown area. This required the construction of a dike along the river bank. Construction of the dike was met with vehement opposition from the city’s residents. It even spurred the creation of the city’s first planning commission. Construction on the dike proceeded despite the opposition. The effects of the dam and dike on the physical development of the city is easy to see; one must only go to one of Kingston’s waterfront parks near downtown or use the waterfront portion of the walking trail to see the dike.
Manhattan Project (1942- )
While not located within Kingston, the Manhattan project changed the city, the country, and the world. It began in 1942 as the Kingston Demolition Range, and was presented as a 56,000 acre area for artillery training and airplane bombing practice. By 1943, the name was changed to the Clinton Engineer Works and construction of the top secret uranium enrichment facility started. The early stages of the project had four distinct facilities in Tennessee; the electromagnetic separation plant (Y-12), the gaseous diffusion plant (K-25), the thermal diffusion plant (S-50), and the graphite reactor (X-10). This project required massive personnel and electric power to be successful. The region already had power from the TVA hydroelectric dams, but needed thousands of workers that were brought into the area. The City of Oak Ridge was built to house the workers and their families; however, many workers lived in the surrounding areas. This is still true today. The operations of the plant may have changed, but the plant and supporting industries still provide many of the jobs in the region. Due to the number of jobs available in the region but not specifically in Kingston, it has become a bedroom community. This needs to be a consideration when making future planning decisions.
Kingston Steam Plant (1951- )
The 1950’s began with the construction of the Kingston Steam Plant across the river from Kingston. The construction of the plant was required by the National Defense Program, which identified additional electricity production capacity as a vital need. The construction of the plant created 3,000 jobs at the peak of employment. TVA had to construct houses and dormitories to accommodate the influx of workers for the project. The years since operation of the plant began, have not been without problems. The Census Tract immediately surrounding the plant is a nonattainment area for particulate air pollution standards. TVA has installed new equipment and improved the facility to reduce the pollution that is produced. In December 2008, a coal ash storage dike failed, releasing 1.1 billion gallons of coal ash slurry. The spill covered 300 acres and made it to both the Clinch and Emory Rivers. The cleanup effort is an ongoing project.
18
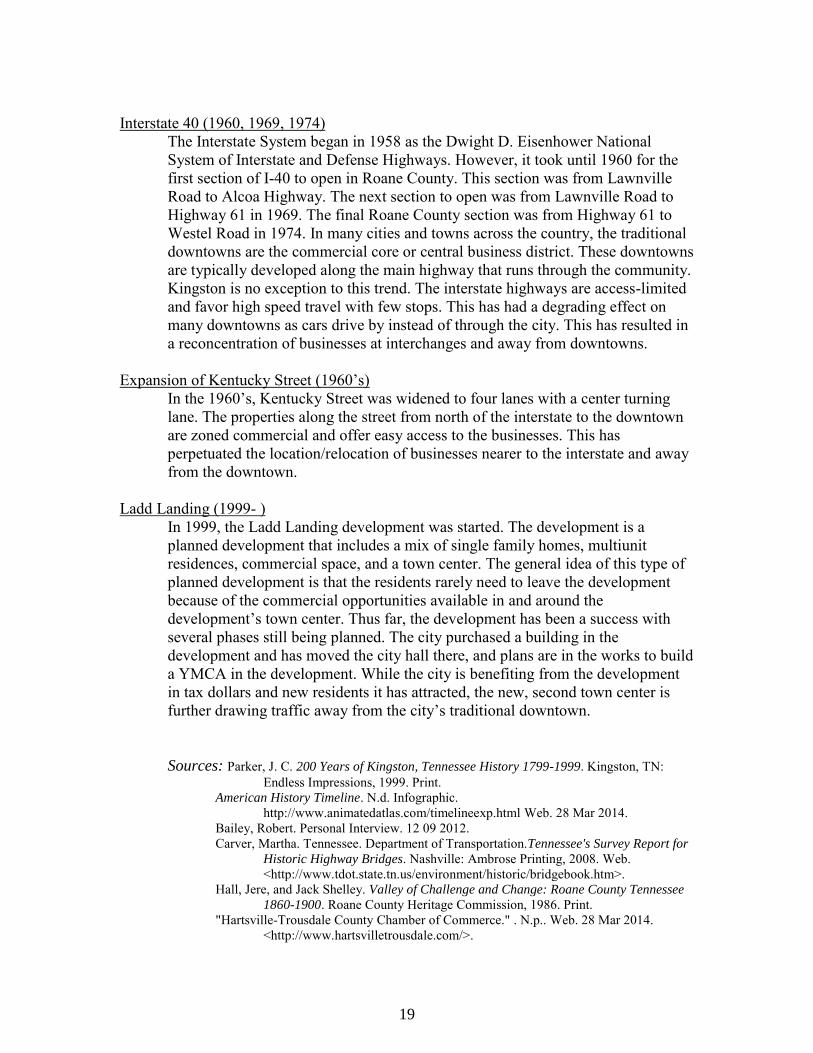
Interstate 40 (1960, 1969, 1974)
The Interstate System began in 1958 as the Dwight D. Eisenhower National System of Interstate and Defense Highways. However, it took until 1960 for the first section of I-40 to open in Roane County. This section was from Lawnville Road to Alcoa Highway. The next section to open was from Lawnville Road to Highway 61 in 1969. The final Roane County section was from Highway 61 to Westel Road in 1974. In many cities and towns across the country, the traditional downtowns are the commercial core or central business district. These downtowns are typically developed along the main highway that runs through the community. Kingston is no exception to this trend. The interstate highways are access-limited and favor high speed travel with few stops. This has had a degrading effect on many downtowns as cars drive by instead of through the city. This has resulted in a reconcentration of businesses at interchanges and away from downtowns.
Expansion of Kentucky Street (1960’s)
In the 1960’s, Kentucky Street was widened to four lanes with a center turning lane. The properties along the street from north of the interstate to the downtown are zoned commercial and offer easy access to the businesses. This has perpetuated the location/relocation of businesses nearer to the interstate and away from the downtown.
Ladd Landing (1999- )
In 1999, the Ladd Landing development was started. The development is a planned development that includes a mix of single family homes, multiunit residences, commercial space, and a town center. The general idea of this type of planned development is that the residents rarely need to leave the development because of the commercial opportunities available in and around the development’s town center. Thus far, the development has been a success with several phases still being planned. The city purchased a building in the development and has moved the city hall there, and plans are in the works to build a YMCA in the development. While the city is benefiting from the development in tax dollars and new residents it has attracted, the new, second town center is further drawing traffic away from the city’s traditional downtown.
Sources: Parker, J. C. 200 Years of Kingston, Tennessee History 1799-1999. Kingston, TN:
Endless Impressions, 1999. Print. American History Timeline. N.d. Infographic.
http://www.animatedatlas.com/timelineexp.html Web. 28 Mar 2014. Bailey, Robert. Personal Interview. 12 09 2012. Carver, Martha. Tennessee. Department of Transportation.Tennessee's Survey Report for
Historic Highway Bridges. Nashville: Ambrose Printing, 2008. Web. <http://www.tdot.state.tn.us/environment/historic/bridgebook.htm>.
Hall, Jere, and Jack Shelley. Valley of Challenge and Change: Roane County Tennessee
1860-1900. Roane County Heritage Commission, 1986. Print. "Hartsville-Trousdale County Chamber of Commerce." . N.p.. Web. 28 Mar 2014.
<http://www.hartsvilletrousdale.com/>.
19
Hill, Sarah H. United States, State of Georgia. National Park Service, Georgia Department of Natural Resources/Historic Preservation Division. Cherokee
Removal From Georgia. 2005. Print. <http://www.nps.gov/trte/historyculture/upload/Georgia-Forts.pdf>.
Johnson, Charles W., and Charles O. Jackson. City Behind a Fence. Knoxville, TN: University of Tennessee Press, 1981. Web. <http://books.google.com/books?id=cu803f66QU0C&lpg=PA207&dq="Kingston Demolition Range"&pg=PP1
Johnson, Edward A.. "Railroads." The Tennessee Encyclopedia of History and Culture. N.p., 01 01 2010. Web. 28 Mar 2014. <http://tennesseeencyclopedia.net/entry.php?rec=1104>.
Jones, Vincent. United States. Army. Manhattan, the Army and the Atomic Bomb. U.S. Army Center of Military History, 1985. Print. <http://www.history.army.mil/html/books/011/11-10/CMH_Pub_11-10.pdf>.
"OLD WALTON ROAD." www.rootsweb.com. Web. 28 Mar 2014. <http://freepages.genealogy.rootsweb.ancestry.com/~tqpeiffer/Documents/Ancestral Migration Archives/Migration Photo Galleries/(3) TRANS-APPALACHIAN/OLD WALTON ROAD/Page.html>.
"The Roane County Heritage Commission." . N.p.. Web. 28 Mar 2014. <http://www.roanetnheritage.com/>.
"Roane Count'ys Rich History." . The Roane Alliance, n.d. Web. 28 Mar 2014. <http://www.roanetourism.com/about_roane_county/history.asp&xgt;.
Robinson, George O. The Oak Ridge Story: The Saga of a People who Share in History. Reprint. Kingsport, Tennessee: Southern Publishers, 1950. Print.
Tennessee. Department of Environment and Conservation. Web. <http://www.tn.gov/environment/>.
"Tennessee Valley Authority." . N.p.. Web. 28 Mar 2014. <http://www.tva.gov/>. Vincent, Jay. City of Kingston. Regional Planning Commission. Comprehensive
Development Plan - Land Use and Transportation Elements. Tennessee Local Planning Assistance Office, 1975. Print.
20

GOVERNMENTAL STRUCTURE
An examination of the governmental structure of a municipality is another important aspect of planning for its future. A municipality's form of government and the activity of its planning commission directly affect its ability to plan for growth and development. The purpose of this section is to provide a general overview of the governmental structure of Kingston, and to briefly describe its functions. The City of Kingston was incorporated in 1799 with a Mayor-Aldermanic Charter, but in 1972 changed its governing structure to a Council-Manager Charter. A six-member city council and mayor governs Kingston, while the city manager oversees the day to day operations of the city and supervises the city’s employees. A breakdown of the city’s employees by department is presented below. Finance - 5 full-time and 3 part-time Police -12 full-time and 8 part-time Fire - 14 full-time and 3 part-time Public Works- 9 full-time, 1 part-time, and 4 seasonal part-time Recreation - 7 full-time, 3 part-time, and 6 seasonal lifeguards Library - 2 full-time and 6 part-time Management - 2 full-time Water - 4 full-time Sewer - 4 full-time Transmission & Distribution Water/sewer - 5 full-time Municipal Planning Commission The Kingston Municipal/Regional Planning Commission was formed in 1940 in response to the TVA proposal to build a dike around the downtown to prevent flooding from the impoundment of Watts Bar Reservoir. The planning commission consists of ten members including the mayor and one alderman. The planning commission currently administers subdivision regulations and a zoning ordinance. The officers of the planning commission are chairman, vice-chairman, and secretary. Regular meetings of the planning commission are held monthly at the Kingston City Hall.
21

Page intentionally left blank.
22

CHAPTER 3
SOCIO-ECONOMIC FACTORS AFFECTING DEVELOPMENT
INTRODUCTION The data presented in this chapter will attempt to identify population and economic trends and patterns that will help the City of Kingston effectively plan for its future. This chapter will paint as complete of a picture as possible. However, the available data is not uniform through the years; nor is it consistently available for the jurisdictions that will be shown for comparison purposes. Some data is only available at the county level and will be presented as such. This information is important to this plan in that changes in demographics, housing, employment, and other economic factors can have an affect on the rate, type, and location of development. The formulation of community development strategies, identification of land use needs, and discussion of various land use issues that take place during the planning process must consider these trends and projections if the plan is to be relevant and effective.
POPULATION From 1900 to 2010, Kingston’s decade-to-decade growth rate averaged 30.2%. This includes decades with -37.4% growth (1910-1920) and 106.1% growth (1960-1970). After 1970, Kingston’s growth rate began to slow slightly and stabilize, averaging 9.5% from 1970 to 2010. The population is expected to continue growing at a projected average approximate rate of 7.5% through 2040, which outpaces the other municipalities and Roane County. These population statistics and those for surrounding municipalities, Roane County, and the State of Tennessee are presented in tabular and graphical form in Illustration 5 that follows. The components of population growth include a positive birth rate with respect to the death rate, net migration of people to the community, and annexation. Analysis of age categories can show trends in the age of a population and can be used to estimate a birth versus death trend (see Illustration 6 below). Migration of population from place to place is typically unpredictable; however, many communities rely on migration to generate growth. Thus they focus on creating an accommodating place in which to live and do business. Annexation can generate growth by integrating an existing population into the city, or by creating developable land through utility extension, where previously land was only marginally developable. Population data is not available for the city’s urban growth boundary alone, but other data, such as natural factors of the land and existing land use, is available and is presented in the corresponding chapter.
23

Page intentionally left blank.
24

% C
hang
e%
Cha
nge
% C
hang
e20
10-2
020
2020
2020
-203
020
3020
30-2
040
2040
King
ston
5.6
%6,2
64
8.9
%6,8
25
8.0
%7,3
69
Harr
iman
-5.5
%6,0
00
-3.3
%5,8
00
-1.6
%5,7
10
Rock
woo
d9.9
%6,1
15
3.8
%6,3
48
3.3
%6,5
61
Roan
e Co
.2.9
%55,7
40
4.7
%58,3
51
4.2
%60,7
87
Tenn
esse
e7.8
%6,8
41,8
68
9.5
%7,4
89,8
09
8.2
%8,1
06,5
83
Sour
ces:
U.S
. Cen
sus
Bure
au, E
ast T
enne
sse
Deve
lopm
ent D
istri
ct, a
nd U
T Ce
nter
for B
usin
ess
& Ec
onom
ic R
esea
rch
% C
hang
e%
Cha
nge
% C
hang
e%
Cha
nge
% C
hang
e19
6019
60-1
970
1970
1970
-198
019
8019
80-1
990
1990
1990
-200
020
0019
90-2
010
2010
King
ston
2,0
10
106.1
%4,1
42
7.2
%4,4
41
2.5
%4,5
52
15.6
%5,2
64
12.7
%5,9
34
Harr
iman
5,9
31
47.3
%8,7
34
-4.9
%8,3
03
-14.3
%7,1
19
-5.3
%6,7
44
-5.8
%6,3
50
Rock
woo
d5,3
45
-1.6
%5,2
59
8.1
%5,6
87
-6.0
%5,3
48
8.0
%5,7
74
-3.7
%5,5
62
Roan
e Co
.39,1
33
-0.6
%38,8
81
24.5
%48,4
25
-2.5
%47,2
27
9.9
%51,9
10
4.4
%54,1
81
Tenn
esse
e3,5
67,0
89
10.1
%3,9
26,0
18
16.9
%4,5
91,0
23
6.2
%4,8
77,1
85
16.7
%5,6
89,2
83
11.5
%6,3
46,1
05
Sour
ces:
U.S
. Cen
sus
Bure
au, E
ast T
enne
sse
Deve
lopm
ent D
istri
ct, a
nd U
T Ce
nter
for B
usin
ess
& Ec
onom
ic R
esea
rch
Illus
trat
ion
5: P
opul
atio
n in
Kin
gsto
n an
d C
ompa
rabl
e Ar
eas,
196
0 - 2
040
25

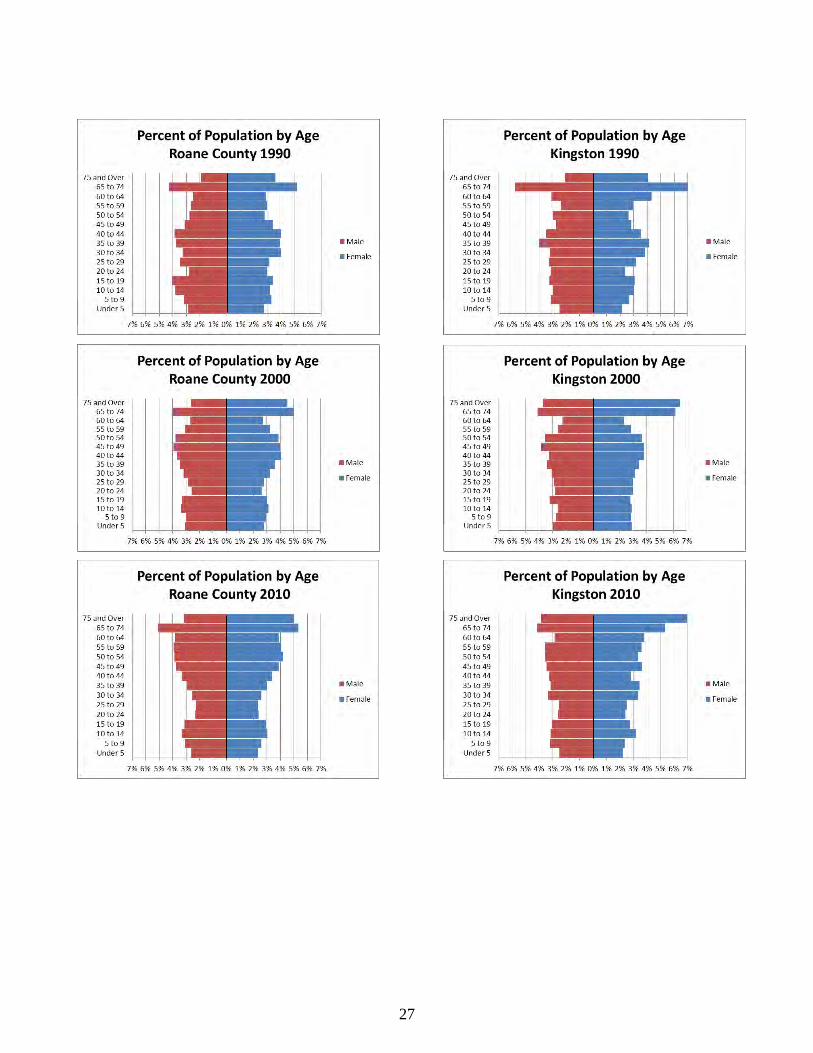
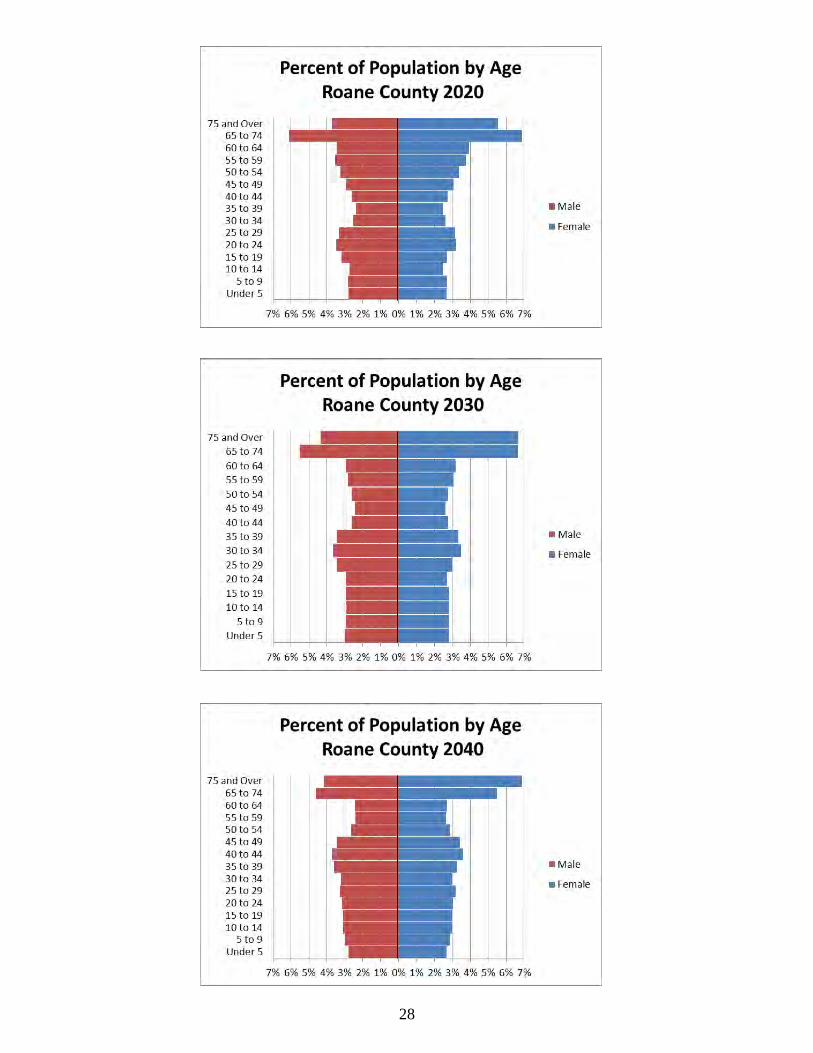
AGE
While total population gives a community an idea of what to expect in population growth for the future, breaking the data down by age groups allows better analysis and the ability to plan and better meet anticipated needs. Population pyramids are presented below; these graphs illustrate the size of age groups for Kingston and Roane County. Population pyramids roughly fall into one of three categories: Christmas tree shaped (), box shaped (), and cup shaped (). Christmas tree shapes indicate slow growth, high birth rate, and short lifespans. Box shapes indicate low infant mortality, slow growth, and long life expectancy. Cup shapes indicate low birth rate, shrinking population, and long life expectancy. Another evaluation technique is to compare the 20 to 24 age group with the under 5 age group, as a majority of the 20 to 24 year olds are the parents of the under 5 year olds. When the under 5 category is less than the 20 to 24 category, the population is not replacing itself. Over many decades, this will lead to a declining population unless other factors, such as migration and annexation, contribute enough to the population to overcome any deficits. From 1980 to 2010, both Kingston and Roane County’s population pyramids are between box and cup shapes. Population projections for Roane County indicate this trend will continue through 2040 with the 65 and older group being the largest from 1990 through 2040. Looking at the 20 to 24 year old age group, the county experienced positive birth rates in 2000 and 2010 and is projected to obtain a positive birthrate again in 2030. Kingston experienced a positive birth rate in 2000 (projections are not available at the city level).
Illustration 6: Population Pyramids for Kingston and Roane County 1980 - 2040
26
27
28
MIGRATION
Migration data is available as a part of the Census Bureau’s American Community Survey. This data is collected continuously, and is presented as a twelve month rolling average within a range of years. The data used for this analysis is from 2005 to 2009, and is only available at the county level. One important fact about this data is that it typically involves broad generalizations and large statistical margins of error due to small sample sizes. The purpose of this section is to offer an idea of growth potential based on the migration of people from other states, counties, and countries to Roane County. The data is presented in two ways: first, it presents totals for the number of people currently living in Roane County, followed by their county of residence 12 months prior; then it presents totals for people who currently live outside of Roane County that lived in Roane County 12 months prior. These numbers, in migration and out migration respectively, can then be used to calculate the net migration. The net migration value for Roane County during the sampling period was -520 people. When factoring in the large margin of error, the value falls between -998 people and -42 people. While this is a wide range, all of the values within the margin of error are negative, which indicates migration has not been a major driver of population growth for Roane County as a whole in recent history.
Another number that is included in the migration data is the number of people that moved but stayed within the same county. During rolling twelve month periods within the same timeframe as above, 3,890 people (between 3,116 people and 4,664 people when using the margin of error) moved from one residence to another within Roane County. This type of movement may offer the City of Kingston opportunity to see population growth from migration.
ANNEXATION
Annexation offers another method for population growth. Records were available
from 1977 to current; however, the records may not have been complete. Also, land use data at the time of annexation is not available, and only entire parcels that were annexed were included in the totals presented. Table 7 shows the approximate number of parcels annexed and how that would translate to a maximum population if every parcel was used for a single residential use. Some of the parcels that are included are still vacant and some may have been subdivided after annexation, which could result in population totals different than those shown. The data was included to show the maximum potential impact of annexation to population growth. This data does not present actual population figures.
29

Table 7: Population Impact of Annexation 1970-2012
Decade 1970-1979 1980-1989 1990-1999 2000-2012 Total
Approximate Number of
Whole Parcels
Annexed
32 159 131 96 418
Average Household
Size at Decade End
2.67 2.2 2.26 2.26
Maximum Population If
Used as 100%
Residential
85 350 296 217 948
Total Actual Population
Growth 299 111 712 670 1792
SUMMARY OF FINDINGS FOR POPULATION Based on the information presented in this chapter, Kingston should expect to see population growth over the next three decades (averaging 7.5% per decade). There are three ways population can grow: natural growth, migration, and annexation. Historically, natural growth was the main driver of population growth (i.e. the baby boomer generation). However, in recent years, the highest percentage of Kingston’s population is found in the 65+ age category. Having a large concentration of older residents can present some challenges for a city in supplying the specific needs of an aging population. Having a large portion of a population over 65 years old could lead to a rapid decline in population if the loss of residents is not met by a period of positive net migration or residential annexation. The effect of migration on the City of Kingston’s population can only be speculative at best. The data that is available on migration is very limited in both timeframe and scope. A twelve month rolling average from 2005 to 2009 showed that migration to and from Roane County results in a loss of residents. However, there are a large number of people that move within the county. This is a significant opportunity for population growth in Kingston due to its location in the county and its proximity to Oak Ridge and Knoxville.
Measuring the historical impact of annexation on population growth can be difficult. By looking at the above historical estimates, it is conceivable that annexation
30

could account for a large portion of any future population growth. When cities annex areas and extend utilities, some land that was previously not developable or suited only for low density uses can be developed at urban density, thus adding to the potential population increase by annexation. Caution should be taken when making these decisions due to the potential for encouraging sprawl and overtaxing utility infrastructure.
When making planning decisions based on population data, one must remember
that there are any number of factors that could significantly impact, positively or negatively, future population. For example, a major manufacturer opening or closing a plant could result in severe swings in population as people move away to look for new jobs or move in to fill the newly created jobs. There is no methodology that can account for this type of future impact on population. Planning decisions must be made using the best available data at the time.
HOUSING In addition to population trends, housing data can be useful in determining if land
use policies sufficiently match current and likely future conditions. The data used for this section is decennial census data except for the latest data, which is from the American Community Survey (ACS). As stated above, the ACS tends to have a significant margin of error due to small sample sizes. Data is presented for the City of Kingston except in a few instances where it is not available, and those cases are marked accordingly. In Table 8 below, data is displayed for number of total housing units, years that structures were built, and average household size.
Table 8 Housing Units 1970 1980 1990 2000 2010 Total 1283 1660 1936 2478 2814 Occupied * * 1427 2263 2556 Vacant * * 509 215 258 % Vacant 35.67% 9.50% 10.09% * Data Unavailable
Year Structure Built as of 2010 Houses
1939 or Earlier 46 1940 to 1949 138 1950 to 1959 690 1960 to 1969 245 1970 to 1979 404 1980 to 1989 286 1990 to 1999 410 2000 to 2009 354
Average Household Size 2010 2.26 2000 2.25 1990 2.31 1980 2.67 1970 3.21 1960 3.48* 1950 3.75** 1940 4.2**
*Tennessee **Roane County
31

Assuming all of the current vacant housing units are habitable, 583 new residents could be added to the population before additional housing stock will be needed. The population projections presented herein indicate population growth of 330 people is expected from 2010-2020, another 562 people from 2020-2030, and 544 more people from 2030-2040. The current vacant housing stock is sufficient to accommodate the anticipated population growth until sometime between 2020 and 2030. The annexation of existing residential areas could extend the timeframe of reaching a 100% occupancy rate. The current vacant property within the city, if completely built out at the current average residential density of 1.28 units per acre, would accommodate 912 additional residential units. It is important to remember that this scenario is for illustrative purposes only. It is unlikely that a city will ever reach 100% occupancy and not all of the vacant land is developable at the current density.
Another important trend to note is the large increase in houses in the 1950 to 1959 time period. This period is referred to as the baby boomer generation. If you look twenty years later, there is another decade of significant growth, followed by another decade of significant growth twenty years beyond that. This oscillation in housing numbers occurs as the baby boomer generation has children, approximately twenty years later, the now adult children have children and so forth. These swings in housing numbers coincide fairly closely with decades of substantial growth: 1940-50 84.89%, 1950-60 23.54%, 1960-70 106.07%, 1990-2000 15.64%, and 2000-10 12.72%. As peaks in the trend decrease over time, the valleys also increase, which normalizes the growth in housing rate. The average household size has declined since 1940, meaning that a greater number of residential units are and will be needed to accommodate the same number of people. The decrease in household size correlates with the cup shaped population pyramids presented above due to fewer children per household.
The final trend that can be derived from housing data involves households with residents under 18 and households with residents over 65. Table 9 presents this data from the last three decennial censuses.
Table 9 Households with Individuals Under 18 1990 ∆% 2000 ∆% 2010 519 23.70% 642 9.03% 700 Households with Individuals Over 65 1990 ∆% 2000 ∆% 2010 602 24.09% 747 21.15% 905
As is evident from the above data, growth of households containing residents over
65 years of age began higher and has outpaced growth of households containing residents less than 18 years of age. This is another trend that correlates with the cup shaped population pyramids presented herein.
32
ECONOMY
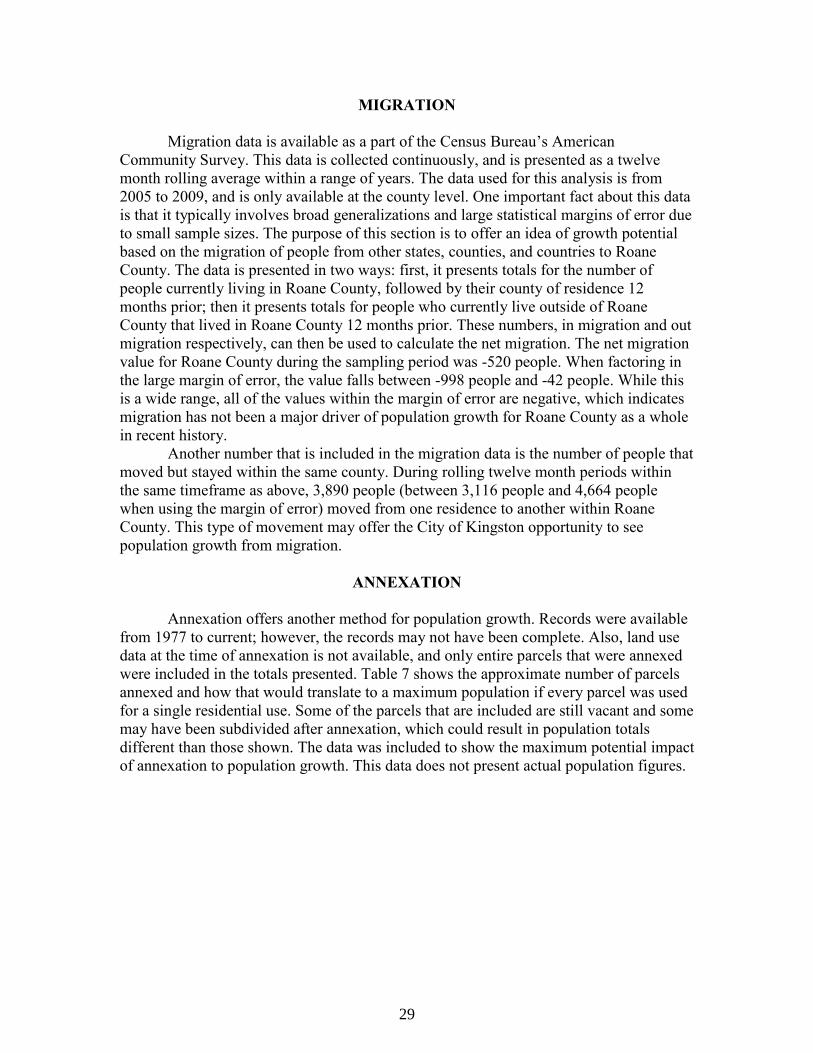
This section will examine the economic factors that affect the City of Kingston and the surrounding areas. Information on the physical location of jobs, the number of jobs in each industry category, and income data will be presented. In 2010, there were 1,949 jobs in the City of Kingston. Of these jobs, 229 were filled by residents of Kingston. The remaining 1,720 are filled by people who live outside of Kingston. Kingston also has 2,123 residents who drive outside of the city to their place of employment. Illustration 10 below graphically illustrates these figures. Illustration 10
Illustration 11 shows the number of jobs that Kingston’s residents commuted to in 2010 and the distance and direction they traveled to their place of employment. It is no surprise that the largest numbers travel east to Knoxville and northeast to Oak Ridge. As a reference, the 50 mile category begins near the Interstate 40 exit number 407/Highway 66 in Sevier County. While 16.7% of Kingston’s working population (393 people) make this long commute, the average commute time for residents of Kingston is 24.3 minutes.
33

Illustration 11
Industry data is only available at the county level; the following information is for Roane County. In 2010, the largest number of jobs in Roane County were in the healthcare and social assistance field. After healthcare and social assistance, retail trade, accommodation and food service, and manufacturing were the largest categories. The number of employees in each of these sectors, except accommodation and food service, has declined from 1990 to 2010. During this period, the finance and insurance, arts, entertainment, and recreation sectors experienced growth. The data referenced in this section can be found below in Table 12. The 2010 data has a high margin of error due to a small sample size and should be regarded as an estimate rather that an actual count. Table 12 X – Data not available
* - High estimate
1990 2000 2010 Industry Not Classified X X 19* Mining, Quarring and Oil and Gas Extraction 85 77 19* Communications 106 X X Arts, Entertainment, and Recreation 74 184 96 Information X 307 99* Agriculture, Forestry, Fishing, and Hunting 375 254 19* Management of Companies and Enterprises 564 0 99* Finance and Insurance 184 497 258 Wholesale Trade 555 450 110 Real Estate and Rental and Leasing 507 184 481 Transportation and Warehousing 575 766 249* Administrative and Support and Waste Management and Remediation Services X 1,029 353 Other Services (Except Public Administration) 699 834 543 Utilities 914 629 X Educational Services 1,344 1,759 99* Professional, Scientific, and Technical Services 959 2,029 217 Public Administration 1,223 924 X Accommodation and Food Services X 1,077 1,078 Construction 1,564 1,758 308 Health Care and Social Assistance 2,167 2,675 1,920 Retail Trade 3,251 2,711 1,734 Manufacturing 5,037 4,629 1,046
34

For income, median household income and individual per capita income is presented. Data is presented for Kingston, Roane County, Tennessee, and the United States for comparison purposes. As you can see in Illustration 13 below, Kingston has outpaced the other populations in median household income since the mid-1990’s. Kingston also outpaces Roane County and the State in individual per capita income. Illustration 13
35

Illustration 13 (continued) 1970 1980 1990 2000 2010
Kingston Median Household 9,652 17,404 26,958 46,050 49,965
United States Median Household 7,630 16,523 28,471 41,186 48,340
Roane County Median Household 7,401 15,181 24,210 44,578 42,698
Tennessee Median Household 7,447 14,142 24,807 36,535 41,461
United States Per Capita Individual 3,893 9,910 19,188 29,845 39,937
Kingston Per Capita Individual 3,005 7,109 13,196 20,301 26,252
Roane County Per Capita Individual 2,095 6,286 12,015 18,456 23,196
Tennessee Per Capita Individual 3,368 6,213 12,255 19,393 22,463
SUMMARY OF FINDINGS FOR ECONOMY Kingston’s status as a bedroom community is evident in this chapter’s study of its economic factors. More people are employed outside of the city than within. Nearly 90 percent of Kingston’s working population commutes outside of the city for work. The average commute time is 24.3 minutes. This trend is driven by Kingston’s proximity to Knoxville and Oak Ridge. There are also a significant number of workers that commute to Kingston for work. Reliable data is not available to determine the predominant industry that attracts these workers to the city. When adding income data to the analysis, one could surmise that Kingston’s residents commute to higher paying jobs, thus leaving lower wage jobs within the city for those that commute to Kingston from the county and other nearby cities. As mentioned in the population analysis, in-migration from within Roane County to the city could be a source for population growth. This could easily occur if workers that commute to the city decide to move to the city to shorten their commute. If this type of migration begins to occur, policies that encourage lower cost housing may need to be examined. Sources: "Center for Business and Economic Research." University of Tennessee. N.p.. Web. 23 Apr
2013. <http://cber.bus.utk.edu/>. United States. Census Bureau. Web. <http://www.census.gov/>. United States. Census Bureau. Web. <http://onthemap.ces.census.gov/>.
36

Chapter 4: Natural Factors Affecting Development
INTRODUCTION
The natural environment of a community can affect the location and density of developments. In communities with significant limitations due to natural factors, land use regulations need to ensure minimal conflict between the use and the physical environment. Natural factors can be placed in the following categories: climate, air and water quality, topography, drainage, flooding, and soils. Each of these categories brings with it a unique set of challenges concerning development. Ignoring these factors can prove to be extremely costly to specific property owners as well as the entire community. Density should reflect the degree of development limitations that natural factors may impose on land to protect the welfare of the general populace. The more information that is available about these natural factors, the better equipped the city is to match land and its most appropriate use. The purpose of this chapter is to review and evaluate the natural factors influencing the land use patterns in Kingston and its planning region.
CLIMATE
The climate in Kingston is described as temperate and continental. This climate is characterized by relatively mild winters with short, erratic cold spells and moderate summers with cool evenings. There is normally an abundant amount of rainfall in Kingston. The normal annual rainfall for the Watts Bar Watershed within which Kingston lies, is 51.69 inches. Precipitation is usually heaviest in late winter and early spring, and lightest in the late summer and early fall. Thus, the periods of heavy rains are offset by periods of moderate to severe drought. Kingston is subject to some localized flooding during periods of prolonged heavy rain. A majority of the city’s mapped flood hazard areas or floodplains are found within the shoreline of the Watts Bar Reservoir, a Tennessee Valley Authority (TVA) reservoir bordering the city to the north, west, and south.
The mean annual temperature of the Kingston area is 58.8 degrees Fahrenheit. The
average maximum temperature is 69.5 degrees Fahrenheit while the average minimum temperature is 48.1 degrees Fahrenheit. Extreme temperatures rarely exceed 100 degrees Fahrenheit or fall below 0 degrees Fahrenheit. Although winters are not severe they are often wet, consisting of slow, gentle rains that last a half a day or more. The average frost-free season usually extends from April to October. The climate of Kingston and the affect that it has had on development can best be described as minimal. Development in areas prone to localized flooding should be avoided, but in general, rainfall and climate have an insignificant effect on development in the municipality.
AIR QUALITY
Air pollution affects the natural environment, the built environment, and the health of those that are exposed to it. The United States Environmental Protection Agency (EPA) classifies geographic areas as attainment (in compliance with the regulations) and nonattainment (out of compliance with the regulations) for each of the regulated pollutants. A portion of Roane County has been classified as nonattainment for both the annual maximum and 24-hour maximum levels
37

for microscopic particulate matter classified as PM 2.5 (2.5 microns and smaller). The nonattainment classification applies only to the Census Block Group 47-145-0307-2, which is immediately surrounding the Kingston Fossil Plant. The only portion of the City of Kingston that is within this nonattainment area is located to the west of the Clinch River and north of Interstate 40. The area is depicted on Illustration 14 below. Illustration 14
Map courtesy of the Tennessee Department of Environment and Conservation
WATER QUALITY
The City of Kingston operates its own two-million gallon water treatment plant. This plant averages 822,000 gallons of output per day. The plant gets its water from three sources: Watts Bar Lake, Swan Pond Spring, and an interconnection with the City of Rockwood system. The Kingston Water System also sells water to the Watts Bar Utility District East. The EPA, through its Safe Drinking Water Information System maintains a list of all water system violations. The Kingston Water System has had no health-based violations in the ten-year reporting period. The system has had eight monitoring and record keeping violations since 2001. Looking at the city’s water source and plant capacity, water supply infrastructure is not likely to become a limiting factor for future growth.
TOPOGRAPHY
Kingston is located on a peninsula formed by the Clinch River and Watts Bar Reservoir. The Emory River flows into the Clinch just north of the city and the Clinch River flows into the Tennessee River just south of the city. The city sits at the base of the Cumberland Plateau in the western portion of the Great Valley of East Tennessee. The underlying rock stratum of the Tennessee Valley consists mainly of Chattanooga Shale. This bedrock is covered in most places by a layer or layers of alluvial and colluvial material. The general topography of the city and its
38

urban growth boundary is a peninsula interrupted by alternating ridges and valleys. The ridges and valleys run in a generally northeast to southwest direction. Elevation within the city ranges from approximately 750 feet to just over 1,000 feet. Areas of slope over 15 percent are found along the ridges and along the waterfront. Looking at the existing land use map in the next chapter (Illustration 20), the development pattern has historically remained concentrated to the valleys and the areas along the base of ridges where access is easiest. The areas of steep slopes could be an impediment to future development as land with fewer limitations reaches full development. See Illustration 15 for a graphical depiction of the natural factors in the city and its urban growth boundary.
A secondary topographic issue that may affect future development is Karst Topography. Karst Topography in Tennessee is characterized by limestone formations that are eroded by the weak acids found in rainwater and in certain soil types. This erosion eventually forms caves, sinkholes, and subsurface water channels. The area in and around Kingston, along with most of East Tennessee, is identified as a Karst area. The United States Geologic Survey (USGS) topographic maps identify several sinkholes in the Kingston area.
DRAINAGE AND FLOODING Drainage in Kingston and the surrounding area begins on the ridges and runs to the valleys where it generally turns parallel to the ridges and flows to the neighboring rivers. This drainage pattern is known as the trellis pattern of geomorphology. This drainage pattern is common in the ridge and valley/folded mountain land form. Identified flood areas within the city are limited to areas that adjoin Watts Bar Reservoir and drainage areas as they adjoin the lake. Drainage within the city and in the surrounding areas should not be an impediment to future development as long as any alteration to drainage channels is done properly. Changes to drainage patterns may expose previously unknown areas of Karst Topography which may impact the ability to develop affected properties.
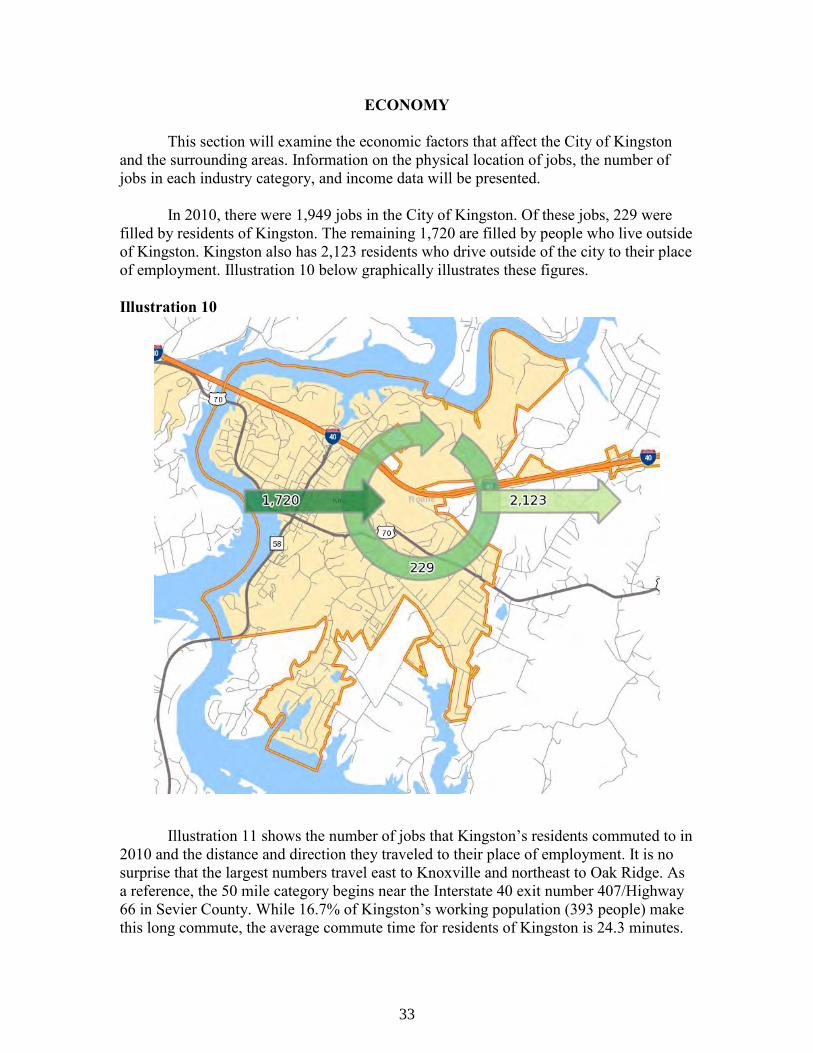
SOILS One of the most important of the natural factors affecting development in any community is the characteristics and capabilities of the various soils found in the community. Characteristics such as permeability, texture, depth to bedrock, associated topography, and susceptibility to flooding are all important in determining the appropriate land use for particular sites. Looking at soils from a development perspective, roads and foundations are the most likely factor that will affect development in the future. A general description of the largest soil types found in the county and a detailed description of the overall characteristics related to development follows. In general terms, soils are grouped into types such as shale, clay, sandstone, etc. These general soil groupings do not provide enough details to be useful for development and land use decisions. To provide a higher level of detail, soils have been grouped into subtypes that have similar characteristics. The authority on soils data is the United States Department of Agriculture, Natural Resource Conservation Service (USDA-NRCS). The NRCS study of Roane County categorizes 48 soil types in Roane County. Soils data will be presented at the county level only. The soil types, the associated acreage, and percent of the total land area of the county is provided as Table 16, which follows. Illustration 17 offers a graphical depiction of the location of these soils.
39

Page intentionally left blank.
40

LAWNVILLE RD
BUTTERMILK RD
PAINT ROCK FERRY RD
SWAN POND RD
HIGH S
T
EBLEN CAVE RD
FLEET ST
BROADBERRY AVE
HASSLER MILL RD
CHANDLEY RD
OLD J
OHNS
TON V
ALLE
Y RD
HOBSON RD
EMORY RIVER RD
OLD POPLAR SPRINGS RD
JAMES FERRY RD
HIGH POINT ORCHARD RD
SHADY DR
FOREMAST RD
KEYLON DR
LAKE
CRES
T DR
DUG RIDGE RD
LADD RIDGE RD
SPEERS RD
EXIT 350
HAMI
LTON L
N
SKYLINE VIEW LN
GALILEAN RD
LAKEWOOD RD
DUNCAN HOLLOW RD
PENINSULA RD
FIDDLERS LN
KUDZ
U DR
CULTON LN
ROGERS RIDGE RD
HOLDER HOLLOW RD
OAK LEAF ST
ELDE
RBER
RY ST
OLD DUG RIDGE RD
LITTLE JOHNSON VALLEY RD
ROSE
BAILE
Y RD
BOXBERRY RD
FROST HOLLOW RD
THE
BATT
ERY
HOMEP
ARK R
D
PATTO
N FERRY RD
LANE HEDGECOCK RD
HEIDL
E RD
CEDAR BROOK LN
BOEING DR
ANTIQUE LN
BRAHMAN RD
BLUFF POINTE RD
CROSS CREEK LN
SQUAW VALLEY RD
CANYON LAKE DR
SPEARS DR
OLD
HEDG
ECOC
K RD
LADD
RID
GE C
IR
ALMA LN
LOVELISS ST
OLD RACE ST
MAINSAIL RD
EXIT 352
SCENIC LAKE DR
CEDAR LAKE RD
JAYBIRD DR
BETT
IS LN
BENDAMERE DR
KELS
AY DR
MURR RDSHEERWATER RD
FARR LN
SHILO
H WAY
SETTLERS RD
SMITH
HILL
LN
WOODY M
EADO
W DR
EXIT 356
LIGGETT ST
OLD J
AMES
FERR
Y RD
ORAN
ZIRK
LE RD
CHERRY PT
MONTVUE AVE
LAWSON CENTER RD
FALLBERRY ST
GALEBERRY AVE
KINGWOOD ST
RILE
YS C
REEK
RD
BRAD
FORD
VILL
AGE W
AY
MARNEY COVE RD
LADD W
RIGHT RD
STER
RETT
LN
GRAN
T FAR
M RD
APPY TRL
PLEASANTVIEW DR
UPPER GALLAHER LNMID ST
EBLEN CIR
BALES AVE
HART
FORD
VILL
AGE W
AY
SYLVA
N WAY
HART CIR
CALVIN ST
REBA
AVE
CUNNINGHAM BLVD
VANC
ON DR
TYLER PL
EXIT 355
OBERRY RD
PINEB
ERRY
ST
MORNING COVE RD
BYRD
CIR
VAN STOWE RD
PEACH STREET DR
SCIENTIST RD
HACK
BERR
Y ST
LOWER GALLAHER LN
MELVIN DR
GREYSTONE WAY
WATERFORD PL
PARK
BERR
Y ST
SHUBERT ST
OLD N KENTUCKY ST
HATLE
YBER
RY ST
CLOWER HL
WINDSWEPT LN
BONNYVIEW AVE
PINE C
ONE T
RLHA
RDINB
ERRY
ST
KAITLYNN LN
LOOKOUT ST
MERRIWATER WAY
HEAR
ON RD
YOUNGS CREEK WAY
ONLAKE DR
SHER
MAN CI
R
CIRCLE PARK DR
GUNTERS WAY
EL JO
N LN
SWANN WAY
HARB
OUR
VIEW W
AY
GRAY KNOB RD
BOWSPRIT LN
MOSS
EY CR
EEK D
R
BROWN ELLIS DR
ARROWHEAD TRL
BOREING DR
HOLL
YBER
RY R
D
NELS
ON P
L
HITCHBERRY RD
SWICEGOOD LN
OAK TERRACE CT
POINT PARK
ROAN
E MAN
OR D
R
KINGS CLOSE
RARITY RIDGE PKWY
HENRY DAVIS RD
JUNIPER
BERRY R
D
SEVIER FERRY RD
NEWPORT WAY
ROGERS RIDGE LN
MARINERS PT
CEDA
RBER
RY ST
LANDHAVEN WAY
HOMERVILLE DR
HIGH POINTE VILLAGE WAY
KERNS LN
LERCHEN RD
FOREST WAY
HUGHES HALE LN
CHESTNUT VIEW DR
MISTLETOE BERRY RD
VINCINDA LN
BRENTWOOD CT
FORTENBERRY ST
EXIT 356B
BRAC
KETT
HILL
LN
STURGESS ST
EXIT 356A
ELMER DR
ARSENAULT XING
LORI ANN LN
BROOKBERRY RD
STINNETT ST
CHASEBERRY RD
LITTO
N CIR
SUZANNE PL
SARGENT DR
EXIT 350
WALLS RD
RIDGECREST
DR
WOODLAWN DR
SMITH RD
HESTER RD
CEDAR GROVE CHURCH RD
SUNRISE D
R
CIRCLE DR
MILLER LNRAINTREE LN
ISLAN
D LN
MOSES RD
HIGH
LAND
DR
COURT ST
EUCLID AVE
MURR RD
CEDAR LN
BAILEY RD
BLACK OAK RD
THOR
NTON
LN
CALL
OWAY
RD
BLUF
F VIEW
RD
BLUFF RD
ELM ST
COLONIAL DR
PARK PL
DAVIS DR
EAST DR
MILE RD
LAWSO
N MILL
RD
KATH
Y CIR
DYER ST
OMEGA D
R
MOBILE DR
HIGH POINT CIR
VILLAGE TRCE
WALD
EN LN
ROARK RD
HIGHLAND ST
PINEVIEW DR
COLO
NIAL D
R
SPRING ST
PAGE L
N
HOWARD RD
JOHN
SON S
T
WOODLAND DR
LAKEVIEW RD
SHADY LN
LAKEVIEW DR
FISHER ST
LOOKOUT DR
VILLA
GE WAY
KING ST
HILLTOP RD
MEADE DR
WARREN LN
WALTON RD
RAY ST 58
EXIT 360
MILL S
T
POSTON PL
CEDAR BROOK LN
FOXF
IRE LN
PEARL LN
AUTUMN LN
WESTSHORE DR
DANIEL RD
SKYLINE DR
ORCH
ARD
RD
FISHER ST
CUNNINGHAM BLVD
RIDGE TRAIL
RD
SHAD
Y OAK
S LN
OAK ST
EAST DR
THACKER RDTA
NASI
TRL
DOGWOOD DR
WOODMONT LN
HUFF RD
ZIRKLE RD
SCOT
T LN
SUNSET LN
ROSE RD
EAST CHURCH ST
EDGEWOOD DR
RIVER BEND DR
LAKE
SHOR
E DR
HONEYSUCKLE
RD
REBEL RD
3RD ST
5TH S
TROANE ST
HILL
TOP
LN KENT
UCKY
ST
KIDWELL LN
OAK DR
LEWIS LN
WARD RD
WESTSHORE DR
PONDEROSA DR
LAKEWOOD LN
BLOSSOM LN
ROSEBUD LN
HILL ST4T
H ST
WHITE OAK DR
BAILE
Y RD
HIGHLAND DR
CLEA
R SP
RING
S RD
PARK RD
CHES
TNUT
RIDG
E RD
FARMER RD
LONG
RD
MEADOWVIEW DR
PINE RIDGE RD
FRANKLIN ST
WOOLSEY RD
NOLAND LN
SUNSET DR
EDMONDS LN
OLD UNION RD
WOODLAND DR
SHADY LN
CHARLES PL
RAIN
S LN
HUMPHREY LN
WISE RD
FOREST HILL DR
LUCINDA LN
VIRGINIA ST
VALL
EY RD
CENTURY DR
OLD BUCK CREEK RD
DOGW
OOD
DR
OAKVIEW DR
LONGVIEW DR
EXIT 355
ARMOUR RD
BUCK
CREE
K RD
MCMU
RRAY
RD
FERG
USON
LN
COUNTRY DR
LEISURE LN
LAKE CIR
1ST S
T
VICKIE LN
BEECHWOOD LN
ADKISSON RD
PERRY RD
CLOWER RD
FOXWOOD DR
NELSON DR
CRIPP
LE C
REEK
RD
WESTCLIFF DR
OBRIEN RD
WOODS
LN
DOGWOOD CT
POPLAR SPRINGS RD
CUMBERLAND ST
HARTFORD RD
BRENTWOOD PT
MEADO
WVIEW DR
HAMI
LTON
RD
THOMAS BLVD
TUCKER LN
LAKECREST DR
LAKE
VIEW
DR
HENS
LEY R
D
LAKE
SIDE D
R
WRIGHT RDDAVIS DR
MOOR
E LN
MAYFLOWER RD
RARITY RIDGE PKWY
GEOR
GIA L
N
Kingston
Harriman
§̈¦40
£¤70¬«58
¬«304
SOURCE STATEMENT: The slope grid was derived from a U.S. Geological Survey digital elevation model forRoane County. The flood data was obtained from the Digital Flood Insurance Rate Map Dataset for RoaneCounty provided by the U.S. Federal Emergency Managment Agency, November 2009. The hydric soils data wasobtained from the U.S. Department of Agriculture, Natural Resources Conservation Service, Soil SurveyGeographic (SSURGO) database for Roane County, Tennessee. Publication Date: June 22, 2009.Hydric soils are defined by the National Technical Committee for Hydric Soils (NTCHS) as soils that formed underconditions of saturation, flooding, or ponding long enough during the growing season to develop anaerobicconditions in the upper part (Federal Register, 1994). Under natural conditions, these soils are either saturated orinundated long enough during the growing season to support the growth and reproduction of hydrophyticvegetation."All hydric" means that all components listed for a given map unit are rated as being hydric. "Partially hydric"means that at least one component of the map unit is rated as hydric, and at least one component is rated as nothydric.
ILLUSTRATION 15
Map prepared by:East Tennessee Development District
Geographic Information SystemsAlcoa, TN
Map printed: October 3, 2013This map is not to be used for engineering purposes.
2,500 0 2,5001,250Feet
NATURAL FACTORS AFFECTING DEVELOPMENTCITY OF KINGSTON, TENNESSEE AND URBAN GROWTH BOUNDARY
µ
Between 15% and 30% slopeOver 30% slope
Areas of 0.2% annual chance of floodingFlood zones A and AE
Stream/River
Hydric soilsPartially hydric soilsSoils data unavailable
Kingston UGBCorporate Limits
41

42

The most prevalent soil types in the county are Fullerton-Pailo complex, Montevallo Channery silt loam, Water, Dewey silt loam, and Townley silt loam. All of these soil types are found in Kingston and its urban growth boundary. Fullerton-Pailo complex (Fu) has four subtypes (B-E) that categorize the soil based on the slopes at which it is found. This soil type is found on ridges and the side slopes of ridges. It is typically more than 80 inches to a restrictive layer, it is well drained, it does not typically flood, and at lower slope is considered prime farmland. Montevallo channery silt loam (Mo) has three subtypes (C-E) that categorize the soil based on the slopes at which it is found. This soil type is found on ridges and the side slopes of ridges. This soil is typically 10 to 20 inches to bedrock, not typically flooded, and not considered prime farmland. Water (W) is soil that is covered by water most of the time. Dewey silt loam (De) has four subtypes (B-E) that categorize the soil based on the slopes at which it is found. This soil type is found on ridges and the side slopes of ridges. It is typically more than 80 inches to a restrictive layer, it is well drained, it does not typically flood, and at lower slope is considered prime farmland. Townley silt loam (Te) has three subtypes (C-E) that categorize the soil based on the slopes at which it is found. This soil type is found on ridges and the side slopes of ridges. This soil is typically 20 to 40 inches to bedrock, not typically flooded, and not considered prime farmland. The NRCS rates soil types for their ability to support various development activities. It should be noted that if an area is designated as moderately or extremely limited for a particular development activity, the proposed activity can still occur on the site. The cost of designing and implementing ameliorative action will increase with the severity of the limitation, and the overall density will need to be lower. Some examples of development-related limitations are dwellings with slab or basement foundations. Commercial development is considered moderately to severely limited throughout the area. Areas with soil properties that tend to be corrosive to concrete are identified as severely limited on ridges but not in valleys (See Illustration 18). Areas with soil properties that tend to be corrosive to exposed steel are identified as severely limited in valleys but not on ridges (See Illustration 19). Septic suitability is another soil capability that can have a dramatic impact on the ability to develop a property. The NRCS criteria for septic suitability do not match the State’s regulations. The discrepancy between the standards makes the data unrealistic and unusable. Since most areas of the city have access to sewer and any annexation that occurs must include a plan for supplying public utilities to the annexed area, the impact of poor septic suitability is effectively eliminated. Table 16: Soil Types for Roane County Symbol Soil Name Acres Percent of
Total Fu Fullerton-Pailo complex 64,504.0 25.53%
Mo Montevallo channery silt loam 40,530.8 16.04%
No Data 24,410.2 9.66%
W Water 21,038.6 8.33%
43
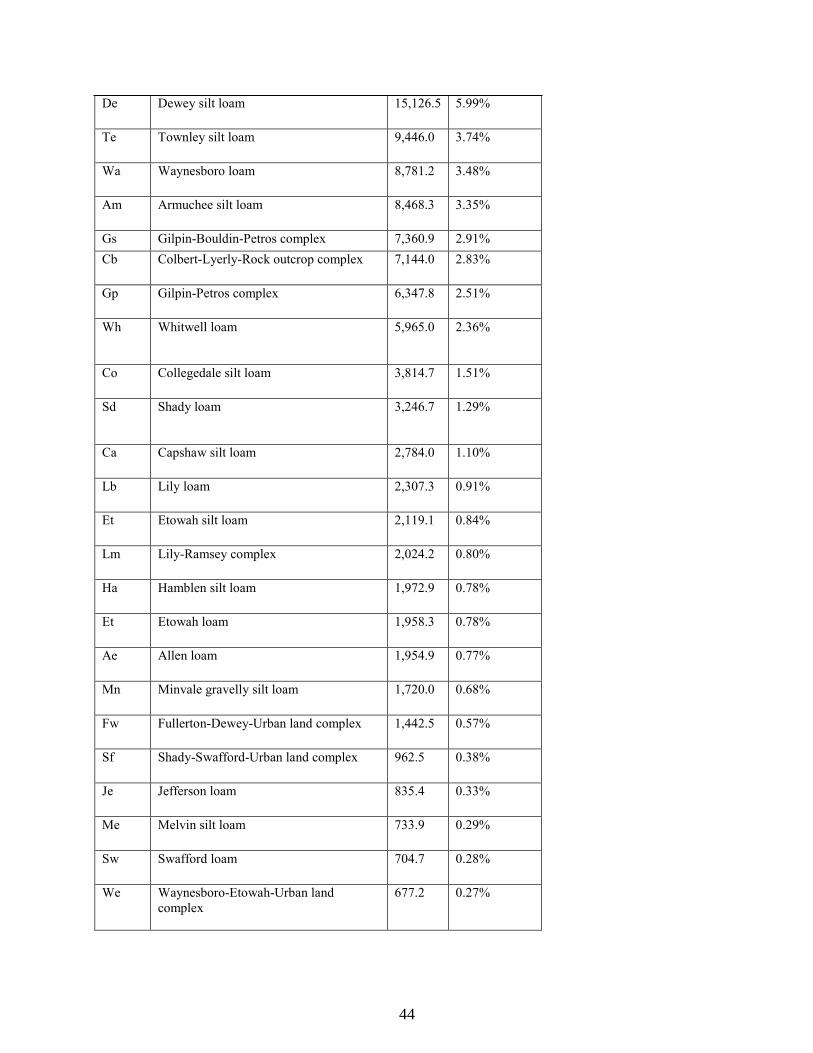
De Dewey silt loam 15,126.5 5.99%
Te Townley silt loam 9,446.0 3.74%
Wa Waynesboro loam 8,781.2 3.48%
Am Armuchee silt loam 8,468.3 3.35%
Gs Gilpin-Bouldin-Petros complex 7,360.9 2.91% Cb Colbert-Lyerly-Rock outcrop complex 7,144.0 2.83%
Gp Gilpin-Petros complex 6,347.8 2.51%
Wh Whitwell loam 5,965.0 2.36%
Co Collegedale silt loam 3,814.7 1.51%
Sd Shady loam 3,246.7 1.29%
Ca Capshaw silt loam 2,784.0 1.10%
Lb Lily loam 2,307.3 0.91%
Et Etowah silt loam 2,119.1 0.84%
Lm Lily-Ramsey complex 2,024.2 0.80%
Ha Hamblen silt loam 1,972.9 0.78%
Et Etowah loam 1,958.3 0.78%
Ae Allen loam 1,954.9 0.77%
Mn Minvale gravelly silt loam 1,720.0 0.68%
Fw Fullerton-Dewey-Urban land complex 1,442.5 0.57%
Sf Shady-Swafford-Urban land complex 962.5 0.38%
Je Jefferson loam 835.4 0.33%
Me Melvin silt loam 733.9 0.29%
Sw Swafford loam 704.7 0.28%
We Waynesboro-Etowah-Urban land complex
677.2 0.27%
44
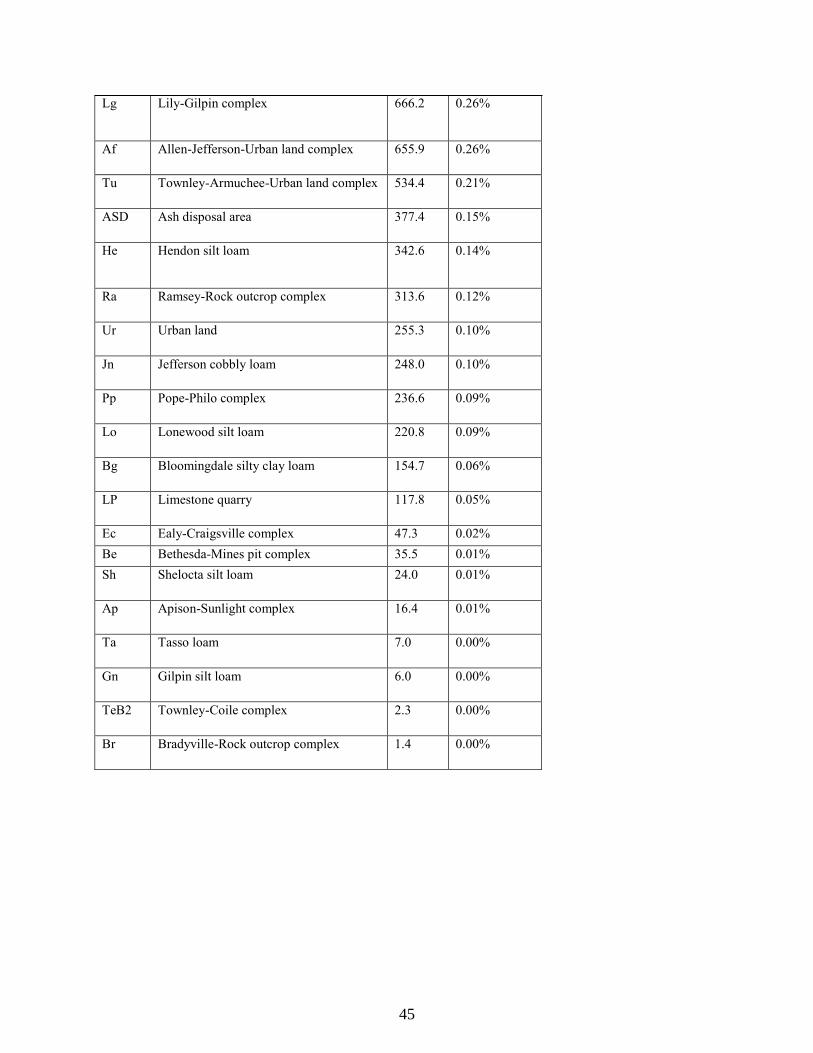
Lg Lily-Gilpin complex 666.2 0.26%
Af Allen-Jefferson-Urban land complex 655.9 0.26%
Tu Townley-Armuchee-Urban land complex 534.4 0.21%
ASD Ash disposal area 377.4 0.15%
He Hendon silt loam 342.6 0.14%
Ra Ramsey-Rock outcrop complex 313.6 0.12%
Ur Urban land 255.3 0.10%
Jn Jefferson cobbly loam 248.0 0.10%
Pp Pope-Philo complex 236.6 0.09%
Lo Lonewood silt loam 220.8 0.09%
Bg Bloomingdale silty clay loam 154.7 0.06%
LP Limestone quarry 117.8 0.05%
Ec Ealy-Craigsville complex 47.3 0.02% Be Bethesda-Mines pit complex 35.5 0.01% Sh Shelocta silt loam 24.0 0.01%
Ap Apison-Sunlight complex 16.4 0.01%
Ta Tasso loam 7.0 0.00%
Gn Gilpin silt loam 6.0 0.00%
TeB2 Townley-Coile complex 2.3 0.00%
Br Bradyville-Rock outcrop complex 1.4 0.00%
45

Page intentionally left blank.
46
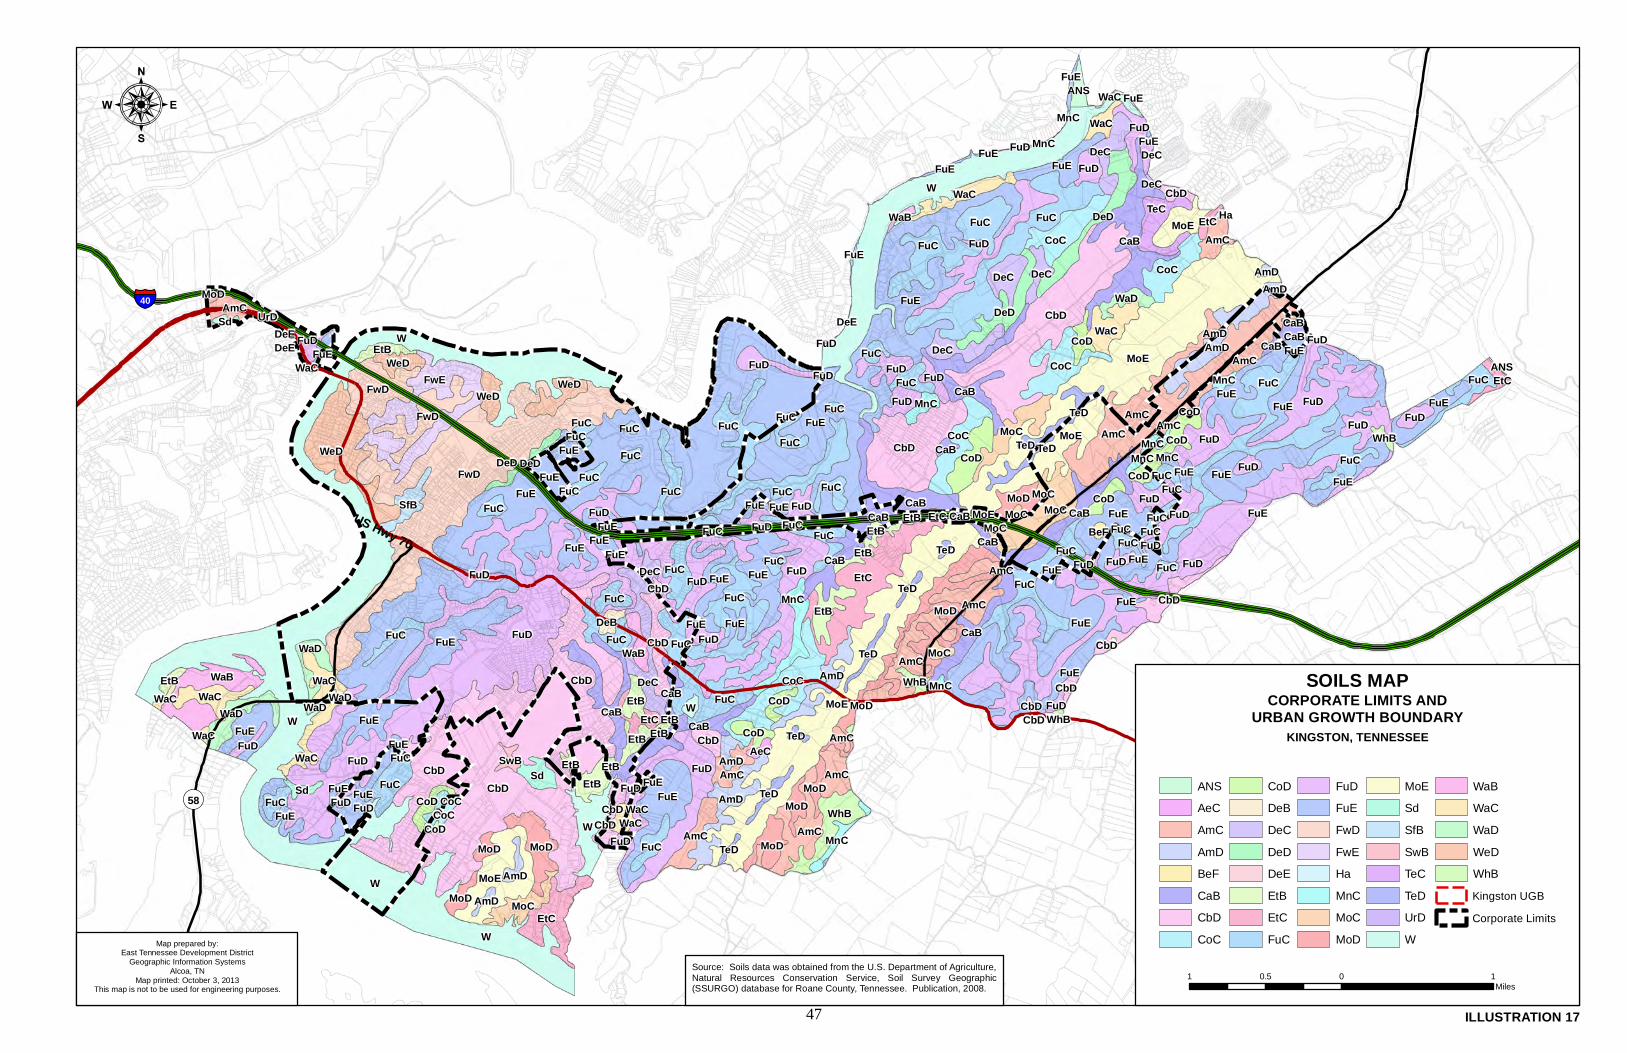
W
W
CbD
MoE
MoE
W
FuD
FuECbD
FuE
FuD
FuE
FuC
EtC
CbD
FuE
FuC
FuD
FuD
FuD
W
FuE
FuCCoCWaB
EtC
FuC
CaB
CoC
FuD
FuE
CoC
AmC
WhB
TeCFuC
CoC
WaC
FuD
MoE
Sd
DeC
EtB
MoE
CaB
FuD
FuC
FuCMoD
FuE
FuD
FuECaB
DeD
AmC
AmCFuE
FuE
CaB
CaB
AmD
AmCFuC
CoC
FuE
FuE
DeD
MoD
FuC
FuE
MoC
CoD
FuC
FuE
DeC
CaB
FuE
TeD
FuE
WaD
FuE
MnC
AmD
EtB
FuD
DeC
MoC
FuE
FuD
CoD
WaC
WaC
AmC
MoD
MoD
FuC
AmC
AmC
CbD
FuD
FuE
FuC
WaC
MoD
EtB
FuC
FuDFuC
FuE
AmC
AmC
DeC
FuD
FuCFuD
WaD
FuE
FuC
FuC
CoD
FuE
CbD
MoD
WaC
FuD
FuD
CoD
FuD
AmD
EtC
MnC
MoD
W
MnC
ANS
Sd
TeD
FuC
AmD
TeD
DeC
CoD
MoD
CbD
MoD
FuE
CaB
FuD
FuC
FuD
CoC
FuC
WhB
EtC
AmD
EtB
CbD
MoC
FuDSwB
CbD
AeC
FuC
CbD
FuE
FuD
MnC
FuC
CaBWhB
TeD
FuE
CaB
MoC
AmCTeD
MoC
TeD
MoC
AmD
WaB
FuE
MnC
FuC
TeD
FuE
AmD
WaC
AmC
WaC
FuC
FuE
MnC
CbD
WaD
WaC
FuC
AmD
Ha
DeC
FuD
CbD
FuE
CoD
WhB
DeD
FuE
CaB
WaC
CbD
ANS
MnC
MnC
FuE
FuD
FuC
MnCFuE
FuE
EtB
DeCFuD
EtB
DeE
FuD
FuE
FuC
FuE
W
FuD
FwD
W
CbD
FwE
CbD
AmCWeD
FuE
MoC
FwD
FuE
AmC
FuD
CaB
CaB
DeC
MoEFwD FuC
AmD
FuE FuC
CbD
SfB
FuECaB
FuC
WeD
FuC
FuC
FuC
FuE
WaC
FuDFuD
EtB
WaD
EtBEtC
WeD
FuC
WeD
FuD
WaB
FuC
DeD
CbD
FuC
EtB
FuD
CoD
CoD
FuE
FuC
CaB
FuC
DeB
FuC FuE
FuC
FuD
CoD
CoC WaC
MnC
EtB
FuE
FuD
FuD
FuE
Sd
EtCEtB MoE
UrD
FuCCaB
BeF
FuD
MoD
FuD
FuC
FuC
TeDFuC
EtB
TeD
CaB
EtB
FuC
FuD
WaD
WaC
FuE
FuE
CoD
FuC
FuD
AmC
DeEDeE
§̈¦40
US Hwy 70¬«58
¬«304
Map prepared by:East Tennessee Development District
Geographic Information SystemsAlcoa, TN
Map printed: October 3, 2013This map is not to be used for engineering purposes.
US Hwy 70
:
ILLUSTRATION 17
1 0 10.5Miles
Source: Soils data was obtained from the U.S. Department of Agriculture,Natural Resources Conservation Service, Soil Survey Geographic(SSURGO) database for Roane County, Tennessee. Publication, 2008.
SOILS MAP
KINGSTON, TENNESSEE
CORPORATE LIMITS ANDURBAN GROWTH BOUNDARY
ANSAeCAmCAmDBeFCaBCbDCoC
CoDDeBDeCDeDDeEEtBEtCFuC
FuDFuEFwDFwEHaMnCMoCMoD
MoESdSfBSwBTeCTeDUrDW
WaBWaCWaDWeDWhBKingston UGBCorporate Limits
47

48
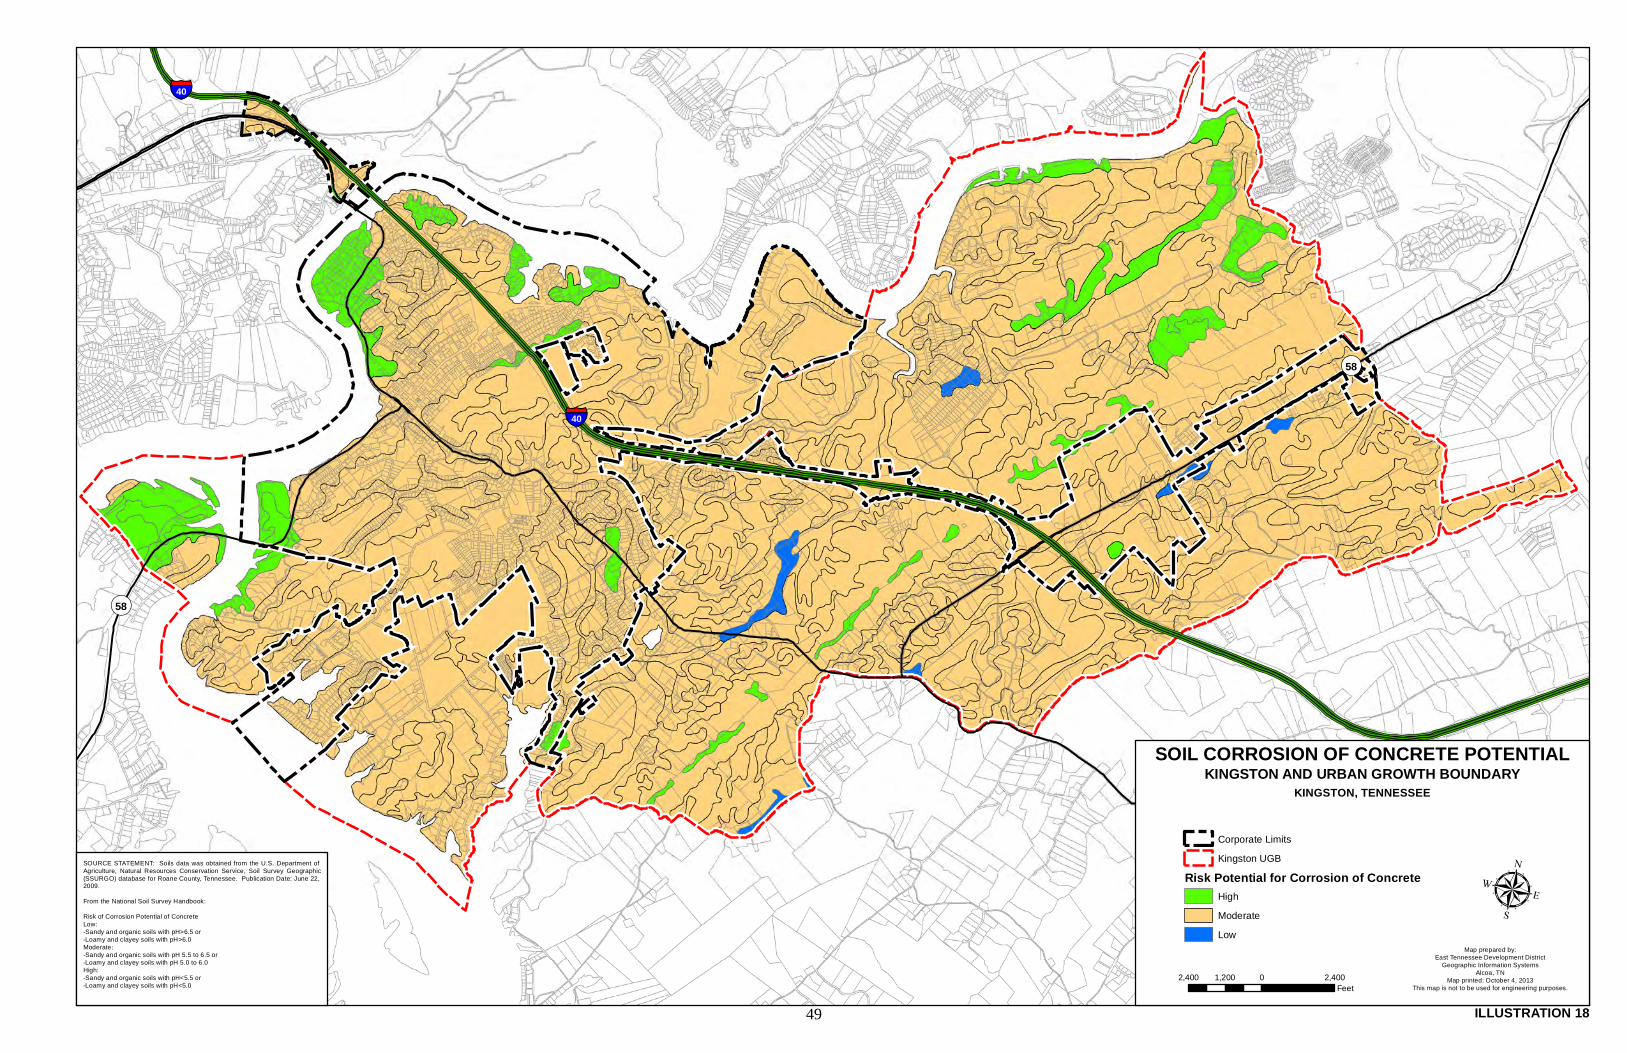
£¤70
§̈¦40
§̈¦40
¬«58
¬«58
£¤70
SOURCE STATEMENT: Soils data was obtained from the U.S. Department ofAgriculture, Natural Resources Conservation Service, Soil Survey Geographic(SSURGO) database for Roane County, Tennessee. Publication Date: June 22,2009.From the National Soil Survey Handbook:Risk of Corrosion Potential of ConcreteLow:-Sandy and organic soils with pH>6.5 or-Loamy and clayey soils with pH>6.0Moderate:-Sandy and organic soils with pH 5.5 to 6.5 or-Loamy and clayey soils with pH 5.0 to 6.0High:-Sandy and organic soils with pH<5.5 or-Loamy and clayey soils with pH<5.0
Map prepared by:East Tennessee Development District
Geographic Information SystemsAlcoa, TN
Map printed: October 4, 2013This map is not to be used for engineering purposes.
2,400 0 2,4001,200Feet
Corporate LimitsKingston UGB
Risk Potential for Corrosion of ConcreteHighModerateLow
µ
KINGSTON, TENNESSEE
SOIL CORROSION OF CONCRETE POTENTIALKINGSTON AND URBAN GROWTH BOUNDARY
ILLUSTRATION 1849

50
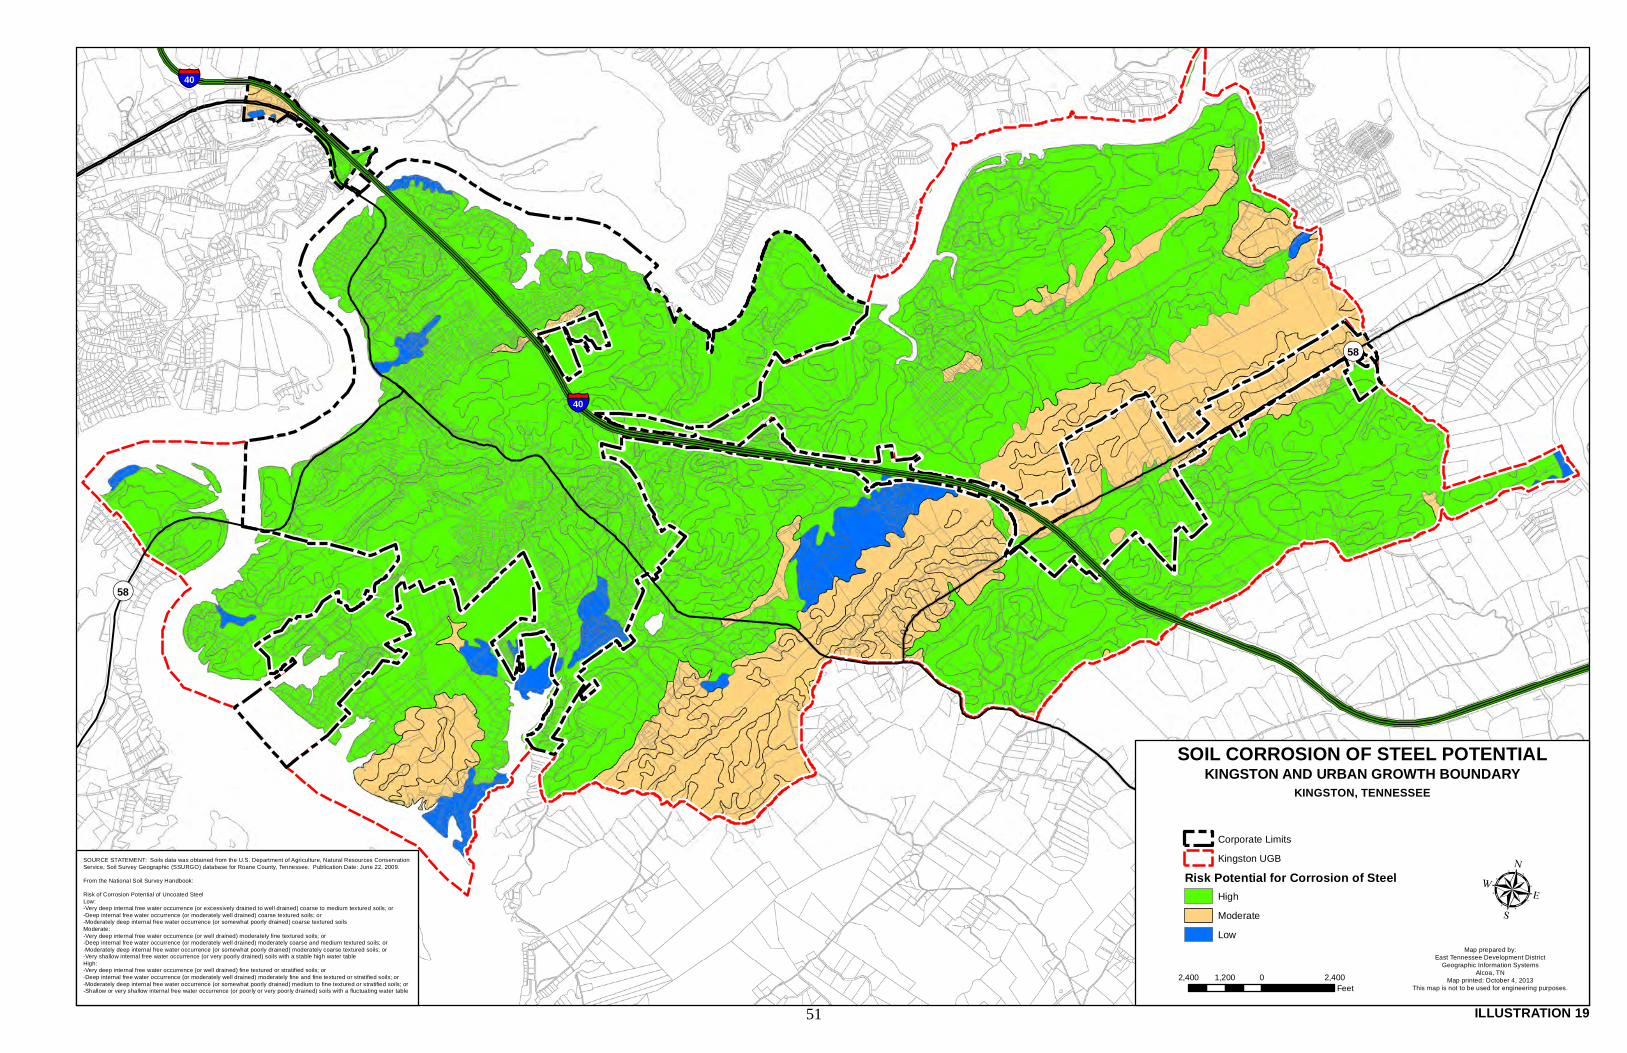
£¤70
§̈¦40
§̈¦40
¬«58
¬«58
SOURCE STATEMENT: Soils data was obtained from the U.S. Department of Agriculture, Natural Resources ConservationService, Soil Survey Geographic (SSURGO) database for Roane County, Tennessee. Publication Date: June 22, 2009.From the National Soil Survey Handbook:Risk of Corrosion Potential of Uncoated SteelLow:-Very deep internal free water occurrence (or excessively drained to well drained) coarse to medium textured soils; or-Deep internal free water occurrence (or moderately well drained) coarse textured soils; or-Moderately deep internal free water occurrence (or somewhat poorly drained) coarse textured soilsModerate:-Very deep internal free water occurrence (or well drained) moderately fine textured soils; or-Deep internal free water occurrence (or moderately well drained) moderately coarse and medium textured soils; or-Moderately deep internal free water occurrence (or somewhat poorly drained) moderately coarse textured soils; or-Very shallow internal free water occurrence (or very poorly drained) soils with a stable high water tableHigh:-Very deep internal free water occurrence (or well drained) fine textured or stratified soils; or-Deep internal free water occurrence (or moderately well drained) moderately fine and fine textured or stratified soils; or-Moderately deep internal free water occurrence (or somewhat poorly drained) medium to fine textured or stratified soils; or-Shallow or very shallow internal free water occurrence (or poorly or very poorly drained) soils with a fluctuating water table
Map prepared by:East Tennessee Development District
Geographic Information SystemsAlcoa, TN
Map printed: October 4, 2013This map is not to be used for engineering purposes.
2,400 0 2,4001,200Feet
Corporate LimitsKingston UGB
Risk Potential for Corrosion of SteelHighModerateLow
µILLUSTRATION 19
KINGSTON, TENNESSEE
SOIL CORROSION OF STEEL POTENTIALKINGSTON AND URBAN GROWTH BOUNDARY
51

52

SUMMARY OF FINDINGS
Kingston is located in an area where natural factors have a minimal effect on most development. The climate is temperate. The air is clean (for the most part). Water is abundant and the city has stayed ahead of water treatment demand. There are some areas of steep slopes and Karst, but the available vacant land has historically been adequate to meet development pressure. Drainage and flooding may have some minimal impact on development, but it will typically be localized to areas where drainage channels meet lakes and rivers. Soils could significantly impact future development as the land in valley areas (which has fewer limitations) develops, leaving only the ridges for development. Ridge land is likely still developable, but densities will be lower and infrastructure and development costs will be higher. Sources: State of Tennessee. Comptroller of the Treasury. Computer Assisted Appraisal System.
Web. State of Tennessee. Department of Environment and Conservation. Air Pollution Control.
Web. <http://tn.gov/environment/air >. State of Tennessee. Tennessee Base Mapping Program. Web. United States. Environmental Protection agency. Web.
<http://www.epa.gov/air/index.html>. United States. Environmental Protection agency. Web.
<http://water.epa.gov/drink/index.cfm>. United States. Federal Emergency Management Agency. Map Service Center. Web.
<https://msc.fema.gov>. United States. Geologic Survey. Web. <http://www.usgs.gov/>. United States. Natural Resource Conservation Service. Web Soil Survey. Web.
<http://websoilsurvey.sc.egov.usda.gov/>. United States. Southeast Regional Climate Center. Web. <http://www.sercc.com/>.
53

Page intentionally left blank.
54

Chapter 5: Existing Land Use and Transportation Analysis
INTRODUCTION
Planning for future growth and transportation infrastructure is a complex and difficult
task that requires a large amount of data. Some of this data has already been presented; however, more information is needed. An inventory of the existing land uses and transportation infrastructure will be presented and used as a starting point from which this plan can evaluate and project areas where development is likely to occur and areas best suited for varying types and densities. The data in this chapter will be presented for the City of Kingston as well as the city’s urban growth boundary.
EXISTING LAND USE AND TRANSPORTATION
This section identifies and analyzes the various uses by category and the amount of land
devoted to each. Illustration 20 depicts the existing land use pattern in the City of Kingston and in the city’s urban growth boundary. Land use surveys were completed by the East Tennessee Development District in April of 2013. The summary table for this inventory is located in Illustrations 21 and 22. The land uses depicted on Illustration 20 are grouped into the following categories: Residential: Land on which one or more dwelling units are located. This includes all single-family residences, multi-family residences, and mobile homes. Land in this category also includes agricultural and timber parcels that have at least one residence located on them. Commercial: Land on which wholesale or retail trade activities and private services occur. This category includes uses such as retail stores, restaurants, repair services, professional offices, personal and business services, hotels/motels, banks, and other similar uses. Industrial: Land on which the manufacturing of products takes place. This category includes light and heavy manufacturing uses and warehousing activities. Agriculture and Timber: Land which does or could support agricultural or forestry operations such as farms, crops, pasture, or groves/stands of timber. Properties in this category do not contain residences. Agricultural and timber tracts that contain residences are included in the residential category. Public and Semi Public: Land on which museums, libraries, parks, churches, and similar institutional uses; educational facilities; utility related structures or facilities; and federal, state, and local governmental uses are located. Water: Land which is covered by a body of water that is not contained in other parcels. Transportation: Land on which municipal streets and state highways are located, including the rights-of-way.
55

Vacant Land: Land that has not been developed into one of the other uses identified above. Other: Land that contains an improvement but does not fit into any other category.
56
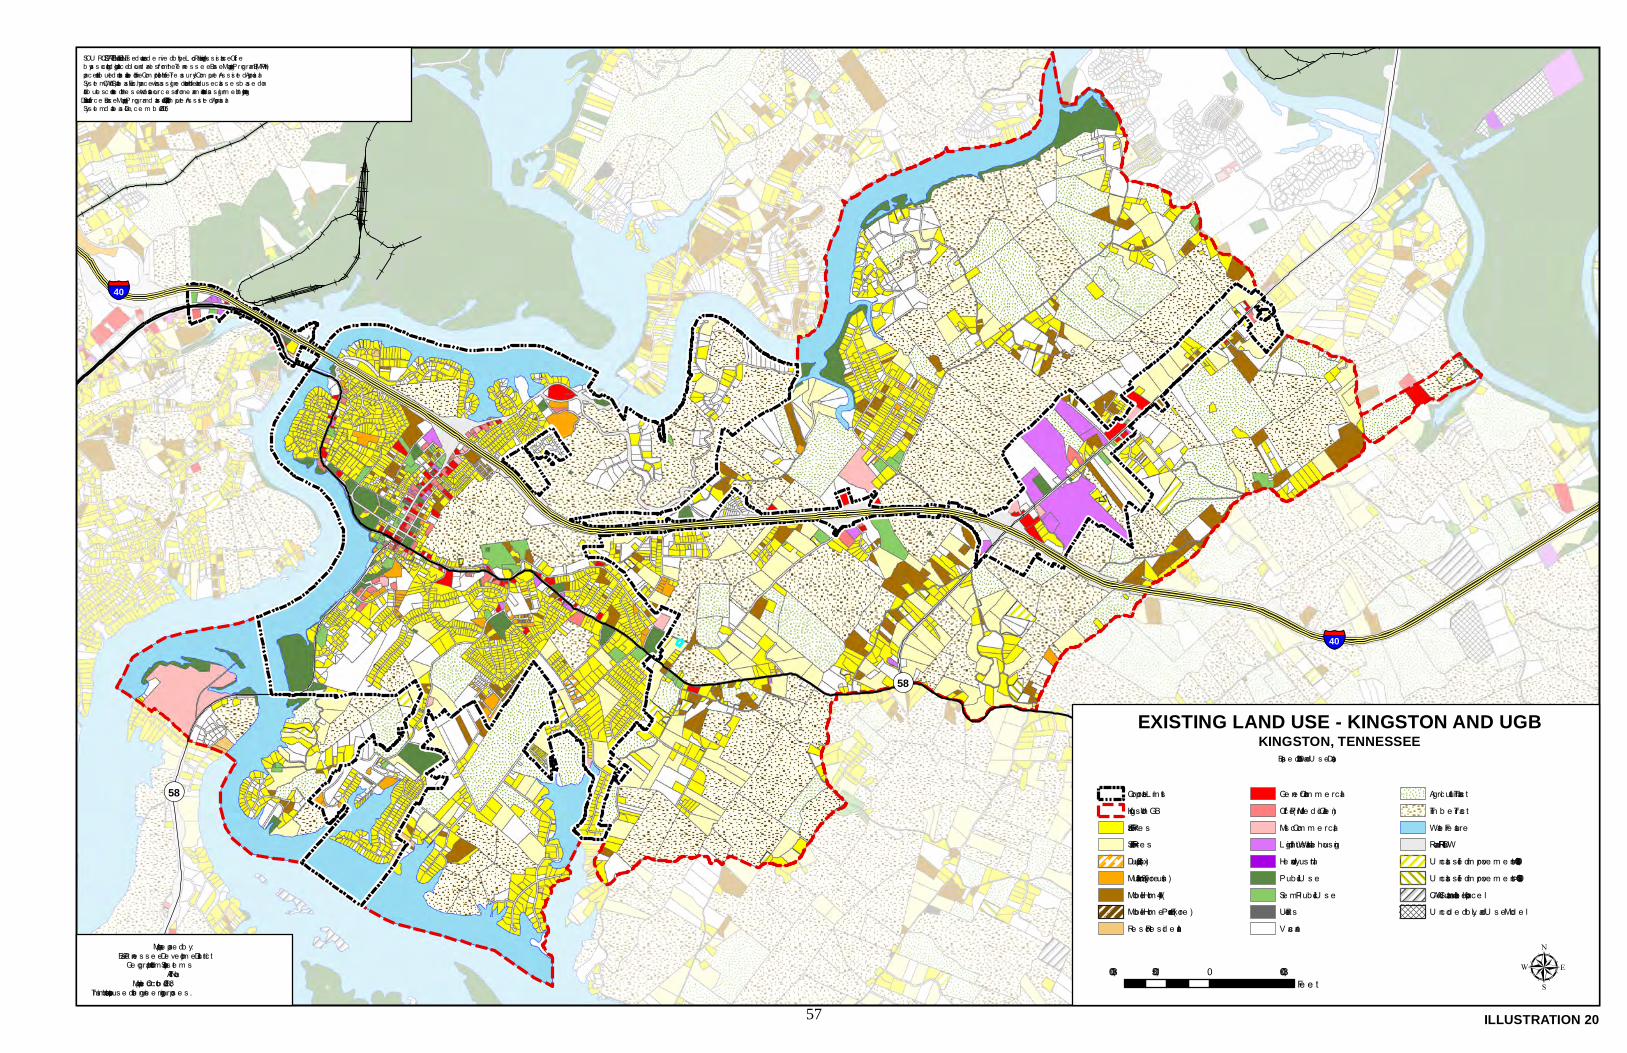
§̈¦40
§̈¦40
£¤70¬«58
¬«304
¬«58
SOU RCE STATEMENT: This land us e d ata was d e rive d b y the L oc al P lanning As s is tanc e Offic eb y as s oc iating d igital parc e l b ound arie s from the Te nne s s e e Bas e Mapping Program (BMP) withparc e l attrib ute d ata m aintaine d in the Com ptrolle r of the Tre as ury’s Com pute r As s is te d Apprais alSys te m (CAAS) d atab as e . Eac h parc e l was as s igne d to one of the land us e c las s e s b as e d onattrib ute s c ontaine d in the s e two d ata s ourc e s or from e xam ination and as s ignm e nt b y plannings taff. Data Sourc e s : Bas e Mapping P rogram d atas e t, July 12 2010; Com pute r As s is te d Apprais alSys te m d atab as e , De c e m b e r 6, 2010.
Corporate L im itsKings ton U GBSFR < 5 ac re sSFR >= 5 ac re sDuple x (2 units )Multifam ily (3 or m ore units )Mob ile Hom e (1-4)Mob ile Hom e Park (5 or m ore )Re s ort Re s id e ntial
Ge ne ral Com m e rc ialOffic e (Prof/Me d ic al/Ge n)Mis c Com m e rc ial;L ight Ind us trial / Ware hous ingHe avy Ind us trialPub lic U s eSe m i-Pub lic U s eU tilitie sV ac ant
Agric ultural Trac t Tim b e r Trac tWate r Fe atureRoad /Rail ROWU nc las s ifie d im prove m e nts <$30,000U nc las s ifie d im prove m e nts >=$30,000CAAS d ata unavailab le for parc e lU nc od e d b y L and U s e Mod e l
3,000 0 3,0001,500Fe e t
(Bas e d on 2010 L and U s e Data)KINGSTON, TENNESSEE
EXISTING LAND USE - KINGSTON AND UGB
Map pre pare d b y:Eas t Te nne s s e e De ve lopm e nt Dis tric t
Ge ographic Inform ation Sys te m sAlc oa, TN
Map printe d : Oc tob e r 3, 2013This m ap is not to b e us e d for e ngine e ring purpos e s .
ILLUSTRATION 20
µ57

58

LAND USE ANALYSIS CORPORATE LIMITS
Within the corporate limits of Kingston, there are approximately 5,183 acres or 8.1
square miles of land. Of the total land area, an estimated 86.25 percent, or 4,470.47 acres is developed. The categorical totals and percentage of total land area are as follows: residential land uses occupy 1,762.3 acres, or 34.0 percent; commercial land uses occupy 172.29 acres, or 3.32 percent; industrial land uses occupy 185.06 acres, or 3.57 percent; unimproved agriculture and timber land uses occupy 773.39 acres, or 14.92 percent; other unclassified uses occupy 22.87 acres, or 0.44 percent; public and semi-public uses occupy 264.43 acres, or 5.11 percent; water covers 582.64 acres, or 11.24 percent; and transportation uses occupy 707.47 acres, or 13.65 percent. There are 712.94 acres of vacant land within the city. All of the remaining vacant land is identified as having physical restrictions for future development. The development pattern of the city has historically been affected by the Clinch and Tennessee Rivers, an area of moderate to steep slopes to the east of and somewhat parallel to Kentucky Street, and the major thoroughfares that are located within and near the city. The construction of Interstate 40 effectively moved the commercial center of the city from the traditional downtown to the intersections around the interstate on and off ramps. Most recently, the Ladd Landing commercial center has relocated more of the city’s commercial uses to north of Interstate 40 and further from the traditional downtown. Illustration 21 depicts the percentage of total land dedicated to each category. A detailed analysis of each developed land use category follows. Residential Residential land use, like in most communities, is the predominate category of developed land in Kingston. Thirty-four percent (1,762.3 acres) of the total land area is devoted to residential uses. In addition, like most communities, the traditional single-family detached dwelling unit is the predominant form of residential use, occupying 1,567.6 acres or 30.24 percent of the total land area. There are 1,990 single-family uses, 161 multi-family structures, and 109 mobile home lots within the corporate limits of Kingston. It should be noted that for categorical and illustrative purposes, the mobile home category only accounts for between one to four mobile home per parcel; however, there are approximately 149 mobile homes on the 109 parcels identified above. Residential development in Kingston is primarily located along and adjacent to streets classified as collectors and local streets. Traditionally, residential structures are located on individual lots fronting these roads. As the development type changed from building individual houses to building subdivisions, new structures have begun to develop off of local streets that are built to only serve the individual development. Commercial The commercial uses in Kingston are concentrated within 3 blocks of Kentucky Street, along Highway 70, and on Gallaher Road north of Interstate 40. These commercial uses currently occupy 183 parcels, 172.3 acres, or 3.3 percent of total land area. The construction of Interstate 40 and Ladd Landing has spread the city’s commercial uses north and away from the downtown.
59
Industrial The city’s industrial uses are concentrated in the Gallaher Road area with a few scattered throughout the city. Industrial uses account for 185.1 acres or 3.57 percent of the total land area. Several of these uses are located on large parcels, which makes it appear that industrial uses are a more significant land use than commercial property. There are only 28 parcels devoted to industrial uses as opposed to 183 parcels of commercial property. Agriculture and Timber Agriculture and timber land comprises 773.39 acres within the city. This equates to 14.92 percent of the city’s land area. This land is unimproved and could be developed in the future. Land in this category should also be considered when looking at the available vacant land. Public and Semi Public Land This land use category includes 264.43 acres of public and semi-public uses such as parks, church properties, schools, government lands, utility structures and facilities, cemeteries, recreational areas, and open spaces. The area included in this category constitutes 5.11 percent of the land in the city. Water This land use category includes 582.64 acres (11.24 percent) of land that is completely inundated with water during a majority of the time, excluding private ponds. This land should be regarded as undevelopable. Transportation Rights-of-way for all city, state, and federally maintained streets and highways use 707.47 acres of land. This constitutes 13.65 percent of the total land area of the city. A more detailed analysis is contained within the transportation element of this plan. Vacant Land Currently, 13.75 percent (712.94 acres) of the city is vacant. Physical constraints, such as steep slopes, flood hazard areas, or geologic issues have some impact on all of the vacant land. Depending on the severity of the limitation, the land may only be suitable for lower-density development, or in some cases no development. Other Land There are 22.87 acres of land that are coded by the land use model as “other”. This land is 0.44 percent of the land in the city. Redevelopment and Reuse Potential The historic downtown should be evaluated for potential redevelopment, possibly as live/work units. Any future redevelopment should give significant consideration to maintaining the historic nature of the district.
60

ILLUSTRATION 21
EXISTING LAND USE, KINGSTON, TENNESSEE INSIDE CORPORATE LIMITS
APRIL 2013
Land Use Category Total Area in Acres
Percentage of Total
Land Area
Percentage of
Developed Land Area
Total Number of
Units
Density of Units per
Acre Residential
Single Family 1,567.6 30.24% 35.1% 1990 1.27
Multi Family 96.7 1.87% 2.2% 161 1.66
Mobile Home* 98.0 2.84% 2.2% 109 1.11
Residential Total 1762.3 34.00% 39.4% 2260 1.28
Commercial 172.29 3.32% 3.9% 183 1.06
Industrial 185.06 3.57% 4.1% 28 0.15
Agriculture/Timber 773.39 14.92% 17.3% 24 0.03
Other 22.87 0.44% 0.5% 22 0.96
Public Land/ Semi Public 264.43 5.11% 5.9%
Water 582.64 11.24% 13.0%
Transportation 707.47 13.65% 15.8%
Total Developed Land 4470.47 86.25% 100.0%
Total Vacant Land 712.94 13.75%
Total Land Area 5183.41 100.00%
Source: Base Mapping Program dataset, July 12 2010; Computer Assisted Appraisal System database, December 6, 2010 *1-4 Mobile Homes per parcel
Residential 34%
Commercial3%
Industrial4%
Agriculture/ Timber
15%
Other0%
Public Land/ Semi Public
5%
Public Land/ Semi Public
5%
Transportation14%
Total Vacant Land14%
Percentage of Total Land Area
61
LAND USE ANALYSIS URBAN GROWTH BOUNDARY
Within Kingston’s designated urban growth boundary (UGB), there are approximately
9,906 acres or 15.5 square miles of land. Of the total land area, an estimated 90.15 percent, or 8,930.57 acres is developed. The categorical totals and percentage of total land area are as follows: residential land uses occupy 5,816.1 acres, or 58.71 percent; commercial land uses occupy 154.03 acres, or 1.55 percent; industrial land uses occupy 6 acres, or 0.06 percent; unimproved agriculture and timber land uses occupy 1,427.33 acres, or 14.41 percent; other unclassified uses occupy 86.89 acres, or 0.88 percent; public and semi-public uses occupy 205.96 acres, or 2.08 percent; water covers 954.62 acres, or 9.64 percent; and transportation uses occupy 279.64 acres, or 2.82 percent. There are 975.41 acres of vacant land within the UGB. All of this vacant land is identified as having physical restrictions for future development. The development pattern within the UGB has historically been affected by the Clinch and Tennessee Rivers in the western portion, and Pine and Chestnut Ridges in the eastern portion. These ridges follow a general southwest to northeast track and development has tended to fall in the valleys. The ridge tops are predominately large agriculture and timber tracts and could prove difficult to develop at urban densities. This pattern is evident on Illustration 20: Existing Land Use as well as Illustration 15: Natural Factors in the previous chapter. Illustration 22 depicts the percentage of total land dedicated to each category. A detailed analysis of each developed land use category follows. Residential Residential land use is the predominate category of developed land in the UGB. Fifty nine percent (5,816.1 acres) of the total land area is devoted to residential uses. Like most communities, the traditional single-family detached dwelling unit is the predominant form of residential use, occupying 5,316.4 acres or 53.67 percent of the total land area. There are 1,064 single-family uses, 35 multi-family structures, and 165 mobile home lots within the UGB. It should be noted that for categorical and illustrative purposes, the mobile home category only accounts for between one to four mobile home per parcel; however, there are approximately 178 mobile homes on the 165 parcels identified above. The density of single family residential units is quite low; there are 0.20 single family units per acre (5 acre lot average). Commercial The commercial uses in the UGB occupy 20 parcels, 154.03 acres, or 1.55 percent of total land area. These uses are scattered throughout the UGB and do not form a district or corridor. Industrial Industrial uses account for 6.0 acres or 0.06 percent of the total land area in the UGB. There are only 6 parcels devoted to industrial uses in the UGB. This is likely due to the infrastructure demands of industrial uses and the lack of infrastructure in the more rural UGB. Agriculture and Timber Agriculture and timber land comprises 1427.33 acres within the UGB. This equates to 14.41 percent of the UGB area. This land is unimproved and could be developed in the future; however, much of this land is affected by steep slopes and other natural factors. Land in this category should also be considered when looking at the available vacant land. 62

Public and Semi Public Land This land use category includes 205.96 acres of public and semi-public uses such as parks, church properties, schools, government lands, utility structures and facilities, cemeteries, recreational areas, and open spaces. The area included in this category constitutes 2.08 percent of the land in the UGB. Water This land use category includes 954.62 acres (9.64 percent) of land that is completely inundated with water during a majority of the time, excluding private ponds. This land should be regarded as undevelopable. Transportation Rights-of-way for all city, state, and federally maintained streets and highways use 279.64 acres of land. This constitutes 2.82 percent of the total land area of the UGB. A more detailed analysis is contained within the transportation element of this plan. Vacant Land Currently, 9.85 percent (975.41 acres) of the city is vacant. Physical constraints, such as steep slopes, flood hazard areas, or geologic issues have some impact on all of the vacant land. Depending on the severity of the limitation, the land may only be suitable for lower-density development, or in some cases no development. Other Land There are 86.89 acres of land that are coded by the land use model as “other”. This land is 0.88 percent of the land in the city. Redevelopment and Reuse Potential Large residential, agricultural and timber tracts are likely to be subdivided into smaller residential lots if/when water and sewer infrastructure becomes available in the area.
63

Page intentionally left blank.
64

ILLUSTRATION 22
EXISTING LAND USE, KINGSTON, TENNESSEE URBAN GROWTH BOUNDARY
APRIL 2013
Land Use Category
Total Area in Acres
Percentage of Total
Land Area
Percentage of
Developed Land Area
Total Number of Units
Density of Units per Acre
Residential
Single Family 5,316.4 53.67% 59.5% 1064 0.20
Multi Family 108.2 1.09% 1.2% 35 0.32
Mobile Home* 391.4 3.95% 4.4% 165 0.42
Residential Total 5816.1 58.71% 65.1% 1264 0.22
Commercial 154.03 1.55% 1.7% 20 0.13
Industrial 6.00 0.06% 0.1% 6 1.00
Agriculture/Timber 1427.33 14.41% 16.0% 49 0.03
Other 86.89 0.88% 1.0% 37 0.43
Public Land/ Semi Public 205.96 2.08% 2.3%
Water 954.62 9.64% 10.7%
Transportation 279.64 2.82% 3.1%
Total Developed Land 8930.57 90.15% 100.0%
Total Vacant Land 975.41 9.85%
Total Land Area 9905.98 100.00%
Source: Base Mapping Program dataset, July 12 2010; Computer Assisted Appraisal System database, December 6, 2010 *1-4 Mobile Homes per parcel
65

Page intentionally left blank.
66
Transportation Analysis
The transportation system within a municipality provides a vital service function that is essential for growth and development. This system forms the framework upon which a community is built. A well-planned and maintained transportation system ensures adequate access and traffic circulation, which are prerequisites for economic activity and general community development.
Streets and highways typically occupy a significant percentage of the developed land area in a community. Within Kingston, approximately 13.65 percent (707 acres) of land is currently devoted to streets and roadways. All local streets and highways within Kingston total approximately 66 miles in length and are included in this land use category.
There are considerable design, purpose, and utilization differences between the various thoroughfares that traverse Kingston. To better understand and analyze the overall system, these local thoroughfares have been classified by their intended use. This review of the Kingston transportation system also includes a description of the traffic circulation pattern, major traffic generators, impediments to traffic flow, pedestrian/non-vehicular circulation, and nearby air/rail/port facilities. Thoroughfare Classification
Roadways within a city are designed to serve different functions in a community’s transportation system. These intended uses vary from providing direct access to residential properties, to providing for the uninterrupted movement of high-speed traffic. A functional classification has been adopted to identify roadway type and usage. This classification scheme corresponds with the Kingston Major Road Plan and is depicted in Illustration 23. It includes the following categories: interstate highways, arterial streets, collector streets, and local service roads. These roadway types are defined as follows: Interstate Highways: Access controlled roadways that connect major population centers devoted to serving high traffic volumes and long distance trips. Interstate 40 runs the length of the city from its easternmost point to its westernmost point. Interstate 75 is located approximately 12 road miles east of the Gallaher Road exit on Interstate 40. Arterials: Roadways that connect population centers, but often lack controlled access and traffic flow separation. Usually these are numbered U.S. or state highways. In Kingston Highway 70, Patton Ferry Road, Paint Rock Ferry Road, James Ferry Road, and portions of W. Spring Street, W. Cumberland Street, N. Kentucky Street, and Gallaher Road are classified as arterials. Collectors: Roadways that connect arterials and distribute traffic onto minor streets. These streets also may provide direct access to major traffic generators. These streets may abut neighborhoods or be located within them. South Kentucky Street is identified as a collector. Local Service Roads: Roadways with a primary function of providing direct access to adjoining individual properties. Most often, local service roads connect residential uses over short distance and are characterized by limited traffic carrying capacities. The majority of Kingston’s streets are classified as local service roads.
67

Page intentionally left blank.
68

ILLUSTRATION 23
Map prepared by:East Tennessee Development District
Geographic Information SystemsAlcoa, TN
Map printed: October 10, 2013This map is not to be used for engineering purposes.
2,000 0 2,0001,000Feet
µArterialCollectorInterstateCorporate Limits
ROADWAY CLASSIFICATIONKINGSTON, TENNESSEE
69

70
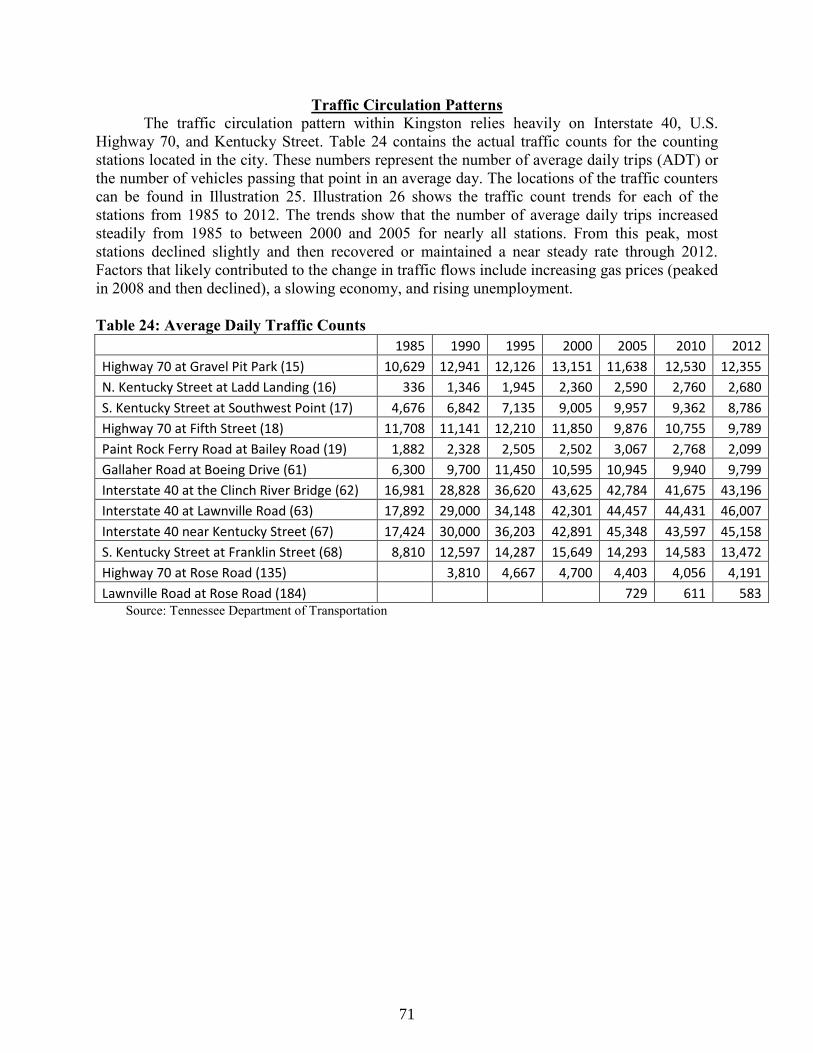
Traffic Circulation Patterns The traffic circulation pattern within Kingston relies heavily on Interstate 40, U.S.
Highway 70, and Kentucky Street. Table 24 contains the actual traffic counts for the counting stations located in the city. These numbers represent the number of average daily trips (ADT) or the number of vehicles passing that point in an average day. The locations of the traffic counters can be found in Illustration 25. Illustration 26 shows the traffic count trends for each of the stations from 1985 to 2012. The trends show that the number of average daily trips increased steadily from 1985 to between 2000 and 2005 for nearly all stations. From this peak, most stations declined slightly and then recovered or maintained a near steady rate through 2012. Factors that likely contributed to the change in traffic flows include increasing gas prices (peaked in 2008 and then declined), a slowing economy, and rising unemployment. Table 24: Average Daily Traffic Counts 1985 1990 1995 2000 2005 2010 2012
Highway 70 at Gravel Pit Park (15) 10,629 12,941 12,126 13,151 11,638 12,530 12,355
N. Kentucky Street at Ladd Landing (16) 336 1,346 1,945 2,360 2,590 2,760 2,680
S. Kentucky Street at Southwest Point (17) 4,676 6,842 7,135 9,005 9,957 9,362 8,786
Highway 70 at Fifth Street (18) 11,708 11,141 12,210 11,850 9,876 10,755 9,789
Paint Rock Ferry Road at Bailey Road (19) 1,882 2,328 2,505 2,502 3,067 2,768 2,099
Gallaher Road at Boeing Drive (61) 6,300 9,700 11,450 10,595 10,945 9,940 9,799
Interstate 40 at the Clinch River Bridge (62) 16,981 28,828 36,620 43,625 42,784 41,675 43,196
Interstate 40 at Lawnville Road (63) 17,892 29,000 34,148 42,301 44,457 44,431 46,007
Interstate 40 near Kentucky Street (67) 17,424 30,000 36,203 42,891 45,348 43,597 45,158
S. Kentucky Street at Franklin Street (68) 8,810 12,597 14,287 15,649 14,293 14,583 13,472
Highway 70 at Rose Road (135) 3,810 4,667 4,700 4,403 4,056 4,191
Lawnville Road at Rose Road (184) 729 611 583 Source: Tennessee Department of Transportation
71

Page intentionally left blank.
72

!61
!63
184!
135!
19!
16!
67!
18!
17!
15!
!68
62!
870
4190
45160
2030
2680
580
1240
9800
12360879
0
43200
4270
407009790
46010
13470
I40
U S-70
LAW NV
ILLE R
D.
E. RACE ST.
GALLAHER RD.
W . RA
CE ST
.
HOBSON RD.
LADD RD.
S. KE
NTU C
KY ST
.
FARM ER RD.
LONG
RD.
HIGH POINT ORCHARD RD.
RIDGE TRAIL
RD.
SHADY LN.
BUCK
CREE
K RD.
LAKE CREST DR.
POPL
AR SP
RINGS
RD.
HAM ILTON LN.
BAILEY RD.
ROSE RD.
FORM AST RD.
SCENIC DR.
W . SPRING ST.
OAK LEAF ST.
FOU R M ILE RD.
N. KENTU CKY ST.
SHADY DR.
OLD
JOHN
STON
VALL
EY R
D.
ORCH
ARD
RD.
N. TH
IRD ST
.
M ILL
ST.
GALILEAN RD.
LAKE
W OOD D
R.
HILL ST.
OAK DR.
BOEING DR.
OLD RACE RD.
W . RIDGEC
REST D
R. KING ST.
PAGE L
N.
LAW SON M ILL RD.
LAKE
SIDE D
R.W OODLAW N DR.
V ILLAGE W AY
LADD
RID
GE C
IR.
RIV ER BEND DR.
FOXF
IRE LN.
ALM A LN.
APACHE LN.
BETTIS LN.
FERG
U SON
DR.
LEISU RE LN.
KELSAY DR.
GRAN
T FAR
M RD
.
ROANE ST.
GREEN AC
RES RD.
SUNR
ISE DR
.
W ARD RD.
PEACH TREE LN. DOGW
OOD
DR.
AU TU M N LN.
M OBILE RD.
RAY ST.
HART CIR.
KIDW ELL LN.
E. CHU RCH ST.
LAKEW OOD RD.
U PPER GALLAHER LN.
OBERRY RD.
KINGW OOD ST.
OAKV IEW DR.
ELDEN CIR.LA
KEV IE
W DR
.
CALV IN ST.
V ANCON DR.
HART
FORD
V ILLA
GE WAY
HIGH
LAND
DR.
HARTFORD RD.
COU NTRY DR.
CIRCLE DR.
GALLAHER V IEW DR.
SHU BERT ST.
LAW SON LN.
OAK LN.
V IRGINIA ST.
ROARK RD.
BYRD CIR.
HARB
OU R V I
EW W
AY
W YATT ST.
CRIPP
LE C
REEK
LN.
OLD BU CK CREEK RD.
FISHER ST.
M ARTIN ST.
M AYFLOW ER RD.
BENTW OOD CT.
PEARL LN.
DYER ST.
KINSEY LN.
U S-70
LAKEV IEW DR.
41,400 0 1,400700
Feet
Map prepared by:East Tennessee Development District
Geographic Information SystemsAlcoa, TN
Map printed: October 10, 2013This map is not to be used for engineering purposes.
Land UseAverage Annual Daily Traffic
SOU RCE STATEM ENT: This la nd us e da ta wa s derived b y the Loc a l Pla nning As s is ta nc e Offic e b y a s s oc ia ting digita l pa rc elb ounda ries from the Tennes s ee Ba s e M a pping Progra m (BM P) with pa rc el a ttrib ute da ta m a inta ined in the Com ptroller of theTrea s ury’s Com puter As s is ted Appra is a l Sys tem (CAAS) da ta b a s e. Ea c h pa rc el wa s a s s igned to one of the la nd us e c la s s es b a s edon a ttrib utes c onta ined in thes e two da ta s ourc es or from exa m ina tion a nd a s s ignm ent b y pla nning s ta ff. Da ta Sourc es : Ba s eM a pping Progra m da ta s et, July 12, 2010; Com puter As s is ted Appra is a l Sys tem da ta b a s e, Dec em b er 6, 2010.
100.0 - 750.0750.1 - 1,500.01,500.1 - 3,000.03,000.1 - 10,000.010,000.1 - 180,000.0Loc a l s treets - AADT is not reported
Res identia lCom m erc ia lIndus tria lPub lic a nd Sem i-Pub lic U s eU tilitiesV a c a nt; Agric ultura l or Tim b er Tra c t
Tra ffic Count Sta tion Loc a tions
The Annua l Avera ge Da ily Tra ffic c ount c ount for 2012 is reported for ea c h roa dwa y a nd is b a s ed on the Tennes s ee Depa rtm entof Tra ns pora tion's Tennes s ee Roa dwa y Inform a tionM a na gem ent Sys tem Da ta b a s e (TRIM S).
KINGSTON, TENNESSEEANNUAL AVERAGE DAILY TRAFFIC AND LAND USE
ILLUSTRATION 2573

74
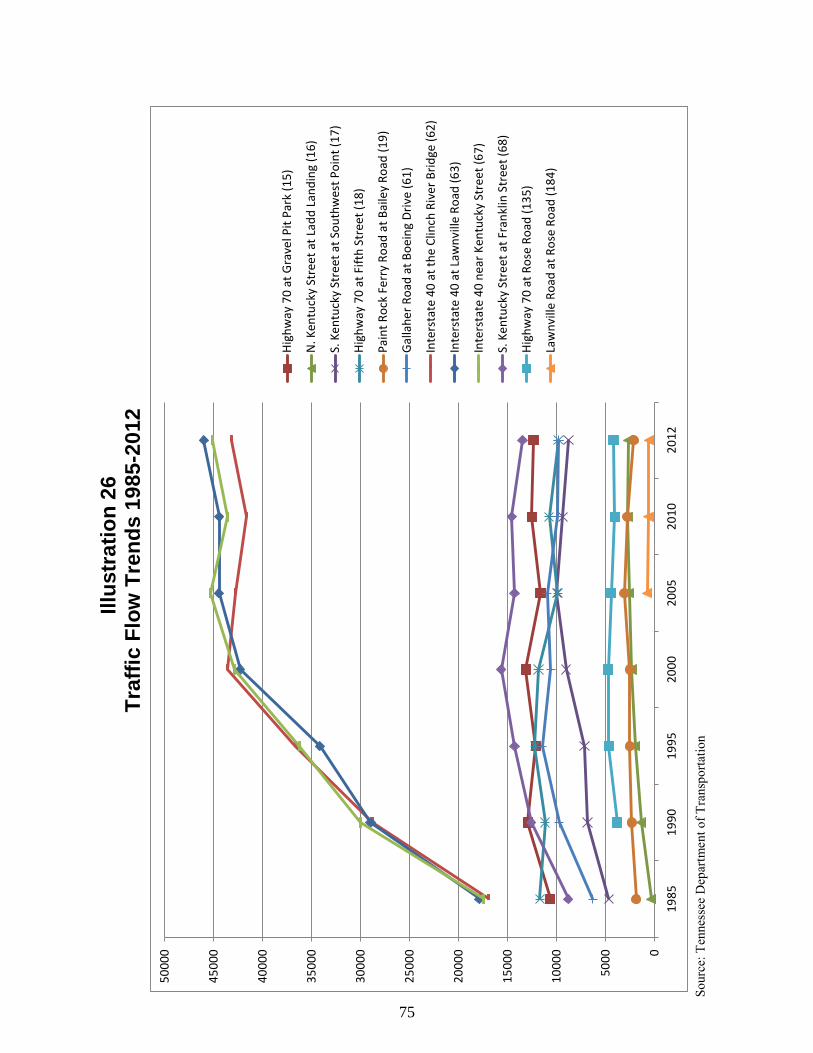
Illus
trat
ion
26
Traf
fic F
low
Tre
nds
1985
-201
2
0
50
00
10
00
0
15
00
0
20
00
0
25
00
0
30
00
0
35
00
0
40
00
0
45
00
0
50
00
0
19
85
19
90
19
95
20
00
20
05
20
10
20
12
Hig
hw
ay 7
0 a
t G
rave
l Pit
Par
k (1
5)
N. K
entu
cky
Stre
et
at L
add
Lan
din
g (1
6)
S. K
en
tuck
y St
reet
at
Sou
thw
est
Po
int
(17
)
Hig
hw
ay 7
0 a
t Fi
fth
Str
eet
(18
)
Pai
nt
Ro
ck F
err
y R
oad
at
Bai
ley
Ro
ad (
19
)
Gal
lah
er
Ro
ad a
t B
oei
ng
Dri
ve (
61
)
Inte
rsta
te 4
0 a
t th
e C
linch
Riv
er
Bri
dge
(6
2)
Inte
rsta
te 4
0 a
t La
wn
ville
Ro
ad (
63
)
Inte
rsta
te 4
0 n
ear
Ken
tuck
y St
reet
(6
7)
S. K
en
tuck
y St
reet
at
Fran
klin
Str
eet
(68
)
Hig
hw
ay 7
0 a
t R
ose
Ro
ad (
13
5)
Law
nvi
lle R
oad
at
Ro
se R
oad
(1
84
)
So
urce
: Ten
ness
ee D
epar
tmen
t of T
rans
porta
tion
75

Page intentionally left blank.
76
Traffic Generators The City of Kingston has two primary and one secondary traffic generator, which significantly influence traffic volumes and flows within the community during certain times of the day. The two primary traffic generators are the result of city’s development into a bedroom community. As discussed in chapter three, there is a large daily migration out of and into the city for employment. The residents of Kingston who leave the city to go to work make up the larger of these two factors. The workers that live outside the city but come to the city for work make up the second largest traffic generator. The secondary traffic generator is the daily local traffic that is mainly concentrated in the commercial areas of the city. Impediments to Traffic There are relatively few major impediments to traffic flow in Kingston. There are a few areas along Highway 70 that need improvements; however, the city is in the process of correcting these needs. Other traffic-related issues include drivers using side streets in an attempt to circumvent congested collector and arterial streets. The side streets are not designed to handle the increased volume. This mainly occurs on Third Street and Spring Street to Patton Ferry Road. Third Street is narrow and Spring Street to Patton Ferry Road runs next to Roane County High School and the Kingston Community Center. Both of these issues could be corrected with speed limit changes and increased enforcement or the addition of speed humps and other traffic calming devices. Spring Street in the vicinity of Roane County High School becomes congested during events at the school from cars parking on sidewalks and along the road. Pedestrian/Non-Vehicular Circulation A well-planned and constructed system of sidewalks and walking trails can provide a safe means of alternative travel, and can improve connectivity between residential and commercial centers. Kingston has a network of sidewalks which is mainly in the downtown area and along Kentucky Street. Some neighborhoods also have sidewalks. In addition to the sidewalks, the city has an extensive walking trail system that is being expanded inside the Ladd Landing Development. Air/Rail/Port The nearest airport is the Meadowlake Airport located 2.5 miles due south of Fort Southwest Point. McGhee Tyson Airport is approximately 30 miles east of Kingston. There is no direct rail access in the City of Kingston, but a spur is available across the river at the Kingston Steam Plant. The city has significant access to Watts Bar Lake, which is a navigable waterway.
Summary of Findings
The City of Kingston currently has 30 percent of its total land area dedicated to
residential uses. Kingston also has 713 acres of vacant land scattered throughout the city. All of the vacant land is limited in some way by slope, flooding, or soil constraints. Interstate 40 and Highways 58 and 70 will continue to be Kingston’s main transportation links, and commercial and industrial development should be encouraged along these routes.
Kingston’s Urban Growth Boundary currently has 59 percent of its total land area dedicated to residential uses. Vacant land and some of the larger tracks of land found within the residential category are likely to be subdivided and developed in the future, especially if annexed and supplied with sewer and water infrastructure. The urban growth boundary has 975 acres of vacant land scattered throughout the area. All of the vacant land has some limitation from slope, flooding, or soil constraints.
77

Sources: State of Tennessee. Comptroller of the Treasury. Computer Assisted Appraisal System. Web.
State of Tennessee. Tennessee Base Mapping Program. Web. State of Tennessee. Department of Transportation. Web.
<http://www.tdot.state.tn.us/>.
78
Chapter 6: The Development Plan
Introduction
Communities that choose to have a planning program are typically concerned with the growth that is occurring or will likely occur within their community. So far, this plan has presented research meant to answer the questions “where is the city” and “how did it get there?” An understanding of the answers to these questions is necessary to determine trends that have occurred and predict what is likely to occur in the future. This chapter, the development plan, begins with the current conditions and looks to the future. General guidelines will be presented that should be used as growth occurs within the planning period.
In this chapter, assumptions, factors, issues, and trends will be outlined. These items will be used to create goals for future development. These goals will illustrate the amount and type of growth the city expects. Many of these goals should result in the amendment or adoption of policies to address specific development tasks and supply evaluation criteria aimed at ensuring the goals and objectives are achieved. The ideal result of this chapter would be to create guidelines that are useable in the daily administration of land use controls (i.e., provide criteria that would assist in evaluating rezoning requests and subdivision proposals). Use of these guidelines will assist the planning commission with making consistent and objective decisions. If and when the city decides to pursue other studies such as a community facilities plan, public improvements plan, or a capital budget, the goals and objectives from this plan will likely serve as a foundation for those studies.
Major Assumptions, Factors, Issues, and Trends
The major assumptions, factors, issues, and trends that have been identified while preparing this plan are presented in this section. These items are the result of taking a broad view of the city and its history, as well as the overall trends for the area. These items will be used to formulate the goals, objectives, and policies of this plan. The major assumptions, factors, issues, and trends identified in this plan that may affect the future land use and transportation of the City of Kingston, are as follows: 1. The local government will continue to support economic and community development, and
the municipality will continue to have a strong planning program. 2. The rivers that surround the city will continue to influence development patterns. 3. Kingston is a bedroom community with ten times the number of residents leaving the city
for employment compared to those that live and work within the city. 4. Business is concentrating away from the downtown at Interstate 40 interchanges and in
Ladd Landing. 5. Population growth is expected to continue during the planning period and beyond, with the
growth rate averaging approximately 7.5 percent per decade through 2040. 6. The highest percent of the population is over 65. This segment is also growing faster than
any other segment.
79
7. Migration within the county and annexation are the most likely sources for population growth.
8. Vacant residential property could likely accommodate anticipated growth beyond 2020. 9. The commuting pattern with most of the city’s workers leaving the city for work and most
of the city’s jobs being filled by those who live outside the city could indicate a lack of higher paying jobs or lower cost housing.
10. Residents have a higher than average income. 11. Natural factors will limit some future development (i.e. slope and soils). 12. A large percentage of the city’s land is developed (86.25 percent).
13. Residential development is the largest land usecategory.
14. Residential land in the urban growth boundary is developed at a very low density.
Infrastructure extension could allow the land to be developed at a higher density.
Development Goals
Development goals are necessary for a planning program to properly manage future land use. These goals are generalized statements of the city’s objectives for land development, transportation, and service delivery. A major goal of this plan is to guide the city in providing a high quality living and working environment for its residents.
The planning commission has developed the following statements, which they believe reflect the desire of the city’s citizens regarding future development. 1. Maintain a high quality of life for its residents. 2. Strive to achieve and maintain high standards in development practices. 3. Promote a balance of development in residential, commercial, and industrial sectors. 4. Use land use controls to provide for a mix of goods and service suppliers in locations that
will be convenient for the city’s residents as well as those who live outside the city. 5. Encourage the expansion of the city’s commercial, industrial, and manufacturing sectors. 6. Encourage developments that include a mix of housing types. 7. Provide public facilities that are adequate to meet the current and future needs of the
city’s residents. 8. Expand and maintain city-owned infrastructure as necessary (i.e., water, sewer, and
roads). 9. Continue to embrace the area’s rich history.
80

Objectives and Development Policies
To achieve the goals set forth in this plan, both objectives and policies will be presented. Simply put, the goals and objectives are where the city wants to go and the policies outline how to get there.
The city should use this document as a tool during the decision making process anytime the matter involves either land use or transportation issues. For these policies to be successfully implemented, developers, builders, neighborhood groups, civic organizations, and individual citizens should be familiar with them and follow them when applicable. The city should enforce these policies consistently to create an element of predictability about future land use decisions. The following section will present objectives and policies that pertain to overall development in the city as well as managing the growth that will likely occur. After these general policies are stated, objectives and policies will be identified for each of the specific land use categories.
General Development and Growth Management
The City of Kingston is expected to continue growing in the future. This is substantiated by the population projections presented earlier in this document (estimated net growth of 1,435 people by 2040). Growth as a long-term trend is typical of most municipalities, and is often encouraged because of the resulting expansion of the tax base. Growth typically adds to the tax base in three ways. First, it increases the value of the housing stock that leads to higher property tax revenue. Next, it increases the amount of money the city receives from the state shared revenue program that is paid on a per person basis. Finally, it increases the likelihood of new commercial operations because the increased population can better support businesses and will result in a rise in sales tax receipts. This growth, however, has the propensity to overwhelm city services, as the various departments must also grow to accommodate the increase in population and the subsequent increase in demand for their respective services.
Kingston’s city officials are aware of the projected growth of the city and are ready to guide that growth into suitable areas in order to maintain a high quality of development. This will be achieved through enforcement of the city’s regulations and codes. By keeping the quality of development high, the city is maintaining and improving the quality of life for its residents. Failure to appropriately direct development to suitable areas or the adoption of a “growth at any cost” mentality, will likely cause long-term detrimental impacts to the city, the natural environment, and the quality of life of residents. The city will need to update and amend land use controls to appropriately guide and manage the growth that is expected.
81
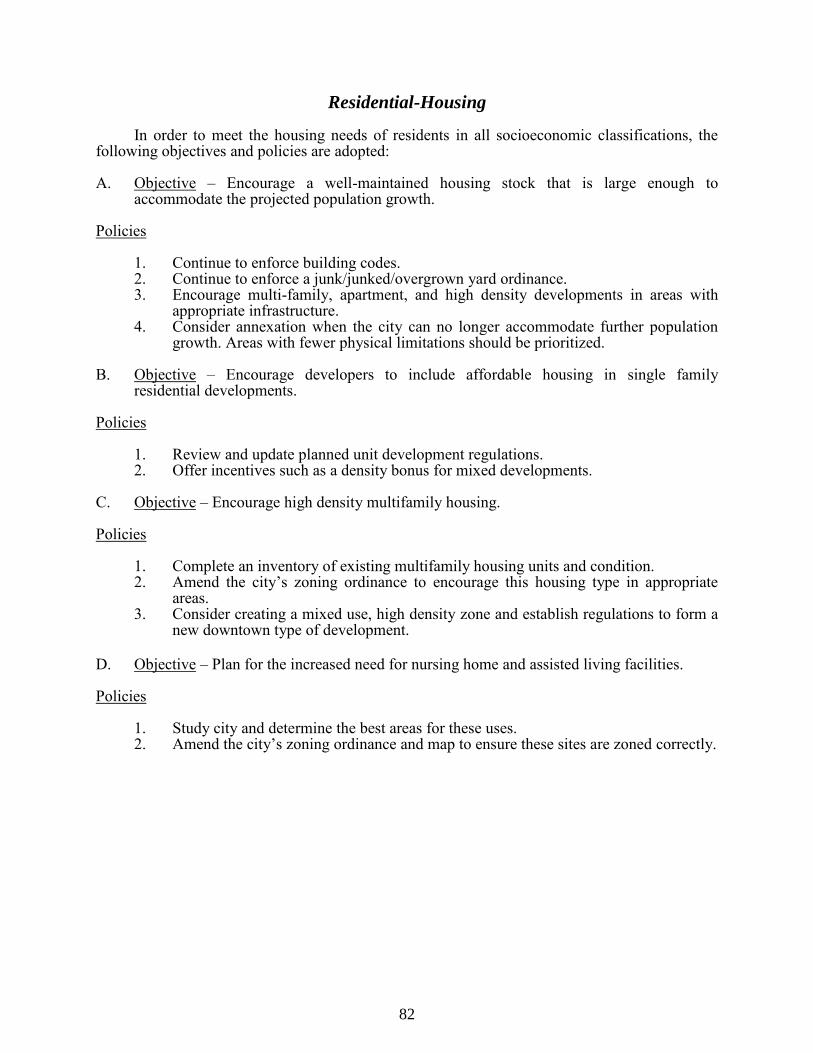
Residential-Housing
In order to meet the housing needs of residents in all socioeconomic classifications, the following objectives and policies are adopted: A. Objective – Encourage a well-maintained housing stock that is large enough to
accommodate the projected population growth. Policies
1. Continue to enforce building codes. 2. Continue to enforce a junk/junked/overgrown yard ordinance. 3. Encourage multi-family, apartment, and high density developments in areas with
appropriate infrastructure. 4. Consider annexation when the city can no longer accommodate further population
growth. Areas with fewer physical limitations should be prioritized. B. Objective – Encourage developers to include affordable housing in single family
residential developments. Policies
1. Review and update planned unit development regulations. 2. Offer incentives such as a density bonus for mixed developments.
C. Objective – Encourage high density multifamily housing. Policies
1. Complete an inventory of existing multifamily housing units and condition. 2. Amend the city’s zoning ordinance to encourage this housing type in appropriate
areas. 3. Consider creating a mixed use, high density zone and establish regulations to form a
new downtown type of development. D. Objective – Plan for the increased need for nursing home and assisted living facilities. Policies
1. Study city and determine the best areas for these uses. 2. Amend the city’s zoning ordinance and map to ensure these sites are zoned correctly.
82

Residential-Population Growth
In order to adequately prepare for the projected population growth, the following objectives and policies are adopted: A. Objective – Balance the ratio of youth to those over 65 years old. Policies
1. Encourage job creation in categories that cater to teens and young adults. 2. Develop partnership between the city, school board, and local chamber of commerce. 3. Encourage lower cost housing in appropriate areas. 4. Consider creating an area that will develop into a downtown-style development.
B. Objective – Examine impact of growth in the over 65-years-old population segment. Policies
1. Develop a relationship with the Retire Tennessee Division of state government. 2. Properly zone and site elder care facilities. 3. Develop marketing campaign to attract retirees to the area.
C. Objective – Increase tax revenue from people currently living outside of the corporate
limits. Policies
1. Encourage affordable and multifamily housing developments. 2. Support job growth in retail, manufacturing, and hospitality industries. 3. Recruit large retail businesses that will attract shoppers from outside of the city.
83
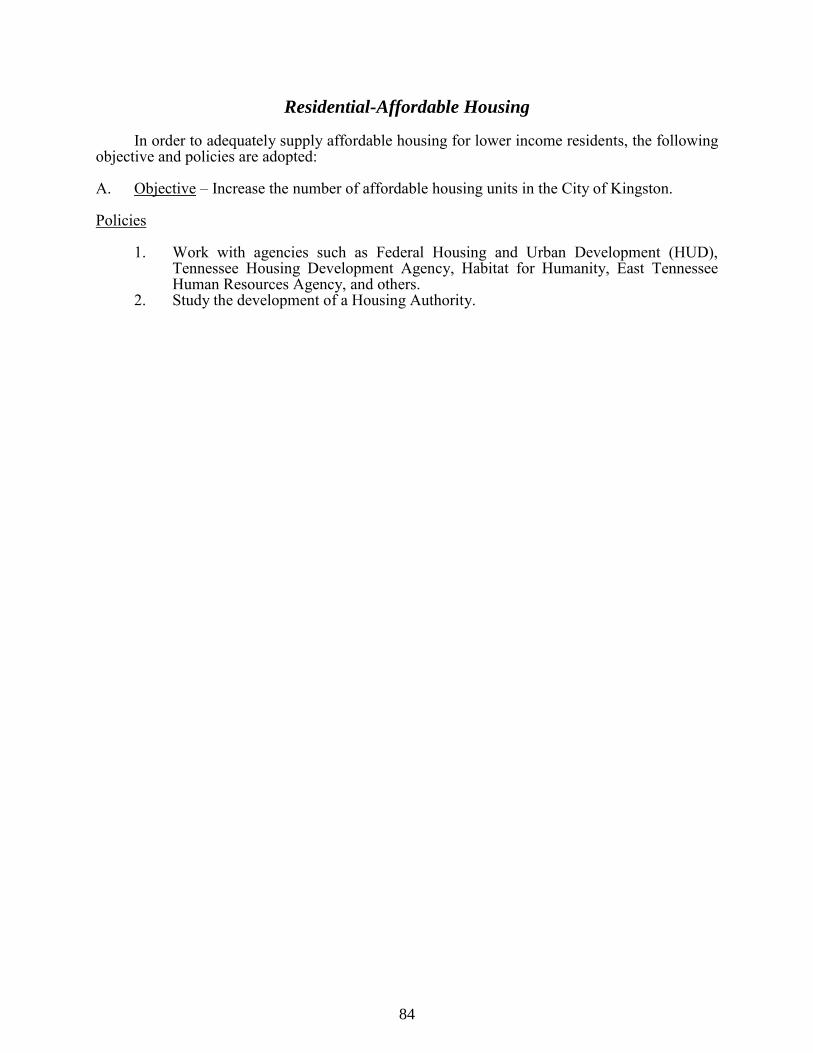
Residential-Affordable Housing
In order to adequately supply affordable housing for lower income residents, the following objective and policies are adopted: A. Objective – Increase the number of affordable housing units in the City of Kingston. Policies
1. Work with agencies such as Federal Housing and Urban Development (HUD), Tennessee Housing Development Agency, Habitat for Humanity, East Tennessee Human Resources Agency, and others.
2. Study the development of a Housing Authority.
84

Residential-Historic Preservation
In order to preserve the historic homes in the city, the following objectives and policies are adopted: A. Objective – Preserve and promote the historic homes in the City of Kingston. Policies
1. Complete an inventory of historic houses including detailed pictures. 2. Work with East Tennessee Development District’s historic preservation planner to
determine interest in having homes listed on the National Register of Historic Places. 3. Determine interest in starting historic home tours around the holidays.
85

Commercial
Commercial development within a city plays several important roles: it adds to the tax base, it supplies jobs, it allows residents to obtain the goods and services that they need, and it attracts nonresidents to the city. The city should try to attract commercial development but ensure the development is built at the appropriate time and in the most suitable locations. To accomplish these goals, the following objectives and policies are adopted: A. Objective – Ensure commercial development is attractive and complies with local, state,
and federal regulations.
Policies 1. Continue to enforce building codes. 2. Continue to enforce the sign ordinance. 3. Encourage businesses to group around central parking areas. 4. Consider creating a design review commission and adopting regulations.
B. Objective – Direct new commercial development to appropriate areas. Policies
1. Expand commercial areas along Kentucky Street. 2. Ensure infrastructure is adequate for large commercial developments along
Lawnville Road and Gallaher Road. C. Objective – Site large commercial centers to attract shoppers from outside of the city. Policies
1. Study population centers that are outside of the city. 2. Study commuting patterns of county residents that come to Kingston to work.
D. Objective – Consider creating a traditional downtown or central business district along
Kentucky Street and/or around Ladd Landing. Policies
1. Amend zoning creating a new zone. 2. Develop prescriptive standards for the new zone. 3. Establish a design review commission and adopt regulations. 4. Develop a plan for parking and pedestrian oriented development. 5. Require multistory live/work units as the predominant use in the zone.
86

Industrial
To strengthen and encourage growth in the manufacturing sector of the local economy, the
following objectives and policies are adopted: A. Objective – Encourage industrial uses to locate primarily on Gallaher Road and
secondarily on Lawnville Road. Policies
1. Examine zoning and amend as necessary. 2. Use the East Tennessee Development District/Tennessee Department of
Environment and Conservation industrial site checklist to evaluate potential sites. 3. Market Industrial sites based on their suitability.
B. Objective – Encourage growth of existing industry and attract new industries. Policies
1. Develop a partnership with the local chamber of commerce, industrial board, city, and school system.
2. Assist with marketing sites and recruiting industry to the city. C. Objective – Establish and maintain detailed inventory of available industrial sites. Policies
1. Use the East Tennessee Development District/Tennessee Department of Environment and Conservation industrial site checklist to evaluate potential sites.
2. Partner with the Tennessee Department of Environment and Conservation, the East Tennessee Development District, and the Tennessee Department of Economic and Community Development for further evaluation of available industrial sites.
87

Public and Semi-Public
Public and semi-public uses play a significant role in improving the aesthetics and quality of life of a community by supplying large open spaces that visually break up areas of development. Public uses such as parks, recreational areas, and government lands give the community’s residents opportunities for recreation and should be located near residential areas, but should not cause conflict with the surrounding land uses. The following objectives and policies should be used as guidelines for future public and semi-public uses and are hereby adopted: A. Objective – Parks and government owned property should dominate the city’s waterfront. Policies
1. Maintain ownership of current public waterfront property. 2. Oppose any future attempts to develop Tennessee Valley Authority property. 3. Acquire additional waterfront property when possible.
B. Objective – Ensure parks, schools, libraries, and other public uses are located near property centers.
Policies
1. Study the population density of areas before making zoning changes. 2. Partner with Roane County for locations of future schools.
C. Objective – Maintain and/or expand the current level of public amenities. Policies
1. Expand public uses to match population growth. 2. Work with developers to create recreation or pocket parks in new developments. 3. Amend zoning to require recreation and open space in developments.
D. Objective – Maintain the open feel of the city. Policies
1. Place new parks in areas to disrupt dense areas of development. 2. Amend landscaping and buffering requirements.
E. Objective – Preserve and further develop Fort Southwest Point. Policies
1. Ensure proper funding to meet park needs. 2. Partner with the Roane County School Board to include educational opportunities
using the fort in the curriculum. 3. Market the Fort for events and hold historic demonstrations.
88

F. Objective – Attract visitors and new residents. Policies
1. Market local recreation opportunities. 2. Partner with the chamber of commerce and tourism boards. 3. Recruit and attract large recreation events. 4. Continue to develop and market walking trail system.
89
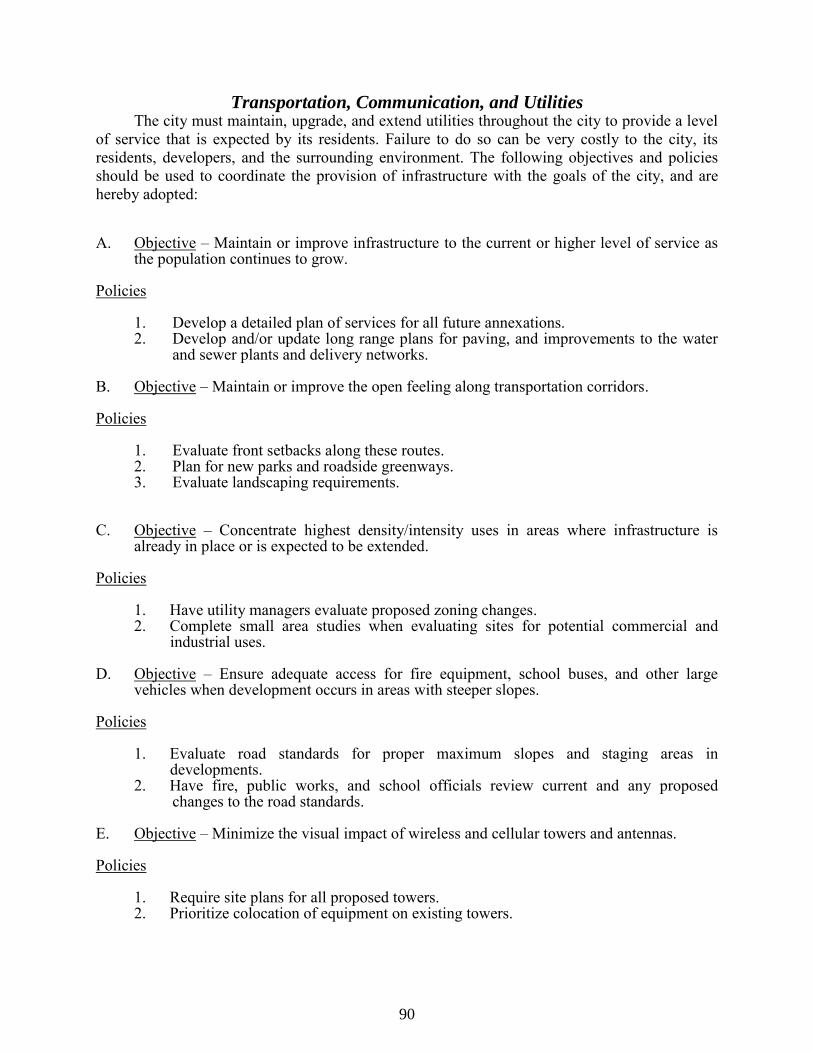
Transportation, Communication, and Utilities The city must maintain, upgrade, and extend utilities throughout the city to provide a level
of service that is expected by its residents. Failure to do so can be very costly to the city, its residents, developers, and the surrounding environment. The following objectives and policies should be used to coordinate the provision of infrastructure with the goals of the city, and are hereby adopted: A. Objective – Maintain or improve infrastructure to the current or higher level of service as
the population continues to grow. Policies
1. Develop a detailed plan of services for all future annexations. 2. Develop and/or update long range plans for paving, and improvements to the water
and sewer plants and delivery networks. B. Objective – Maintain or improve the open feeling along transportation corridors. Policies
1. Evaluate front setbacks along these routes. 2. Plan for new parks and roadside greenways. 3. Evaluate landscaping requirements.
C. Objective – Concentrate highest density/intensity uses in areas where infrastructure is
already in place or is expected to be extended. Policies
1. Have utility managers evaluate proposed zoning changes. 2. Complete small area studies when evaluating sites for potential commercial and
industrial uses.
D. Objective – Ensure adequate access for fire equipment, school buses, and other large vehicles when development occurs in areas with steeper slopes.
Policies
1. Evaluate road standards for proper maximum slopes and staging areas in developments.
2. Have fire, public works, and school officials review current and any proposed changes to the road standards.
E. Objective – Minimize the visual impact of wireless and cellular towers and antennas. Policies
1. Require site plans for all proposed towers. 2. Prioritize colocation of equipment on existing towers.
90
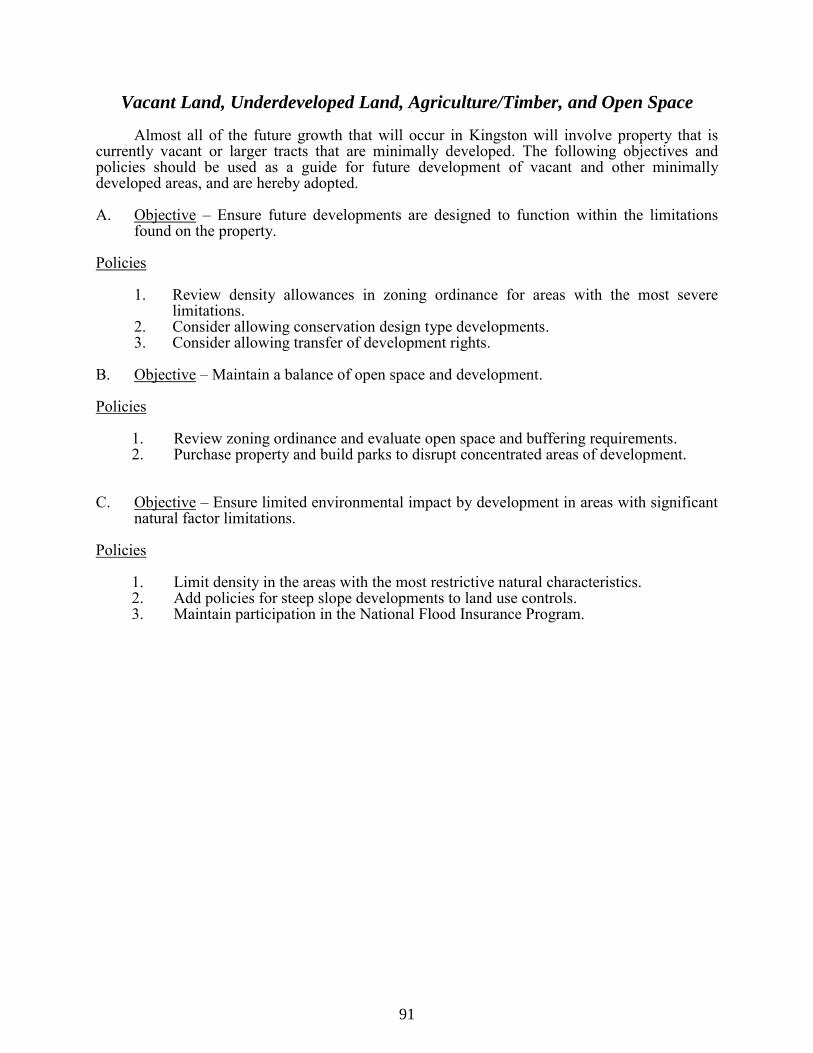
Vacant Land, Underdeveloped Land, Agriculture/Timber, and Open Space
Almost all of the future growth that will occur in Kingston will involve property that is currently vacant or larger tracts that are minimally developed. The following objectives and policies should be used as a guide for future development of vacant and other minimally developed areas, and are hereby adopted. A. Objective – Ensure future developments are designed to function within the limitations
found on the property. Policies
1. Review density allowances in zoning ordinance for areas with the most severe limitations.
2. Consider allowing conservation design type developments. 3. Consider allowing transfer of development rights.
B. Objective – Maintain a balance of open space and development. Policies
1. Review zoning ordinance and evaluate open space and buffering requirements. 2. Purchase property and build parks to disrupt concentrated areas of development.
C. Objective – Ensure limited environmental impact by development in areas with significant
natural factor limitations. Policies 1. Limit density in the areas with the most restrictive natural characteristics. 2. Add policies for steep slope developments to land use controls. 3. Maintain participation in the National Flood Insurance Program.
91

Page intentionally left blank.
92
Chapter 7: Plan Implementation
Introduction
This chapter will offer an introduction to the various methods the city will need to use to accomplish the objectives and policies set forth in the previous chapter. The City of Kingston currently has several of these items in place. Looking at each of these items and their effectiveness should generate meaningful discussion about what works in its current form and what needs to be reevaluated. Some of the items listed below are not currently used by the city. These items should be considered as city resources allow.
Methods for Implementation
Below, seven methods of plan implementation are identified. Kingston should utilize these items in the execution of this plan. Mandatory Referral Section 13-4-104 of the Tennessee Code Annotated states that when a planning commission adopts a general plan, or any part thereof, all future streets, parks, public ways, ground, place, or space, public buildings or structures, and utilities must be approved by the planning commission before construction commences. Local Government Actions For the purpose of this plan, these actions include activities that are not set aside by the Tennessee Code Annotated for the planning commission or the board of zoning appeals. These activities include changing the municipal code, budgeting and authorizing funds, installation and maintenance of public infrastructure, and official communication with state and federal agencies. Planning Commission Actions For the purpose of this plan, these actions include all of the responsibilities that the Tennessee
Code Annotated delegates to the planning commission and board of zoning appeals. For example, adoption, amendment, and administration of land use controls, preparation and adoption of a general plan, and completing a plan of services for proposed annexations. Zoning The city’s zoning ordinance is a very effective tool used to regulate the location, height, bulk, and size of buildings and other structures, the percentage of the lot that may be occupied, the sizes of yards, courts and other open spaces, and the density of population. A thorough review of the city’s zoning ordinance and map, while using this plan as a guide, can lead to the implementation of many of the objectives of this plan. Subdivision Regulations Subdivision regulations are the other major land use control the city uses to regulate the development of land within the city and its planning region. The process of dividing land,
93

installing infrastructure, and building structures in the development is how development patterns are shaped over time. Subdivision regulations require developers to meet a set of standards in each of these stages of development. This is why subdivision regulations, along with a zoning ordinance, are a good way to implement the policies and objectives of this plan. Building and Other Codes The adoption of building and other codes (electrical, fire, plumbing, energy efficiency, etc.) allow the city to ensure the safety of newly constructed and substantially renovated buildings. These codes provide a minimum standard for the area that they cover. Over time, and with proper enforcement, they increase and stabilize property values. Public Improvements Program and Capital Budget These two programs are used to inventory the publicly owned facilities and infrastructure and budget for maintenance, extension, and expansion of these facilities. These programs can be used to shape development by allocating funds to areas in which development is the most suitable first and withholding funds to the areas that should not be developed immediately. Development is more likely to follow the extension of infrastructure than it is to occur in areas with insufficient or no infrastructure.
Implementation Schedule
This Land Use and Transportation Plan is an advisory document intended to serve as a
guide for the development within the municipality over the next ten years and beyond. Modifications and amendments to the implementation tools listed above will be necessary if the goals and objectives of this plan are to be achieved. Work programs should be reviewed and evaluated with plan implementation objectives in mind as a part of the city’s budgeting process. The following series of tables (collectively Table 27) will present the policies outlined in Chapter 6 with guidance as to the likely timeframe, implementation method, and any comments. The proposed timeframe will use designations: short term, mid-term, long term, and ongoing. Short-term activities should be well underway or completed in the first five years of this plan. Mid-term activities should begin in years five through ten of this plan. Long-term activities should typically occur late in the planning period covered by this plan or even after this period. Ongoing activities should start as soon as possible and continue indefinitely (these typically represent changes in operations or policies).
94

Res
iden
tial-H
ousi
ng
Obj
ectiv
eTi
mef
ram
ePo
licy
Impl
emen
tatio
n M
etho
dC
omm
ents
Enco
urag
e a
wel
l-mai
ntai
ned
hous
ing
stoc
k th
at is
larg
e en
ough
to a
ccom
mod
ate
the
proj
ecte
d po
pula
tion
grow
th.
Ongo
ingC
ontin
ue to
enf
orce
bui
ldin
g co
des.
Loca
l Gov
ernme
nt Ac
tion
Con
tinue
to e
nfor
ce a
junk
/junk
ed/o
verg
row
n ya
rd o
rdin
ance
.Lo
cal G
overn
ment
Actio
n
Enco
urag
em
ulti-
fam
ily,a
partm
ent,
and
high
dens
ityde
velo
pmen
tsin
are
as w
ith a
ppro
pria
te in
fras
truct
ure.
Zonin
g
Con
side
ran
nexa
tion
whe
nth
eci
tyca
nno
long
erac
com
mod
ate
furth
erpo
pula
tion
grow
th.
Are
asw
ithfe
wer
phys
ical
limita
tions
shou
ld b
e pr
iorit
ized
.
Plann
ing C
ommi
ssion
and
Loca
l Gov
ernme
nt Ac
tion
The a
bility
to do
this
could
be af
fected
by
future
legis
lation
Enco
urag
e de
velo
pers
to in
clud
e af
ford
able
ho
usin
g in
sing
le fa
mily
resi
dent
ial
deve
lopm
ents
.Mi
d-Term
Rev
iew
and
upd
ate
plan
ned
unit
deve
lopm
ent r
egul
atio
ns.
Zonin
g
Off
er in
cent
ives
such
as a
den
sity
bon
us fo
r mix
ed d
evel
opm
ents
.Zo
ning a
nd Lo
cal G
overn
ment
Actio
n
Enco
urag
e hi
gh d
ensi
ty m
ultif
amily
hou
sing
Mid-T
ermC
ompl
ete
anin
vent
ory
ofex
istin
gm
ultif
amily
hous
ing
units
and
cond
ition
.Lo
cal G
overn
ment
and/o
r Pla
nning
Com
miss
ion Ac
tion
Am
end
the
city
’szo
ning
ordi
nanc
eto
enco
urag
eth
isho
usin
gty
pein
app
ropr
iate
are
as.
Zonin
g
Con
side
r cre
atin
g a
mix
ed u
se, h
igh
dens
ity z
one
and
esta
blis
h re
gula
tions
to fo
rm a
new
dow
ntow
n ty
pe o
f dev
elop
men
t.
Zonin
g, Su
bdivis
ion
Regu
lation
s, an
d Plan
ning
Comm
ission
Actio
n
Plan
for t
he in
crea
sed
need
for n
ursi
ng
hom
e an
d as
sist
ed li
ving
faci
litie
s.Mi
d-Term
Stud
y ci
ty a
nd d
eter
min
e th
e be
st a
reas
for t
hese
use
s.Lo
cal G
overn
ment
and/o
r Pla
nning
Com
miss
ion Ac
tion
Am
end
the
city
’szo
ning
ordi
nanc
ean
dm
apto
ensu
reth
ese
site
sar
e zo
ned
corr
ectly
.Zo
ning
Tabl
e 27
: Im
plem
enta
tion
Sche
dule
95
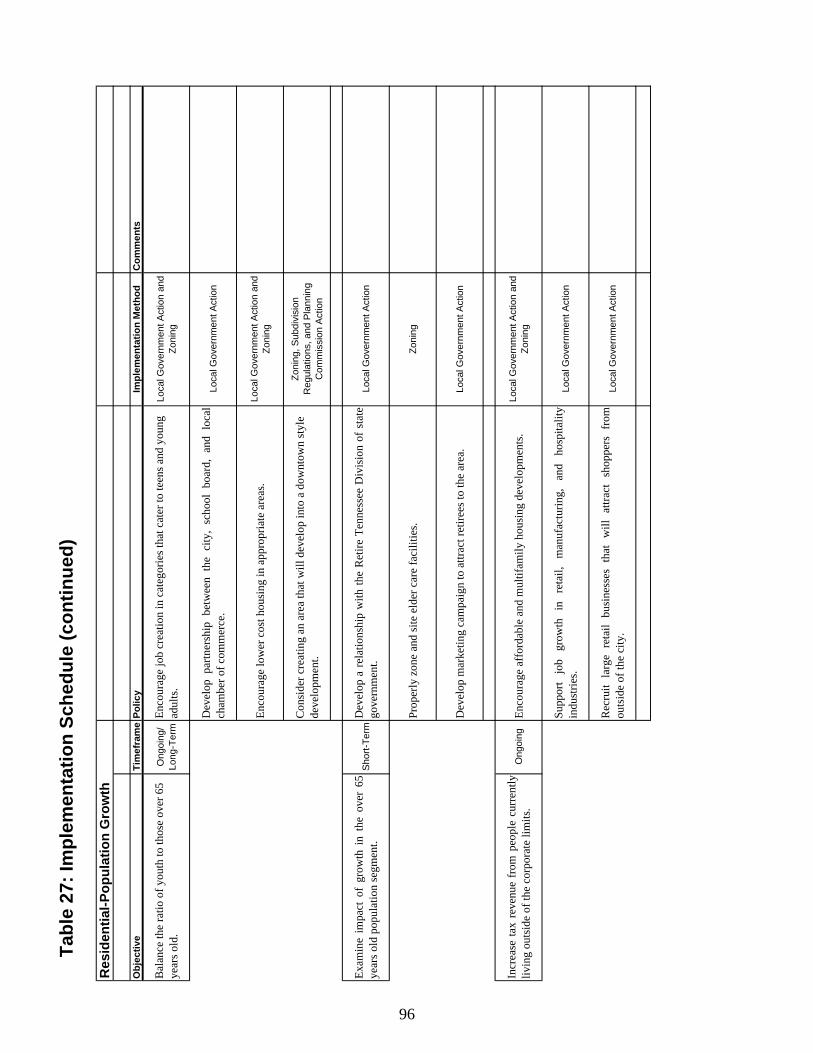
Obj
ectiv
eTi
mef
ram
ePo
licy
Impl
emen
tatio
n M
etho
dC
omm
ents
Bal
ance
the
ratio
of y
outh
to th
ose
over
65
year
s old
.On
going
/ Lo
ng-Te
rmEn
cour
age
job
crea
tion
in c
ateg
orie
s tha
t cat
er to
teen
s and
you
ng
adul
ts.
Loca
l Gov
ernme
nt Ac
tion a
nd
Zonin
g
Dev
elop
partn
ersh
ipbe
twee
nth
eci
ty,
scho
olbo
ard,
and
loca
lch
ambe
r of c
omm
erce
.Lo
cal G
overn
ment
Actio
n
Enco
urag
e lo
wer
cos
t hou
sing
in a
ppro
pria
te a
reas
. Lo
cal G
overn
ment
Actio
n and
Zo
ning
Con
side
r cre
atin
g an
are
a th
at w
ill d
evel
op in
to a
dow
ntow
n st
yle
deve
lopm
ent.
Zonin
g, Su
bdivis
ion
Regu
lation
s, an
d Plan
ning
Comm
ission
Actio
n
Exam
ine
impa
ctof
grow
thin
the
over
65ye
ars o
ld p
opul
atio
n se
gmen
t.Sh
ort-Te
rmD
evel
opa
rela
tions
hip
with
the
Ret
ireTe
nnes
see
Div
isio
nof
stat
ego
vern
men
t.Lo
cal G
overn
ment
Actio
n
Prop
erly
zon
e an
d si
te e
lder
car
e fa
cilit
ies.
Zonin
g
Dev
elop
mar
ketin
g ca
mpa
ign
to a
ttrac
t ret
irees
to th
e ar
ea.
Loca
l Gov
ernme
nt Ac
tion
Incr
ease
tax
reve
nue
from
peop
lecu
rren
tlyliv
ing
outs
ide
of th
e co
rpor
ate
limits
.On
going
Enco
urag
e af
ford
able
and
mul
tifam
ily h
ousi
ng d
evel
opm
ents
.Lo
cal G
overn
ment
Actio
n and
Zo
ning
Supp
ort
job
grow
thin
reta
il,m
anuf
actu
ring,
and
hosp
italit
yin
dust
ries.
Loca
l Gov
ernme
nt Ac
tion
Rec
ruit
larg
ere
tail
busi
ness
esth
atw
illat
tract
shop
pers
from
outs
ide
of th
e ci
ty.
Loca
l Gov
ernme
nt Ac
tion
Res
iden
tial-P
opul
atio
n G
row
th
Tabl
e 27
: Im
plem
enta
tion
Sche
dule
(con
tinue
d)
96

Obj
ectiv
eTi
mef
ram
ePo
licy
Impl
emen
tatio
n M
etho
dC
omm
ents
Incr
ease
the
num
ber o
f aff
orda
ble
hous
ing
units
in th
e C
ity o
f Kin
gsto
n.Lo
ng-Te
rm
Stud
y th
e de
velo
pmen
t of a
Hou
sing
Aut
horit
y.
Loca
l Gov
ernme
nt Ac
tion
Res
iden
tial-A
fford
able
Hou
sing
Wor
kw
ithag
enci
essu
chas
Fede
ral
Hou
sing
and
Urb
anD
evel
opm
ent
(HU
D),
Tenn
esse
eH
ousi
ngD
evel
opm
ent
Age
ncy,
Hab
itatf
orH
uman
ity,E
astT
enne
ssee
Hum
anR
esou
rces
Age
ncy,
and
othe
rs.
Loca
l Gov
ernme
nt Ac
tion
Tabl
e 27
: Im
plem
enta
tion
Sche
dule
(con
tinue
d)
97

Obj
ectiv
eTi
mef
ram
ePo
licy
Impl
emen
tatio
n M
etho
dC
omm
ents
Pres
erve
and
pro
mot
e th
e hi
stor
ic h
omes
in
the
City
of K
ings
ton.
Long
-Term
Com
plet
e an
inve
ntor
y of
his
toric
hou
ses i
nclu
ding
det
aile
d pi
ctur
es.
Loca
l Gov
ernme
nt Ac
tion
Coun
ty his
torian
may
have
this
data.
Wor
k w
ith E
ast T
enne
ssee
Dev
elop
men
t Dis
trict
’s h
isto
ric
pres
erva
tion
plan
ner t
o de
term
ine
inte
rest
in h
avin
g ho
mes
list
ed o
nth
e N
atio
nal R
egis
ter o
f His
toric
Pla
ces.
Loca
l Gov
ernme
nt Ac
tion
Det
erm
ine
inte
rest
in st
artin
g hi
stor
ic h
ome
tour
s aro
und
the
holid
ayLo
cal G
overn
ment
Actio
n
Res
iden
tial-H
isto
ric P
rese
rvat
ion
Tabl
e 27
: Im
plem
enta
tion
Sche
dule
(con
tinue
d)
98

Com
mer
cial
Obj
ectiv
eTi
mef
ram
ePo
licy
Impl
emen
tatio
n M
etho
dC
omm
ents
Ensu
reco
mm
erci
alde
velo
pmen
tis
attra
ctiv
ean
dco
mpl
ies
with
loca
l,st
ate,
and
fede
ral r
egul
atio
ns.
Ongo
ingC
ontin
ue to
enf
orce
bui
ldin
g co
des.
Loca
l Gov
ernme
nt Ac
tion
Con
tinue
to e
nfor
ce th
e si
gn o
rdin
ance
.Lo
cal G
overn
ment
Actio
n
Enco
urag
e bu
sine
sses
to g
roup
aro
und
cent
ral p
arki
ng a
reas
.Lo
cal G
overn
ment
Actio
n and
Zo
ning
Con
side
rcr
eatin
ga
desi
gnre
view
com
mis
sion
and
adop
ting
regu
latio
ns.
Loca
l Gov
ernme
nt Ac
tion
This
appli
es to
mult
i-fami
ly an
d bus
iness
de
velop
ments
only.
Dire
ctne
wco
mm
erci
alde
velo
pmen
tto
appr
opria
te a
reas
.On
going
Expa
nd c
omm
erci
al a
reas
alo
ng K
entu
cky
Stre
et.
Zonin
g
Ensu
rein
fras
truct
ure
isad
equa
tefo
rla
rge
com
mer
cial
deve
lopm
ents
alo
ng L
awnv
ille
Roa
d an
d G
alla
her R
oad.
Loca
l Gov
ernme
nt Ac
tion
Site
larg
e co
mm
erci
al c
ente
rs to
attr
act
shop
pers
from
out
side
of t
he c
ity.
Ongo
ingSt
udy
popu
latio
n ce
nter
s tha
t are
out
side
of t
he c
ity.
Plann
ing C
ommi
ssion
Actio
n
Stud
y co
mm
utin
g pa
ttern
s of c
ount
y re
side
nts t
hat c
ome
to
Kin
gsto
n to
wor
k.Pla
nning
Com
miss
ion Ac
tion
Con
side
r cre
atin
g a
tradi
tiona
l dow
ntow
n or
cen
tral b
usin
ess d
istri
ct a
long
Ken
tuck
y St
reet
and
/or a
roun
d La
dd L
andi
ng.
Long
-Term
Am
end
zoni
ng c
reat
ing
a ne
w z
one.
Plann
ing C
ommi
ssion
Actio
n
Dev
elop
pre
scrip
tive
stan
dard
s for
the
new
zon
e.Pla
nning
Com
miss
ion Ac
tion
Esta
blis
h a
desi
gn re
view
com
mis
sion
and
ado
pt re
gula
tions
.Lo
cal G
overn
ment
Actio
n
Dev
elop
a p
lan
for p
arki
ng a
nd p
edes
trian
orie
nted
dev
elop
men
t.Pla
nning
Com
miss
ion Ac
tion
Req
uire
mul
tisto
ry li
ve/w
ork
units
as t
he p
redo
min
ant u
se in
the
zon
Zonin
g
Tabl
e 27
: Im
plem
enta
tion
Sche
dule
(con
tinue
d)
99

Indu
stria
l
Obj
ectiv
eTi
mef
ram
ePo
licy
Impl
emen
tatio
n M
etho
dC
omm
ents
Enco
urag
e in
dust
rial u
ses t
o lo
cate
pr
imar
ily o
n G
alla
her R
oad
and
seco
ndar
ily o
n La
wnv
ille
Roa
d.On
going
Exam
ine
zoni
ng a
nd a
men
d as
nec
essa
ry.
Plann
ing C
ommi
ssion
Actio
n
Use
the
East
Tenn
esse
eD
evel
opm
ent
Dis
trict
/Ten
ness
eeD
epar
tmen
tof
Envi
ronm
ent
and
Con
serv
atio
nin
dust
rial
site
chec
klis
t to
eval
uate
pot
entia
l site
s.Pla
nning
Com
miss
ion Ac
tion
Mar
ket I
ndus
trial
site
s bas
ed o
n th
eir s
uita
bilit
y.Lo
cal G
overn
ment
Actio
n
Enco
urag
egr
owth
ofex
istin
gin
dust
ryan
dat
tract
new
indu
strie
s.On
going
Dev
elop
apa
rtner
ship
with
the
loca
lch
ambe
rof
com
mer
ce,
indu
stria
l boa
rd, c
ity, a
nd sc
hool
syst
em.
Loca
l Gov
ernme
nt Ac
tion
Ass
ist w
ith m
arke
ting
site
s and
recr
uitin
g in
dust
ry to
the
city
.Lo
cal G
overn
ment
Actio
n
Esta
blis
h an
d m
aint
ain
deta
iled
inve
ntor
y of
ava
ilabl
e in
dust
rial s
ites.
Mid-t
ermU
seth
eEa
stTe
nnes
see
Dev
elop
men
tD
istri
ct/T
enne
ssee
Dep
artm
ent
ofEn
viro
nmen
tan
dC
onse
rvat
ion
indu
stria
lsi
tech
eckl
ist t
o ev
alua
te p
oten
tial s
ites.
Plann
ing C
ommi
ssion
Actio
n
Partn
er w
ith th
e Te
nnes
see
Dep
artm
ent o
f Env
ironm
ent a
nd
Con
serv
atio
n, th
e Ea
st T
enne
ssee
Dev
elop
men
t Dis
trict
, and
the
Tenn
esse
e D
epar
tmen
t of E
cono
mic
and
Com
mun
ity D
evel
opm
ent
for f
urth
er e
valu
atio
n of
ava
ilabl
e in
dust
rial s
ites.
Loca
l Gov
ernme
nt Ac
tion
Tabl
e 27
: Im
plem
enta
tion
Sche
dule
(con
tinue
d)
100

Publ
ic a
nd S
emi-P
ublic
Obj
ectiv
eTi
mef
ram
ePo
licy
Impl
emen
tatio
n M
etho
dC
omm
ents
Park
san
dgo
vern
men
tow
ned
prop
erty
shou
ld d
omin
ate
the
city
’s w
ater
fron
t.On
going
Mai
ntai
n ow
ners
hip
of c
urre
nt p
ublic
wat
erfr
ont p
rope
rty.
Loca
l Gov
ernme
nt Ac
tion
Opp
ose
any
futu
reat
tem
ptst
ode
velo
pTe
nnes
see
Val
ley
Aut
horit
ypr
oper
ty.
Plann
ing C
ommi
ssion
and
Loca
l Gov
ernme
nt Ac
tion
Acq
uire
add
ition
al w
ater
fron
t pro
perty
whe
n po
ssib
le.
Loca
l Gov
ernme
nt Ac
tion
Ensu
repa
rks,
scho
ols,
libra
ries,
and
othe
rpu
blic
uses
are
loca
ted
near
prop
erty
cent
ers.
Ongo
ingSt
udy
the
popu
latio
n de
nsity
of a
reas
bef
ore
mak
ing
zoni
ng
chan
ges.
Plann
ing C
ommi
ssion
Actio
n
Partn
er w
ith R
oane
Cou
nty
for l
ocat
ions
of f
utur
e sc
hool
s.Lo
cal G
overn
ment
Actio
n
Mai
ntai
nan
d/or
expa
ndth
ecu
rren
tlev
elof
publ
ic a
men
ities
.On
going
Expa
nd p
ublic
use
s to
mat
ch p
opul
atio
n gr
owth
.Lo
cal G
overn
ment
Actio
n
Wor
k w
ith d
evel
oper
s to
crea
te re
crea
tion
or p
ocke
t par
ks in
new
de
velo
pmen
ts.
Plann
ing C
ommi
ssion
and
Loca
l Gov
ernme
nt Ac
tion
Am
end
zoni
ng to
requ
ire re
crea
tion
and
open
spac
e in
de
velo
pmen
ts.
Plann
ing C
ommi
ssion
Actio
n
Tabl
e 27
: Im
plem
enta
tion
Sche
dule
(con
tinue
d)
101

Publ
ic a
nd S
emi-P
ublic
Obj
ectiv
eTi
mef
ram
ePo
licy
Impl
emen
tatio
n M
etho
dC
omm
ents
Mai
ntai
n th
e op
en fe
el o
f the
city
.On
going
Plac
e ne
w p
arks
in a
reas
to d
isru
pt d
ense
are
as o
f dev
elop
men
t.Pla
nning
Com
miss
ion an
d Lo
cal G
overn
ment
Actio
n
Am
end
land
scap
ing
and
buff
erin
g re
quire
men
ts.
Plann
ing C
ommi
ssion
Actio
n
Pres
erve
and
furth
er d
evel
op F
ort
Sout
hwes
t Poi
nt.
Long
-Term
Ensu
re p
rope
r fun
ding
to m
eet p
ark
need
s.Lo
cal G
overn
ment
Actio
n
Partn
er w
ith th
e R
oane
Cou
nty
Scho
ol B
oard
to in
clud
e ed
ucat
iona
lop
portu
nitie
s usi
ng th
e fo
rt in
the
curr
icul
um.
Loca
l Gov
ernme
nt Ac
tion
Mar
ket t
he F
ort f
or e
vent
s and
hol
d hi
stor
ic d
emon
stra
tions
.Lo
cal G
overn
ment
Actio
n
Attr
act v
isito
rs a
nd n
ew re
side
nts.
Ongo
ingM
arke
t loc
al re
crea
tion
oppo
rtuni
ties.
Loca
l Gov
ernme
nt Ac
tion
Partn
er w
ith th
e ch
ambe
r of c
omm
erce
and
tour
ism
boa
rds.
Loca
l Gov
ernme
nt Ac
tion
Rec
ruit
and
attra
ct la
rge
recr
eatio
n ev
ents
.Lo
cal G
overn
ment
Actio
n
Con
tinue
to d
evel
op a
nd m
arke
t wal
king
trai
l sys
tem
.Lo
cal G
overn
ment
Actio
n
Tabl
e 27
: Im
plem
enta
tion
Sche
dule
(con
tinue
d)
102

Obj
ectiv
eTi
mef
ram
ePo
licy
Impl
emen
tatio
n M
etho
dC
omm
ents
Mai
ntai
nor
impr
ove
infr
astru
ctur
eto
the
curr
ent
orhi
gher
leve
lof
serv
ice
asth
epo
pula
tion
cont
inue
s to
grow
.On
going
Dev
elop
a d
etai
led
plan
of s
ervi
ces f
or a
ll fu
ture
ann
exat
ions
.Pla
nning
Com
miss
ion Ac
tion
Dev
elop
and
/or u
pdat
e lo
ng ra
nge
plan
s for
pav
ing,
and
im
prov
emen
ts to
the
wat
er a
nd se
wer
pla
nts a
nd d
eliv
ery
netw
orks
.Lo
cal G
overn
ment
Actio
n
Mai
ntai
n or
impr
ove
the
open
feel
ing
alon
g tra
nspo
rtatio
n co
rrid
ors.
Ongo
ingEv
alua
te fr
ont s
etba
cks a
long
thes
e ro
utes
.Pla
nning
Com
miss
ion Ac
tion
Plan
for n
ew p
arks
and
road
side
gre
enw
ays.
Loca
l Gov
ernme
nt Ac
tion
Eval
uate
land
scap
ing
requ
irem
ents
.Pla
nning
Com
miss
ion Ac
tion
Con
cent
rate
hig
hest
den
sity
/inte
nsity
use
s in
area
s whe
re in
fras
truct
ure
is a
lread
y in
pla
ce
or is
exp
ecte
d to
be
exte
nded
.On
going
Hav
e ut
ility
man
ager
s eva
luat
e pr
opos
ed z
onin
g ch
ange
s.Pla
nning
Com
miss
ion Ac
tion
Com
plet
e sm
all a
rea
stud
ies w
hen
eval
uatin
g si
tes f
or p
oten
tial
com
mer
cial
and
indu
stria
l use
s.Pla
nning
Com
miss
ion Ac
tion
Ensu
re a
dequ
ate
acce
ss fo
r fire
equ
ipm
ent,
scho
ol b
uses
, and
oth
er la
rge
vehi
cles
whe
n de
velo
pmen
t occ
urs i
n ar
eas w
ith st
eepe
r sl
opes
.
Ongo
ingEv
alua
tero
adst
anda
rds
for
prop
erm
axim
umsl
opes
and
stag
ing
area
s in
deve
lopm
ents
.Pla
nning
Com
miss
ion Ac
tion
Hav
efir
e,pu
blic
wor
ks,a
ndsc
hool
offic
ials
revi
ewcu
rren
tand
any
prop
osed
cha
nges
to th
e ro
ad st
anda
rds.
Plann
ing C
ommi
ssion
Actio
n
Min
imiz
e th
e vi
sual
impa
ct o
f wire
less
and
ce
llula
r tow
ers a
nd a
nten
nas.
Ongo
ingR
equi
re si
te p
lans
for a
ll pr
opos
ed to
wer
s.Pla
nning
Com
miss
ion Ac
tion
Prio
ritiz
e co
loca
tion
of e
quip
men
t on
exis
ting
tow
ers.
Plann
ing C
ommi
ssion
Actio
n
Tran
spor
tatio
n, C
omm
unic
atio
ns, a
nd U
tiliti
es
Tabl
e 27
: Im
plem
enta
tion
Sche
dule
(con
tinue
d)
103
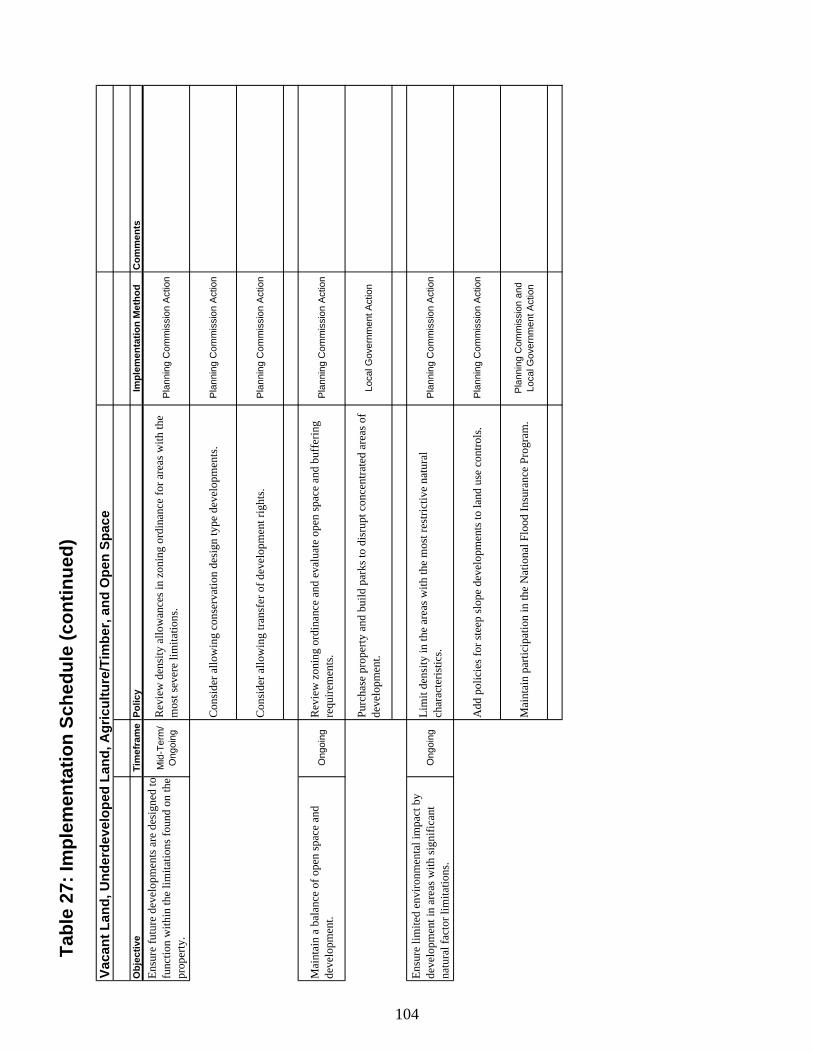
Obj
ectiv
eTi
mef
ram
ePo
licy
Impl
emen
tatio
n M
etho
dC
omm
ents
Ensu
re fu
ture
dev
elop
men
ts a
re d
esig
ned
to
func
tion
with
in th
e lim
itatio
ns fo
und
on th
e pr
oper
ty.
Mid-T
erm/
Ongo
ingR
evie
w d
ensi
ty a
llow
ance
s in
zoni
ng o
rdin
ance
for a
reas
with
the
mos
t sev
ere
limita
tions
.Pla
nning
Com
miss
ion Ac
tion
Con
side
r allo
win
g co
nser
vatio
n de
sign
type
dev
elop
men
ts.
Plann
ing C
ommi
ssion
Actio
n
Con
side
r allo
win
g tra
nsfe
r of d
evel
opm
ent r
ight
s.Pla
nning
Com
miss
ion Ac
tion
Mai
ntai
n a
bala
nce
of o
pen
spac
e an
d de
velo
pmen
t.On
going
Rev
iew
zon
ing
ordi
nanc
e an
d ev
alua
te o
pen
spac
e an
d bu
ffer
ing
requ
irem
ents
.Pla
nning
Com
miss
ion Ac
tion
Purc
hase
pro
perty
and
bui
ld p
arks
to d
isru
pt c
once
ntra
ted
area
s of
deve
lopm
ent.
Loca
l Gov
ernme
nt Ac
tion
Ensu
re li
mite
d en
viro
nmen
tal i
mpa
ct b
y de
velo
pmen
t in
area
s with
sign
ifica
nt
natu
ral f
acto
r lim
itatio
ns.
Ongo
ingLi
mit
dens
ity in
the
area
s with
the
mos
t res
trict
ive
natu
ral
char
acte
ristic
s.Pla
nning
Com
miss
ion Ac
tion
Add
pol
icie
s for
stee
p sl
ope
deve
lopm
ents
to la
nd u
se c
ontro
ls.
Plann
ing C
ommi
ssion
Actio
n
Mai
ntai
n pa
rtici
patio
n in
the
Nat
iona
l Flo
od In
sura
nce
Prog
ram
.Pla
nning
Com
miss
ion an
d Lo
cal G
overn
ment
Actio
n
Vaca
nt L
and,
Und
erde
velo
ped
Land
, Agr
icul
ture
/Tim
ber,
and
Ope
n Sp
ace
Tabl
e 27
: Im
plem
enta
tion
Sche
dule
(con
tinue
d)
104