Embed Size (px)
Citation preview

Land Use Model Implementation Issues
PSRC & UrbanSim
COG/MPO Mini-Conference, San Diego
July 16th-17th 2010
22
Presentation Overview
• Land Use Model
• Background
• Status
• Implementation Challenges & Responses
• Staffing & Skills
• Forecasts versus Policy Analysis
• Integration with Travel Model

Land Use Model Background

Parcels Buildings Households Persons Jobs
1.18 million
parcels
1.0 million
buildings
1.28 million
households
3.2 million
people
1.85 million
jobs
PSRC Land Use Model = Parcel version of UrbanSim
4
Zones (219 total)
55
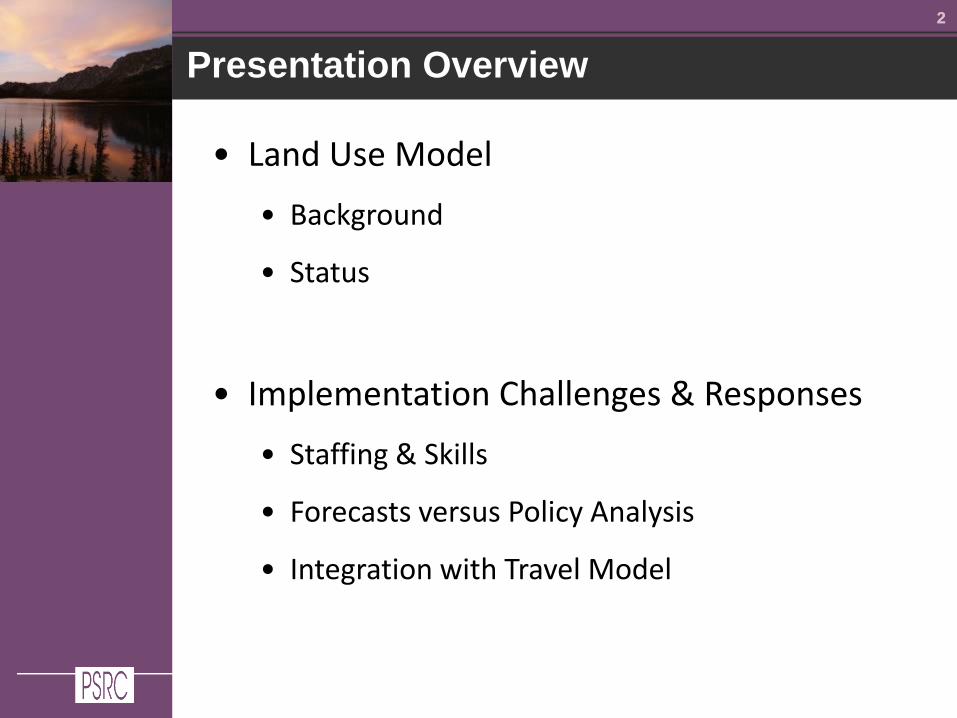
Land Use Model Elements
5
Process Pipeline EventsLand
Development
Models Real Estate Price Model
Expected Sale Price Model
Development Proposal Choice Model
Building Construction Model
Household Transition Model
Household Relocation Model
Household Location Choice Model
Employment Transition Model
Employment Relocation Model
Employment Location Choice Model
Household
Location
Models
Employment
Location
Models
Economic Transition Model
Home-based Job Choice Model
Workplace Location Choice Model
Workplace
Location
Models

Direct modeling of land use constraints in UrbanSim
• Direct representation of parcels and development capacity
– Example: 19,600 SQFT vacant parcel with comp plan designation calling for 4 to 6 DU/Acre
– Every parcel must have an assumed DU and FAR constraint
• Land Development Models predict future built status of parcels
• Location Choice Models predict occupancy and use of buildings on parcels
6

77
UrbanSim – Full integration with travel model
Model Inputs and
Integration
Analysis Year
2006 (base) 2015 2025 2035 2040
Land Use Model
Runs, using
accessibilities from:
a previous travel
model run for land
use model run 2006
2006 travel model
for land use model
runs 2007 through
2015
2015 travel model
for land use model
runs 2016 through
2025
2025 travel model
for land use model
runs 2026 through
2035
2035 for land use
model runs 2036
through 2040
Travel Model Runs,
using population and
employment from:
2006 land use
model run
2015 land use
model run
2025 land use
model run
2035 land use
model run
2040 land use
model run

88
UrbanSim – Implementation Status
Supported MTP Update, Transportation 2040• Integrated with travel model• Comparative analysis
Model Improvement• Refining many ‘placeholder’ decisions
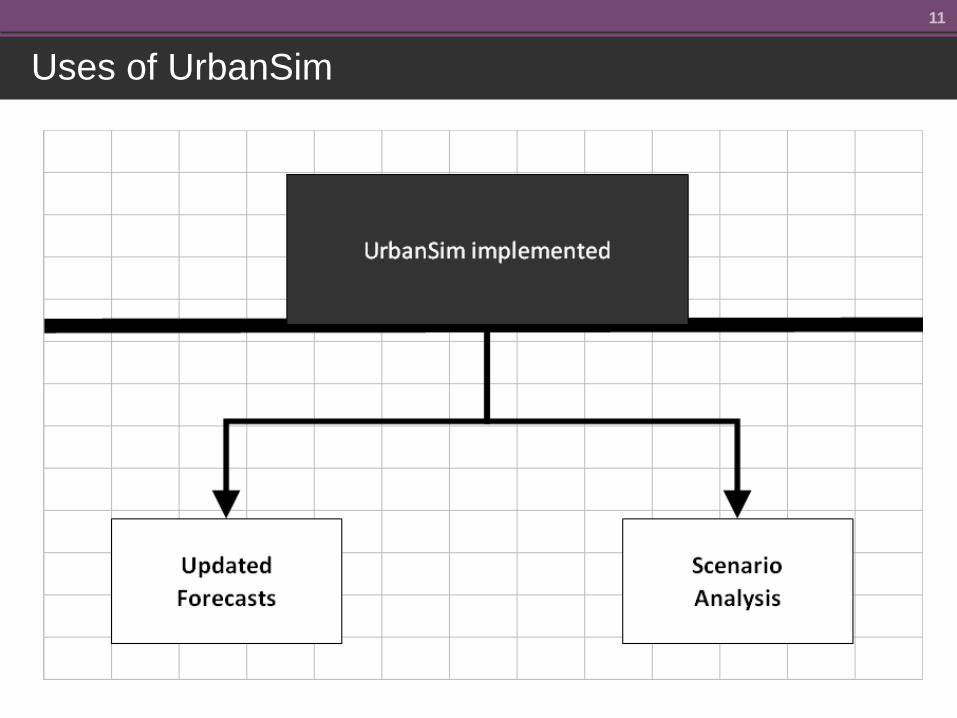
Ready for Use in Forecasting: CY 2011• Scenario Analysis to follow
Implementation Challenges, Responses
1010
Land Use Modeling staffing
Land
use
model
Travel
Demand
Model
Regional
Economic
Model
Land use
model
Travel
Demand
Model
Regional
Economic
Model
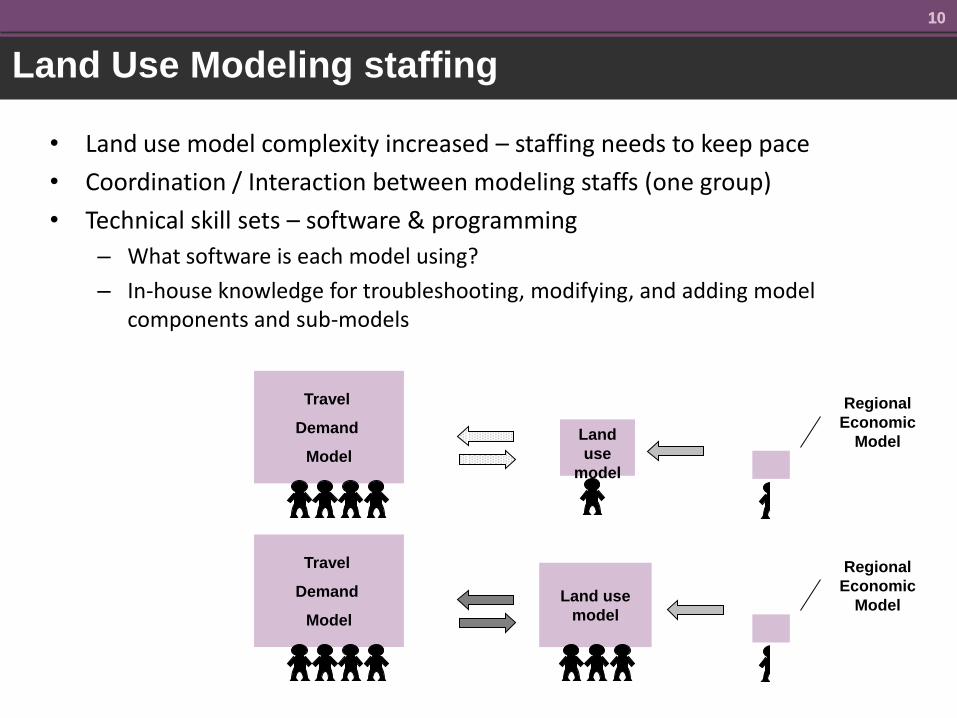
• Land use model complexity increased – staffing needs to keep pace
• Coordination / Interaction between modeling staffs (one group)
• Technical skill sets – software & programming
– What software is each model using?
– In-house knowledge for troubleshooting, modifying, and adding model components and sub-models
Uses of UrbanSim
11
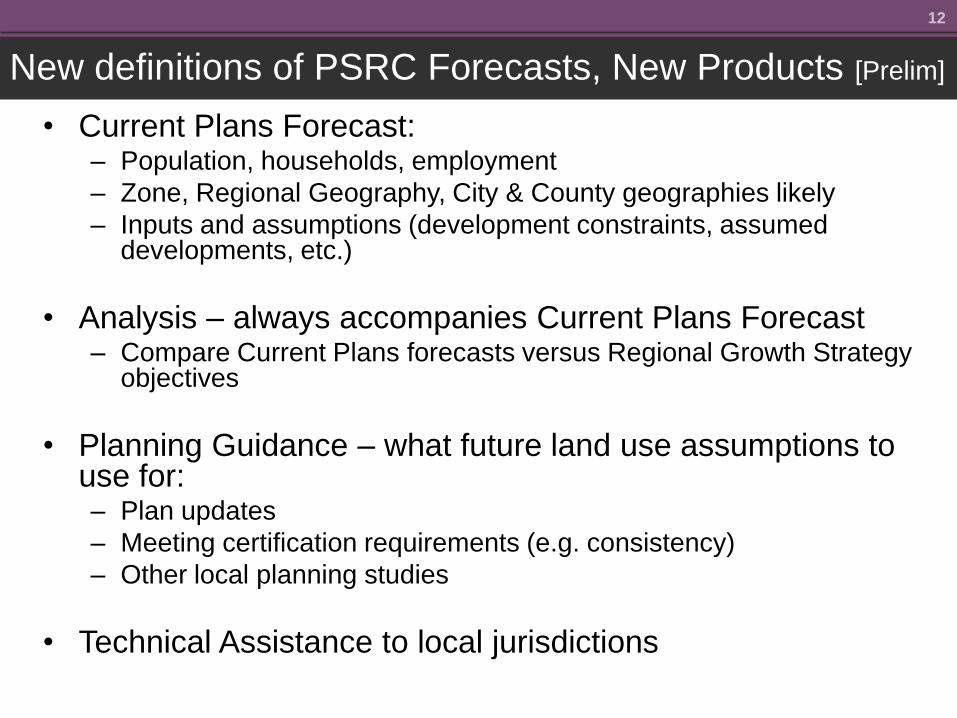
• Current Plans Forecast:– Population, households, employment
– Zone, Regional Geography, City & County geographies likely
– Inputs and assumptions (development constraints, assumed developments, etc.)
• Analysis – always accompanies Current Plans Forecast– Compare Current Plans forecasts versus Regional Growth Strategy
objectives
• Planning Guidance – what future land use assumptions to use for:– Plan updates
– Meeting certification requirements (e.g. consistency)
– Other local planning studies
• Technical Assistance to local jurisdictions
New definitions of PSRC Forecasts, New Products [Prelim]
12

Longer-Term: UrbanSim Scenario Modeling [Prelim]
13
Travel Model Integration and Sensitivity

1515
Accessibility Measures – passed to UrbanSim
Zone-based, measured to a downtown location• Generalized Cost to Seattle CBD, HBW AM SOV• Generalized Cost to Bellevue CBD, HBW AM SOV
Zone-based• Average Travel Time, Trip-weighted, AM, SOV, HBW• Jobs within 30 minutes travel time, AM, SOV
Person-based, Home to Work Zones• Network distance from Home to Work• Log Sum, HBW AM from Home to Work
1616
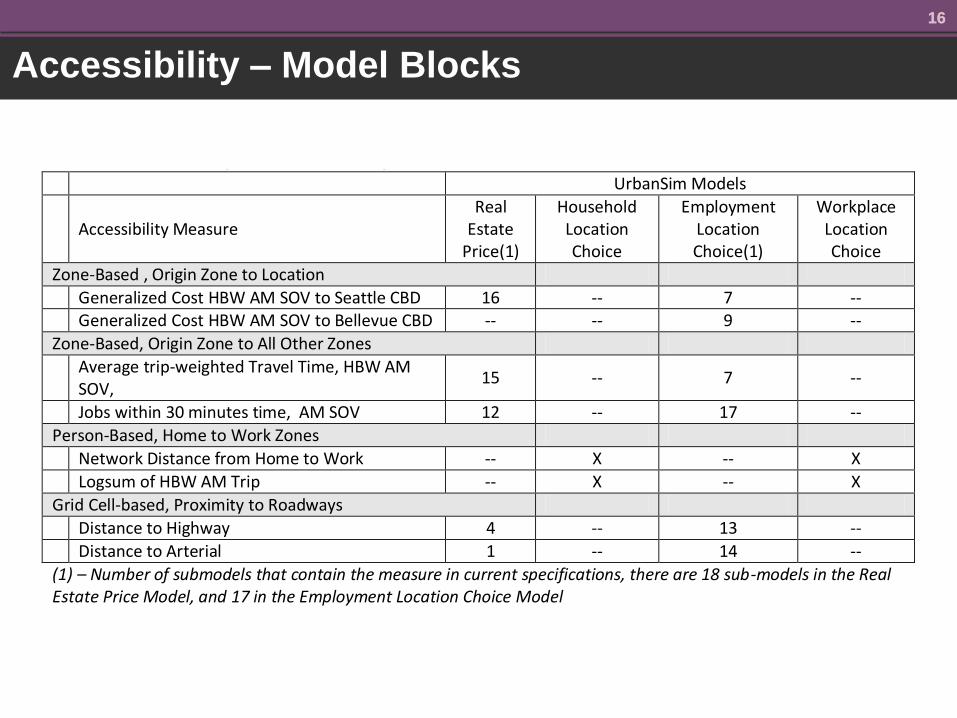
Accessibility – Model Blocks
Table 1 – Accessibility Measures Used by UrbanSim Model Blocks UrbanSim Models
Accessibility Measure
Real Estate
Price(1)
Household Location Choice
Employment Location Choice(1)
Workplace Location Choice
Zone-Based , Origin Zone to Location
Generalized Cost HBW AM SOV to Seattle CBD 16 -- 7 -- Generalized Cost HBW AM SOV to Bellevue CBD -- -- 9 --
Zone-Based, Origin Zone to All Other Zones
Average trip-weighted Travel Time, HBW AM SOV,
15 -- 7 --
Jobs within 30 minutes time, AM SOV 12 -- 17 --
Person-Based, Home to Work Zones
Network Distance from Home to Work -- X -- X
Logsum of HBW AM Trip -- X -- X
Grid Cell-based, Proximity to Roadways
Distance to Highway 4 -- 13 --
Distance to Arterial 1 -- 14 --
(1) – Number of submodels that contain the measure in current specifications, there are 18 sub-models in the Real Estate Price Model, and 17 in the Employment Location Choice Model
1717
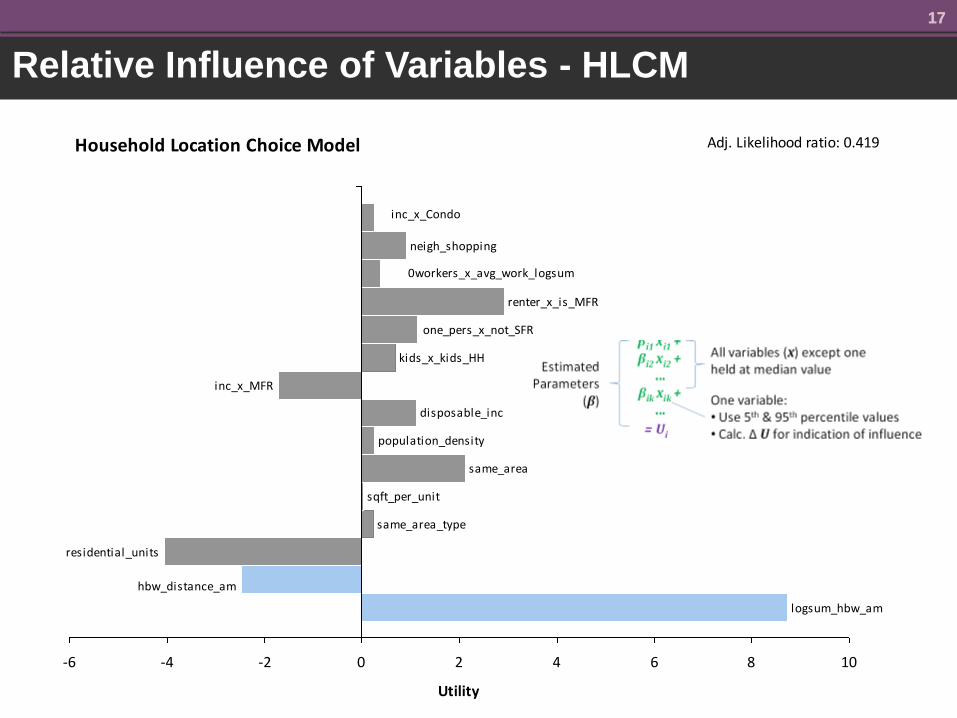
Relative Influence of Variables - HLCM
Household Location Choice Model
residential_units
same_area_type
sqft_per_unit
same_area
population_density
disposable_inc
inc_x_MFR
kids_x_kids_HH
renter_x_is_MFR
logsum_hbw_am
hbw_distance_am
one_pers_x_not_SFR
0workers_x_avg_work_logsum
neigh_shopping
inc_x_Condo
-6 -4 -2 0 2 4 6 8 10
Utility
Adj. Likelihood ratio: 0.419
1818
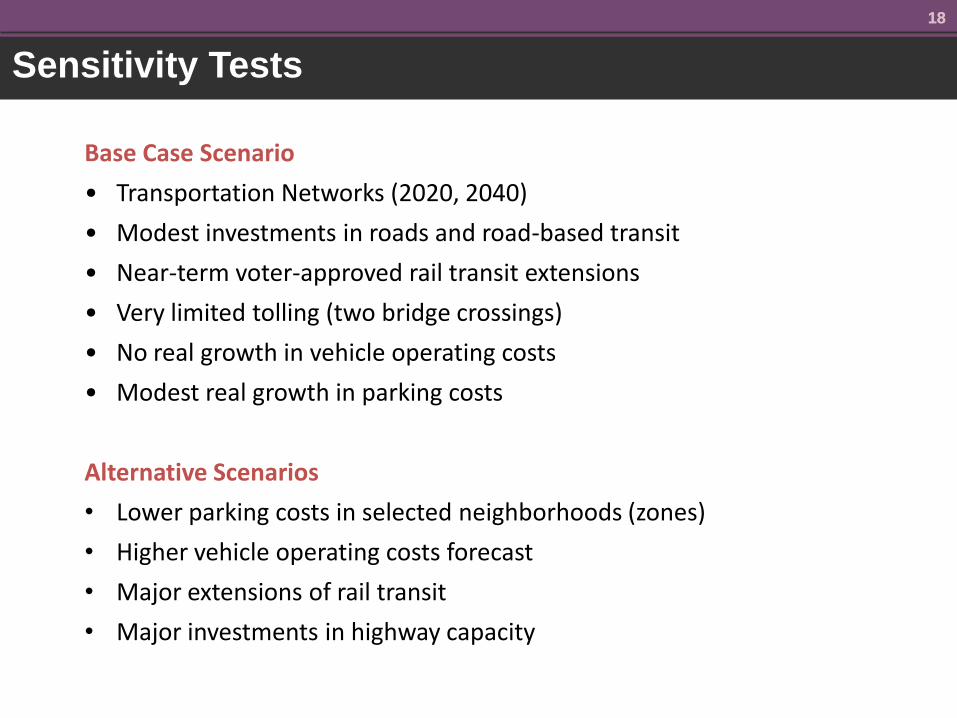
Sensitivity Tests
Base Case Scenario
• Transportation Networks (2020, 2040)
• Modest investments in roads and road-based transit
• Near-term voter-approved rail transit extensions
• Very limited tolling (two bridge crossings)
• No real growth in vehicle operating costs
• Modest real growth in parking costs
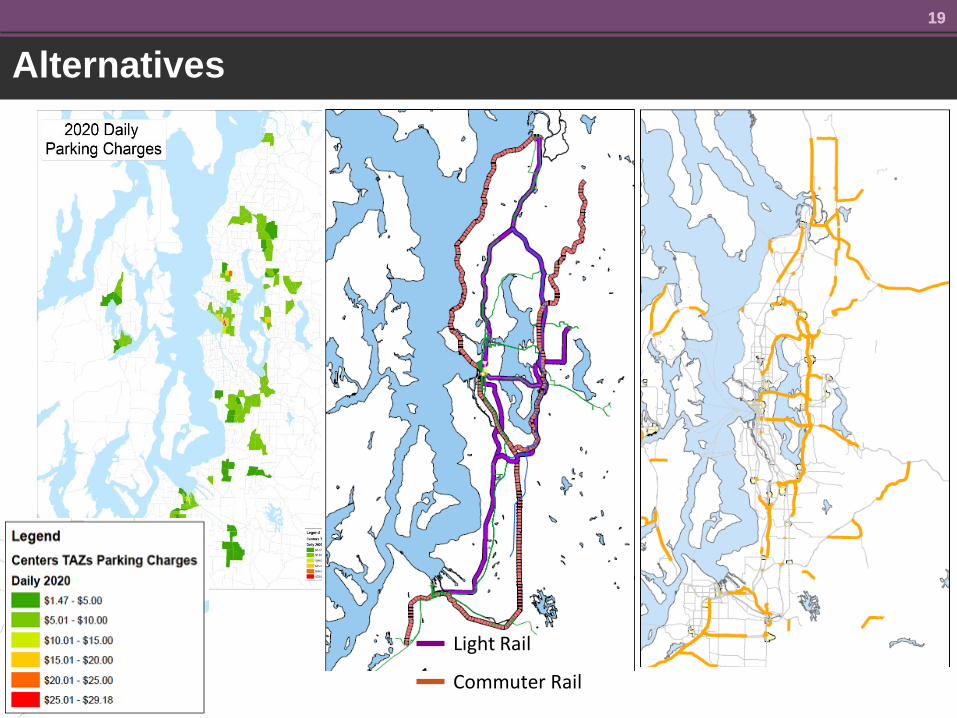
Alternative Scenarios
• Lower parking costs in selected neighborhoods (zones)
• Higher vehicle operating costs forecast
• Major extensions of rail transit
• Major investments in highway capacity
1919
Alternatives
Light Rail
Commuter Rail

2020
Expectations
• Short-run substitution will minimize the magnitude of cost changes reflected in long-run (location) choices
• Some modest correlation between a composite measure of zonal accessibility and the outputs of the land use model (population, households, employment, work trip locations)
• Higher transportation costs should result in lower site values, and vice versa
• A resorting by willingness to pay for sites may dominate the location choices

Results
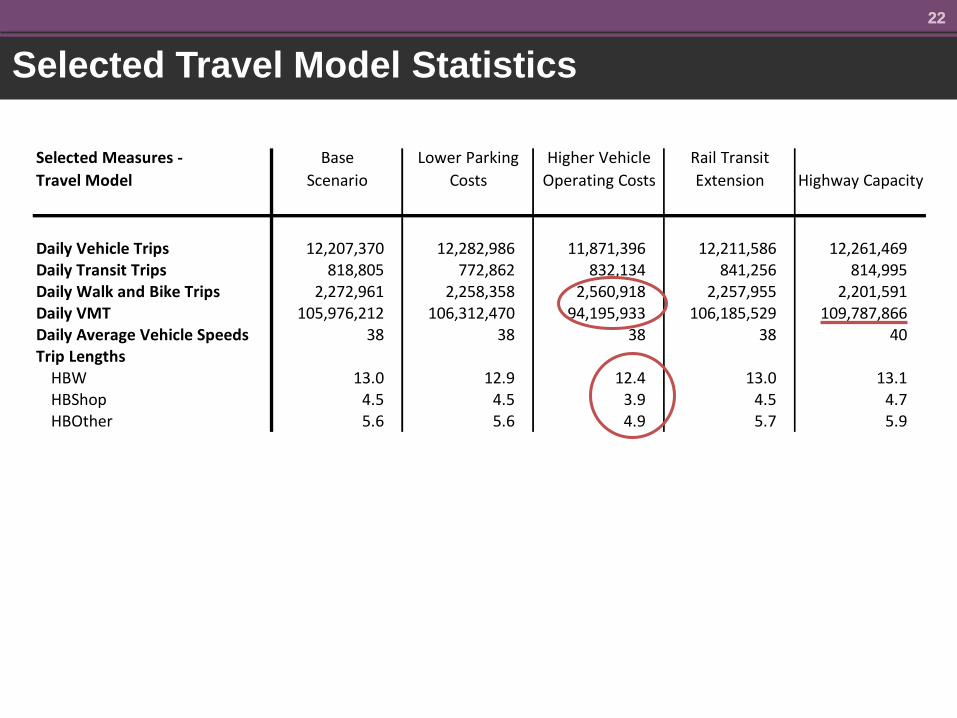
Selected Measures -
Travel Model
Base
Scenario
Lower Parking
Costs
Higher Vehicle
Operating Costs
Rail Transit
Extension Highway Capacity
Daily Vehicle Trips 12,207,370 12,282,986 11,871,396 12,211,586 12,261,469Daily Transit Trips 818,805 772,862 832,134 841,256 814,995Daily Walk and Bike Trips 2,272,961 2,258,358 2,560,918 2,257,955 2,201,591Daily VMT 105,976,212 106,312,470 94,195,933 106,185,529 109,787,866Daily Average Vehicle Speeds 38 38 38 38 40Trip Lengths
HBW 13.0 12.9 12.4 13.0 13.1HBShop 4.5 4.5 3.9 4.5 4.7HBOther 5.6 5.6 4.9 5.7 5.9
2222
Selected Travel Model Statistics
2323
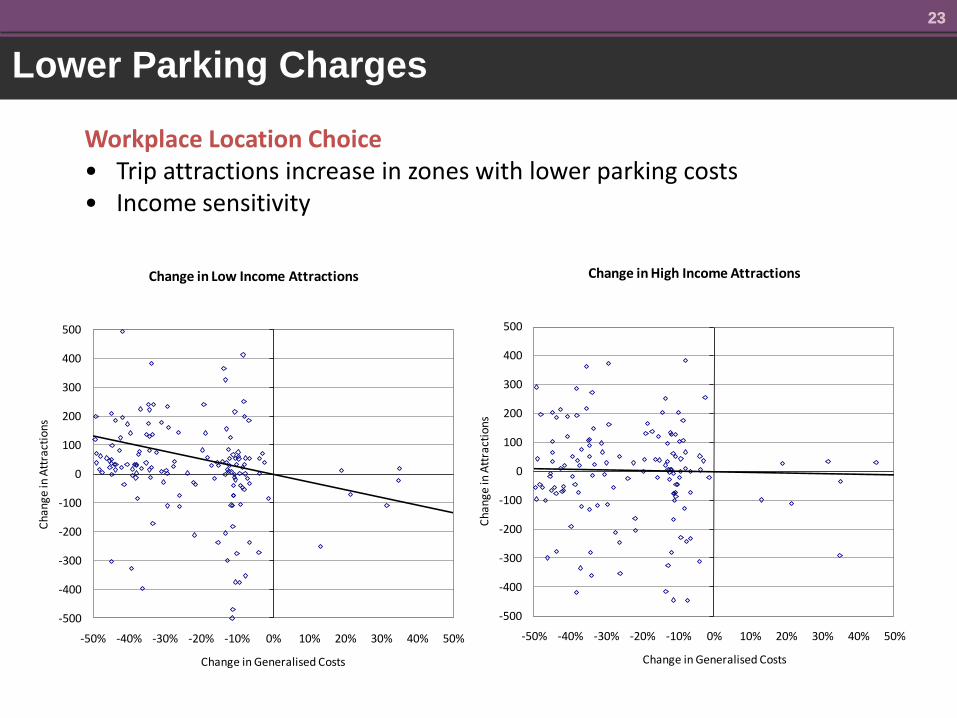
Lower Parking Charges
Workplace Location Choice• Trip attractions increase in zones with lower parking costs• Income sensitivity
-500
-400
-300
-200
-100
0
100
200
300
400
500
-50% -40% -30% -20% -10% 0% 10% 20% 30% 40% 50%
Ch
an
ge
in A
ttra
ctio
ns
Change in Generalised Costs
Change in Low Income Attractions
-500
-400
-300
-200
-100
0
100
200
300
400
500
-50% -40% -30% -20% -10% 0% 10% 20% 30% 40% 50%
Ch
ange
in A
ttra
ctio
ns
Change in Generalised Costs
Change in High Income Attractions

2424
Rail Transit Extensions
Transit Scenario: AM Trip Productions
(500)
(400)
(300)
(200)
(100)
-
100
200
300
400
500
-20% -15% -10% -5% 0% 5% 10% 15% 20%
Change in Generalized Costs
Ch
ange
in H
BW
Tri
ps
Transit Scenario: AM Trip Productions
(500)
(400)
(300)
(200)
(100)
-
100
200
300
400
500
-20% -15% -10% -5% 0% 5% 10% 15% 20%
Change in Generalized Costs
Ch
ange
in H
BW
Tri
ps
Change in Population and
Employmentred-gains, blue-losses

2525
Increased Highway Capacity
Highway Scenario: AM Trip Productions
(500)
(400)
(300)
(200)
(100)
-
100
200
300
400
500
-20% -15% -10% -5% 0% 5% 10% 15% 20%
Change in Generalized Costs
Ch
ange
in H
BW
Tri
ps
Changes in EmploymentHighway Scenario: AM Trip Attractions
(500)
(400)
(300)
(200)
(100)
-
100
200
300
400
500
-20% -15% -10% -5% 0% 5% 10% 15% 20%
Change in Generalized Costs
Ch
ange
in H
BW
Tri
ps
Change in Populationblue-gains, red-losses
2626
Findings
Land Use Response to Transportation Scenarios
• A modest response is in line with theoretical expectations
• Accessibility measures from the travel model do change across scenarios and reflect route and destination choices (and to a more limited degree mode choice).
• Short-run substitution and activity sorting across sites likely limits the effects on development capital
• The influence of access on site values is probably a central feature in proper simulations. We have not explicitly evaluated site values

2727
Future Directions
Accessibilities Variables• Revisit the zonal composite variables used in the real estate
price and employment location choice models• Changes to real estate price model to more fully reflect scale of
demand and accessibility• A revised zone structure (from 938 to over 3,500) should reduce
aggregation problems• Activity-based travel model development will open up
numerous opportunities for disaggregate access measures
Revisit Integration Structure• Frequency of travel model runs (currently every 10 forecast
years)• Activity-based model development will necessitate a different
approach (interaction between long-run and short-run choices)

2828
Other Miscellaneous Thoughts
Data Assembly• What is load-bearing and what is more forgiving? • Draft database to support Alpha / Beta models, then refine base
year data?
Placeholder• text
Placeholder• text
Placeholder• text

Puget Sound Regional Council
Land Use Modeling Team:
Matthew Kitchen, Peter Caballero, Mark
Simonson, Rebeccah Maskin & Michael Jensen