Embed Size (px)
Citation preview

Land use intensification on the Land use intensification on the Canterbury Plains:Canterbury Plains:
What are the implications for water quality?
Ken TaylorEnvironment Canterbury
“The vast majority of studies on cause effect relationships…conclude that agriculture, as typically practiced in New Zealand, has a detrimental effect on water quality. These studies have shown that high levels of sediments, nutrients, and bacteria are generally found in waterways in agricultural areas, and water quality guidelines are often compromised, particularly where farming activity is intensive”
NIWA report April 2002
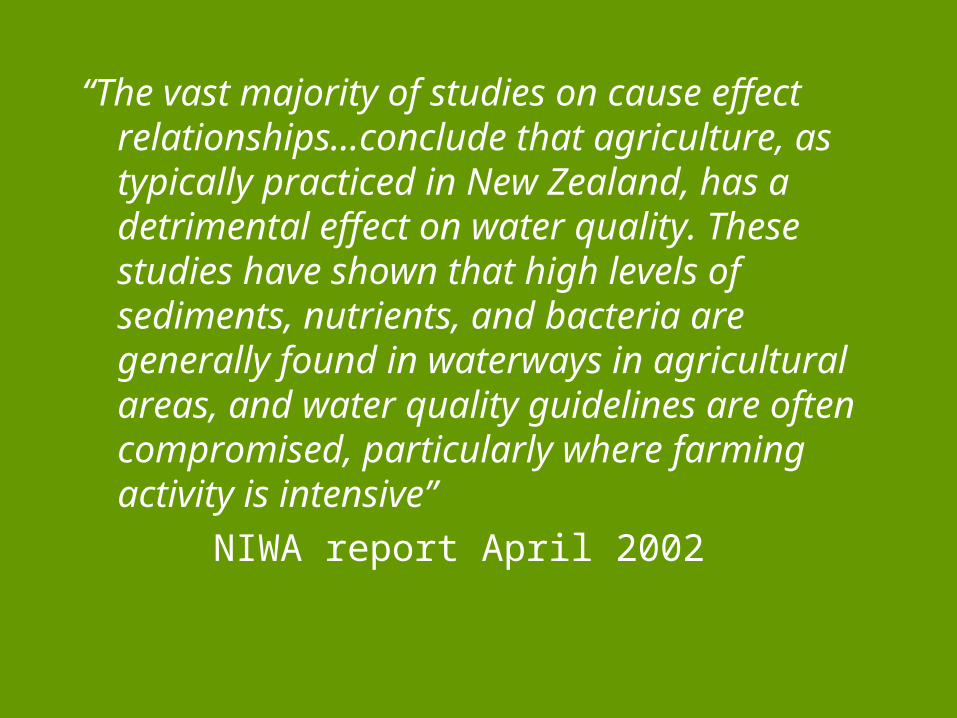
Land use intensification Land use intensification contentscontents
• Potential effects• Indicators of change• Groundwater quality
– Nitrate contamination - state & trends
• Surface water quality– Nitrate loads to spring-fed streams – Phosphorus – Microbial contamination– Sedimentation– Habitat loss– Loss of flow
• Managing nutrient leaching to groundwater – ECan approach
Land use intensification Land use intensification - potential effects - potential effects
• Groundwater – Leaching of nutrients and micro-organisms -
impacts on drinking water quality and “down-stream” effects
Land use intensification Land use intensification - potential effects - potential effects
• Surface waters– Nutrient loads to spring-fed
streams • Nitrate toxicity• Excessive plant growth• Coastal lagoons• Marine waters
– Microbial contamination • Recreational water quality • Drinking water supply
–Sedimentation –Habitat change
•Natural character•Wetland loss•Loss of shading
–Loss of flow •Habitat loss•Water quality effects

Land use intensification – what’s Land use intensification – what’s happening out there?happening out there?

Indicators of land use intensification…Indicators of land use intensification…
0
200
400
600
800
1000
1200199
0
199
1
199
2
199
3
199
4
199
5
199
6
199
7
199
8
199
9
200
0
200
1
200
2
200
3
200
4
Year
Sto
ck n
um
bers
(d
air
y,
beef,
deer
- 000
's;
Sh
eep
- 0
000's
)
Sheep Dairy cattle Beef cattle Deer
0
10000
20000
30000
40000
50000
60000
70000
80000
90000
100000
1992 1993 1994 1995 1996 1997 1998 1999 2000 2001 2002 2003 2004Year
tonn
es
Tonnes of urea applied to Canterbury farmland1992-2004

Indicators of land use intensification…Indicators of land use intensification…
1995
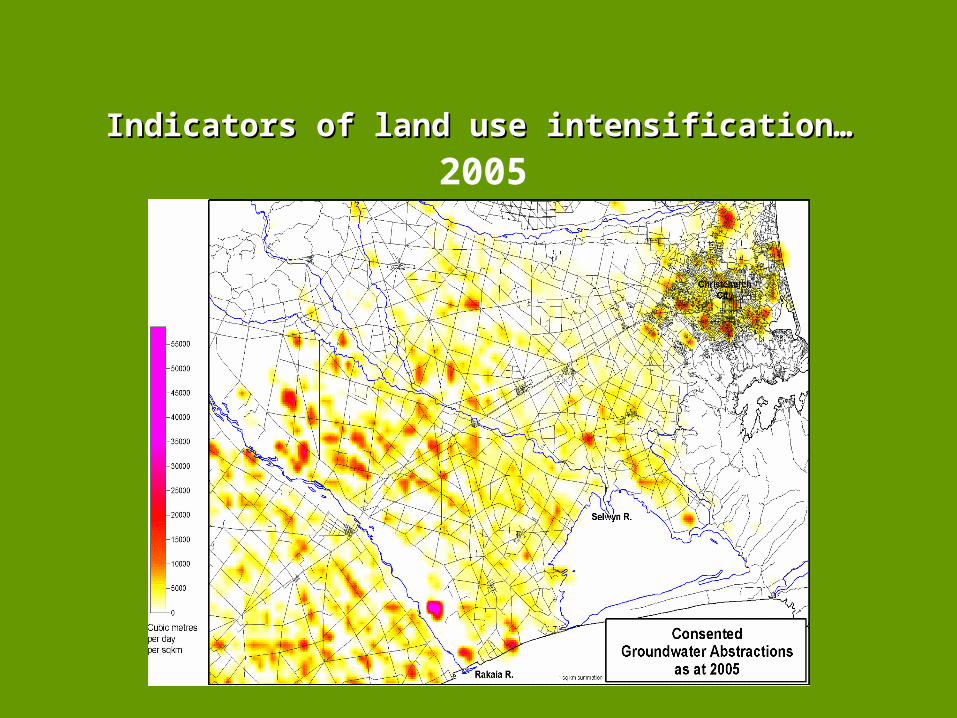
Indicators of land use intensification…Indicators of land use intensification…
2005
Canterbury GroundwaterCanterbury Groundwater
• 75% of the region in some form of agricultural production
•Agriculture is the largest user of gw (84%). est. 350,000 ha is irrigated
• Untreated groundwater principal source of drinking water for communities, dwellings, & businesses (13%)


Schematic cross-section of the Canterbury PlainsSchematic cross-section of the Canterbury Plains
?
?
Gravel base approximately355m below ground level
Lake Ellesmere(Te Waihora) Kaitorete Spit
Leeston
Leeston 1Petroleum exploration bore
SH1
Te Pirita
WaterLevelrange
0 10 20 30 40 50 60 km
FlowingArtesian
Wells
Schematic Cross Section through Central Plains
Sea Level0
-150
150
Impermeable sediments
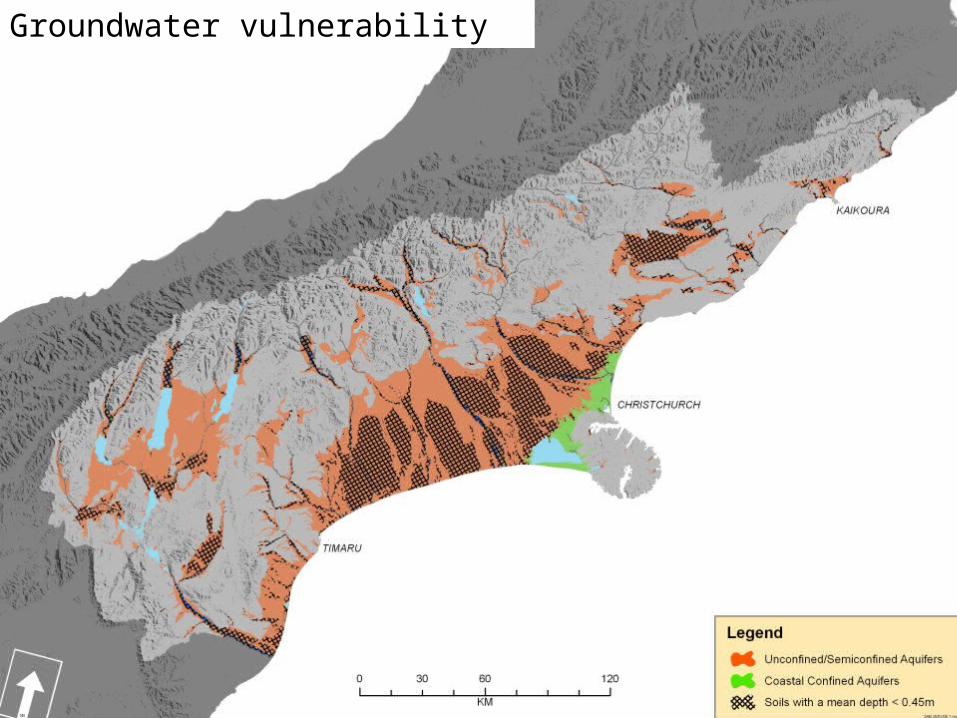
Groundwater vulnerability
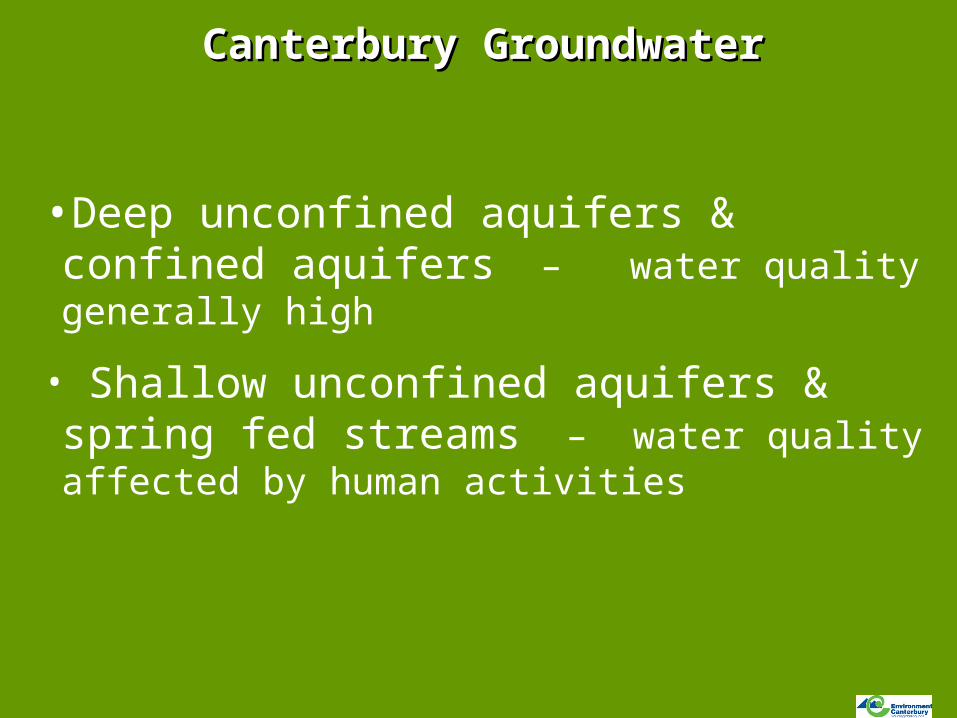
Canterbury GroundwaterCanterbury Groundwater
•Deep unconfined aquifers & confined aquifers – water quality generally high
• Shallow unconfined aquifers & spring fed streams – water quality affected by human activities

What is the problem with nitrate?What is the problem with nitrate?
• In groundwater– “universal” drinking water standard
11.3 mg NO3-N/L
• In surface water– Range of adverse effects
• Nitrate toxicity – ANZECC guidelines
• Excessive plant growth
• Coastal lagoons – e.g., Opihi
• Coastal waters

Coastal issues• Increasing N loads to coastal waters
shift to ocean outfalls - community sewerage schemes e.g. Christchurch City, Waimakariri District, Timaru District
- industrial discharges
rivers, coastal streams, springs
– e.g. Ashburton Dist. - 2,500 tonnes N exported / yr under base flows, or 830 kg/km2
– cf. Chesapeake Bay – 130 million tonnes N per yr , or 740 kg/km2
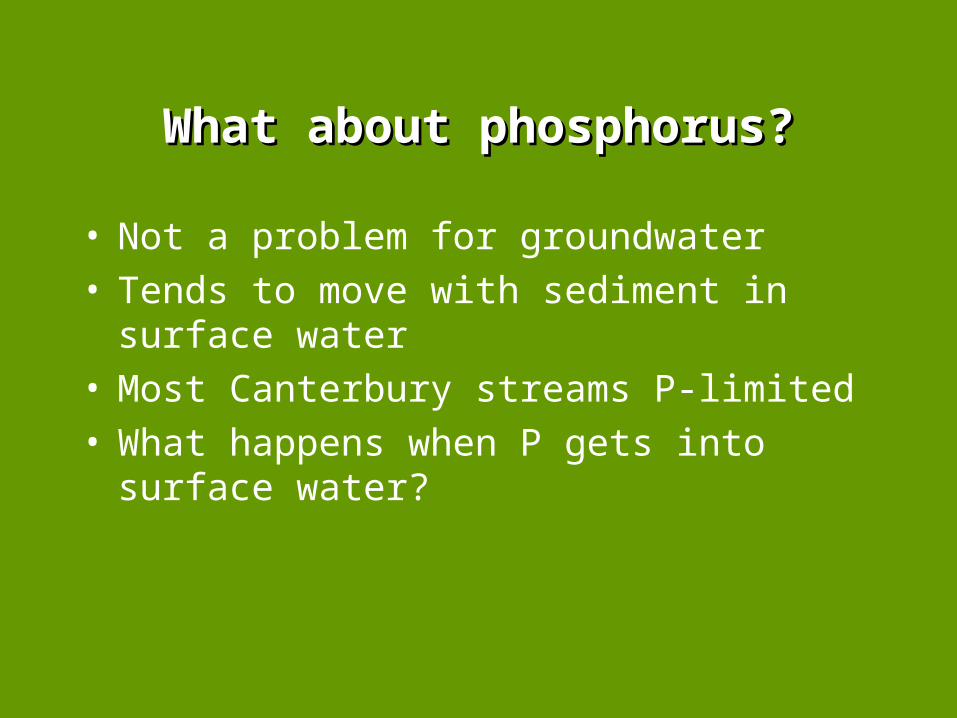
What about phosphorus?What about phosphorus?
• Not a problem for groundwater • Tends to move with sediment in surface water• Most Canterbury streams P-limited• What happens when P gets into surface
water?

SedimentationSedimentation
• Is a consequence of the way land is managed– Intermittent inputs – Stock in or adjacent to streams– Drain-clearing
• Is a particular issue for streams that do not get flushed