Embed Size (px)
Citation preview

INTERNATIONAL JOURNAL OF GEOMATICS AND GEOSCIENCES
Volume 4, No 1, 2013
© Copyright 2010 All rights reserved Integrated Publishing services
Research article ISSN 0976 – 4380
Submitted on June 2013 published on August 2013 4
Land use and Land cover Change in parts of Punjab Satluj Floodplain
(India): A Geospatial Analytical Overview from 1975 – 2011
Harsimrat Kaur1 and Karanjot Kaur Brar
2
1- Research Scholar, Center of Advanced Study in Geography, Panjab University,
Chandigarh.
2- Professor, Center of Advanced Study in Geography, Panjab University, Chandigarh
ABSTRACT
Land use and land cover change in part of Satluj flood plain is the analytical overview of the
changing Man - Environment relationship. This research theme includes two important
components i.e. land use/ land cover change (LULCC) and flood plain, which are having
functional interlinkages, as any change in land use and land cover patterns affects the
floodplain environment and itself gets affected. Impetus of this research theme includes the
analytical description of changing land use and land cover patterns in Satluj floodplain, with
the assessment of interlinked relationships, which are generated through anthropogenic and
natural processes. These relationships generate variability in land resource utilization, which
results into hazardous ecological implications and raise certain sustainability issues.
Analytical inventory of LULCC has been generated in geospatial environment, while
analyzing 1975 LANDSAT MSS and 2011 IRS P-6 LISS III images with ancillary data input
from Survey of India topographical sheets. LULC change detection patterns and change
detection matrix has been generated from resampled mutitemporal classified images, which
reflects human interventions in terms of development activities, which accentuates the
replacement of natural cover with human use. During 1975, distribution of natural cover
versus human use of land was 54.42% and 45.58% respectively, but with advent of increase
in population and technological advancement with Government initiatives through Five Year
Plans this natural cover shrunk to only 6.5%, whereas human employment on land was
expand and contributes 93.5% of this fragile flood prone flood plain area. This imbalanced
land resource utilization resulted into the hazardous ecological implications, which tend to be
framed under the broad theme of sustainability for reducing the impact factor of raised
concerned area specific issues.
Keywords: Land use, Land cover, Floodplain, Land change science, Landschaft, Human-
Environment relationship, Change detection matrix, Sustainability.
1. Introduction
Land use and land cover research theme emerged with an interdisciplinary interface, it is an
important aspect of land change science, which according to Turner II (2009) is the
reinvention of landschaft research. This German geographic tradition of Landschaft or
landscape considers the totality of things within a territory, by concentrating on human-
environment relationships (Arntz, 1999). This theme provides insight to the relational
dynamics of terrestrial surface with integration of their attributes and underlying processes
(Turner II and Robbins, 2008) and methodological advancement develop techniques for

Land use and Land cover Change in parts of Punjab Satluj Floodplain (India): A Geospatial Analytical
Overview from 1975 – 2011
Harsimrat Kaur
International Journal of Geomatics and Geosciences
Volume 4 Issue 1, 2013 5
studying this phenomena in geospatial environment, which analyze relationships through
identification of spectral similarities and differences within multidimensional spectral space
(Rindfuss et al., 2004). Spatial documentation of these linkages formed an inventory which is
helpful in framing the historical overview of changing patterns of land use and land cover.
Research work of over the last 100 years served to lay firm foundation for quantification and
analysis of horizontal and vertical related parameters of this theme. Many scholars such as
Lambin et al (2000); Verburg and Bond (2003); Overmars et al (2003); Parker (2003) and
Brown and Xie (2006) framed their themes in integrated modeling approach, while using
CENTURY, AGE, Ehrlich, FASOM, Adams, Riebsame, CLUE and Land Transformation
Model (LTM). This developments promotes the progressive growth of intensive
understanding of land use and land cover change theme, whereas extensive broadening had
been done through application of this methodology in different spatial units at varied scales.
Scholars such as Kates (1963) and Chiesa et al. (1975) analyzed LULCC parameters in
floodplain and watershed scale respectively. Wengert (1957) describes floodplain as a
physical unity of resources, which makes it attractive for regional development. This area
offers great advantages such as low slope, fertile soil and easy accessibility to water, which
acts as pull in factors for human interference and accentuates large scale changes in land use
and land cover. All these transformations and modifications result in the hazardous
ecological implications, which have been illustrated in scholarly work of Barbier (1997);
Turner (1998); Brar (1999); Moseley (2004); Rudel (2005); Coomes et al. (2008) and Brar
and Chandel (2011).
Present study is an exposition on land use and land cover change in Satluj floodplain with
identifying underlying causes and its ecological implications. It is evident from literature that
Satluj floodplain is having a long history of land modification for human use especially
agriculture, which can be traced through the historical period and it gained momentum during
the British period with the construction of canal networks and promoted through policy plans
in post independence when majority of agriculture expansion took place at the expense of the
natural environment. It is an attempt of documenting these changes.
2. Study area
The area selected for conducting the present study lies in the floodplain of the Satluj. The
Satluj emerges close to the Mansarovar lake in Tibet. After its origin it follows a
northwesterly course along the slopes of Kailash Mountain then bends south-west and makes
its way through the mountainous and hill topography till it enters the Shiwalik foothills near
Nangal, Punjab. At Ropar, it pierces the hills and enters the plains and here it takes a sharp
westward turn. At Harike it is joined by the Beas river; here it adopts a southwesterly course.
The Satluj separates the Bist Doab in the north from the Malwa tract in the South.
Our study focuses on a select part of the Satluj flood plain stretching from 30°52’ N to 31°03’
N and 75°39’ E to 76°30’ E latitudes and longitudes respectively. This natural entity covers
104275.1 hectares, which includes part of Phillaur tahsil of Jalandhar district, Nawanshahr
and Balachaur tahsils of Nawanshahr district, Rupnagar tahsil of Rupnagar district and
Ludhiana West, Ludhiana East and Samrala tahsils of district Ludhiana, Punjab (India).
3. Methodology and Data Sources
Data has been extracted from the multitemporal satellite images and toposheets. Key for
interpreting satellite imagery elements is as follows:
Land use and Land cover Change in parts of Punjab Satluj Floodplain (India): A Geospatial Analytical
Overview from 1975 – 2011
Harsimrat Kaur
International Journal of Geomatics and Geosciences
Volume 4 Issue 1, 2013 6
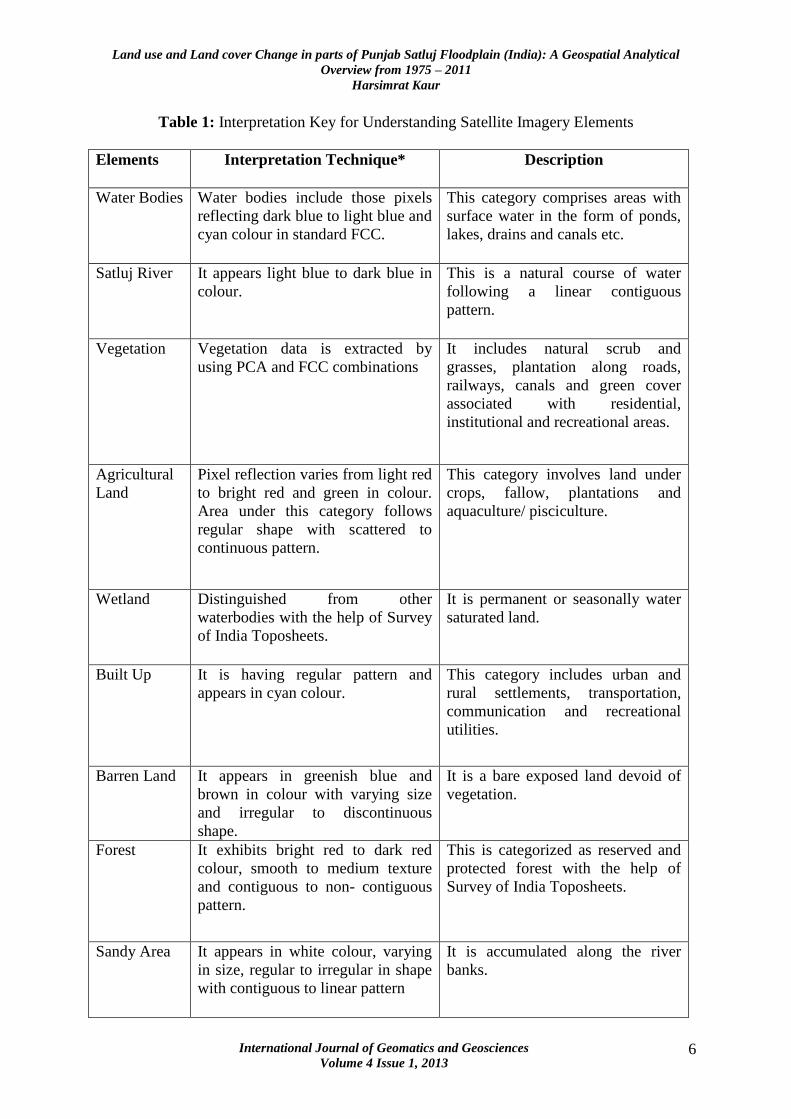
Table 1: Interpretation Key for Understanding Satellite Imagery Elements
Elements Interpretation Technique* Description
Water Bodies Water bodies include those pixels
reflecting dark blue to light blue and
cyan colour in standard FCC.
This category comprises areas with
surface water in the form of ponds,
lakes, drains and canals etc.
Satluj River It appears light blue to dark blue in
colour.
This is a natural course of water
following a linear contiguous
pattern.
Vegetation Vegetation data is extracted by
using PCA and FCC combinations
It includes natural scrub and
grasses, plantation along roads,
railways, canals and green cover
associated with residential,
institutional and recreational areas.
Agricultural
Land
Pixel reflection varies from light red
to bright red and green in colour.
Area under this category follows
regular shape with scattered to
continuous pattern.
This category involves land under
crops, fallow, plantations and
aquaculture/ pisciculture.
Wetland Distinguished from other
waterbodies with the help of Survey
of India Toposheets.
It is permanent or seasonally water
saturated land.
Built Up It is having regular pattern and
appears in cyan colour.
This category includes urban and
rural settlements, transportation,
communication and recreational
utilities.
Barren Land It appears in greenish blue and
brown in colour with varying size
and irregular to discontinuous
shape.
It is a bare exposed land devoid of
vegetation.
Forest It exhibits bright red to dark red
colour, smooth to medium texture
and contiguous to non- contiguous
pattern.
This is categorized as reserved and
protected forest with the help of
Survey of India Toposheets.
Sandy Area It appears in white colour, varying
in size, regular to irregular in shape
with contiguous to linear pattern
It is accumulated along the river
banks.
Land use and Land cover Change in parts of Punjab Satluj Floodplain (India): A Geospatial Analytical
Overview from 1975 – 2011
Harsimrat Kaur
International Journal of Geomatics and Geosciences
Volume 4 Issue 1, 2013 7
* Characteristics of colour reflection of pixels are with reference to standard False Colour
Composition (FCC).
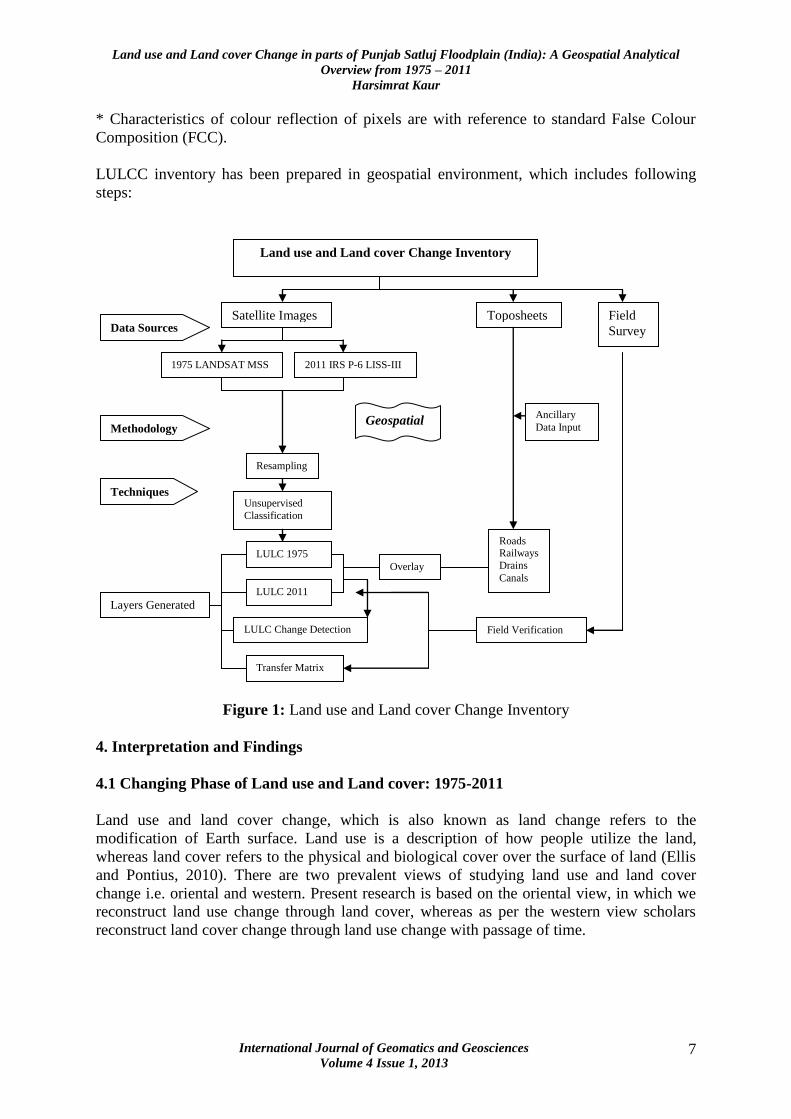
LULCC inventory has been prepared in geospatial environment, which includes following
steps:
Figure 1: Land use and Land cover Change Inventory
4. Interpretation and Findings
4.1 Changing Phase of Land use and Land cover: 1975-2011
Land use and land cover change, which is also known as land change refers to the
modification of Earth surface. Land use is a description of how people utilize the land,
whereas land cover refers to the physical and biological cover over the surface of land (Ellis
and Pontius, 2010). There are two prevalent views of studying land use and land cover
change i.e. oriental and western. Present research is based on the oriental view, in which we
reconstruct land use change through land cover, whereas as per the western view scholars
reconstruct land cover change through land use change with passage of time.
Land use and Land cover Change Inventory
Ancillary
Data Input
Satellite Images
1975 LANDSAT MSS 2011 IRS P-6 LISS-III
Toposheets
Resampling
Unsupervised
Classification
Layers Generated
LULC 1975
LULC 2011
Transfer Matrix
Roads Railways
Drains
Canals Overlay
LULC Change Detection
Geospatial
Data Sources
Methodology
Techniques
Field Verification
Field
Survey
Land use and Land cover Change in parts of Punjab Satluj Floodplain (India): A Geospatial Analytical
Overview from 1975 – 2011
Harsimrat Kaur
International Journal of Geomatics and Geosciences
Volume 4 Issue 1, 2013 8
4.1.1 Land use and Land cover Pattern during 1975
Table 2: Land use and Land cover Change in parts of Punjab Satluj Floodplain:
1975 – 2011 LULC Categories 1975 2011 LULCC (in
hectares) Area ( in
hectares)
Area (in %) Area ( in
hectares)
Area
(in %)
Water Bodies 211.11 0.2 150.96 0.14 -60.15
Satluj River 1472.97 1.41 2575.3 2.47 1102.33
Vegetation 16292.5 15.62 893.02 0.86 -15399.48
Agricultural Land 47057.11 45.13 91011.36 87.28 43954.25
Seasonal Wetland 1407.07 1.34 153.3 0.15 -1253.77
Perennial Wetland 215.03 0.2 12.2 0.01 -202.83
Built Up 469.5 0.45 6495.7 6.23 6026.2
Barren Land 32384.27 31.1 0 0 -32384.27
Forest (Reserved
Forest)
915.15 0.87 936.01 0.9 20.86
Forest (Protected
Forest)
468.61 0.44 390.2 0.37 -78.41
Sandy area 3381.74 3.24 1657.01 1.58 -1724.73
Total 104275.1 100 104275.1 100
Source: Data extracted from LANDSAT MSS 1975 and IRS P6 LISS III 2011 Satellite
Images.
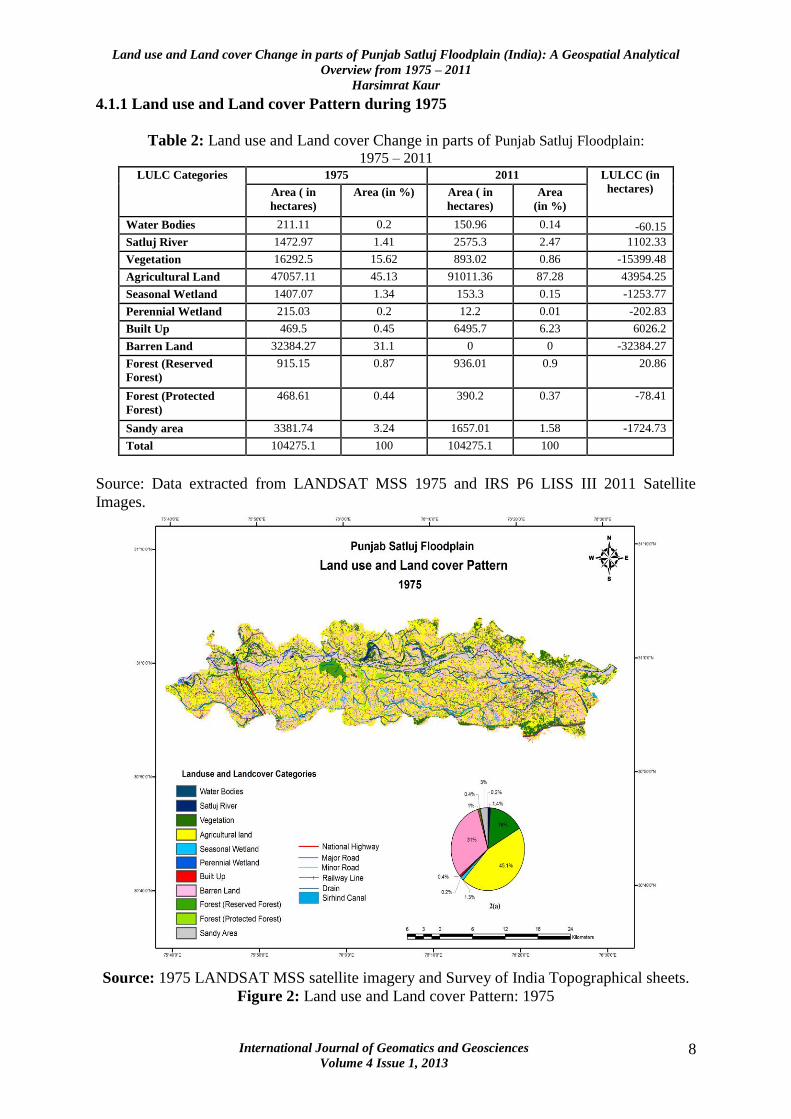
Source: 1975 LANDSAT MSS satellite imagery and Survey of India Topographical sheets.
Figure 2: Land use and Land cover Pattern: 1975
Land use and Land cover Change in parts of Punjab Satluj Floodplain (India): A Geospatial Analytical
Overview from 1975 – 2011
Harsimrat Kaur
International Journal of Geomatics and Geosciences
Volume 4 Issue 1, 2013 9
Layout of LULC for the year 1975 shown through table-2 and figure-2 reflects the initial
stage of development. During post Green Revolution period this natural fertile landscape
contributes its 45% share to agriculture with 34% wasteland. Vegetation covers 15.62% of
this natural entity and it was found along the drains, streams, canals, transportation routes and
within the dried path of water bodies. Water bodies and Satluj River contributes 0.2% and
0.41% of total Satluj floodplain area respectively. During that point of time sandy area along
the riverine path and related rivulets drainage covers 3381.74 hectare area. Perennial and
seasonal wetlands were located along the barren land and contribute 1.54% of total study area.
Scattered distribution of settlements away from main water body was well linked with each
other through cart tracks and minor roads and comprises 0.45% of floodplain area.
4.1.2 Land use and Land cover Pattern during 2011
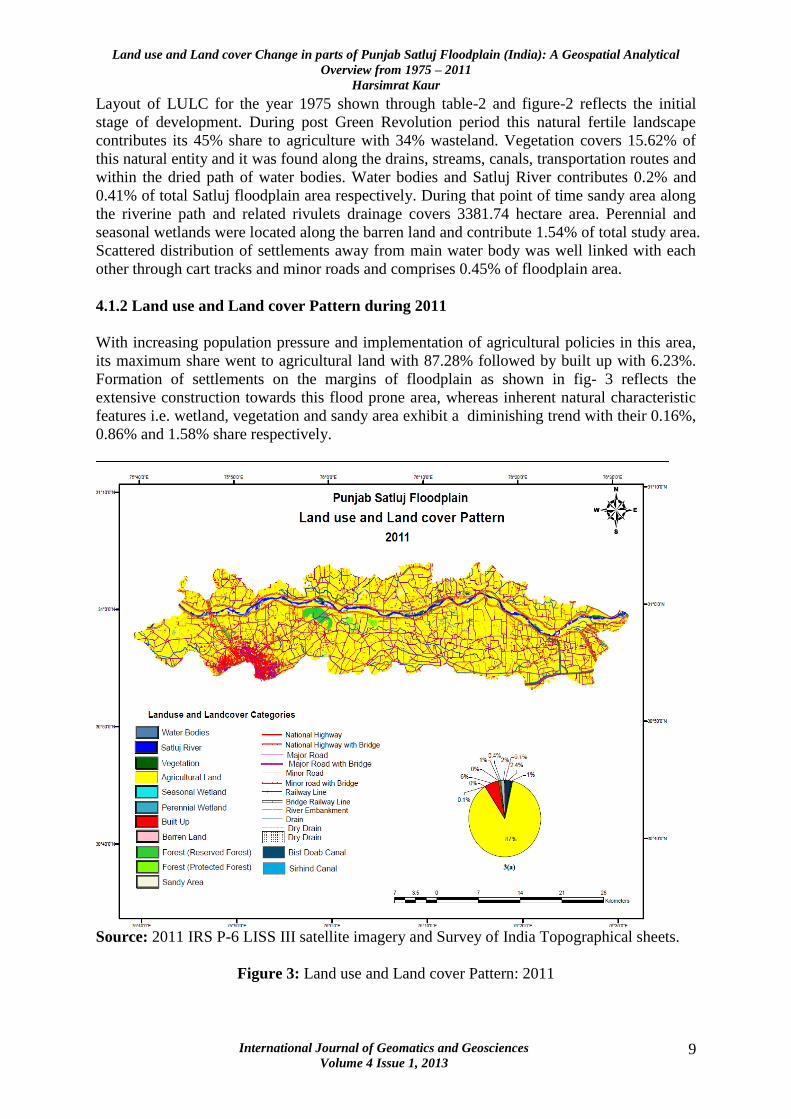
With increasing population pressure and implementation of agricultural policies in this area,
its maximum share went to agricultural land with 87.28% followed by built up with 6.23%.
Formation of settlements on the margins of floodplain as shown in fig- 3 reflects the
extensive construction towards this flood prone area, whereas inherent natural characteristic
features i.e. wetland, vegetation and sandy area exhibit a diminishing trend with their 0.16%,
0.86% and 1.58% share respectively.
Source: 2011 IRS P-6 LISS III satellite imagery and Survey of India Topographical sheets.
Figure 3: Land use and Land cover Pattern: 2011

Land use and Land cover Change in parts of Punjab Satluj Floodplain (India): A Geospatial Analytical
Overview from 1975 – 2011
Harsimrat Kaur
International Journal of Geomatics and Geosciences
Volume 4 Issue 1, 2013 10
4.2 Land use and Land cover Change Detection: 1975-2011
Post Green Revolution period is prominently followed by the development of agricultural and
infrastructural activities, which results into the spatial change and categorical transformation
of land use and land cover.
4.2.1 LULC Change Analysis
LULC layout comparison reflects increase and decrease of categorical coverage. Categories
with positive change from their respective 1975 coverage includes Agricultural land, Built up
and Satluj river area with 43954.25, 6026.2 and 1102.33 hectares increase respectively,
whereas Water bodies, Sandy area, Vegetation, Seasonal and Perennial wetland depicts
decrease in their coverage area by 60.15, 1724.73, 15399.48, 1253.77 and 202.83 hectares
respectively. Barren land was totally transformed into other categories. Forest area due to its
categorization under reserved and protected shows minute changes.
Source: 1975 LANDSAT MSS and 2011 IRS P-6 LISS III satellite imagery and Survey of
India Topographical sheets.
Figure 4: Land use and Land cover Change Detection: 1975-2011
Land use and Land cover Change in parts of Punjab Satluj Floodplain (India): A Geospatial Analytical
Overview from 1975 – 2011
Harsimrat Kaur
International Journal of Geomatics and Geosciences
Volume 4 Issue 1, 2013 11
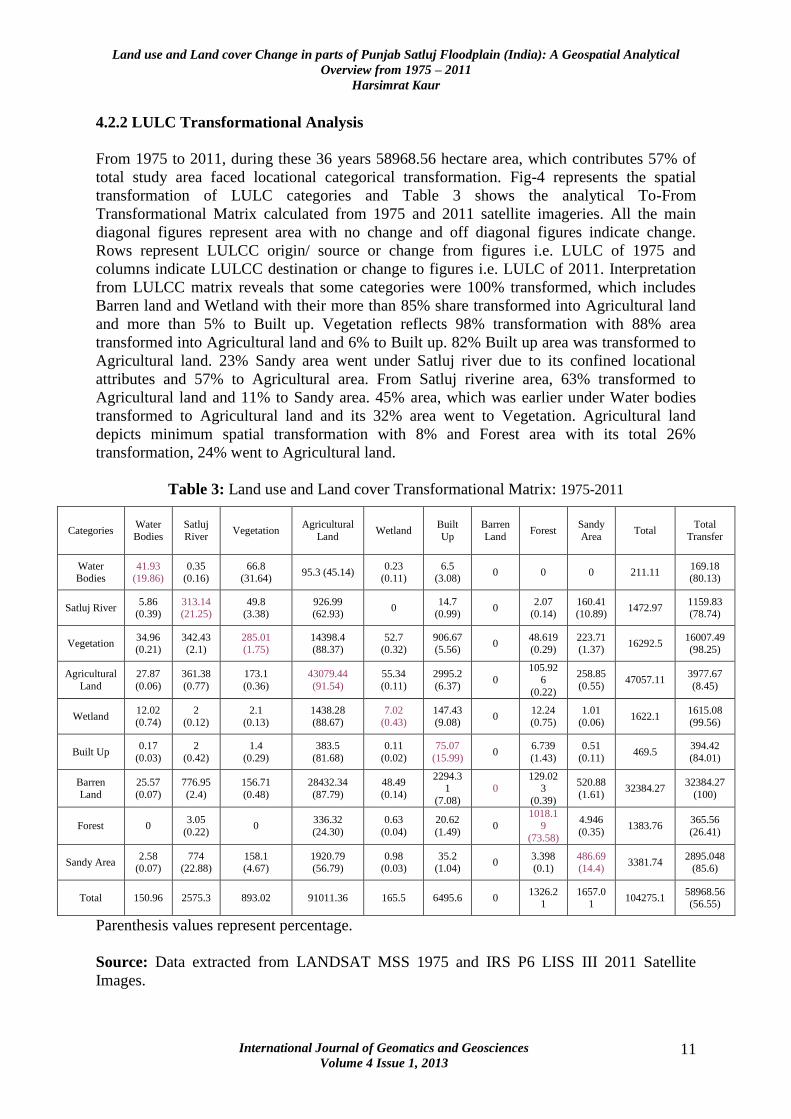
4.2.2 LULC Transformational Analysis
From 1975 to 2011, during these 36 years 58968.56 hectare area, which contributes 57% of
total study area faced locational categorical transformation. Fig-4 represents the spatial
transformation of LULC categories and Table 3 shows the analytical To-From
Transformational Matrix calculated from 1975 and 2011 satellite imageries. All the main
diagonal figures represent area with no change and off diagonal figures indicate change.
Rows represent LULCC origin/ source or change from figures i.e. LULC of 1975 and
columns indicate LULCC destination or change to figures i.e. LULC of 2011. Interpretation
from LULCC matrix reveals that some categories were 100% transformed, which includes
Barren land and Wetland with their more than 85% share transformed into Agricultural land
and more than 5% to Built up. Vegetation reflects 98% transformation with 88% area
transformed into Agricultural land and 6% to Built up. 82% Built up area was transformed to
Agricultural land. 23% Sandy area went under Satluj river due to its confined locational
attributes and 57% to Agricultural area. From Satluj riverine area, 63% transformed to
Agricultural land and 11% to Sandy area. 45% area, which was earlier under Water bodies
transformed to Agricultural land and its 32% area went to Vegetation. Agricultural land
depicts minimum spatial transformation with 8% and Forest area with its total 26%
transformation, 24% went to Agricultural land.
Table 3: Land use and Land cover Transformational Matrix: 1975-2011
Parenthesis values represent percentage.
Source: Data extracted from LANDSAT MSS 1975 and IRS P6 LISS III 2011 Satellite
Images.
Categories Water
Bodies
Satluj
River Vegetation
Agricultural
Land Wetland
Built
Up
Barren
Land Forest
Sandy
Area Total
Total
Transfer
Water
Bodies
41.93
(19.86)
0.35
(0.16)
66.8
(31.64) 95.3 (45.14)
0.23
(0.11)
6.5
(3.08) 0 0 0 211.11
169.18
(80.13)
Satluj River 5.86
(0.39) 313.14 (21.25)
49.8 (3.38)
926.99 (62.93)
0 14.7
(0.99) 0
2.07 (0.14)
160.41 (10.89)
1472.97 1159.83 (78.74)
Vegetation 34.96 (0.21)
342.43 (2.1)
285.01 (1.75)
14398.4 (88.37)
52.7 (0.32)
906.67 (5.56)
0 48.619 (0.29)
223.71 (1.37)
16292.5 16007.49 (98.25)
Agricultural
Land
27.87
(0.06)
361.38
(0.77)
173.1
(0.36)
43079.44
(91.54)
55.34
(0.11)
2995.2
(6.37) 0
105.926
(0.22)
258.85
(0.55) 47057.11
3977.67
(8.45)
Wetland 12.02 (0.74)
2 (0.12)
2.1 (0.13)
1438.28 (88.67)
7.02 (0.43)
147.43 (9.08)
0 12.24 (0.75)
1.01 (0.06)
1622.1 1615.08 (99.56)
Built Up 0.17
(0.03)
2
(0.42)
1.4
(0.29)
383.5
(81.68)
0.11
(0.02)
75.07
(15.99) 0
6.739
(1.43)
0.51
(0.11) 469.5
394.42
(84.01)
Barren
Land
25.57
(0.07)
776.95
(2.4)
156.71
(0.48)
28432.34
(87.79)
48.49
(0.14)
2294.31
(7.08)
0 129.02
3
(0.39)
520.88
(1.61) 32384.27
32384.27
(100)
Forest 0 3.05
(0.22) 0
336.32
(24.30)
0.63
(0.04)
20.62
(1.49) 0
1018.19
(73.58)
4.946
(0.35) 1383.76
365.56
(26.41)
Sandy Area 2.58
(0.07) 774
(22.88) 158.1 (4.67)
1920.79 (56.79)
0.98 (0.03)
35.2 (1.04)
0 3.398 (0.1)
486.69 (14.4)
3381.74 2895.048
(85.6)
Total 150.96 2575.3 893.02 91011.36 165.5 6495.6 0 1326.2
1 1657.0
1 104275.1
58968.56 (56.55)

Land use and Land cover Change in parts of Punjab Satluj Floodplain (India): A Geospatial Analytical
Overview from 1975 – 2011
Harsimrat Kaur
International Journal of Geomatics and Geosciences
Volume 4 Issue 1, 2013 12
4.3 Human-Environment Interface in Satluj Floodplain: Issues for Sustainability
Flood plain area which is although fertile due to inherent characteristics of resource richness
is also vulnerable to frequent flood incidences. It is having some identical components, which
is everywhere common to that natural landscape, which includes riverine area, forest cover,
natural drains, wetlands, parallel streams, oxbow lake and wasteland. All these categories
reduced to its area once it’s started experiencing human intervention. Spatial analytical
overview extracted from 1975 and 2011 satellite imagery provides statistical figures to above
descriptive explanation. Earlier there was dominance of natural cover but with advent of
increased population and advancement of technology promotes the transformation of land
cover to land use. Total area under land cover is 54.42%, whereas land use categories shared
45.58% of total 1975 LULC area. But this was not a static situation; it shows reduction of
natural cover with inclusion of human habitation and related activities with promotional
development works, which includes increase in road density from 1.04 Km/ Sq Km to 1.75
Km/ Sq Km. Distribution and development of transportation utilities depicts that road length
has increased, roads and railway lines with bridge were formed and embankment was made
along both sides of the river (Fig 2 & 3). Earlier cart tracks with 1.01 Km/ Sq Km density
provide linkages to inhabited area are now replaced by metalled roads.
All these developments are the outcome of the government policy plans, Government has
done tremendous work for the promotion of agricultural activities since first Five Year Plan,
which includes, reclamation of wasteland; conservation of soil; expansion of irrigation,
power and transport facilities; abolition of intermediary tenures; formulation of price policies;
Utilization of HYV seeds and chemical fertilizers and pesticides; establishments of
cooperative societies for the upliftment of rural economy; consolidation of small land
holdings; provisions were made for the promotion of agricultural research; strengthening of
marketing, processing, value addition infrastructure and providing subsidies in agricultural
inputs such as power, water and fertilizers.
Implementation work of these policies reflects through the formulation of anthropogenic
drains and Bist doab canal for channelizing the river water for the promotion of intensive
agriculture approach. All these human efforts in the form of development of resource
utilization activities laid fruits in the form of extensive and intensive dominance of human
land use with 93.5% over natural cover, which left with their meager contribution i.e 6.5% of
total area.
All these changes in land use and land cover have resulted in certain area specific problems
such as disappearance of wetlands and riparian vegetation, reduction in land productivity,
change in precipitation and rainfall at local to regional scale, change in run-off, increase in
soil salinity and waterlogging, decline in groundwater level, problem of soil and water
pollution and flood risk to standing crops and inhabited areas etc. All these implications raise
certain issues of sustainability with regard to land resource utilization. Fig 5 shows interlinks
and causal relationships of land use and land cover change with water resource, biota, soil
resource and climate change, specific to the study area.

Land use and Land cover Change in parts of Punjab Satluj Floodplain (India): A Geospatial Analytical
Overview from 1975 – 2011
Harsimrat Kaur
International Journal of Geomatics and Geosciences
Volume 4 Issue 1, 2013 13
Figure 5: Interlinkages between LULCC, Water, Soil, Biota and Climate
When population of an area increased, its related requirements of goods and services also
increased, which tend to made pressure on already existed resources and hence due to certain
human limitations of natural resource production they attracted towards the exploitation of
fragile landscapes for fulfilling this hunt. Human kind is regularly developing new methods
and techniques for expanding and intensifying land resource utilization especially agriculture.
This, no doubt provides food, but all that is at the loss of natural cover. Many natural habitats
have vanished and consequences are loss of biodiversity, extensive use of fertilizers,
pesticides and insecticides alter the chemical composition of soil and degrade its quality,
faulty irrigation practices unnecessarily saturates some area and increase salinity, on the other
hand water extracted area faced depletion in aquifer level. These entire human generated
modifications and transformations cumulatively affects the climatic variables, which further
accentuates the need for change in patterns and trends of land resource utilization. Thus, this
circular interlikages establishes a frame, which helps in analyzing the changing direction of
Human- Environment relationships.
5. Conclusion
This part of Satluj floodplain provides a suitable platform for analyzing and understanding
the LULCC, as this area faces implications of Green Revolution and allied activities with
promotional Government initiatives through Five Year Plans, that results into the change in
land use and land cover patterns, which increase the fragility of this zone, as this area
experiences flood incidences, which leads to the tremendous ecological and economic loss.
Thus, all raised issues need to be framed collectively with firm base of human- environment
integrity under the umbrella of sustainability.
6. References
1. Arntz, K., (1999), Landscape: A forgotten legacy, Area, 31, pp 297–299.
WATER RESOURCE
Change in ground water level.
Surface and ground water pollution.
Flood plain inundation.
BIOTA
Increase in population and
advancement of technology.
Change in land cover e.g.
deforestation and disappearance of
wetlands.
Change in land use e.g. intensive
agriculture and location of built- up
land etc.
CLIMATE CHANGE
Change in precipitation and temperature
regime
SOIL RESOURCE Soil degradation
LULCC
IN FLOOD
PLAIN AREA
Land use and Land cover Change in parts of Punjab Satluj Floodplain (India): A Geospatial Analytical
Overview from 1975 – 2011
Harsimrat Kaur
International Journal of Geomatics and Geosciences
Volume 4 Issue 1, 2013 14
2. Barbier, E. B., (1997), The economic determinants of land degradation in developing
countries, Philosophical Transactions of the Royal Society B: Biological Sciences,
352, pp 891–899.
3. Brar, K. K., (1999), Green revolution: Ecological implications, Delhi: Dominant.
4. Brar, K. K., and Chandel, V. B. S., (2011), The lost natural wetlands of Punjab
(India): An inventory, Indian Society of Remote Sensing, Springer.
5. Brown, D. G., and Xie, Y., (2006), Spatial agent-based modeling, International
Journal of Geographical Information Science, 20(9), pp 941-943.
6. Chiesa, J. R., Roberts, M. C., Randolph, J. C., and Howe, R. S., (1975), A land
capability model for the lower lake Monroe watershed, Technical Report No. 66,
Indiana University Water Resources Research center.
7. Coomes, O. T., Grimard, F., Potvin, C., and Sima, P., (2008), The fate of the tropical
forest: Carbon or cattle?, Ecological Economics, 65, pp 207–212.
8. Ellis, E., and Pontius, R., (2010), Land-use and Land-cover Change,
http://www.eoearth.org/article/Land-use and land-cover change. Accessed 15
September 2011.
9. Kates, R. W., (1963), Perceptual regions and regional perceptions in flood plain
management, Papers and Proceedings of the Regional Science Association, 2, pp 217-
227.
10. Lambin, E. F., Rounsevell, M., and Geist, H., (2000), Are current agricultural land-
use models able to predict changes in land-use intensity?, Agriculture, Ecosystems
and Environment, 1653, pp 1–11.
11. Moseley, W. G., (2004), Environmental degradation and ‘poor’ smallholders in the
West African Sudano- Sahel: Global discourses and local realities, In W. G Moseley,
B. I Logan and Aldershot (Ed.), African environment and development: Rhetoric,
programs, realities (pp 41–62). UK: Ashgate.
12. Overmars, K. P., Koning, G. H. J., and Veldkamp, A., (2003), Spatial autocorrelation
in multi-scale land-use models, Ecological Modeling, 164, pp 257- 270.
13. Parker, D. C., (2003), Multiagent system models for the simulation of land-use and
land-cover change: A review, Annals of the Association of American Geographers,
93(2), pp 316–340.
14. Rindfuss, R. R., Walsh, S. J., Turner II, B. L., Fox, J., and Mishra, V., (2004),
Developing a science of land change: Challenges and methodological issues, PNAS,
101(39), pp 13976–13981.
15. Rudel, T. K., (2005), Tropical forests: Regional paths of destruction and regeneration
in the late twentieth century, New York: Columbia Univ. Press.

Land use and Land cover Change in parts of Punjab Satluj Floodplain (India): A Geospatial Analytical
Overview from 1975 – 2011
Harsimrat Kaur
International Journal of Geomatics and Geosciences
Volume 4 Issue 1, 2013 15
16. Turner II, B. L., (2009), Land change (systems) science, In N. Castree, D. Demeritt, D.
Liverman and B. Rhoads (Ed.), A companion to environmental geography (pp 168-
180), Singapore: Wiley- Blackwell.
17. Turner II, B. L., and Robbins, P., (2008), Land change science and political ecology:
Similarities, differences, and implications for sustainability science, Annual Review
of Environment and Resources, 33, pp 295–316.
18. Turner, M. D., (1998), The interaction of grazing history with rainfall and its
influence on annual rangeland dynamics in the Sahel, In K. S Zimmerer, K. R Young
and Madison (Ed.), Nature’s geography: New lessons for conservation in developing
countries (pp 237–261), WI: Univ. Wisc. Press.
19. Verburg, K., and Bond, W. J., (2003), Use of APSIM to simulate water balances of
dry land farming systems in south eastern Australia. Technical Report 50/03, CSIRO
Land and Water, Canberra, Australia, http://www.clw.csiro.au/publications/technical
2003.pdf. Accessed 12 March 2011.
20. Wengert, N., (1957), The politics of river basin development, Law and Contemporary
Problems, 22, pp 267-268.