Embed Size (px)
Citation preview
Page 1 of 14
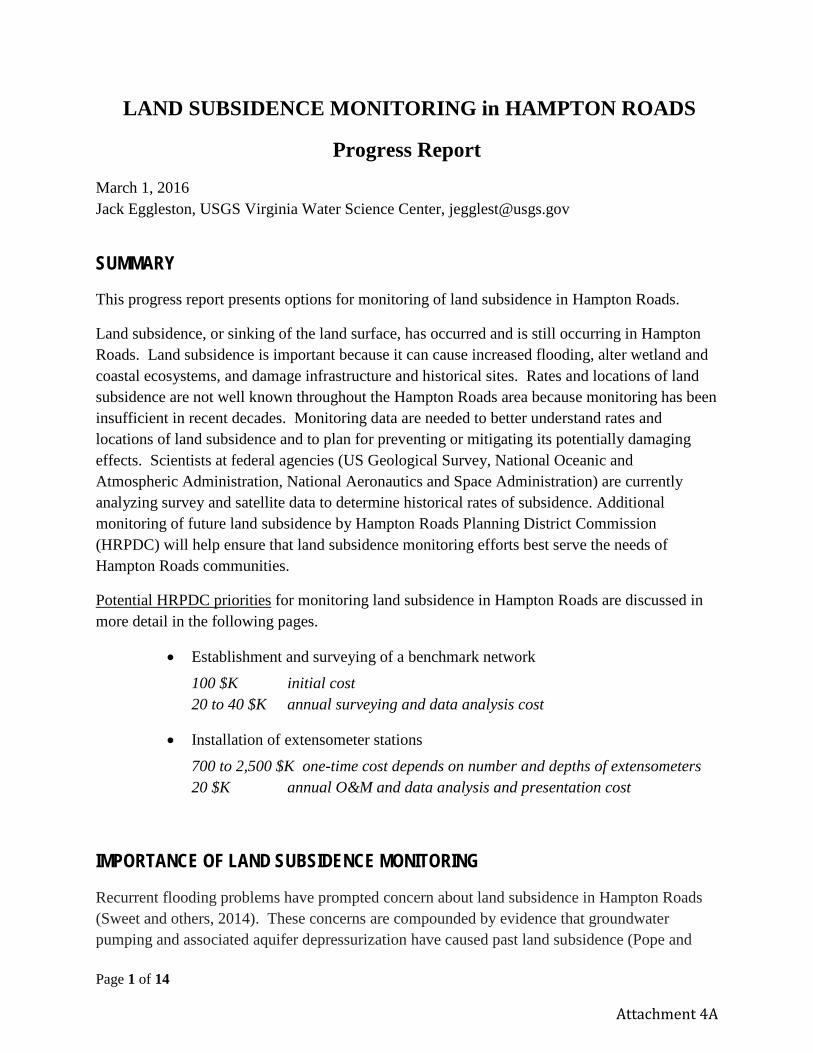
LAND SUBSIDENCE MONITORING in HAMPTON ROADS
Progress Report
March 1, 2016 Jack Eggleston, USGS Virginia Water Science Center, [email protected]
SUMMARY
This progress report presents options for monitoring of land subsidence in Hampton Roads.
Land subsidence, or sinking of the land surface, has occurred and is still occurring in Hampton Roads. Land subsidence is important because it can cause increased flooding, alter wetland and coastal ecosystems, and damage infrastructure and historical sites. Rates and locations of land subsidence are not well known throughout the Hampton Roads area because monitoring has been insufficient in recent decades. Monitoring data are needed to better understand rates and locations of land subsidence and to plan for preventing or mitigating its potentially damaging effects. Scientists at federal agencies (US Geological Survey, National Oceanic and Atmospheric Administration, National Aeronautics and Space Administration) are currently analyzing survey and satellite data to determine historical rates of subsidence. Additional monitoring of future land subsidence by Hampton Roads Planning District Commission (HRPDC) will help ensure that land subsidence monitoring efforts best serve the needs of Hampton Roads communities.
Potential HRPDC priorities for monitoring land subsidence in Hampton Roads are discussed in more detail in the following pages.
• Establishment and surveying of a benchmark network 100 $K initial cost 20 to 40 $K annual surveying and data analysis cost
• Installation of extensometer stations
700 to 2,500 $K one-time cost depends on number and depths of extensometers 20 $K annual O&M and data analysis and presentation cost
IMPORTANCE OF LAND SUBSIDENCE MONITORING
Recurrent flooding problems have prompted concern about land subsidence in Hampton Roads (Sweet and others, 2014). These concerns are compounded by evidence that groundwater pumping and associated aquifer depressurization have caused past land subsidence (Pope and
Attachment 4A
Page 2 of 14
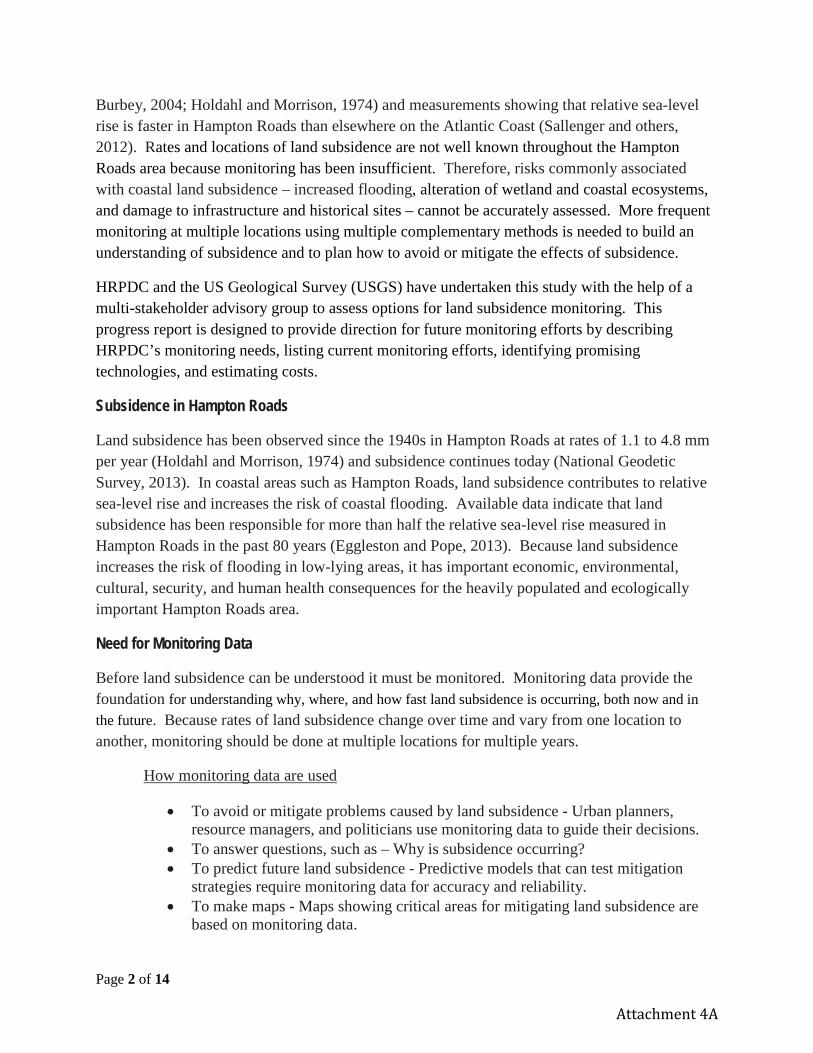
Burbey, 2004; Holdahl and Morrison, 1974) and measurements showing that relative sea-level rise is faster in Hampton Roads than elsewhere on the Atlantic Coast (Sallenger and others, 2012). Rates and locations of land subsidence are not well known throughout the Hampton Roads area because monitoring has been insufficient. Therefore, risks commonly associated with coastal land subsidence – increased flooding, alteration of wetland and coastal ecosystems, and damage to infrastructure and historical sites – cannot be accurately assessed. More frequent monitoring at multiple locations using multiple complementary methods is needed to build an understanding of subsidence and to plan how to avoid or mitigate the effects of subsidence.
HRPDC and the US Geological Survey (USGS) have undertaken this study with the help of a multi-stakeholder advisory group to assess options for land subsidence monitoring. This progress report is designed to provide direction for future monitoring efforts by describing HRPDC’s monitoring needs, listing current monitoring efforts, identifying promising technologies, and estimating costs.
Subsidence in Hampton Roads
Land subsidence has been observed since the 1940s in Hampton Roads at rates of 1.1 to 4.8 mm per year (Holdahl and Morrison, 1974) and subsidence continues today (National Geodetic Survey, 2013). In coastal areas such as Hampton Roads, land subsidence contributes to relative sea-level rise and increases the risk of coastal flooding. Available data indicate that land subsidence has been responsible for more than half the relative sea-level rise measured in Hampton Roads in the past 80 years (Eggleston and Pope, 2013). Because land subsidence increases the risk of flooding in low-lying areas, it has important economic, environmental, cultural, security, and human health consequences for the heavily populated and ecologically important Hampton Roads area.
Need for Monitoring Data
Before land subsidence can be understood it must be monitored. Monitoring data provide the foundation for understanding why, where, and how fast land subsidence is occurring, both now and in the future. Because rates of land subsidence change over time and vary from one location to another, monitoring should be done at multiple locations for multiple years.
How monitoring data are used
• To avoid or mitigate problems caused by land subsidence - Urban planners, resource managers, and politicians use monitoring data to guide their decisions.
• To answer questions, such as – Why is subsidence occurring? • To predict future land subsidence - Predictive models that can test mitigation
strategies require monitoring data for accuracy and reliability. • To make maps - Maps showing critical areas for mitigating land subsidence are
based on monitoring data.
Attachment 4A
Page 3 of 14
What land subsidence monitoring measures
• land surface motion • bedrock surface motion • changes in aquifer system thickness
Monitoring Methods
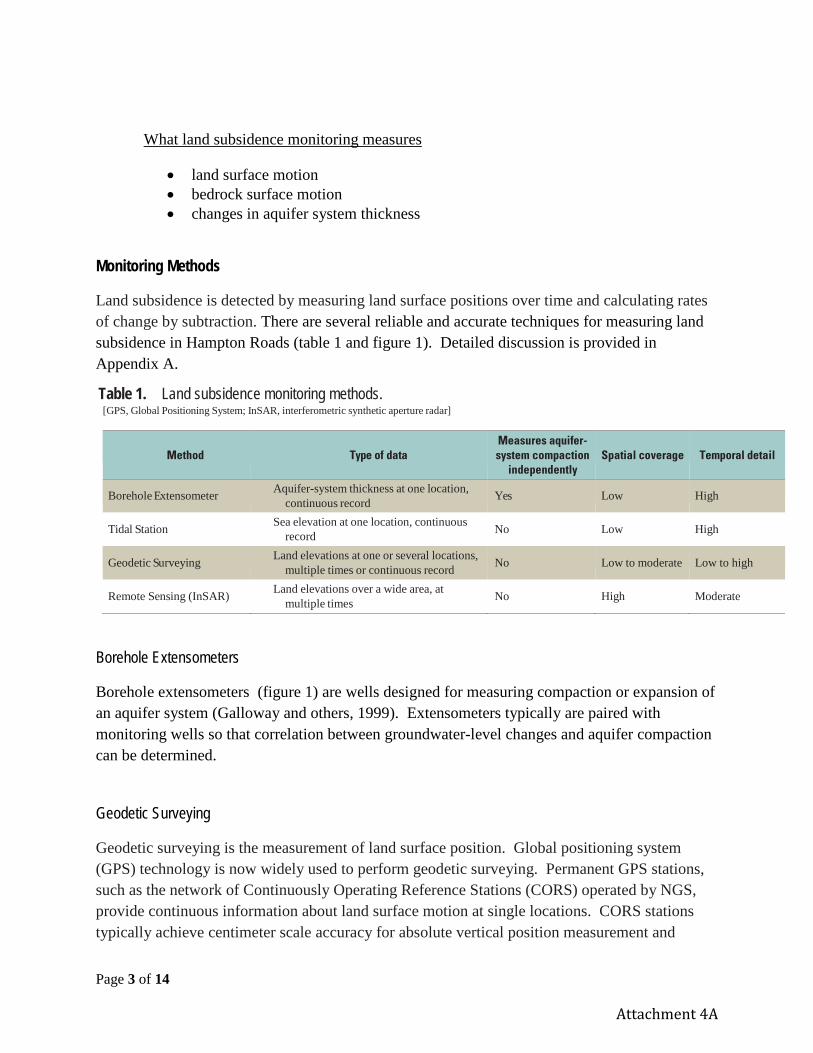
Land subsidence is detected by measuring land surface positions over time and calculating rates of change by subtraction. There are several reliable and accurate techniques for measuring land subsidence in Hampton Roads (table 1 and figure 1). Detailed discussion is provided in Appendix A.
Table 1. Land subsidence monitoring methods. [GPS, Global Positioning System; InSAR, interferometric synthetic aperture radar]
Method
Type of data
Measures aquifer- system compaction
independently
Spatial coverage
Temporal detail
Borehole Extensometer Aquifer-system thickness at one location, continuous record Yes Low High
Tidal Station Sea elevation at one location, continuous record No Low High
Geodetic Surveying Land elevations at one or several locations, multiple times or continuous record No Low to moderate Low to high
Remote Sensing (InSAR) Land elevations over a wide area, at multiple times No High Moderate
Borehole Extensometers
Borehole extensometers (figure 1) are wells designed for measuring compaction or expansion of an aquifer system (Galloway and others, 1999). Extensometers typically are paired with monitoring wells so that correlation between groundwater-level changes and aquifer compaction can be determined.
Geodetic Surveying
Geodetic surveying is the measurement of land surface position. Global positioning system (GPS) technology is now widely used to perform geodetic surveying. Permanent GPS stations, such as the network of Continuously Operating Reference Stations (CORS) operated by NGS, provide continuous information about land surface motion at single locations. CORS stations typically achieve centimeter scale accuracy for absolute vertical position measurement and
Attachment 4A

Page 4 of 14
millimeter scale accuracy for differential vertical position measurement. Permanent geodetic stations, such as CORS, also provide valuable information for calibrating remote sensing measurements of subsidence.
Survey networks, consisting of multiple high integrity monuments (benchmarks) that are installed on land and periodically occupied with GPS antennas to measure land surface position, can also provide valuable regional estimates of land subsidence. Dr. Philippe Hensel (NGS) has offered his expertise to help design and implement such a survey network for Hampton Roads.
A separate type of geodetic surveying that would be valuable for understanding land subsidence in Hampton Roads is using GPS antennas on bedrock wells to measure bedrock surface motion (figure 1). This can be done at any new extensometer that is constructed. Existing bedrock wells, such as those at Franklin and Suffolk, may also be available as platforms for this type of monitoring.
Remote Sensing
Interferometric Synthetic Aperture Radar (InSAR) is a remote sensing technique used to measure land surface elevation changes over wide areas, for example over the entire Hampton Roads area. InSAR can be used to determine and map critical areas of land subsidence, select locations for detailed geodetic surveying, and plan strategies for preventing and mitigating land subsidence (Bawden and others, 2003). Accuracy of InSAR subsidence estimates will be important in Hampton Roads, because subsidence rates in the area have been measured at 1.1 to 4.8 millimeters, as compared to typical error for InSAR of 5-10 mm. The high atmospheric humidity and dense vegetation found in Hampton Roads can reduce InSAR accuracy. Problems with error can be overcome by analyzing a large number of satellite scenes, applying persistent scatter analysis techniques, using InSAR data collected over multiple years, and by using L-band or X-band rather than C-band InSAR data.
ONGOING MONITORING ACTIVITIES in HAMPTON ROADS
Borehole Extensometers - Ongoing Monitoring 2016
No borehole extensometers were active in Hampton Roads from 1996 to 2016. However historic extensometer data are available, covering the period 1979 to 1995 for an extensometer located at Franklin, Virginia and 1982 to 1995 for an extensometer located at Suffolk, Virginia, (Pope and Burbey, 2004).
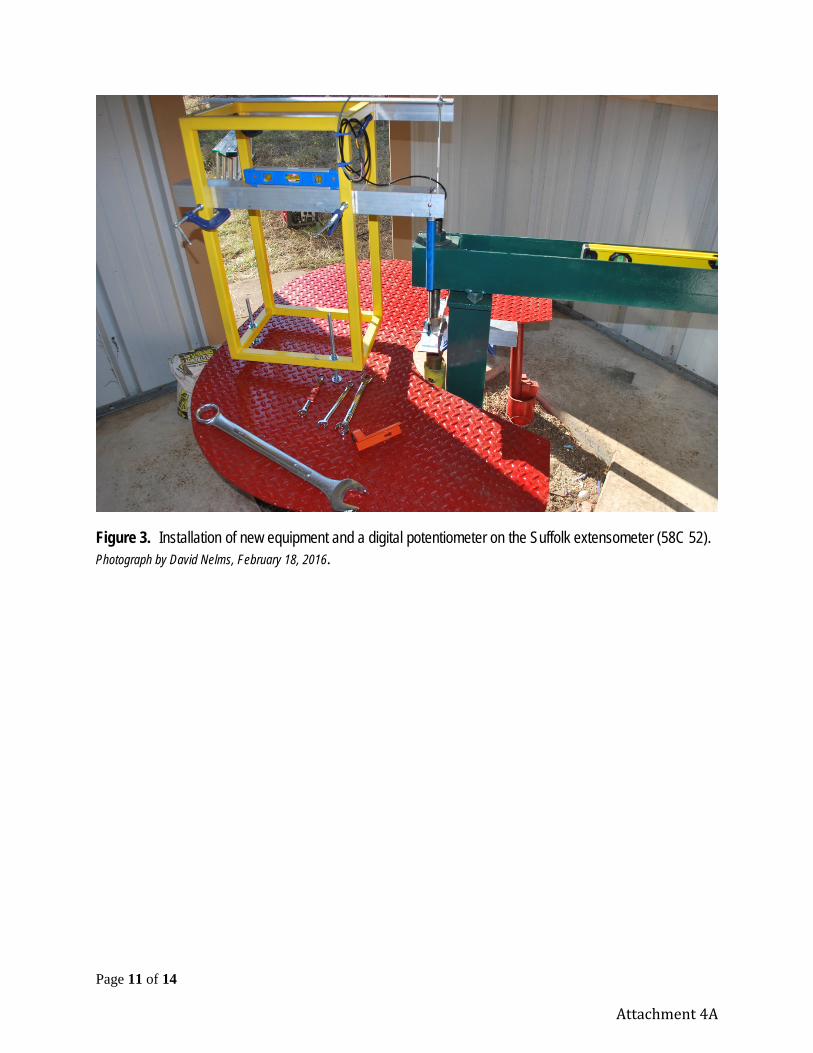
The older existing extensometers at Franklin (55B 60) and Suffolk (58C 52) (figure 2) have recently been equipped by the USGS with digital potentiometers, dial gages, and satellite telemetry (figure 3) to provide aquifer compaction measurements with sub-millimeter (0.01 mm)
Attachment 4A

Page 5 of 14
accuracy. Data are being collected to test if the extensometer stations can be reactivated to detect aquifer compaction and expansion. The extensometers will be monitored for several months and, if monitoring results are successful, the extensometers may be reactivated on a long-term basis. The possibility of installing GPS antennas on the extensometers, to determine contributions to subsidence from glacial isostatic rebound, will also be investigated.
Michelle Sneed, a USGS expert on subsidence and extensometers was brought in to consult on land subsidence monitoring options in Hampton Roads. She described how, in California, extensometers provide the basis for understanding how land subsidence is related to groundwater withdrawals, for calibrating InSAR estimates of land subsidence, and for calibrating predictive models of land subsidence. Extensometers there provide data used for water-resource planning and subsidence-mitigation planning.
Geodetic Surveying - Ongoing Monitoring 2016
The NGS, the lead US federal agency for surveying and geodetic science, operates the CORS network of benchmark stations that continuously record land surface positions in fine detail in 3-dimensions. The CORS network includes five benchmark sites in Hampton Roads. Data from these stations can be downloaded at http://www.ngs.noaa.gov/CORS_Map/.
Various other organizations have established continuous monitoring GPS antennas at benchmark stations in Hampton Roads that are not part of the CORS network. For example, the NASA Langley Research Center in Hampton, Virginia, established four benchmark sites with GPS antennas in 2015. In some cases, data from these non-CORS stations are available and, if a site has been constructed and operated following NGS guidelines (NGS, 2013b; Floyd, 1978), the resulting data can be of high quality and useful for subsidence calculation.
The NGS is currently (2016) analyzing historic surveys of first-order benchmark sites on the Atlantic Coast, including in Hampton Roads, to determine rates of subsidence over the past century. This study will produce maps of subsidence rates over multiple time periods.
Tidal Stations - Ongoing Monitoring 2016
Tidal stations operated by the National Oceanic & Atmospheric Administration (NOAA) have provided continuous water-level data for many decades at four sites in Hampton Roads (Appendix A). Data are publically available at no cost from NOAA’s website. Additional tidal stations are operated by the USGS and other agencies.
Remote Sensing - Ongoing Monitoring 2016
Remote sensing data are valuable because they enable detailed mapping of regional subsidence rates over time. The type of remote sensing data used to map subsidence, interferometric synthetic aperture radar (InSAR), has been collected for Hampton Roads by various satellites
Attachment 4A

Page 6 of 14
since 1992 (table 2) and is currently collected by several international satellites. In 2017 a new US satellite, NISAR, will collect InSAR data over Hampton Roads.
It appears that NOAA and perhaps other federal government agencies (NASA and USGS) will analyze historic InSAR data for Hampton Roads, including a NOAA effort planned for 2016 to to analyze InSAR data collected in 2008-2011. This work is beneficial and hopefully will be conducted on a regular basis in the future.
Table 2. Satellites with InSAR data collection capabilities and coverage of Hampton Roads
Satellite Origin Active Period
Hampton Roads Data Period
InSAR Data Type
Horiz. Resolutn.
Vertical Precision
Number of Frames / Scenes
Cost to Project
JERS Japan 1992-1998 1993-1998 L-Band 18m > 15 mm many frames 1 scene each free/$
ALOS Japan 2006-2011 2006-2011 L-Band 40 m > 15 mm 5 frames, >10 scenes each free/$
ALOS-2 Japan 2014- 2014-2015 L-Band 10-100 m > 15 mm 2 frames 2 scenes each free/$
SOACOM Argentina planned 2015 n/a L-Band - - - $$
NISAR US-India planned 2020 n/a L / S-band - - - free
RISAT-1 India 2012 - - C-Band >20m 5-10 mm - $$ RISAT-2 India 2009 - - X-Band <10m <5 mm - $$
Radarsat-1 Canada 1995-2013 2006-2008 C-Band 30 m 5-10 mm >20 scenes free
Radarsat-2 Canada 2007- 2008-2015 C-Band 30 m 5-10 mm >400 frames $$
ERS-1 Europe 1992-2000 1992-1996 C-Band 30 m 5-10 mm 2 frames (E-W) 14/16 scenes free
ERS-2 Europe 1995-2011 1995-2001 C-Band 30 m 5-10 mm 2 frames (E-W) 24/30 scenes free
Envisat-ASAR Europe 2002-2012 2007-2008 C-Band 30 m 5-10 mm
2 frames >5 scenes each free
Sentinel-1A Europe 2014- 2014-2015 C-Band 5 m 5-10 mm 1 frame, 3 scenes free
Cosmo-SkyMed Italy 2010- 2011-2015 X-Band 15 m <5 mm >200 scenes $$
TERRASAR-X TanDEM-X Germany 2010- 2011 X-Band 10 m <5 mm
1 frame, 3 scenes $$
KOMPSAT-5 Korea 2013- - X-Band 3 m <5 mm - $$ PAZ SAR - SeoSAR Spain planned 2015 - X-Band - - - $$
Attachment 4A

Page 7 of 14
POTENTIAL LAND SUBSIDENCE MONITORING PRIORITIES FOR HRPDC
Potential HRPDC priorities for land subsidence monitoring are as follows:
Priority 1 - Extensometers
Extensometers are a key component of land subsidence monitoring programs because they provide accurate data needed to understand aquifer compaction and to calibrate other types of subsidence measurements. The need for extensometers in Hampton Roads is particularly high because no extensometers are currently operating there. Extensometers would ideally consist of one or more wells with potentiometers, a GNSS (Global Navigation Satellite System) receiver, groundwater-level monitoring wells, satellite telemetry and, where applicable, a tidal gage.
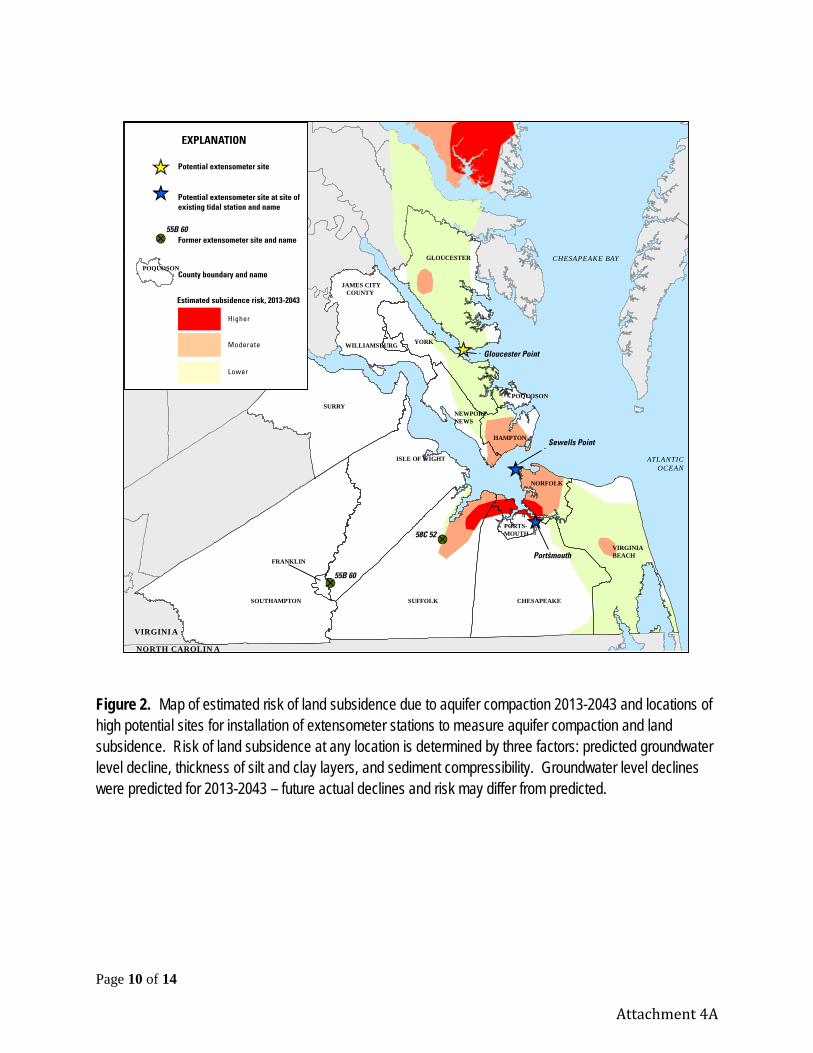
High potential sites for new extensometers in Hampton Roads are shown in figure 2. The estimated risk of subsidence in response to groundwater pumpage shown in figure 2 is based on the product of three variables: sediment compressibility, thickness of silt and clay layers, and predicted groundwater level declines. Predicted groundwater level declines are taken from Masterson and others (2016) in which actual groundwater withdrawals in 2008 were simulated as continuing at the same rates through the year 2043. The actual risk of future land subsidence may differ from predicted risk (shown in figure 2) because aquifer conditions are not perfectly known and actual groundwater level declines may differ from predicted declines. Existing tidal stations are high priority locations for new extensometer stations because they permit multiple complementary data types to be collected at one location.
Cost: The cost to install a single extensometer station in Hampton Roads is likely to be in the neighborhood of $1 million, with final costs depending mostly on the depth to bedrock. Annual recurring costs for site maintenance, operation, and data analysis are estimated at $20,000
Priority 2 - Benchmark Surveying
Establishment of a benchmark network would tie regional land surface motion in Hampton Roads to more stable land surface elevations in areas of Piedmont bedrock. For this proposed effort, mobile GPS antennas would be stationed for a week or more at multiple locations between the Piedmont and the Coastal Plain (e.g. Richmond to Virginia Beach). Mobile GPS antennas would be stationed annually at the benchmark sites for multiple years. The establishment of the network and annual collection of positional data could be a cooperative effort of regional partners (e.g. HRPDC, Old Dominion University, Virginia Institute of Marine Science, and others) and federal partners (e.g. USGS, NGS, NASA-Langley, and others). NGS has offered to coordinate establishment of the network study and to provide mobile GPS antennas for temporary use during the annual surveys.
Attachment 4A

Page 8 of 14
Cost: The cost to establish and initially survey a benchmark network is estimated to be $120,000. Annual recurring costs for repeat surveys and data analysis are estimated at $20,000-40,000
Attachment 4A
Page 9 of 14
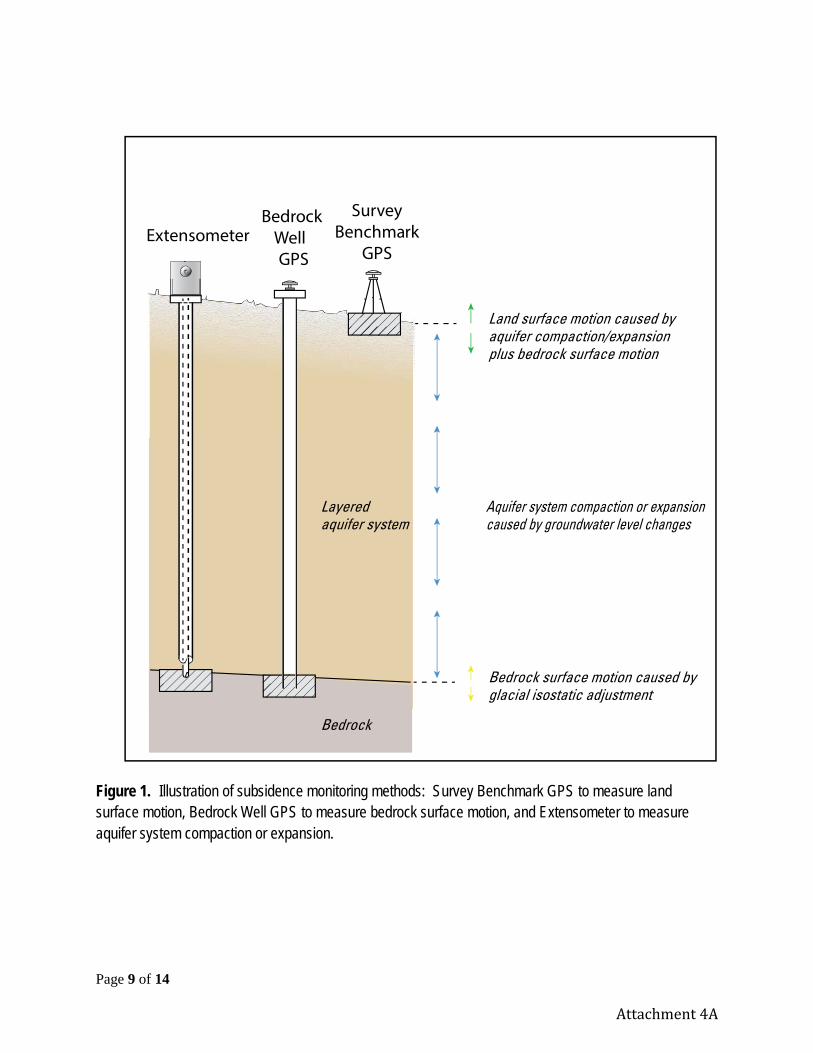
Figure 1. Illustration of subsidence monitoring methods: Survey Benchmark GPS to measure land surface motion, Bedrock Well GPS to measure bedrock surface motion, and Extensometer to measure aquifer system compaction or expansion.
Bedrock
Layeredaquifer system
Bedrock surface motion caused byglacial isostatic adjustment
Aquifer system compaction or expansioncaused by groundwater level changes
Land surface motion caused byaquifer compaction/expansionplus bedrock surface motion
SurveyBenchmark
GPSExtensometer
BedrockWellGPS
Attachment 4A
Page 10 of 14
Figure 2. Map of estimated risk of land subsidence due to aquifer compaction 2013-2043 and locations of high potential sites for installation of extensometer stations to measure aquifer compaction and land subsidence. Risk of land subsidence at any location is determined by three factors: predicted groundwater level decline, thickness of silt and clay layers, and sediment compressibility. Groundwater level declines were predicted for 2013-2043 – future actual declines and risk may differ from predicted.
EXPLANATION
Potential extensometer site
Former extensometer site and name
JAMES CITY COUNTY
Estimated subsidence risk, 2013-2043
Higher
Moderate
Lower
Potential extensometer site at site ofexisting tidal station and name
POQUOSONCounty boundary and name
POQUOSON
HAMPTON
GLOUCESTER
VIRGINIABEACH
NORFOLK
CHESAPEAKESUFFOLKSOUTHAMPTON
FRANKLIN
ISLE OF WIGHT
PORTS-MOUTH
SURRY
YORK
NEWPORTNEWS
WILLIAMSBURG
CHESAPEAKE BAY
ATLANTICOCEAN
VIRGINI A
NORTH CAROLIN A
55B 60
Portsmouth
Sewells Point
Gloucester Point
55B 60
58C 52
Attachment 4A
Page 11 of 14
Figure 3. Installation of new equipment and a digital potentiometer on the Suffolk extensometer (58C 52). Photograph by David Nelms, February 18, 2016.
Attachment 4A
Page 12 of 14
ABBREVIATIONS
CORS - Continuously Operating Reference Station
GNSS - Global Navigation Satellite System
GPS - Global Positioning System
HRPDC - Hampton Roads Planning District Commission
InSAR - Interferometric Synthetic Aperture Radar
NASA - National Aeronautics and Space Administration
NGS - National Geodetic Survey
NOAA - National Oceanic and Atmospheric Administration
USGS - United States Geological Survey
REFERENCES Bawden, G.W, Sneed, M., Stork, S.V., and Galloway, D.L., 2003, Measuring human-induced land subsidence from space: U.S. Geological Survey Fact Sheet 069-03, 4 p., http://pubs.usgs.gov/fs/fs06903/.
Eggleston, J.R., and Pope, J., 2013, Land subsidence and relative sea-level rise in the southern Chesapeake Bay region: U.S. Geological Survey Circular 1392, 30 p., http://dx.doi.org/10.3133/cir1392.
Floyd, R.P., 1978, Geodetic Bench Marks, NOAA Manual NOS NGS 1, US Dept of Commerce, National Oceanic and Atmospheric Administration, Rockville, MD, September 1978, 52 pp. [http://www.ngs.noaa.gov/PUBS_LIB/GeodeticBMs.pdf]
Galloway, D.L., Jones, D.R., and Ingebritsen, S.E., eds., 1999, Land subsidence in the United States: U.S. Geological Survey Circular 1182, 177 p., accessed October 19, 2015, at http://pubs.usgs.gov/circ/circ1182/.
Holdahl, S.R., and Morrison, N.L., 1974, Regional investigations of vertical crustal movements in the U.S., using precise relevelings and mareograph data: Tectonophysics, v. 23, no. 4, p. 373–390.
Attachment 4A

Page 13 of 14
Masterson, J., Pope, J., Fienen, M., Monti, J., Nardi, M., and Finkelstein, J., [2016 in review], Assessment of groundwater availability in the Northern Atlantic Coastal Plain aquifer system from Long Island, New York, to North Carolina: U.S. Geological Survey Professional Paper.
National Geodetic Survey, 2013a, IGS08 geodetic CORS positional antennae reference point (ARP) [GRS80 ellipsoid] computed velocities: National Oceanic and Atmospheric Admin., accessed March 3, 2013, at ftp://cors.ngs.noaa.gov/cors/coord/coord_08/igs08_geo.comp.txt.
National Geodetic Survey, 2013b, Guidelines for New and Existing Continuously Operating Reference Stations (CORS) National Geodetic Survey National Ocean Survey, NOAA Silver Spring, Maryland, January 2013. [http://www.ngs.noaa.gov/PUBS_LIB/CORS_guidelines.pdf]
Pope, J.P., and Burbey, T.J., 2004, Multiple-aquifer characterization from single borehole extensometer records: Ground Water, v. 42, no. 1, p. 45–58.
Sallenger, A.H., Doran, K.S., and Howd, P.A., 2012, Hotspot of accelerated sea-level rise on the Atlantic Coast of North America: Nature Climate Change, v. 2, no. 12, p. 884–888.
Sweet W., Park J., Marra J., Zervas C., Gill S., 2014, Sea Level Rise and Nuisance Flood Frequency Changes around the United States, NOAA Tech. Report NOS CO-OPS 073, 58 pp. http://tidesandcurrents.noaa.gov/publications/NOAA_Technical_Report_NOS_COOPS_073.pdf
Attachment 4A

Page 14 of 14
APPENDIX A
USGS Circular 2013-1392, Land Subsidence and Relative Sea-Level Rise in the Southern Chesapeake Bay Region
Attachment 4A