Embed Size (px)
Citation preview

Land Productivity Dynamics in Europe
Towards a Valuation of Land
Degradation in the EU
Cherlet M., Ivits E., Sommer S., Tóth G., Jones A., Montanarella L., Belward A.
2013
EUR 26500 EN

This publication is a Science for Policy report by the Joint Research Centre (JRC), the European Commission’s
science and knowledge service. It aims to provide evidence-based scientific support to the European policy-
making process. The scientific output expressed does not imply a policy position of the European Commission.
Neither the European Commission nor any person acting on behalf of the Commission is responsible for the use
which might be made of this publication.
Contact information
Name: Michael Cherlet
Address: Joint Research Centre, Via Enrico Fermi 2749, TP 440, 21027 Ispra (VA), Italy
E-mail: [email protected]
Tel.: +39 0332789982
JRC Science Hub
https://ec.europa.eu/jrc
JRC80540
EUR 26500 EN
PDF ISBN 978-92-79-35427-4 ISSN 1831-9424 doi:10.2788/70673
Luxembourg: Publications Office of the European Union, 2013
© European Union, 2013
Reproduction is authorised provided the source is acknowledged.
How to cite: Cherlet M, Ivits-Wasser E, Sommer S, Toth G, Jones A, Montanarella L, Belward A. Land-Productivity
Dynamics in Europe - Towards Valuation of Land Degradation in the EU; EUR 26500; doi: 10.2788/70673
All images © European Union 2013, except: P.27 Figure 17 source: Wikipedia; p. 33 photo source: Odense
Title Land productivity dynamics in Europe – towards valuation of land degradation in the EU
Abstract
This document reported first results on the assessment and evaluation of land‐ productivity dynamics and
showed initial examples on the added value of integrating contextual information. Such information that is
needed to derive final judgments related to the land degradation situation in contribution to the implementation
of the RIO+20 target of a ‘land degradation neutral world’. We documented that, based on satellite time-series
observations; the dynamics of the land-productivity can be mapped for the EU27. Using this basis information to
analyze incidence with potential drivers of land degradation, such as unsustainable exploitation or e.g. soil
erosion, to compile convergence of evidence allows interpreting the land‐ productivity dynamics in the light of
identifying and mapping on-going land degradation. This spatial evaluation also highlighted that, in the frame of
the ‘neutral land degradation world’ discussion, area percentages of decline and increase
In land-productivity cannot straightforwardly be counterbalanced as these areas can have totally different actual
and optional Land uses as well as economic and cultural values.

Land Productivity Dynamics in Europe
Towards a Valuation of Land Degradation in
the EU
Cherlet M., Ivits E., Sommer S., Toth G., Jones A., Montanarella L.,
Belward A.
Joint Research Centre
Institute for Environment and Sustainability
Land Resource Management Unit


An Assessment of Land Productivity Dynamics in the EU
i
Table of Contents
EXECUTIVE SUMMARY ........................................................................................................... i
1 POLICY DEMAND REGARDING LAND DEGRADATION IN EUROPE ......................... 1
2 LAND DEGRADATION – DEFINITION FRAMEWORK .................................................. 2
3 ASSESSING LAND DEGRADATION................................................................................ 4
4 TOWARDS SYNOPTIC ASSESSMENT OF LAND DEGRADATION IN EUROPE ........ 6
4.1 Introduction .............................................................................................................. 6 4.2 Assessment of land productivity dynamics in Europe ................................. 7
4.2.1 Introduction ....................................................................................................... 7 4.2.2 Land productivity dynamics in Europe ....................................................... 8
4.3 Evaluating land productivity dynamics in the context of land
degradation ..................................................................................................................... 14 4.3.1 Integrating explanatory information ................................................................... 14
4.3.2 Land productivity dynamics in relation to principal European land cover
types/uses .................................................................................................................................. 17
4.3.3 Land productivity dynamics in relation to soil productivity levels in
croplands ................................................................................................................................... 21
4.3.4 Examples of cause-effect relationships in Europe .......................................... 28
4.3.4.1 Meteorological events....................................................................................... 28
4.3.4.2 Soil processes: e.g. soil erosion ...................................................................... 32
4.3.4.3 Land management intensity: proximate through N surplus ................... 37
4.3.4.4 Land take and soil sealing: ............................................................................. 44
4.4 Effects of policy strategies and future options ......................................... 48 4.4.1 High Nature Value (HNV) farmland ....................................................................... 48
4.4.2 Natura 2000 ................................................................................................................ 51
5 CONCLUSIONS .............................................................................................................. 54
6 OUTLOOK – RIO+20 ..................................................................................................... 57
An Assessment of Land Productivity Dynamics in the EU
ii
References ........................................................................................................................... 60

An Assessment of Land Productivity Dynamics in the EU
i
EXECUTIVE SUMMARY
Land degradation and desertification adversely affect food production and
security, water security, energy security, biodiversity, and many ecosystem
services. Land degradation is the persistent reduction or loss of the biological
and economic productivity of land. Causes and consequences of land
degradation have multiple characteristics and vary within space, scale and
context; hence measuring land degradation is a very complex and
multifaceted problem that needs to address biophysical and societal
processes.
In the context of this study, land productivity is calculated by combining long-
term changes with the current levels of efficiency of factors that define
standing biomass conditions. Derived from satellite observations between
1982 and 2010, land productivity is a good reflection of the status of the
supporting and main regulating ecosystem services on which provisioning and
cultural services are based. This report introduces a regional land
productivity dynamics map which can serve as a basis for analysing issues
that influence the condition of biomass, such as land use, climate and soil
characteristics. This process of further integrating thematic and/or area-
specific information, including societal aspects, will ultimately lead to a
comprehensive land degradation assessment.
This report illustrates the first steps of integrating global layers with
adapted local knowledge, based on a concept which was developed for the
new World Atlas of Desertification.
What causes land degradation in Europe?
Key causes of land degradation in the European Union (EU) include
inappropriate agricultural intensification, soil sealing, agro-silvo-pastoral
land abandonment, loss of productive land, ecosystem fragmentation,
pollution and increased frequency of climatic extremes that affect the
condition and functioning of soil and vegetation.
Agricultural intensification does not always lead to land degradation. But
pressure on land can engender degradation processes that can negatively
impact the functioning of ecosystems and provoke soil erosion, salinisation,
soil carbon content depletion, soil compaction and even the collapse of
grazing and/or crop productivity.
Land covered by concrete, tarmacadam and other elements of our expanding
human infrastructures prevents productive land from delivering provisioning
ecosystem services. Soil sealing cuts off the land’s supporting ecosystem
service potential and degrades the productive capacity of the landmass. This
is an increasingly pressing issue, as the demands for food, fuel and fibre are
increasing. It also compromises other natural land functions, such as surface-
atmosphere gas, water and energy exchanges, and negatively affects soil
conditions and overall biodiversity.

An Assessment of Land Productivity Dynamics in the EU
ii
When used for forestry, grazing or growing crops, land is usually carefully
managed, although a decline in land productivity can occur due to a range of
stresses at the local or landscape level. When land is abandoned, factors such
as reduced spatial complexity, soil erosion or shrub encroachment, along with
the associated increase in the frequency and intensity of fires and changes in
nutrient input, can decrease the agro-silvo-pastoral value of the land.
Climate variability exacerbates the human impacts described above and
exerts its own pressure on the natural system. Extreme meteorological
events (e.g. drought, intense rains, windstorms) are likely to increase in
frequency and intensity. Vegetation productivity and soil stability and health
are directly affected by these extremes, thus magnifying, accelerating and
even driving land degradation.

An Assessment of Land Productivity Dynamics in the EU
iii
Where in Europe is land degradation a problem?
10% (about 2 million ha) of the EU’s most productive soils show early signs
of a decline in land productivity
Nowhere in Europe is fully immune to land degradation, but some regions are
more susceptible than others. As noted above, land degradation is caused by
interconnected biological, physical, social and economic drivers; these
complex interactions present significant challenges to measuring land
degradation. Because land productivity - the measure of the dynamics and
efficiency of standing biomass - is exploited for biological products of
economic value and is influenced by human-environment interactions, this
study uses change patterns in land productivity as a base upon which
biophysical and societal information is added in order to deduce ongoing land
degradation.
A decline in land productivity can be a first indication of ongoing land
degradation processes - but stable or even increasing land productivity is not
necessarily an indication of the absence of land degradation. Using a range of
daily observations from Earth observing satellites (between 1982 and 2010),
the JRC has developed a standardised methodology for mapping land
productivity dynamics capable of delivering comparable results across
Europe.
The drivers (e.g. the effects of agricultural intensification, extreme
meteorological events, and soil erosion) can have both positive and negative
changes, as can be deduced by combining the abovementioned remote-sensing
analysis with socio-economic and other physical data such as meteorological
measurements, soil surveys, land cover, land use, yield and demographic data.
This allows for the identification of where and why land productivity is
changing, where threats are greatest and where conditions are improving.
The study confirms that land productivity is declining in some locations
across almost all EU Member States; the hot, dry Mediterranean countries are
undoubtedly highly susceptible, but so too are the colder, wetter northern and
eastern parts of Europe to some degree. We estimate that 85.1% of the total
EU area is currently unaffected by land productivity decline, 7.9% shows a
land productivity that is stable but stressed, 5.6% shows early signs of land
productivity decline, and 1.5% (6,037,500 ha) is in decline (table 1, figures 3
and 4).
Focusing on agricultural areas, a more diverse picture emerges: less than 1%
(112,500 ha) of EU arable land, and even less of EU pastureland (0.2%), is in
decline (tables 2a and 2b). Arable land in the EU contains soils of widely
different quality. About 10% of the EU’s most productive soils show early
signs of land productivity decline, whilst 15% of the least productive soils
fall into this category (table 3).
In contrast, the study has also found an almost 15% increase in land
productivity for the EU as a whole (table 1), with forests and semi-natural
areas accounting for almost half of this.

An Assessment of Land Productivity Dynamics in the EU
iv
It must be noted that this study’s mapping and assessment of land
productivity dynamics focuses on ongoing processes. Land productivity
dynamics are therefore only depicted with respect to change since 1982,
when daily satellite observations began. Knowledge about actual ongoing
processes is more relevant to mitigation and adaptation decision making than
to strategies aimed at the restoration of degraded lands. Furthermore, at the
spatial resolution of the satellite observations used to calculate land
productivity (5 km by 5 km), land cover often appears to be heterogeneous,
even though it may include different land cover types. This integrates
combined productivity in blocks of 2,500 ha. This resolution cannot capture
individual field- or plot-level processes, such as erosion, organic matter
decline, etc., or provide the detail needed to study localised situations, such
as small Natura 2000 sites. However, the satellite observation data are
unique in providing continuous, repetitive and synoptic landscape information
on the actual status of and changes in the standing biomass, which reflects
the functioning of the ecosystem for the entire EU from 1982 to date.
What are the consequences of land degradation?
Productive land is effectively a non-renewable resource on human time scales
Degraded land has less capacity to provide food, fuel and fibre than
unaffected areas. In general, degraded land has reduced biodiversity and
changed (though not necessarily reduced) biophysical attributes – the roles of
degraded and unaffected land in the climate system can be quite different as
a result of changed albedo, water and gas-cycling properties and even
surface roughness. Degraded land could turn into a source of carbon
emissions and thereby contribute to global warming. One of the prime
consequences is that the natural productivity of the land decreases –
sometimes to such an extent that recovery is constrained by
physical/chemical conditions and/or beyond economic feasibility. Global
estimates quote economic losses of 7-12% of agricultural production due to
land degradation. Losing land and land productivity can be disastrous as land
is effectively a non-renewable resource on human time scales. With the
exception of the occasional volcanic island and land reclaimed from water
bodies, the land area is fixed. As it can take well over 100 years to generate
a single centimetre of soil in temperate grasslands, soil lost to erosion
(figures 19 to 22) or sealing cannot be easily replaced within a human
lifespan. Secondary effects, such as the collapse of rural communities,
migration, and feedback on the climate system are felt far beyond the
directly affected areas and people. Off-site impacts are not negligible and
land degradation must not be considered a localised problem.

An Assessment of Land Productivity Dynamics in the EU
v
The RIO+20 Conference committed to strive for a land
degradation neutral world, but is European land degradation
neutral?
The United Nations Conference on Sustainable Development (RIO+20) target
of ‘neutrality’ aims to prevent land degradation and restore degraded lands.
Recognising that some land degradation is probably inevitable, the RIO+20
target allows for land restoration to compensate for land degradation. This
first evaluation suggests that almost all EU Member States are affected by
declining land productivity to some degree. Yet, without a fully accepted
indicator, we cannot definitively confirm whether or not the EU is land
degradation neutral.
A reduction in land degradation will lead to increased productivity and new
economic opportunities, help secure rural labour markets through alternative
and sustainable land use options, and help safeguard ecosystem services,
including the land’s climate system, water-regulation capacity and
biodiversity functions. The degradation of ecosystems is – to a large extent –
induced by unsustainable human activities. This puts people at the very
centre of the issue and requires them to take responsibility and action.
Understanding the value of ecosystems and their services is essential in
order to construct preventative solutions and conservation methodologies
that deliver socio-economic benefits. Sustainable land management is a
viable option for prevention and conservation and has been implemented in a
wide diversity of geographical and economic contexts. Achieving land-
degradation neutrality is not so much desirable as essential.
By avoiding the pitfalls of unsustainable agricultural intensification (figures
24 and 25), by improving spatial planning, in particular infrastructure and
housing (to make maximum use of brownfield sites, cut back on the sealing of
productive soils, etc.), by encouraging rural communities to develop
sustainable practices and by pursuing an effective fight against climate
change, Europe could reach a land degradation neutral state.
What can be done?
Efficient use of the land means managing trade-offs between human
needs and the long-term capacity of the ecosystem to provide goods
and services.
Systematic information gathering (mapping, measuring and monitoring)
provides scientific evidence, such as that outlined in this report, on which to
build and implement policies to reduce land degradation and improve
rehabilitation in priority areas. Our capacity for such information gathering is
improving; new satellite observations are available with improved spatial
resolution over those used in this study, and repeatable methodologies can
process these into meaningful products as illustrated in this report. Well-
established and functioning global networks of land degradation experts are
An Assessment of Land Productivity Dynamics in the EU
vi
in place in the framework of the World Atlas of Desertification and the
European Soil Bureau Network, and archives of validated information are
growing.
Efficient use of the land should be based on managing trade-offs between
human needs and the long-term capacity of the ecosystem to provide goods
and services. Unsustainable land management has visible and measurable
negative outcomes, beyond productivity loss, which can be mapped. The
effects of land management practices can be quantified by adding the
economic valuation of land and its associated ecosystem services. Such
holistic assessment will facilitate more informed decision making and
encourage the development of sustainable solutions, in line with the
transition to a green economy and resource efficiency. Land degradation
science provides a basis for these evidence-based policies.
Though no specific land degradation legislation is in place at the EU level,
policies such as the Soil Thematic Strategy, regional development, the
Common Agricultural Policy (CAP) reform, the Water Framework Directive, the
EU 2020 Biodiversity Strategy and the Economics of Land Degradation (ELD)
initiative increasingly consider the abovementioned approach and
acknowledge the need for cross-sectorial integration.
This document is based on the initial results of ongoing scientific
research. It should not be considered as definitive or exhaustive.
An Assessment of Land Productivity Dynamics in the EU
1
1 POLICY DEMAND REGARDING LAND DEGRADATION IN
EUROPE
In its final document entitled “The future we want”, the delegations to the
United Nations Conference on Sustainable Development (RIO+20, held in Rio
de Janeiro, Brazil, 20-22 June 2012) recognised the need for urgent action to
reverse global land degradation. It set a target of striving for a land-
degradation neutral world in the context of sustainable development.
This involves being aware of where and at what intensity land degradation
occurs, and the location of areas that should be conserved, protected or
restored, in order to assess and manage trade-offs between direct
human/social needs and continental/global equilibrium, in view of maintaining
sufficient ecosystem productivity.
Systematic mapping, measuring and monitoring, based on a robust scientific
and technical knowledge base such as that outlined in this report, are needed
to provide evidence on land degradation. Such information is needed to
develop and implement policies to reduce land degradation and improve
rehabilitation. The European capacity for such information gathering is
improving through the development of long-term archives of validated
thematic information and new high-resolution satellite observations.
The efficient use and preservation of land should be based on managing
trade-offs between human needs and the long-term capacity of the
ecosystem to provide necessary goods and services. Unsustainable land
management has visible and measurable negative outcomes which go beyond
agricultural productivity losses. The effects of land management practices
can be quantified by adding an economic valuation of land to a valuation of
the associated ecosystem services that land provides. Such holistic
assessments of costs and benefits will facilitate more informed decision
making and encourage the development of sustainable solutions, thus making
it an integral element of policy and planning processes in line with the
transition of the private and public sectors to a green economy.
In a Communication published at the onset of the Year of Biodiversity (Comm
(2011)244), European Union (EU), Member States committed to develop, with
the assistance of the European Commission, a set of biophysical maps of
ecosystem services of key importance at the EU level by the end of 2020.
These maps should identify the spatial differences in ecosystem services
supplied by all ecosystems in the EU, including semi-natural and agricultural
systems which fall outside the Natura 2000 network but which contribute to
green infrastructure.
An Assessment of Land Productivity Dynamics in the EU
2
Although there is currently no specific land degradation legislation within the
EU, policies such as the Soil Thematic Strategy, regional development, the
Common Agricultural Policy (CAP) reform, the Water Framework Directive,
the EU 2020 Biodiversity Strategy and the Economics of Land Degradation
(ELD) initiative increasingly consider the abovementioned approach,
acknowledging the need for cross-sectorial integration. Although final
solutions still need to be found, land-degradation science, such as that
provided in this report, provides a sound basis for evidence-based policies.
2 LAND DEGRADATION – DEFINITION FRAMEWORK
Land
This study investigates land under the perspective of the United Nations
Convention to Combat Desertification (UNCCD) definition which refers to land
as “the terrestrial bio-productive system that comprises soil, vegetation,
other biota, and the ecological and hydrological processes that operate within
the system” (Article 1 of the UNCCD). Of course, this includes all human
interactions with the environment.
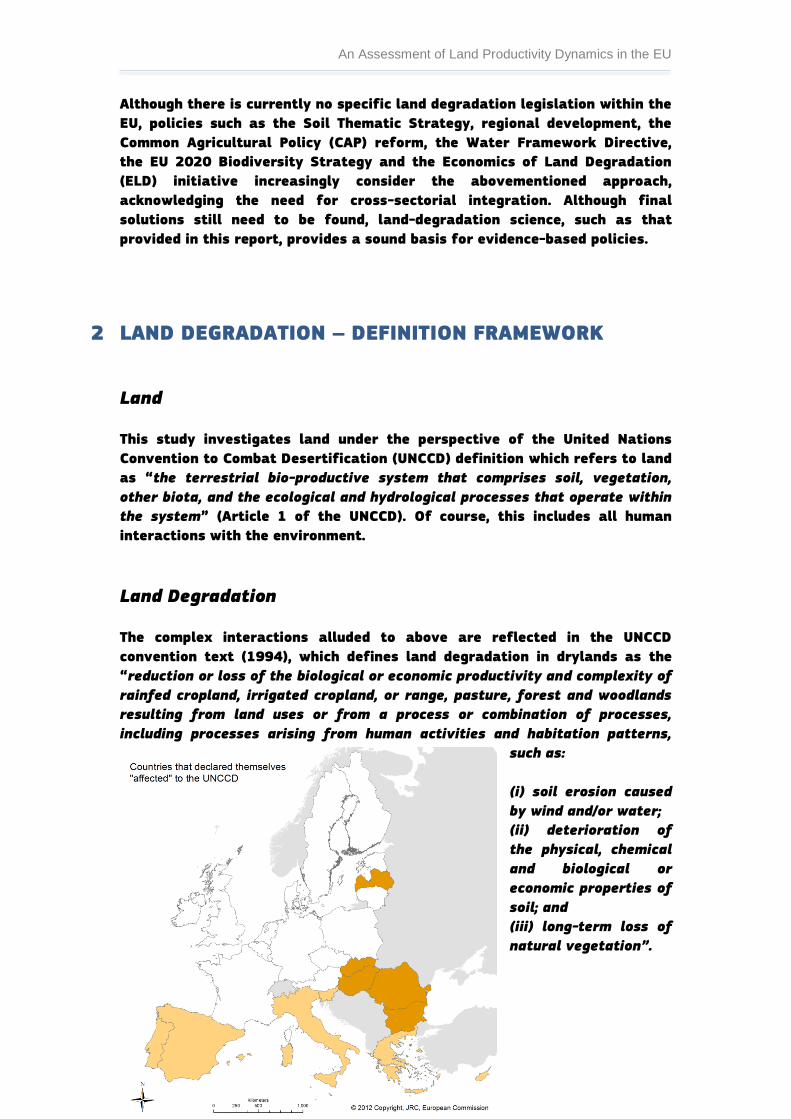
Land Degradation
The complex interactions alluded to above are reflected in the UNCCD
convention text (1994), which defines land degradation in drylands as the
“reduction or loss of the biological or economic productivity and complexity of
rainfed cropland, irrigated cropland, or range, pasture, forest and woodlands
resulting from land uses or from a process or combination of processes,
including processes arising from human activities and habitation patterns,
such as:
(i) soil erosion caused
by wind and/or water;
(ii) deterioration of
the physical, chemical
and biological or
economic properties of
soil; and
(iii) long-term loss of
natural vegetation”.

An Assessment of Land Productivity Dynamics in the EU
3
Figure 1: EU countries that declared themselves to the UNCCD as being ‘affected’ by
land degradation (under Annex 4 in light shade and Annex 5 in darker shade)
While the abovementioned UNCCD definition contains geographical
restrictions, effectively limiting areas under consideration to ‘drylands’,
there has been much argument in recent years to favour the global dimension
of land degradation. The first scientific conference of the UNCCD Committee
on Science and Technology (held in 2010 in Buenos Aires, and co-organised by
the European Commission’s Joint Research Centre) reconfirmed the fact that
land degradation and desertification adversely affect global food production
and security, water security, energy security, global biodiversity, and many
ecosystem services. Land degradation and desertification also compromise
associated recreational, world heritage and cultural values. In preparation
for the conference, a group of experts (Dryland Science for Development,
WG1, http://dsd-consortium.jrc.ec.europa.eu) revisited and reformulated the
UNCCD definition and recommended the following:
(a) Desertification is an end state of the process of land degradation;
this process is expressed by a persistent reduction or loss of biological
and economic productivity of lands that are under uses by people
whose livelihoods depend, at least partly, on this productivity, yet the
reduction or loss of this productivity is driven by that use.
(b) Combating desertification means addressing all stages of land
degradation including those that precede the level of productivity loss
specific to desertification, the one for which reclamation, rather than

An Assessment of Land Productivity Dynamics in the EU
4
rehabilitation measures are required for restoring the persistently lost
productivity of the land.
(c) Land degradation and desertification, as described in (a) and (b),
require attention in all lands, with special concern directed to all
drylands, namely those of climate yielding an aridity index ≤ 0.65,
whether based on 1950-1980 prevailing climate, and/or on more recent
climate data.
Whilst reaffirming that drylands are deserving of ‘special concern’, this
revisited definition recognises land degradation as a truly global problem and
provides a basis for global and continental assessments. Consequently, this
study covers the whole of the EU.
3 ASSESSING LAND DEGRADATION
Land degradation and desertification are complex phenomena. Land
degradation is driven by multiple factors6,7,8,9. Causes and consequences of
land degradation have manifold interacting characteristics that vary within
space, scale and context. Hence, the measurement of land degradation is a
very complex multifaceted task that needs to address both biophysical and
societal processes. Such considerations have been clearly asserted in recent
science-based paradigms such as the Dryland Development Paradigm (DDP8).
In past decades, EU-funded research has addressed many of the
abovementioned issues, focusing on developing methodologies for monitoring
and assessing land degradation processes (e.g. MEDALUS, LADAMER,
DESURVEY) as well as approaches to map and evaluate sustainability
options, ecosystem services and sustainable land management techniques
that prevent and mitigate land degradation and desertification (e.g. IP
SENSOR, MEDACTION, DESIRE).
The work presented in this report builds on key findings of the
abovementioned research and on scientific collaboration in the compilation
of the new World Atlas of Desertification (WAD), which was initiated and is
coordinated by JRC in partnership with the United Nations Environment
Programme. The WAD assessment and mapping methodologies are adapted
for global scale studies, expanding from dryland areas only, as described in
the 1994 UNCCD definition. The report documents the application of the first
steps of the WAD assessment framework and provides a baseline information
layer for further EU-wide assessment.
Addressing the abovementioned definition and conceptual discussion, this
report introduces a spatial continuous base layer of ‘land productivity
An Assessment of Land Productivity Dynamics in the EU
5
dynamics’. ‘Land productivity’ in this context is defined as an expression of
the bio-productivity resulting from all land components and their
interactions, and is not only related to human activities and direct land use.
Land productivity is therefore not to be confused with agricultural
productivity. The report illustrates that, in order to identify and attribute
land degradation ‘causes’ and ‘effects’, further biophysical and societal
information is needed from multiple ancillary data sources. Integration
analysis is outlined in some examples.
The low- and medium-resolution satellite remote sensing imagery used for
this study cannot capture single field-level processes, but it is unique in
providing repetitive and synoptic information and in observing ‘land’ at
kilometre scales. This intrinsically allows ‘land’ to be perceived as a
functional unit. The satellite measurement is therefore an expression of all
climate-soil-water-human interactions that condition the functioning and
status of the heterogeneous land cover observed. ‘Land’ is considered in its
most holistic sense. This study builds on this basic concept.
Against this background, the ‘land-degradation neutrality’ target set at the
RIO+20 Conference in June 2012 would be achieved if persistent reduction or
loss of the land’s biological and economic productivity were matched by
persistent increases or gains in the land’s biological and economic
productivity. But what exactly can be balanced against what? Can a
productivity decrease in one area be balanced by an increase elsewhere? This
report seeks to contribute to this discussion.

An Assessment of Land Productivity Dynamics in the EU
6
4 TOWARDS A SYNOPTIC ASSESSMENT OF LAND
DEGRADATION IN EUROPE
4.1 Introduction
Land degradation is a complex and dynamic phenomenon and is therefore
difficult to monitor and assess1. Regional assessment approaches have so far
been largely empirical with a focus on biophysical symptoms2. However,
recent scientific advances suggest that assessments need to integrate
biophysical and social sciences, address multi-scale aspects and integrate
various indicators that reflect slow and fast processes. The basic assessment
and mapping concept that was developed for compiling a new World Atlas of
Desertification3 (WAD) is based on these approaches. The current report
applies the methods developed for the production of the WAD, as shown in
figure 2.
Firstly, the state of ecosystem productivity related to land degradation and
desertification is mapped through satellite observations gathered over a
twenty-nine year period. Relevant satellite observations started in 1982, and
observations up to 2010 were available by the time this research activity got
underway. This provides roughly 35 million observations of 5 km x 5 km cells
of the entire EU for this period. At this spatial resolution (25 km²) the
satellite observations, from which land productivity is calculated, effectively
comprise a mix of land use and cover types, including agriculture, urban,
forest, water, etc. This integration captures the productivity of all these
surfaces conditioned by humans and the environment in blocks of 2,500 ha.
This level of resolution cannot capture individual field- or plot-level
processes, such as erosion, organic matter decline, soil sealing, etc., nor is it
appropriate for studying localised situations, such as small Natura 2000
reserves. However, the data are unique in providing continuous, repetitive
and synoptic observed information on the status and changes of the
vegetative cover for the entire EU.
The condition and dynamics of vegetation are also a good proxy for the
structure and functioning of the ecosystem4, for example, by measuring its
response to variations in soil quality, climate influence or human-induced
land use and land use changes. For each satellite-based observation point,
the standing biomass, which is the total biomass of a given area at a given
moment in time, is calculated every year for the entire 1982 to 2010
observation period. Long-term changes and fluctuations in the standing
biomass are calculated5 and combined with measures of deviations from
current locally defined maximum productivity levels, which are in turn
derived from a higher spatial resolution (1 x 1 km) dataset compiled from
observations of the ‘Vegetation’ sensors on Europe’s SPOT satellites,
spanning the period 2006 to 2010. This combination is the basis for
determining land productivity dynamics6. For each 5 km by 5 km square we

An Assessment of Land Productivity Dynamics in the EU
7
can measure whether stable, declining or improving standing biomass
dynamics have led to land productivity conditions that are at or below the
current local potential. The latter is either a natural potential, a potential
determined by human land use, or a combination of both. Whilst not an
absolute measure of land productivity, this robust approach does provide a
consistent, uniform and repeatable index that can be used to flag areas of
concern and identify areas of improvement.
The revisited UNCCD definition of land degradation centres on the notion of a
persistent reduction or loss of biological and economic productivity of lands
used by people whose livelihoods, in general, depend on this productivity7. To
capture this land use aspect, the satellite-derived evidence is combined with
other data and information layers to address land change and land
management processes. This convergence of evidence allows for a more
complete interpretation of observed land productivity dynamics in terms of
land degradation or improvement. Initial results for the EU are presented in
this report.
4.2 Assessment of land productivity dynamics in Europe
4.2.1 Introduction
According to the concept of interacting human-environment systems8 ,
‘ecosystem services’ are created by human activity and demands.
Anthropogenic impacts, and changes over time, define the trends and the
current potential of any ecosystem to supply these services. These demand-
driven services tap into available ecosystem structures, which represent a
vital natural resource, and affect the functioning of the ecosystem. The
dynamics of the Earth’s biomass cover, or standing biomass, is a good
expression of the general level of the potential of land to supply, or keep on
supplying, ecosystem services. Assessing vegetative-cover dynamics
approximates a measure of general productivity levels of the land or human-
environment system. Land users exploit this land productivity to produce
biological products of economic value9. Land productivity reflects climatic
constraints, the overall quality of the land, and how efficiently the soil and
other resources were used, and indirectly indicates the level at which these
resources are appropriated for human use, i.e. is the land used for
intensive/extensive agriculture, for grazing, forestry or urban development?
Hence, land productivity dynamics can indicate levels of sustained land
quality and are therefore used as first step in the assessment of land
degradation. For example, a decrease in overall land productivity could be
expected to indicate a decline in or degradation of land quality (e.g.
vegetation, soil and water quality and/or quantity, crop production levels).
Whether this is related to land degradation or, for example, land use change,
would then need to be further explored.

An Assessment of Land Productivity Dynamics in the EU
8
Figure 2: Simplified schematic overview of the processing and interpretation scheme
for assessing and mapping land degradation at regional and global scales4, 5 (based on
the WAD Implementation Plan 3)
This assessment of the loss in overall productivity conforms to the
abovementioned definitions of land degradation. However, analysis of long-
term changes and current efficiency levels of vegetative or standing biomass
combined into a land productivity dynamics product is only a first step. The
results need to be further integrated with more detailed additional
information that reflects climatic and/or societal information such as local
land use processes, changes in land use practices and/or yield outputs,
population movements, etc. This integrative analysis is needed to obtain a
holistic interpretation of possible ongoing land degradation that explains the
biophysical dynamics in relation to anthropogenic activities. This section
presents the first step, the assessment of land productivity dynamics. The
following sections will integrate other critical factors at play when analysing
the various situations.
4.2.2 Land productivity dynamics in Europe
Figure 3 shows the land productivity dynamics for the EU as calculated from
satellite observations. The term ‘land productivity’ effectively refers to

An Assessment of Land Productivity Dynamics in the EU
9
variations in the rate, quantity and timing of the standing biomass
production of an ecosystem. Factors that influence ecosystem biomass
production include climate and climate variation, ecosystem structural
elements (such as altitude, slope, soil and all the life-supporting
characteristics of the soil), type of biomass and of course human interaction
(such as urban, forest, agriculture or pastoral activities).
The map shows changing dynamics over the period 1982 to 2010 as a
combination of long-term change and short-term evaluation of the efficiency
of an area that produces sustained levels of standing biomass, compared to
average conditions. The starting point is thus the state of the ecosystem in
1982. The level of detail of the satellite-based information introduces
advantages, such as landscape-scale approaches, and some limitations that
need to be considered during further interpretation, such as the impossibility
of directly observing field-level processes.
Satellite observations are based on 5 km by 5 km squares. In the European
context, a 25 km2 area (2,500 ha) will, in all likelihood, be heterogeneous in
terms of land cover types. Even in regions with dense agriculture, forest or
pasture, such an area will contain combinations of land cover, including
housing, infrastructure and sometimes water, bare rock and ice surfaces.
Hence, land productivity is an expression of the combined changes that occur
in such area in terms of overall standing biomass production. Care must be
exercised in interpreting this new metric. It provides a consistent overview
but, given the measurement scale, cannot be used for highly localised
decision making. Land productivity is an indication of the level of sustainable
land use, calculated as the relationship between land quality in general
productive terms and what is obtained as output.
Figure 3 shows five classes of land productivity levels. For example, the
class: “declining productivity” is assigned to areas that (a) have shown
evidence of prevailing downward trends in standing biomass over the twenty-
nine-year observation period and (b) show a current production efficiency
that is below their potential. The latter is calculated by determining the
deviation of its Cyclic Fraction metric (which expresses the net biomass
production of a growing season) from a maximum production level for a
growing season (established within contextual homogeneous ecosystem units
using higher-resolution data for a baseline window of five years).
Although signs of declines and increases in land productivity are found
throughout the EU territory, this does not necessarily indicate land-
degradation neutrality. To establish this condition, an assessment by
contextual analysis in relation to the major land degradation issues in Europe
is required. Key land degradation issues in Europe include inappropriate
agricultural or pastoral intensification, soil sealing, soil erosion, agro-silvo-
pastoral land abandonment and increased frequency of climatic extremes
that impact the vegetation and/or condition and functioning of the soil.
Therefore, the signs of declines and increases in land productivity need to be

An Assessment of Land Productivity Dynamics in the EU
10
evaluated with respect to their association to one or more of these land
degradation issues. Ecosystem types and related land use options need to be
included in the trade-offs.
Figure 3: Land productivity dynamics as calculated from long-term satellite-derived
observations of land productivity combined with current levels of productivity
performance. This map is a base layer that indicates areas with declining, stable or
improving land productivity dynamics that can/need to be further scrutinised to get
insight into the possible causes and effects of land degradation processes.
Decline, or its early signs, in land productivity can be caused by processes
such as meteorological extremes such as droughts (and the related increased
fires risk), or floods, by climate variability resulting in changes to the start
and/or end of the growing season, or abnormally warmer or colder periods
Assessment of land productivity dynamics in the EU (1982-2010)

An Assessment of Land Productivity Dynamics in the EU
11
that cause plant stress. In densely populated areas, a decline in land
productivity may be due to loss of soil or productive land that is caused by
expanding infrastructure rather than lower biomass production per surface
area unit. In agricultural areas (croplands and pasture), land productivity
decline may be attributed to the loss of semi-natural vegetation converted
into agriculture or other land use changes. Overgrazing may be a factor, and
other changes in land management can also cause a decline in production
(e.g. cultivated varieties producing less biomass, changes in fertiliser regime,
irrigation and land drainage). It is possible that some approaches to crop
production that may result in lower biomass can, in the longer term,
contribute to improving soil conditions, e.g. organic farming. When opposite
processes are present (e.g. wetter periods, regeneration of semi-natural
vegetation, expansion of forests or crop varieties that produce more
biomass, such as maize compared to wheat), an increase in land productivity
can be observed. All variations between the above mentioned situations are
observed over Europe and are mapped accordingly, as shown in figure 3.
Examples are given in this report but these do not yet constitute the
exhaustive analysis required to come to a final conclusion on land-
degradation neutrality in Europe. First statistical results of a pan-European
assessment of land productivity dynamics, mapped in figure 3, are listed in
table 1.
Land productivity dynamics in the European Union (as % of the area)
Declining
productivity
Early signs of
decline
Stable but
stressed
Stable, not
stressed
Increasing
productivity
1.5
5.6
7.9
70.2
14.9
Table 1: Percentage of area of the EU belonging to the five land productivity dynamics
classes represented in in figure 3.
70.2% of the EU territory shows stable land productivity dynamics. In these
areas, productivity can fluctuate according to land cover and land use
variations, but the overall level of productivity has remained stable
throughout the observation period. Appropriate levels of management and
economic sustainability are assumed. Some 14.9% of the EU (an area slightly
more than twice the size of Italy) showed an observable increase in land
productivity during the 1982-2010 period. However, it is important to
remember that this land productivity dynamics assessment focuses on
mapping ongoing processes. Thus, land that was degraded or in very poor
condition prior to the 1980s (the start of measurements) may well appear as
being stable or even improving – the 14.9% improvement (in area) also
An Assessment of Land Productivity Dynamics in the EU
12
includes locations that effectively started from a very low level of
productive standing biomass.
The land productivity of 15% of EU territory (an area of about 620,000 km2 -
equivalent to that with improving land productivity) is found to be stable but
with some signs of stress or showing early signs of decline or is in decline.
These areas have markedly different ecosystem characteristics, different
actual land use, and diverse land use potential and options. All of these areas
might be cause for concern. Within this category, 7.9% of the EU is observed
to have had a stable situation for the twenty-nine years until 2010, but for
the 2006-2010 period, land productivity was observed to be substantially
below its natural potential. These areas were marked as being ‘stable but
stressed’. Further analyses will be necessary to identify and qualify the
stress factors.
Some 5.6% of the EU area shows early signs of decline in land productivity,
for which the contextual analysis will result in an estimated impact in terms
of land degradation. For a small area (1.5% of the EU - only slightly smaller
than Latvia, but still representing some 6 million hectares), a clear long-term
land productivity decline was observed. The importance of this 1.5% will be
clarified further in the document by establishing where this actually occurs.
Figure 4 shows that areas in western Europe where intensive agriculture
traditionally has been a major land use have relatively more territory under
stress or showing early signs of decline than most of the areas in eastern
Europe. Areas where land productivity is in decline are mostly (but not
exclusively) to be found in the Mediterranean region.

An Assessment of Land Productivity Dynamics in the EU
13
Figure 4: Assessment of land productivity dynamics as a share of EU Member States’
size. Land productivity dynamics are calculated from satellite observations of long-
term changes of land productivity (1982-2010) combined with current levels of
performance (2006-2010)
In terms of land-degradation neutrality, the RIO+20 target of ‘neutrality’
aims at keeping productive land stable with sustained, or even increasing,
economic production. Looking only at land surfaces percentages, the land
productivity budget for the EU seems neutral, but considering that the
decrease or increase in land productivity occurs in distinct human-
environment systems with diverse land uses and geographical locations,
these differences cannot be cancel each other out. The next chapter
documents this in more detail. However, this first evaluation suggests that
Europe is not land-degradation neutral.
Analysis indicates that 15% of the EU land area is showing increased land
productivity. An area of 7.1% shows early signs of decline or actual decline
in land productivity. As mentioned above, the land use options and related
trade-off values for food production or economic produce are not always
Assessment of land productivity dynamics in the
EU (1982-2010)

An Assessment of Land Productivity Dynamics in the EU
14
comparable. Data on agricultural areas (cropland and pasture) tell a
different story: less than 1% of EU arable land and even less of EU
pastureland (0.2%) is coincident with declining land productivity, but more
than 11% of permanent crops (mainly tree crops) fall into the declining land
productivity category (tables 2a and 2b).
The difference in land cover types where decline and/or increase in land
productivity occurs is very visually apparent in figures 5 and 7 below.
4.3 Evaluating land productivity dynamics in the context of
land degradation
4.3.1 Integrating explanatory information
Complex processing of regular space-based observations provides an
assessment of the land productivity dynamics that is a proxy expression of
the sustained land quality status. This substantially advances assessments
as to whether, and where, potential land degradation processes are ongoing.
Research outcomes of the past decade10 indicate that further contextual
information is needed on the various issues at play in order to interpret land
degradation processes. In other words, more understanding has to be sought
on where and why the assessed change in land productivity is really critical
in terms of land degradation. Once this is known, trade-offs can be evaluated
on which to base mitigation strategy planning.
Within the Human-Environment (H-E) system, components interact and their
transitions, such as land use change, can create pressures that drive the H-E
system into less desired states, leading to land degradation. These forces are
limited11 and can be grouped into a number of global scale ‘issues’ which
include:
Aridity and drought
Biomass production
Water availability
Soil related aspects (erosion, salinisation, sealing,
contamination, etc.)
Changing population densities and movements
Urban sprawl
Grazing mismanagement
An Assessment of Land Productivity Dynamics in the EU
15
Inappropriate/unsustainable agricultural practices
This report addresses a limited number of prevailing issues that are
important to land degradation in Europe. For example, readily available
datasets are integrated with the synoptic assessment for further evaluation.
Multiple issues need to be analysed when evaluating land productivity
dynamics in the light of assessing land degradation or desertification. This is
true when evaluating local areas of interest, but also when carrying out
Europe-wide evaluations of land-degradation neutrality. Area statistics
cannot always be directly compared nor combined. For example, it is
important to know whether areas showing early signs of decline are in or
outside both High Nature Value farmland areas and high productive soil
areas in order to value these signs in terms of land-degradation neutrality.
It should be stressed again that the mere extent of areas within different
land productivity dynamics classes cannot be compared in a straightforward
manner as their ecosystems can be completely dissimilar and their land use
potential or value can be very different.
The sections below provide a first contextual analysis with some example
datasets.

An Assessment of Land Productivity Dynamics in the EU
16

An Assessment of Land Productivity Dynamics in the EU
17
4.3.2 Land productivity dynamics in relation to principal European
land cover types/uses
In the EU, land showing a decline in land productivity, early signs of decline
or that is ‘stable but stressed’, can be associated with intensive or
intensified land use systems such as arable land, permanent crops or
intensively managed pasturelands.
Agricultural areas constitute about 40% of the EU land surface, and some of
these areas are showing signs of stress or decline.
The same land productivity dynamics classes can represent completely
different situations in different parts of Europe in terms of the importance
and potential of the ecosystem as related to food production capacity, soil
quality, economic potential conservation efforts or cultural aspects. For the
evaluation of land-degradation neutrality it is essential to distinguish land
productivity situations for the various types of European land cover. The
Corine200012 land cover map was used to examine areas that are more or
less affected by a decline in land productivity or land cover types for which
an increase in productivity is observed. The share of each land productivity
dynamics class by land cover type in the EU is listed in table 2a. The portion
of each land cover type within the respective land productivity dynamics
class in listed in table 2b.
Percentage distributions of land productivity dynamics show a comparable
pattern within all land cover type classes (table 2a). A stable productivity
situation is predominant for all land cover types. Permanent crops and
pastures are slightly less dominant in the ‘stable, not stressed’ class, at
around 58%. Permanent crops are significantly more prominent in the
‘declining’ class, at 11.8%. A significant share (25.2%) of pastures fall
within the ‘increasing productivity’ class.
For the arable land of the EU, some 83% fall under the ‘stable, not stressed’
(73.3%) or increasing (9.6%) land productivity dynamics classes. Some signs
of stress are apparent in 9.2% of the EU arable area while 7.3% show early
signs of decline. A decline in land productivity is observed in 0.7% of the
arable area. This is half the surface where productivity decline was
estimated EU-wide (see table 1), but still represents an area of about 4.5
times the size of Luxembourg.

An Assessment of Land Productivity Dynamics in the EU
18
Note that land productivity is not conceptually the same as, and is not
necessarily directly related to, agricultural production. Low-resolution
imagery introduces a considerable amount of heterogeneity, and standing
biomass production is not to be equalled with crop production.
Permanent crops, tree crops and vines, are the land cover types for which the
largest portion is in decline, at 11.8%. This is notably higher than the EU
average for all classes of 1.5% under decline (table 1). During the 1982-2010
period, intensification of olive and citrus cultivation with little or no
undercover (as practiced in the Mediterranean area) certainly influences this
figure. Furthermore, early signs of decline are observed over another 9.2% of
the permanent crop area while over 9.6% fall under the ‘stable but stressed’
land productivity class.
72.1% of the EU’s forests and semi-natural areas (including natural
grasslands) show ‘stable, not stressed’ land productivity, while for 16.6%,
land productivity is increasing.
Figures 5, 6 and 7 show the share of land productivity dynamics types per
country using Corine Land Cover classes: early signs of decline (figure 5),
‘stable but stressed’ (figure 6) and increasing land productivity (figure 7). In
most EU countries, the areas showing the largest observed decline in land
productivity are found under managed lands (i.e. arable and pastures). The
pie charts indicate that countries such as Ireland, the UK and France have
extensive areas of pastures that show a decline in or stress on land
productivity.
Figures 5 and 7 illustrate that the typology of areas showing improved land
productivity dynamics are, or can be, completely different from areas where
land productivity is in decline. Most of the improvement is observed over
semi-natural areas while the declining areas correspond mostly to
agriculture productive area. The latter are areas that are critical for food
production. These lands should be kept very productive. Hence, a direct
comparison of area statistics in view of evaluation ‘land degradation
neutrality’ can be misleading and typology needs to be considered.
Lands under forest and semi-natural land cover show the largest observed
signs of decline or stress in countries with less arable and pasture lands. In
such countries, the total area of these land productivity classes can be
relatively small (see figure 4). A total of 9.4% and 8.2% of the territories of
Sweden and Finland respectively show signs of decline or with ‘stable,
stressed’ land productivity, while these figures are 26.7% and 36% for the
territories of France and Portugal respectively. For analysis purposes, the
Corine forest class was aggregated to include the semi-natural and natural
grasslands, which are spatially a major class in northern and Mediterranean
countries.

An Assessment of Land Productivity Dynamics in the EU
19
Land cover types
Land productivity
dynamics Arable land
Permanent
crops Pastures
Forests and
semi-
natural
areas
other
declining 0.7 11.8 0.2 1.4 2.5
early signs of
decline 7.3 9.2 4.1 4.1 7.1
stable but stressed 9.2 9.6 12.1 5.8 8.3
stable, not stressed 73.3 58.7 58.4 72.1 66.2
increasing
productivity 9.6 10.7 25.2 16.6 15.9
Table 2a: EU land productivity dynamics within different land cover types (as % of the
EU land surface; based on Corine2000)
Land productivity class
Land
cover
types
declinin
g
Early signs
of decline
stable but
stressed
stable, not
stressed
increasing
productivity
Arable
land 13.9 38.4 34.2 30.6 18.8
Permanen
t crops 19.7 4.0 3.0 2.0 1.7
Pastures 1.4 6.3 13.1 7.1 14.4
Forests
and semi-
natural
areas
40.7 31.2 31.8 44.1 47.6
Other 24.3 20.1 17.9 16.2 17.5
Table 2b: EU land cover types within the land productivity dynamics classes (as % of
the EU land surface; based on Corine2000)
Selected classes from the Corine2000 database are: Arable land, permanent
crops, pastures, forests and semi-natural areas; Other = heterogeneous
agricultural areas, open spaces, water and artificial surfaces

An Assessment of Land Productivity Dynamics in the EU
20
Figure 5: Land cover types (grouped) showing early -signs of declining land
productivity dynamics in the EU Member States (the pie charts indicate the land cover
types that show early signs of land productivity decline as a % of the total area of
each country)

An Assessment of Land Productivity Dynamics in the EU
21
Figure 6: Land cover types (grouped) showing stable but stressed land productivity
dynamics in the EU Member States (the pie charts indicate the land cover types under
stable but stressed land productivity decline as a % of the total area of each country)
Figure 7: Land cover types (grouped) showing increasing land productivity dynamics in
the EU Member States (the pie charts indicate the land cover types showing increasing
land productivity dynamics as a % of the total area of each country)
4.3.3 Land productivity dynamics in relation to soil productivity
levels in croplands
10.2% of the most productive cropland soils in the EU show a decline, or
early signs of decline, in land productivity, while 14.2% show ‘stable but
stressed’ land productivity.
Around 7% of average productive cropland soils and around 15% of the least
productive cropland soils show a decline, or early signs of decline, in land
productivity.
(Considering an EU-wide classified range of soil productivity for croplands).
In general, the good soils of Western European and Mediterranean countries
are more affected than are those of Northern or Eastern European countries.
An Assessment of Land Productivity Dynamics in the EU
22
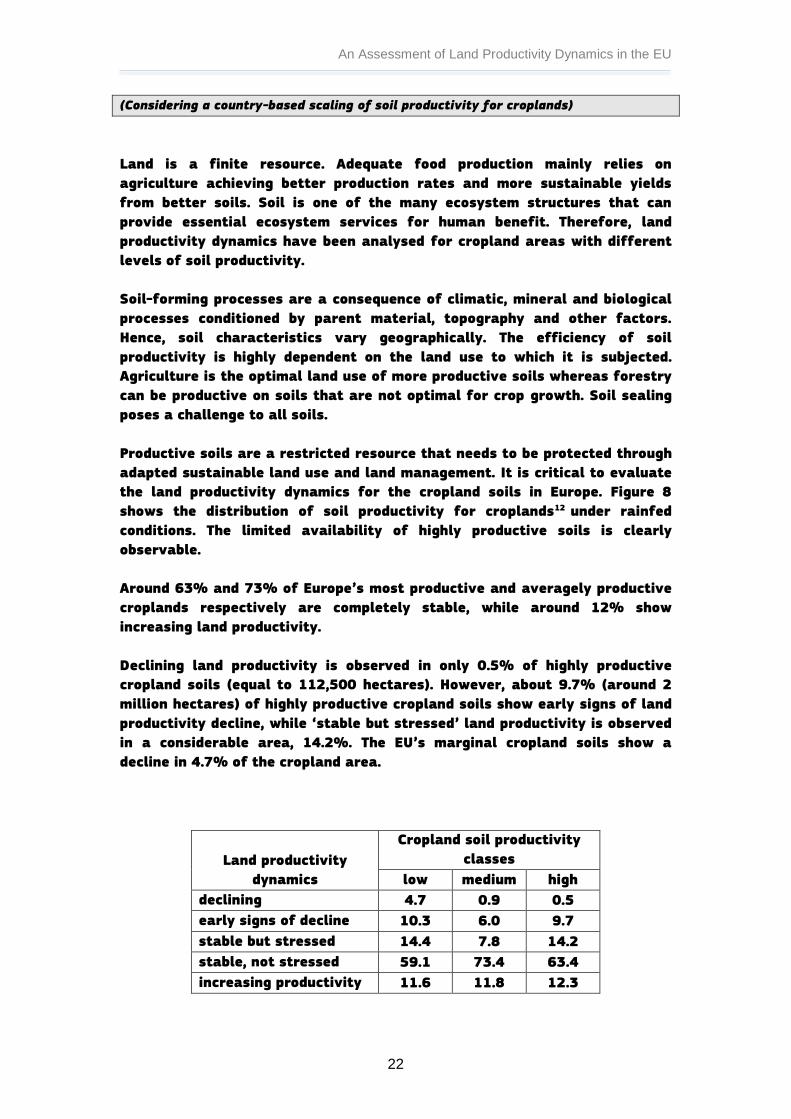
(Considering a country-based scaling of soil productivity for croplands)
Land is a finite resource. Adequate food production mainly relies on
agriculture achieving better production rates and more sustainable yields
from better soils. Soil is one of the many ecosystem structures that can
provide essential ecosystem services for human benefit. Therefore, land
productivity dynamics have been analysed for cropland areas with different
levels of soil productivity.
Soil-forming processes are a consequence of climatic, mineral and biological
processes conditioned by parent material, topography and other factors.
Hence, soil characteristics vary geographically. The efficiency of soil
productivity is highly dependent on the land use to which it is subjected.
Agriculture is the optimal land use of more productive soils whereas forestry
can be productive on soils that are not optimal for crop growth. Soil sealing
poses a challenge to all soils.
Productive soils are a restricted resource that needs to be protected through
adapted sustainable land use and land management. It is critical to evaluate
the land productivity dynamics for the cropland soils in Europe. Figure 8
shows the distribution of soil productivity for croplands12 under rainfed
conditions. The limited availability of highly productive soils is clearly
observable.
Around 63% and 73% of Europe’s most productive and averagely productive
croplands respectively are completely stable, while around 12% show
increasing land productivity.
Declining land productivity is observed in only 0.5% of highly productive
cropland soils (equal to 112,500 hectares). However, about 9.7% (around 2
million hectares) of highly productive cropland soils show early signs of land
productivity decline, while ‘stable but stressed’ land productivity is observed
in a considerable area, 14.2%. The EU’s marginal cropland soils show a
decline in 4.7% of the cropland area.
Land productivity
dynamics
Cropland soil productivity
classes
low medium high
declining 4.7 0.9 0.5
early signs of decline 10.3 6.0 9.7
stable but stressed 14.4 7.8 14.2
stable, not stressed 59.1 73.4 63.4
increasing productivity 11.6 11.8 12.3

An Assessment of Land Productivity Dynamics in the EU
23
Table 3: Land productivity dynamics for European classes of soil productivity
for croplands (as % of cropland productivity classes).
The map shown in figure 8 and its related statistics in table 3 are based on a
re-grouped ten-class ranking of soil productivity called the Cropland
Productivity Index (CPI13) combined with the land productivity dynamics
index14. They are valid for the EU as a whole, where the productivity of
marginally, average and most productive cropland reflects the EU-wide range
of soil quality levels.
There is regional variation within the EU-wide soil productivity classes. The
relative importance of soils for crop growth and food production is most
evident at the national level. The soil productivity of croplands was therefore
scaled per country in figures 12-14, which illustrate the land productivity
dynamics for each country’s least, average and most productive cropland
soils.

An Assessment of Land Productivity Dynamics in the EU
24
Figure 8: Soil productivity of rainfed croplands at the EU level. (grey is either no
cropland or outside the EU)
Whilst on the European scale practically none (only 0.5%) of the most
productive cropland soils show a decline in land productivity, this does not
hold entirely true for individual Member States when soil productivity is
assessed per country (figures 12-14).
Over 9.4% of the most productive area in Spain shows declining land
productivity. Early signs of decline are observed in 50% of the most
productive soils in Portugal, and in 14.7% and 9% of such soils in France and
Hungary respectively. ‘Stable but stressed’ land productivity is observed in
around 30%, 21.5% and 25% of the best cropland soils of Belgium, France
and Italy respectively. The land productivity has remained completely stable
in all the most productive cropland soils of Latvia and Finland, and most of
those of Germany (83%), Romania (86.8) and most other countries during the
twenty-nine year period. 71.4% of Slovenia’s best soils show increasing land
productivity.

An Assessment of Land Productivity Dynamics in the EU
25
Figure 9: Incidence of land productivity dynamics with low soil productivity for
croplands at the EU level
Figure 10: Incidence of land productivity dynamics with medium soil productivity for
croplands at the EU level
An Assessment of Land Productivity Dynamics in the EU
26
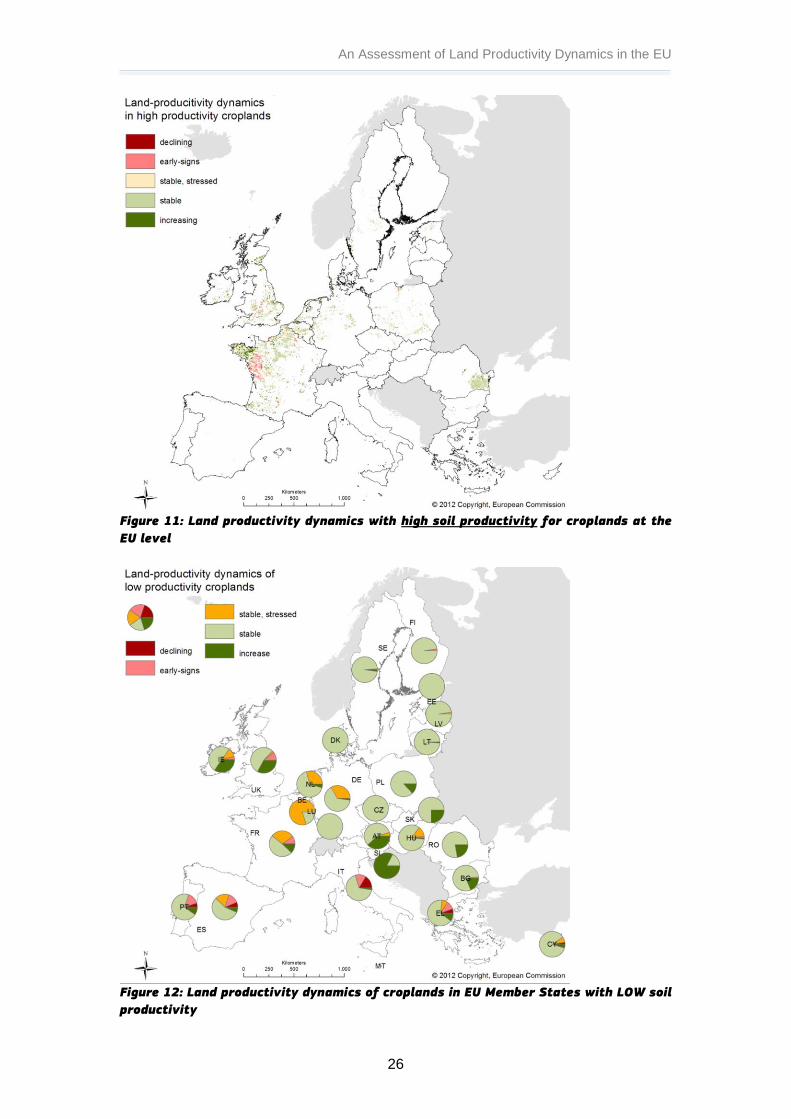
Figure 11: Land productivity dynamics with high soil productivity for croplands at the
EU level
Figure 12: Land productivity dynamics of croplands in EU Member States with LOW soil
productivity

An Assessment of Land Productivity Dynamics in the EU
27
(defined relative to the range within each separate Member State)
Figure 13: Land productivity dynamics of croplands in EU Member States with MEDIUM
soil productivity (defined relative to the range within each separate Member State)

An Assessment of Land Productivity Dynamics in the EU
28
Figure 14: Land productivity dynamics of cropland sin EU Member States with HIGH
soil productivity (defined relative to the range within each separate Member State)
4.3.4 Examples of cause-effect relationships in Europe
The previous sections investigate the land productivity dynamics in Europe as
first level information within the analytical framework of an evaluation of
land degradation. This explores, although not yet exhaustively, where specific
dynamics take place in the EU and what ecosystem structures are affected in
terms of land cover and cropland soils. In order to complete this valuable
overview, contextual information is needed to appraise possible causes of
land degradation.
Many factors play a role in the complexity of ‘land degradation’, especially
where biophysical and socio-economic aspects interact. Climatic,
meteorological, anthropogenic and biophysical processes are all potential
causes or effects, but they all interact very differently at regional and local
scales.
The following section evaluates a few examples of potential causal factors
at EU level and illustrates a few local examples.
4.3.4.1 Meteorological events
4.3.4.1.1 Drought
During the past decade, drought events are likely to have accelerated the
reduction in land productivity in areas of the EU with intensified agriculture.
More intense land use could affect the natural resilience of ecosystems.
Drought could have a more persistent impact over areas in Western Europe
where the ecosystem is less drought resistant, especially when combined
with intensified land use.
Drought is one of the major global weather-related disasters and can have
devastating impacts on the environment, agriculture, economy, and society15.
Medium- and long-term effects of repeated drought events, combined with
non-adapted land management, can trigger land degradation and, in extreme
cases, desertification. Drought impacts depend on the duration, severity and
spatial extent of the precipitation deficit, and to a large extent on the
environmental and socio-economic vulnerability of affected regions. The
costs resulting from droughts in Europe over the past thirty years have been
estimated to be at least 100 billion Euros16.
An Assessment of Land Productivity Dynamics in the EU
29
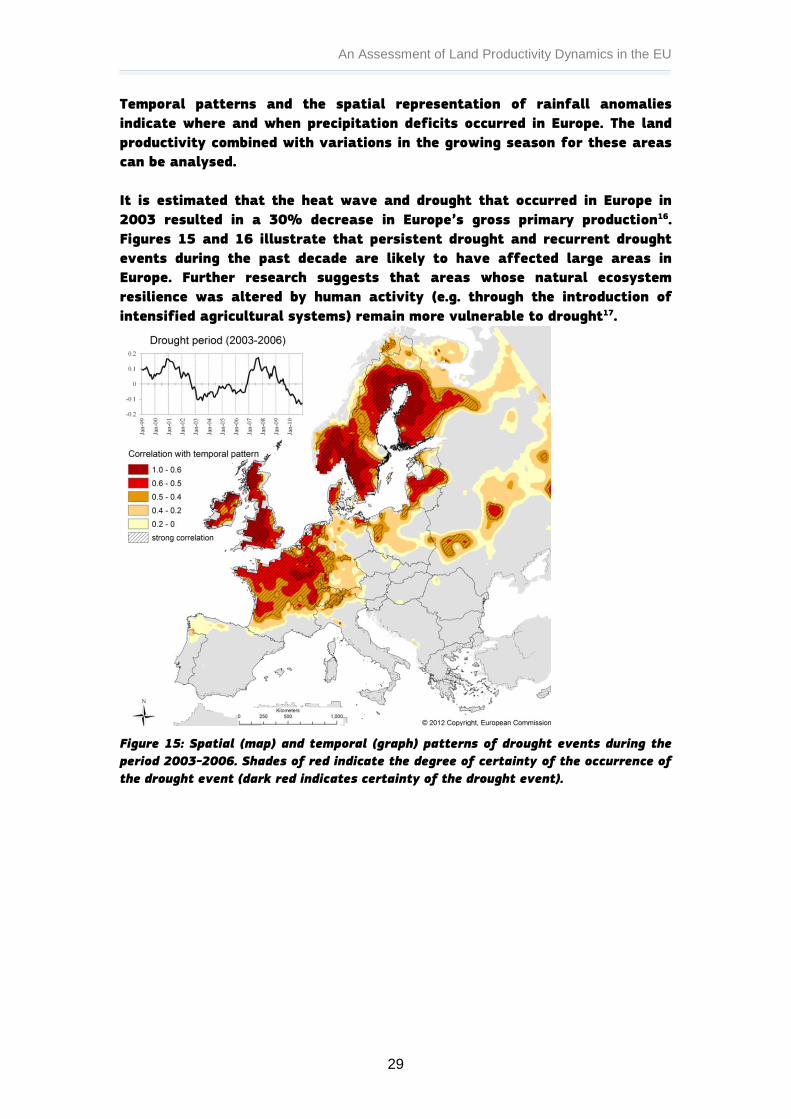
Temporal patterns and the spatial representation of rainfall anomalies
indicate where and when precipitation deficits occurred in Europe. The land
productivity combined with variations in the growing season for these areas
can be analysed.
It is estimated that the heat wave and drought that occurred in Europe in
2003 resulted in a 30% decrease in Europe’s gross primary production16.
Figures 15 and 16 illustrate that persistent drought and recurrent drought
events during the past decade are likely to have affected large areas in
Europe. Further research suggests that areas whose natural ecosystem
resilience was altered by human activity (e.g. through the introduction of
intensified agricultural systems) remain more vulnerable to drought17.
Figure 15: Spatial (map) and temporal (graph) patterns of drought events during the
period 2003-2006. Shades of red indicate the degree of certainty of the occurrence of
the drought event (dark red indicates certainty of the drought event).

An Assessment of Land Productivity Dynamics in the EU
30
Figure 16: Spatial (map) and temporal (graph) patterns of drought events in early
2001 and mid-2007. Shades of red indicate the degree of certainty of the occurrence
of the event (dark red indicates certainty of the drought event).
4.3.4.1.2 Extreme meteorological events
Ad hoc extreme meteorological events can play an important role, provoking
catalysing situations that worsen exposure to land degradation processes.
Excess rain can cause flooding which can have negative (outwash) or positive
(deposition) effects on the usable land resource.
Excess wind, such as the Klaus windstorm that passed over France in 2009
(see figure 17), can have drastic effects on natural resources. Scientific
reports18 and citations in Wikipedia indicate that some 60% of the Forêt des
Landes was partly or totally destroyed. First devastated by the Klaus
windstorm 2009, then infested by bark beetle (Ips sexdentatus) in 2010, some
220,000 hectares of forest in Forêt Les Landes will need to be repopulated
between now and 2017.1” This equates to around 88 satellite observation
points or mapped pixels.
A decrease in land productivity has been observed over the Forêt Les Landes
area since the Klaus windstorm event. Reduced vegetation cover could
increase the vulnerability of the area to degrading processes. As this is an
intensively managed forest and reforestation is planned or already
implemented, little or no effects in the way of land degradation are to be
1 http://www.guardian.co.uk/environment/2012/jul/31/france-landes-forest-replanting-scheme

An Assessment of Land Productivity Dynamics in the EU
31
expected. However, the example illustrates the sensitivity of the land
productivity assessments to changes in biomass on the ground (figure 18).
Figure 17: Trajectory of the Klaus Windstorm in 2009
(source: http://en.wikipedia.org/w/index.php?title=File:Klaus_storm_track_-
_20090124_-_map-en.svg&page=1)
Figure 18 (Extracted from Figure 3): Shades of
red indicate decline and early signs of decline
in the area of the Forêt des Landes through
which the “Klaus” windstorm swept in 2009
(see arrow).

An Assessment of Land Productivity Dynamics in the EU
32
4.3.4.2 Soil processes: e.g. soil erosion
In the EU, 38.3% of areas showing a decline in land productivity are
coincident with estimated soil erosion on cultivated land. More than half of
the areas showing early signs of decline or ‘stable but stressed’ land
productivity could be linked to soil erosion.
Soil erosion is an important causal issue of decline in land productivity over
the whole of the EU.
The Earth’s soil layer produces around 99% of human necessities in the way
of food, fibre, fodder and many other needs such as biofuel, sand, and
renewable energy. As the soil is both an abiotic and biotic ecosystem
structure, it also provides other crucial basic functions such as filtering and
recharging aquifers, buffering pollutants and regulating gas and nutrient
exchanges. Soil forms very slowly and it takes millennia to develop through
rock weathering and interactive processes with the environment, climate and
life forms. Soil loss through degradation processes (such as the loss of soil
structure and chemical characteristics) or by erosion (i.e. the physical loss of
topsoil, which includes most of the soil’s organic matter) takes several
human generations to replenish.
Erosion is the wearing away of the land surface by water and wind. It occurs
primarily due to inappropriate land management: deforestation, overgrazing,
forest fires, loss of vegetation cover and impact of rainfall. The JRC report
on the State of Soil in Europe19 documents the state of soil erosion in the EU.
As documented in the report, any soil loss of more than 1 tonne per hectare
per year can be considered as being irreversible within the time span of 50-
100 years. Figure 19 reproduces the report’s map of soil erosion by water as
was estimated spatially for EU cultivated land using the RUSLE model and
CORINE2006 Land Cover database.
The EU Thematic Strategy for Soil Protection of the European Commission18/2
has identified eight principal soil degradation threats that affect European
soils: erosion, organic matter decline, compaction, salinisation, landslides,
contamination, sealing (and/or urbanisation), and biodiversity decline. These
degradation processes have impacts on both the environment and
productivity. Their impact on land productivity can be assessed through the
land productivity dynamics (see figure 3). Soil loss can result in lower land
productivity. Feedback mechanisms are complex; soil erosion can lead to
lower land productivity, and lower land productivity can trigger accelerated
erosion. Land productivity dynamics classes were calculated within the low,
medium and high classes of the EU-24 soil erosion map (shown in figure 19)
(table 4).

An Assessment of Land Productivity Dynamics in the EU
33
Land productivity
dynamics
Estimated soil erosion
low medium high
declining 1.3 1.8 3.8
early signs of decline 6.7 7.5 7.4
stable but stressed 8.2 10.2 9.6
stable, not stressed 76.8 65.1 53.2
increasing productivity 7.0 15.3 26.0
Table 4: Share of land productivity dynamics classes in the EU per
estimated soil erosion class
Figure 19: Estimation of soil erosion on EU cultivated lands through rainsplash,
sheetwash and rill erosion as calculated using the RUSLE model (2006) and the
CORINE2006 Land Cover Database.20
The high erosion class has the highest share of declining land productivity (as
expected), but also has the highest share of increasing land productivity.
Figures 20, 21 and 22 illustrate the incidence of land productivity dynamics
within the three erosion classes. These maps indicate that the estimated
increased risk of erosion on cultivated land has not led to widespread decline
in land productivity over the past thirty years.

An Assessment of Land Productivity Dynamics in the EU
34
These seemingly contradictory results of increased land productivity in areas
at high risk of erosion may be explained by a number of factors. Firstly, the
25 km2 cell of the satellite observations from which the land productivity is
calculated can contain a mixture of agricultural and semi-natural land cover
types. While this can reflect landscape-scale functioning, it cannot capture
ongoing plot-level processes, such as splash, rill or sheet erosion. Secondly,
erosion risk depends on the actual cover and/or land management practices.
While slope is an important factor in estimating erosion risk, semi-natural
vegetation can be proportionally more abundant then the actual field surface
in more hilly or mountainous areas (such as central Italy, which is mapped as
being prone to erosion). At the level of detail of this study, the stable land
productivity dynamics of such vegetation can mask ongoing field-level
erosion. On the other hand, land abandonment in areas mapped as having
high erosion potential can lead to an increase in the standing biomass. This
would have the effect of increasing land productivity but also by decreasing
in-situ risk of erosion, which would improve the functional conditions of the
land. Also, EU farmers may have successfully adapted their management
practices in line with the agri-environmental measures (AEM) contained
within Pillar 2 of the CAP. Earlier studies indicated that the ratio of
AEM/Used Agricultural Area is a good indicator of pressure on land
productivity, with the smaller the ratio the higher the pressure21.
Figure 20: Incidence of land productivity dynamics within the areas of LOW estimated
erosion

An Assessment of Land Productivity Dynamics in the EU
35
Figure 21: Incidence of land productivity dynamics within the areas of MEDIUM
estimated erosion.
Figure 22: Incidence of land productivity dynamics within the areas of HIGH estimated
erosion.

An Assessment of Land Productivity Dynamics in the EU
36
Soil loss in the EU of more than 1 t/ha/yr is considered to be an irreversible
loss. Figure 23 maps cultivated areas where the incidence of land
productivity dynamics that are in decline, showing early signs of decline and
are ‘stable but stressed’ coincide with estimated irreversible soil erosion
(based on data from figure 19).
Considering the complexity of the human-environment interactions
contributing to land degradation, soil erosion has been clearly identified as
one of the causes, and is probably the most visible process. Loss of land
productivity in cultivated areas, however, may be due to erosion caused by
land management. The direct loss of standing biomass due to erosion would
be more likely to occur in natural and semi-natural environments. However,
the real cause-effect relationship for this range of situations has not been
analysed in this report. Table 5 documents the coincidence of negative land
productivity dynamics in cultivated areas of the EU that are estimated to
have irreversible levels of soil erosion.
As can be seen in figure 23, the observed incidence of soil erosion as a
probable, if not only, cause of certain levels of decline of land productivity is
an EU-wide phenomenon that is definitely not confined to Mediterranean
areas only.
Land productivity dynamics
declining early-signs stable, stressed
EU 38.3 60.5 54.5
Table 5: Share of the land productivity dynamics classes coinciding with
erosion of more than 1 t/ha/yr (as % of the land productivity dynamics class)

An Assessment of Land Productivity Dynamics in the EU
37
Figure 23: Spatial incidence of negative land productivity dynamics within areas
where estimated erosion is greater than 1 t/ha/yr.
4.3.4.3 Land management intensity: measured using N surplus
The use of nitrogen surplus as a surrogate indicator of land management
intensity shows correspondence between declining land productivity and
increasing land management intensity.
Other aspects of land management need to be considered to explain the
cause-effect chain of land degradation or improvement.
For several decades, the EU’s Common Agricultural Policy (CAP) had the
objective of increasing food production. This increasing efficiency and
productivity resulted in intensification of farming methods, which have had
significant impacts on the environment. This evolution has been marked by a
growing reliance on non-renewable fertiliser and pesticide inputs and higher
stocking densities21.
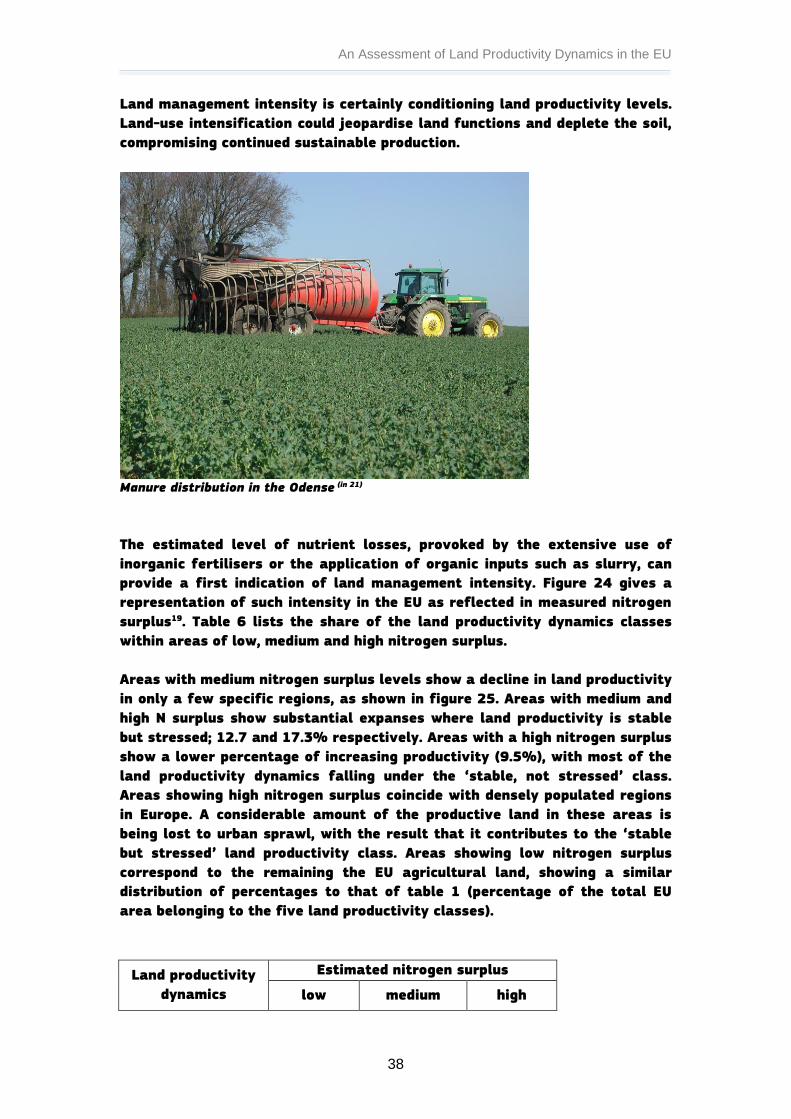
An Assessment of Land Productivity Dynamics in the EU
38
Land management intensity is certainly conditioning land productivity levels.
Land-use intensification could jeopardise land functions and deplete the soil,
compromising continued sustainable production.
Manure distribution in the Odense (in 21)
The estimated level of nutrient losses, provoked by the extensive use of
inorganic fertilisers or the application of organic inputs such as slurry, can
provide a first indication of land management intensity. Figure 24 gives a
representation of such intensity in the EU as reflected in measured nitrogen
surplus19. Table 6 lists the share of the land productivity dynamics classes
within areas of low, medium and high nitrogen surplus.
Areas with medium nitrogen surplus levels show a decline in land productivity
in only a few specific regions, as shown in figure 25. Areas with medium and
high N surplus show substantial expanses where land productivity is stable
but stressed; 12.7 and 17.3% respectively. Areas with a high nitrogen surplus
show a lower percentage of increasing productivity (9.5%), with most of the
land productivity dynamics falling under the ‘stable, not stressed’ class.
Areas showing high nitrogen surplus coincide with densely populated regions
in Europe. A considerable amount of the productive land in these areas is
being lost to urban sprawl, with the result that it contributes to the ‘stable
but stressed’ land productivity class. Areas showing low nitrogen surplus
correspond to the remaining the EU agricultural land, showing a similar
distribution of percentages to that of table 1 (percentage of the total EU
area belonging to the five land productivity classes).
Land productivity
dynamics
Estimated nitrogen surplus
low medium high
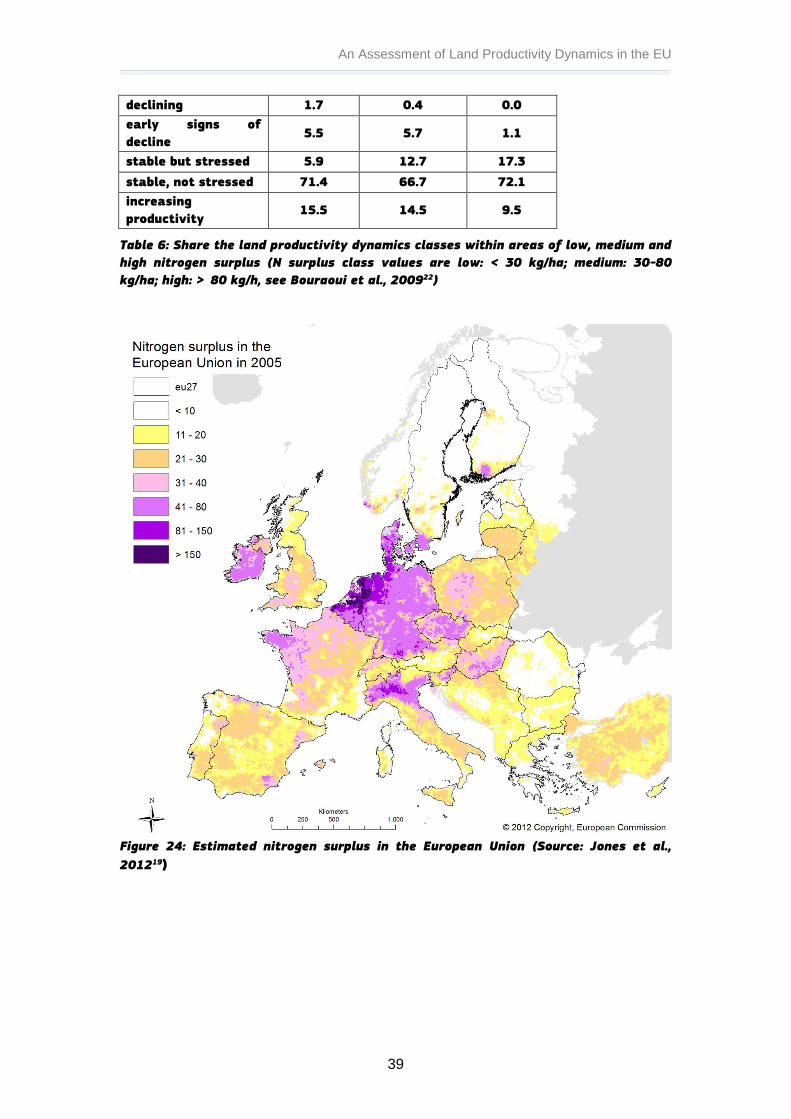
An Assessment of Land Productivity Dynamics in the EU
39
declining 1.7 0.4 0.0
early signs of
decline 5.5 5.7 1.1
stable but stressed 5.9 12.7 17.3
stable, not stressed 71.4 66.7 72.1
increasing
productivity 15.5 14.5 9.5
Table 6: Share the land productivity dynamics classes within areas of low, medium and
high nitrogen surplus (N surplus class values are low: < 30 kg/ha; medium: 30-80
kg/ha; high: > 80 kg/h, see Bouraoui et al., 200922)
Figure 24: Estimated nitrogen surplus in the European Union (Source: Jones et al.,
201219)
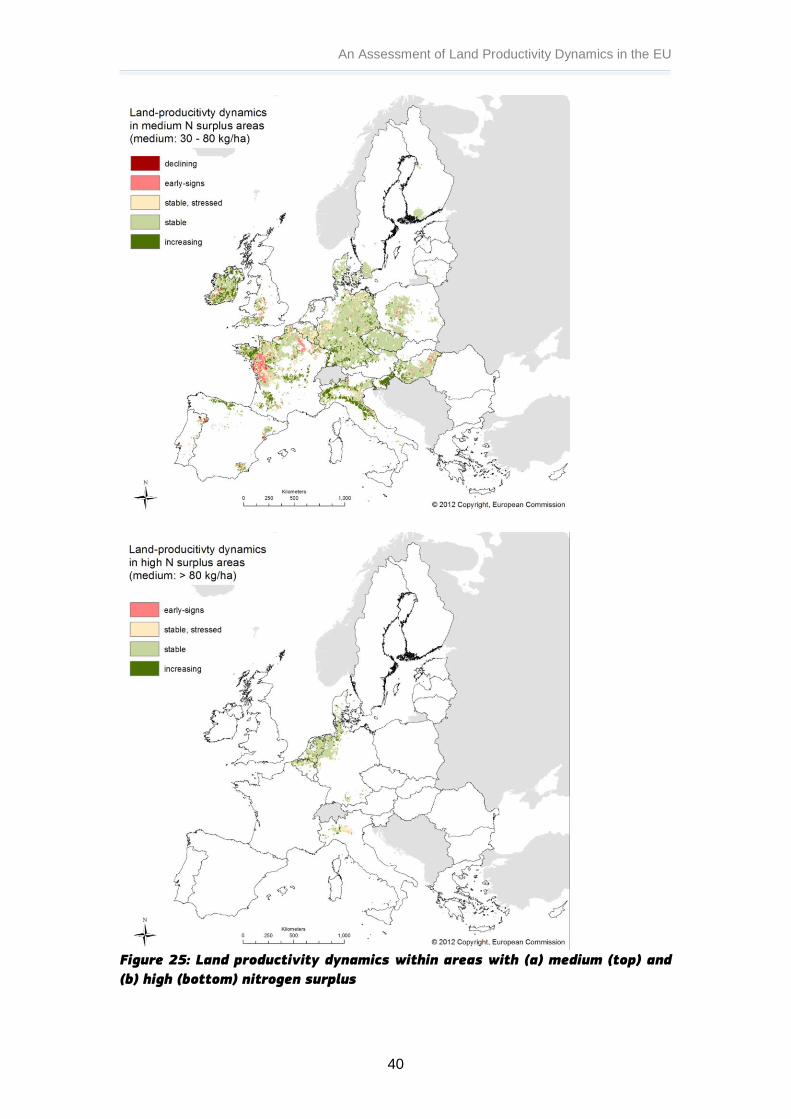
An Assessment of Land Productivity Dynamics in the EU
40
Figure 25: Land productivity dynamics within areas with (a) medium (top) and
(b) high (bottom) nitrogen surplus

An Assessment of Land Productivity Dynamics in the EU
41
Land use change and agricultural intensification potentially play a role in the
land productivity dynamics in an area in mid-western France, see figure 26
and figure 27.
Figure 26: Area in mid-western France where early signs of declining land productivity
dynamics can be observed.
Figure 27: Intensification of land use from 1970 (left) to 2000 (right). Darker shades
of red indicate more intense land use.

An Assessment of Land Productivity Dynamics in the EU
42
The indicator for intensification (figure 27) is based on three sub-indicators
as proxies for the main characteristics of High Nature Value farmland in
France: (1) crop rotations, (2) extensive land-use practices and (3) presence
of landscape elements. Each sub-indicator scores a value from 0-10 (except
for crop rotations, where the minimum is 1) according to its contribution to
the nature value of a municipality. The final score ranges from 1 to 30. The
scoring system rates the main components of each sub-indicator (i.e.
extensive practices are calculated separately for crops and grasslands;
landscape elements comprising hedgerows, forest edges, traditional orchards,
fishing ponds or wetlands, are weighted separately23). Areas evolving from
green (higher score) to red (lower score) are areas that have undergone
agricultural intensification during the 1970-2000 period. Other sources, such
as the average annual water irrigation requirements (shown in figure 28)
confirm this evolution.
Figure 28: Average annual water irrigation requirements for Europe (mm per 25 km2
grid)24

An Assessment of Land Productivity Dynamics in the EU
43

An Assessment of Land Productivity Dynamics in the EU
44
4.3.4.4 Land take and soil sealing
Proper soil functioning can also be influenced or even completely hampered
by other aspects of land management. Soil sealing, by converting land into
artificial surfaces, is an increasing threat to land productivity. The loss of
productive or agricultural land to artificial surfaces is a common problem in
the European Union, of which all regions are affected to a greater or lesser
extent. Simultaneously, there are also considerable differences between EU
Member States in terms of the speed of land take and in the quality of the
land taken away from crop production in favour of artificial surfaces12, 25. In
terms of ecosystem services, soil sealing causes a 100% loss of land
productivity. Bearing in mind that productive land is a limited resource that
is vital for feeding humanity, trade-offs need to be very carefully studied
when deciding whether or not to cede productive land to other, e.g. urban or
industrial, human use.

An Assessment of Land Productivity Dynamics in the EU
45
Figure 29: Quality of cropland taken by soil sealing/artificial use in NUTS regions of
the EU

An Assessment of Land Productivity Dynamics in the EU
46
country conversion to artificial land from:
Table 7: Extent of land take from main land cover types (to artificial land) in the EU between 2000-200625
† With reference to the total land surface area (excluding waters and wetlands)
cropland
(ha)
cropland
(% of country
total surface
area)
cropland
(% of land
surface area†)
cropland
(% of cropland
area in 2000)
grassland
(% of grassland
area in 2000)
plantations
(% of plantation
area in 2000)
forests
(% of
forest area
in 2000)
Austria 4,457 0.10 0.12 0.26 0.16 0.06 0.05
Belgium 2,208 0.12 0.15 0.18 0.07 0.05 0.15
Bulgaria 1,858 0.04 0.04 0.05 0.14 0.06 0.01
Cyprus 6,703 1.09 1.28 1.83 2.35 1.31 0.58
Czech Republic 7,710 0.17 0.18 0.23 0.65 0.10 0.04
Denmark 9,727 0.25 0.28 0.34 0.10 0.15 0.06
Estonia 1,522 0.10 0.11 0.18 0.14 0.07 0.08
Finland 2,122 0.03 0.04 0.13 0.40 0.00 0.04
France 56,140 0.13 0.17 0.26 0.14 0.22 0.06
Germany 49,473 0.19 0.21 0.31 0.17 0.12 0.07
Hungary 11,574 0.17 0.19 0.22 0.33 0.18 0.05
Ireland 5,680 0.29 0.37 0.86 0.35 0.24 0.11
Italy 40,509 0.16 0.18 0.37 0.07 0.12 0.02
Latvia 335 0.02 0.02 0.02 0.03 0.01 0.01
Lithuania 2,609 0.05 0.06 0.09 0.07 0.07 0.01
Luxembourg 67 0.16 0.17 0.08 0.98 0.00 0.04
Netherlands 20,531 1.07 1.25 1.55 1.23 1.16 0.22
Poland 14,133 0.06 0.07 0.09 0.08 0.06 0.03
Portugal 7,497 0.29 0.32 0.31 0.52 0.18 0.38
Romania 6,177 0.04 0.04 0.07 0.04 0.05 0.01
Slovakia 2,791 0.08 0.07 0.16 0.02 0.06 0.01
Slovenia 350 0.05 0.06 0.09 0.01 0.03 0.05
Spain 78,342 0.27 0.29 0.48 0.37 0.28 0.12
Sweden 5,903 0.04 0.05 0.19 0.19 0.01 0.03
EU-24 338,418 0.14 0.16 0.27 0.21 0.16 0.06

An Assessment of Land Productivity Dynamics in the EU
47

An Assessment of Land Productivity Dynamics in the EU
48
4.4 Effects of policy strategies and future options
In general, High Nature Value (HNV) farmland areas seem to have a larger
share of stable or increasing land productivity than those with low, or no,
nature value. Natura 2000 areas show a larger share of increasing land
productivity.
Further analysis is needed, but first indications are that it can be worthwhile
to further optimise EU agri-environmental policy strategies to mitigate land
degradation in HNV farmland areas.
While the CAP aimed to increase food production, the improvement of agri-
environmental aspects was dealt with by specific incentive measures within
Rural Development Plans. High Nature Value (HNV) farmlands have been
mapped in the EU to indicate areas under cultivation for which there is a
specific interest in, or potential for, keeping natural diversity. In many of
these areas, agri-environmental measures were undertaken26. Other EU
strategies aimed to maintain environmental diversity by protecting certain
areas, such as those under the Natura 2000 policy.
A harmonised dataset for the EU on which and where agri-environmental
measures have been implemented during the past ten years would offer an
excellent basis on which to evaluate their effect on overall land productivity
dynamics. As a first step in understanding the effect that recent policy
strategies have had on land productivity dynamics, we evaluate the land
productivity of HNV farmland and Natura 2000 areas on the assumption that
such areas should show more stable or improving land productivity dynamics.
4.4.1 High Nature Value (HNV) farmland
Areas showing levels of likelihood26 of HNV farmland presence are mapped in
figure 30. For the EU, this map shows the spatial distribution of HNV
farmland, reclassified based on the original map produced by the JRC and the
European Environment Agency (EEA). HNV farmland areas are regrouped for
our analysis into four classes of likelihood (low 1-25%; medium 26-50%, high
51-75%, very high 76-100%). The share of land productivity dynamics within
each of these classes is presented in table 8.
Land productivity
dynamics
HNV probability classes
low medium high very
high
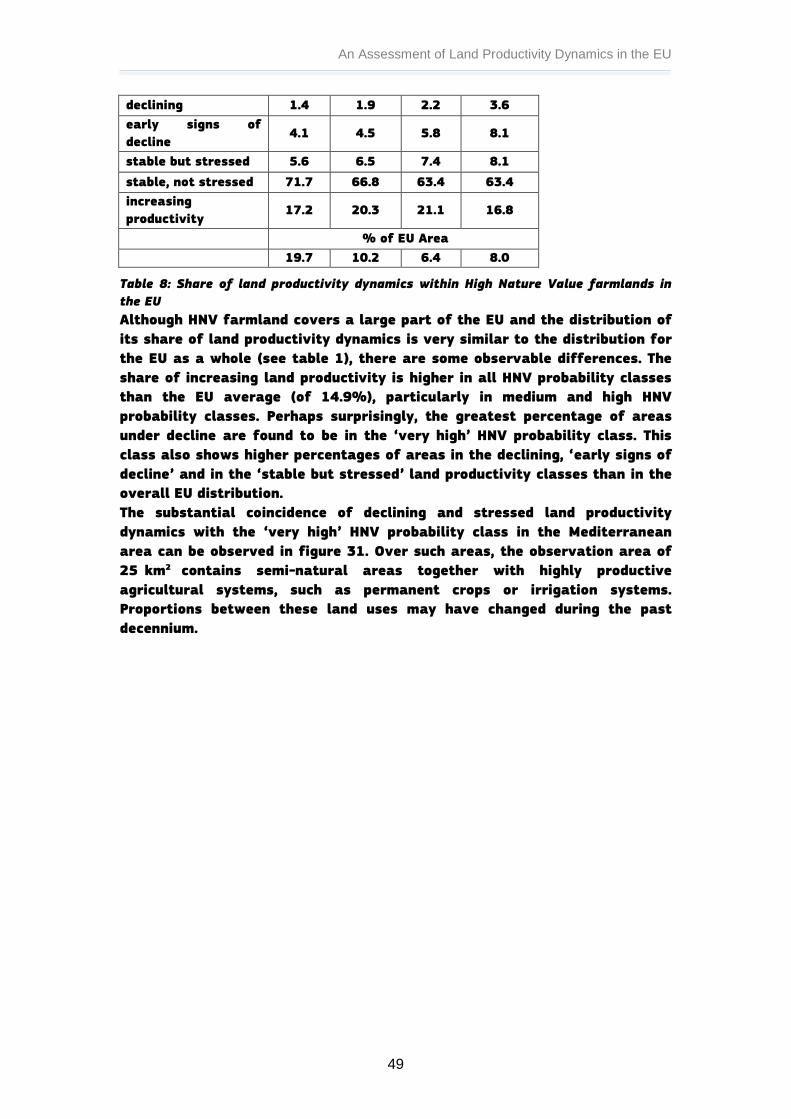
An Assessment of Land Productivity Dynamics in the EU
49
declining 1.4 1.9 2.2 3.6
early signs of
decline 4.1 4.5 5.8 8.1
stable but stressed 5.6 6.5 7.4 8.1
stable, not stressed 71.7 66.8 63.4 63.4
increasing
productivity 17.2 20.3 21.1 16.8
% of EU Area
19.7 10.2 6.4 8.0
Table 8: Share of land productivity dynamics within High Nature Value farmlands in
the EU
Although HNV farmland covers a large part of the EU and the distribution of
its share of land productivity dynamics is very similar to the distribution for
the EU as a whole (see table 1), there are some observable differences. The
share of increasing land productivity is higher in all HNV probability classes
than the EU average (of 14.9%), particularly in medium and high HNV
probability classes. Perhaps surprisingly, the greatest percentage of areas
under decline are found to be in the ‘very high’ HNV probability class. This
class also shows higher percentages of areas in the declining, ‘early signs of
decline’ and in the ‘stable but stressed’ land productivity classes than in the
overall EU distribution.
The substantial coincidence of declining and stressed land productivity
dynamics with the ‘very high’ HNV probability class in the Mediterranean
area can be observed in figure 31. Over such areas, the observation area of
25 km2 contains semi-natural areas together with highly productive
agricultural systems, such as permanent crops or irrigation systems.
Proportions between these land uses may have changed during the past
decennium.

An Assessment of Land Productivity Dynamics in the EU
50
Figure 30: Spatial distribution of High Nature Value (HNV) farmland areas in the EU
(regrouped based on JRC-EEA22).
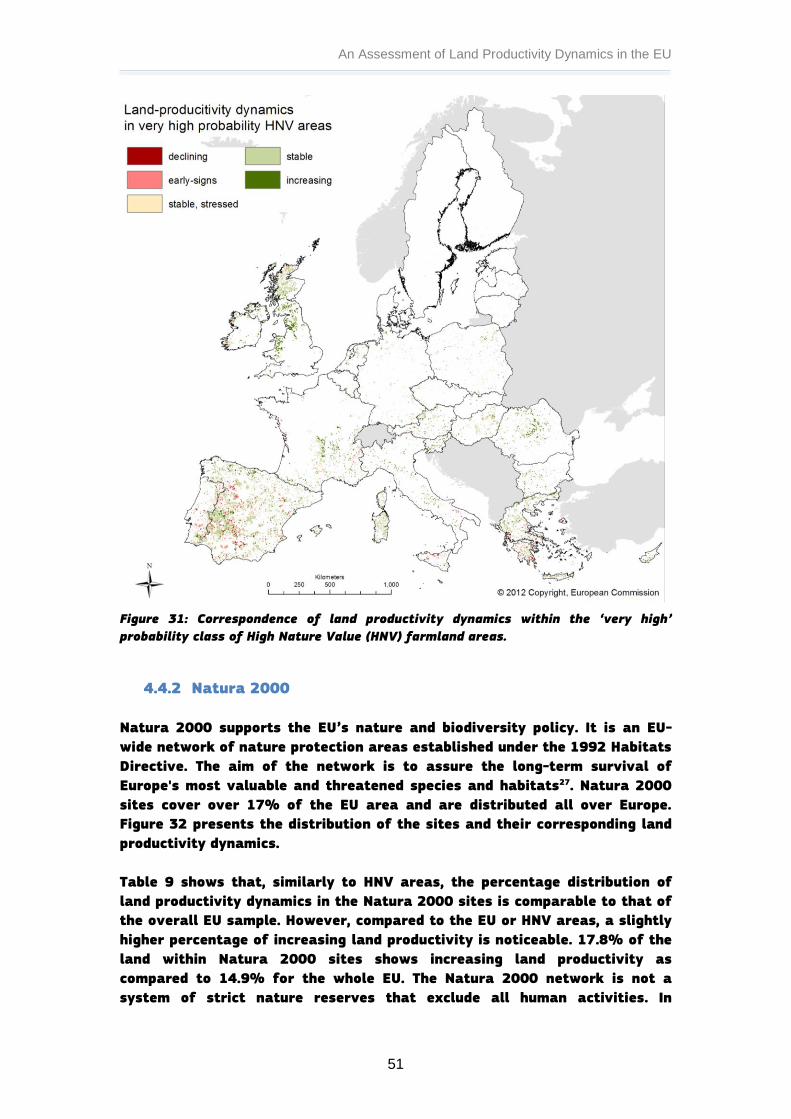
An Assessment of Land Productivity Dynamics in the EU
51
Figure 31: Correspondence of land productivity dynamics within the ‘very high’
probability class of High Nature Value (HNV) farmland areas.
4.4.2 Natura 2000
Natura 2000 supports the EU’s nature and biodiversity policy. It is an EU-
wide network of nature protection areas established under the 1992 Habitats
Directive. The aim of the network is to assure the long-term survival of
Europe's most valuable and threatened species and habitats27. Natura 2000
sites cover over 17% of the EU area and are distributed all over Europe.
Figure 32 presents the distribution of the sites and their corresponding land
productivity dynamics.
Table 9 shows that, similarly to HNV areas, the percentage distribution of
land productivity dynamics in the Natura 2000 sites is comparable to that of
the overall EU sample. However, compared to the EU or HNV areas, a slightly
higher percentage of increasing land productivity is noticeable. 17.8% of the
land within Natura 2000 sites shows increasing land productivity as
compared to 14.9% for the whole EU. The Natura 2000 network is not a
system of strict nature reserves that exclude all human activities. In

An Assessment of Land Productivity Dynamics in the EU
52
addition, the observation resolution of 25 km2 used to calculate the land
productivity dynamics can give rather coarse measurements of land
productivity for the smaller areas within the network. Such measurements
would be best made with higher-resolution information, for which however,
long-term time series data are not yet available.
Table 9: Assessment of land productivity dynamics of Natura 2000 sites in the
European Union. Values are expressed as % of the Natura 2000 sites
Land productivity dynamics
declining early signs
of decline
stable, but
stressed stable increasing
1.8 5.7 7.3 67.3 17.8

An Assessment of Land Productivity Dynamics in the EU
53
Figure 32: Land productivity dynamics in Natura 2000 areas (coloured areas represent
Natura 2000 areas – white areas are not part of Natura 2000).
An Assessment of Land Productivity Dynamics in the EU
54
5 CONCLUSIONS
Land degradation is a complex phenomenon caused by interacting biophysical
and societal factors. No agreed scientific assessment and measurement
protocols or complementing indicators currently exist. However, long-term
satellite-based observations offer considerable potential as a source of
information on land productivity dynamics, which offers potential as a
baseline on which to further integrate contextual information in order to
assess land degradation. This is still subject to further verification and
research to understand the complex social, economic and biophysical
processes that drive local (positive and negative) changes in land
productivity dynamics.
This study shows that land productivity dynamics can be mapped for the EU
based on satellite time series observations. This information can be used to
analyse the incidence of potential drivers of land degradation, such as
unsustainable land use or soil erosion, and to interpret land productivity
dynamics in the light of ongoing land degradation.
Land productivity is observed to be in decline in 1.5% (around 6 million
hectares) of the EU territory, with another 5.6% showing early signs of
decline. Some of these areas are being cultivated for agricultural production
and, in some cases, correspondence to mapped drought events, significant
soil erosion risk and land use intensification. Convergence of such evidence
can prove useful for improved assessment of ongoing land degradation.
Land productivity dynamics are found to have been stable in most of the EU
during the 1982-2010 period. Increases in land productivity were found in
semi-natural land cover types, and a higher coincidence was observed in HNV
farmland and Natura 2000 sites.
This spatial evaluation also highlighted the fact that, in the frame of the
‘neutral land degradation world’ discussion, area percentages of declines and
increases in land productivity cannot be counterbalanced in a
straightforward manner, as these areas can have totally different actual and
potential land uses, and economic and cultural values. Therefore, discussions
on land-degradation neutrality must consider trade-offs with regard to the
impacts of different land use or management strategies.
This document reports the first results of an assessment and evaluation of
EU land productivity dynamics, and gives examples of the added value of
integrating contextual information when making final judgements on land
degradation. These findings constitute a valuable contribution to land
degradation assessments in general and, specifically, to the implementation
of the RIO+20 target of a ‘land degradation neutral world’.

An Assessment of Land Productivity Dynamics in the EU
55

An Assessment of Land Productivity Dynamics in the EU
56
An Assessment of Land Productivity Dynamics in the EU
57
6 OUTLOOK – RIO+20
An assessment of land productivity dynamics, combined with further
explanatory biophysical and societal data, has potential value as an
indicator with which to measure progress towards the RIO+20 target of land-
degradation neutrality.
The Parties to the RIO+20 Conference decided “to strive to achieve a land-
degradation neutral world in the context of sustainable development”. This is
a noble but controversial target in that it is not clear what, and where, land
degradation is taking place. There are also no agreed methodologies to
assess land degradation at regional, continental or global scales. The
research documented in this report aims to address this issue. The notion of
‘neutral’ is also debatable as many interpretations are still open; is it
restoration versus degradation, or is it ‘maintaining and improving’ versus
degradation?
Reduced land degradation will lead to increased productivity and new
economic opportunities, help secure rural labour markets through alternative
and sustainable land use options, and help safeguard environmental services
of the land, including the land’s climate system, water regulation capacity
and biodiversity functions. The degradation of ecosystems is, to a large
extent, induced by unsustainable human activities. This puts people at the
very centre of the issue and requires them to take responsibility and action.
Understanding the value of ecosystems and their services is essential to
construct preventative solutions and conservation methodologies that
deliver socio-economic benefits. Sustainable land management provides
viable alternatives for prevention and conservation and has been
implemented in a wide diversity of geographical and economic contexts. Thus,
achieving land-degradation neutrality is not so much desirable as essential.
It should be obvious that, when cultivated or intensively used lands show
indications of ongoing degrading processes, strategies should be implemented
to mitigate these processes through adapted land management techniques
that maintain adequate levels of food production. Also, intensifying
mitigation and protection strategies could prove to be valuable in areas of
high nature value interest or conservation sites.
By avoiding the pitfalls of unsustainable agricultural intensification (figures
24 and 25), improving spatial planning, in particular infrastructure and
housing (to make maximum use of brownfield sites, cut back on the sealing of
productive soils, etc.), encouraging rural communities to develop sustainable
practices and pursuing an effective fight against climate change, Europe
might reach a land-degradation neutral state.

An Assessment of Land Productivity Dynamics in the EU
58
This report shows that, based on satellite time-series observations, land
productivity dynamics can be mapped for the EU. This can be used as a basis
on which to identify and map ongoing land degradation by analysing the
incidence of potential drivers (such as unsustainable exploitation or soil
erosion) and compiling evidence to interpret land productivity dynamics.
Building on these initial results, the next steps for a European land
degradation assessment and contribution to the RIO+20 target are to
improve analytical schemes (including the compilation of further and more
detailed contextual data), fine-tune models to better understand cause-and-
effect relationships, and provide more detailed scenario analyses.
An Assessment of Land Productivity Dynamics in the EU
59

An Assessment of Land Productivity Dynamics in the EU
60
References 1 S. Sommer, C. Zucca, A. Grainger, M. Cherlet, R. Zougmore, Y. Sokona, J. Hill, R.
Della Peruta, J. Roehrig, G. Wang (2011): Application of indicator systems for
monitoring and assessment of desertification from national to global scales. Land
Degrad. Develop. 22: 184–197. Published online in Wiley Online Library
(wileyonlinelibrary.com) DOI: 10.1002/ldr.1084
2 Oldeman LR, Hakkeling RTA, Sombroek WG. (1991): World map of the status of
human-induced soil degradation: an explanatory note. Second Edition. Wageningen,
The Netherlands and Nairobi, Kenya: International Soil Reference and Information
Centre/United Nations Environment Programme
3 Cherlet M and Sommer S. (2009): WAD Implementation Plan. Roadmap towards
a new World Atlas on Desertification, Land Degradation and Drought. Joint Research
Centre, Institute for Environment and Sustainability. JRC Action DESERT (22008), WP
2009, Deliverable 2.2.
http://desert.jrc.ec.europa.eu/action/php/index.php?action=view&id=105
4 Ivits, E., Cherlet, M., Mehl, W., Sommer, S. (2012a): Ecosystem Functional Units
characterized by satellite observed phenology and productivity gradients: a case
study for Europe. Ecological Indicators, pp. 17-28. 10.1016/j.ecolind.2012.11.010
Hill J, Stellmes M, Udelhoven T, Roeder A, Sommer S. (2008): Mediterranean
Desertification and Land Degradation - Mapping Related Land Use Change Syndromes
Based on Satellite Observations. GLOBAL AND PLANETARY CHANGE 64 (3-4); p. 146-
157. JRC45576
5 Ivits, E., Cherlet, M., Sommer, S., Mehl, W. (2012): Addressing the complexity in
non-linear evolution of vegetation phenological change with time-series of remote
sensing images. Ecological Indicators, 26, 49–60. 10.1016/j.ecolind.2012.10.012.
7 Ivits, E., Cherlet, M., Sommer, S., Mehl, W. Conti M. (2012): An integrated
assessment framework for land degradation at global scales, JRC Action DESERT
(22008), WP2012, Deliverable 1.4
7 DSD WG1 White Paper (2010):
(http://dsd-consortium.jrc.ec.europa.eu/documents/WG1_White-Paper_Draft-
2_20090818.pdf)
8 Reynolds J F, Stafford Smith DM, Lambin EF, Turner BL, Mortimore IM,
Batterbury SPJ, Downing TE, Dowlatabadi H, Fernandez RJ, Herrick JE, Huber-
Sannwald E, Jiang H, Leemans R, Lynam T, Maestre FT, Ayarza M, Walker B. (2007):
Global desertification: Building a science for dryland development. Science 316:847-
851.
9 Lal R., Safriel U. and Boer b., (2012): Zero Net Land Degradation, A New
Sustainbale Development Goal for RIO+20; a report prepared for the Secretariat of
the UNCCD, May 2012.
http://www.unccd.int/Lists/SiteDocumentLibrary/secretariat/2012/Zero%20Net%20L
and%20Degradation%20Report%20UNCCD%20May%202012%20background.pdf

An Assessment of Land Productivity Dynamics in the EU
61
10 Winslow M. D., J. V. Vogt, R. J. Thomas, S. Sommer, C. Martius and M. Akhtar-
Schuster (2011): Science for improving the monitoring and assessment of dryland
degradation. Land Degrad. Develop. 22: 145–149 (2011). Published online in Wiley
Online Library (wileyonlinelibrary.com) DOI: 10.1002/ldr.1044. JRC59301
11 Geist HJ and Lambin EF. (2004): Dynamic Causal Patterns of Desertification,
Bioscience, Vol.54No.9, pp.817-829
12 CLC2000 (EEA, 2000) http://www.eea.europa.eu/data-and-maps/data/corine-
land cover-2000-raster
13 Tóth G, Bódis K, Ivits É, Máté F, Montanarella L. (2011): Productivity
component of the proposed new European agri-environmental soil quality indicator.
In: Tóth G, Németh T, editors. Land quality and land use information in the European
Union. Luxembourg: Publication Office of the European Union. p. 297–308.
14 Kurnik B. and Niemeyer S., 2008, Drought forecasting in Europe with
Standardized Precipitation Index using ECMWF monthly forecasts, EMS2008-A-00384,
2008, 8th Annual Meeting of the EMS / 7th ECAC
15 European Commission (2007): Water Scarcity and Droughts, Second Interim
Report.
http://ec.europa.eu/environment/water/quantity/pdf/comm_droughts/2nd_int_report.p
df
16 Ciais, Ph., Reichstein, M., Viovy, N., Granier, A., Ogee, A., Allard, V., Aubinet, M.,
Buchmann, N., Bernhofer, C., Carrara, A., Chevallier, F., De Noblet, N., Friend, A. D.,
Friedlingstein, P., Grunwald, T., Heinesch, B., Keronen, P., Knohl, A., Krinner, G.,
Loustau, D., Manca, G., Matteucci, G., Miglietta, F., Ourcival, J.M., Papale, D., Pilegaard,
K., Rambal, S., Seufert, G., Soussana, J.F:, Sanz, M.J., Schulze, E.D:, Vesala, T.,
Valentitni, R. (2005): Europe-wide reduction in primary productivity caused by the
heat and drought in 2003. Nature, Vol. 437, 529-533.
17 Ivits, E., Horion, S., Fensholt, R., Cherlet, M., (2013): Drought footprint on
European ecosystems between 1999 and 2010 assessed by remote sensing observed
vegetation phenology and productivity. Global Change Biology, at second review
18 Danjon F. et al. (2009): Genetic variability in 3D coarse root architecture in
Pinus pinaster, in Proceedings of the 2nd International Conference on Wind Effects
on Trees, Freiburg, October 2009
18/2 Commision of the European Communities, 2006, Brussels, 22.9.2006,
Communication from the Commission to the Council, the European Parliament, the
European Economic and Social Committee and the Committee of the Regions,
Thematic Strategy for Soil Protection, COM(2006)231Final
19 Jones A., Panagos P., Barcelo F., Bouraoui F., Bosco C., Dewitte O.,Gardi C.,
Erhard M., Hervás J., Hiederer R., Jeffrey S., Lükewille A., Marmo L., Montanarella L.,

An Assessment of Land Productivity Dynamics in the EU
62
Olazábal C., Petersen J-E., Penizek V., Strassburger T., Tóth G., Van Den Eeckhout M.,
Van Liedekerke M., Verheijen F., Viestova E., Yigini Y. (2012): The State of Soil in
Europe – A contribution of the JRC to the European Environment Agency’s
Environment State and Outlook Report – SOER 2010, EUR – Scientific and Technical
Research series – ISSN1831-9424(online), ISSN101-5593 (print), ISBN 978-9279-
22806-3 (pdf), ISBN 978-92-79-22805-6 (print)
20 Bosco et al. (2012) from the “State of Soil in Europe, JRC Reference Report
2012
21 Cherlet M. (2007): Experiences and Analysis of Pressures and Impacts from
Agriculture on Water Resources and Developing an related Programme of Measures –
Report of the Pilot River Basin Group of Agriculture, EUR ISSN1018-5593, ISBN 978-
92-79-06228-5
22 Bouraoui F., Grizetti B., Aloe A. (2009): Nutrient Discharge from Rivers to Seas
for year 2000, EUR24002EN, European Commission, Office for Official Publications of
the European Communities, Luxemburg, pp.79
23 Philippe Pointereau, Maria Luisa Paracchini, Jean-Michel Terres, Frédéric
Jiguet, Yves Bas, Katarzyna Biala (2007): Identification of High Nature Value
Farmland in France through Statistical Information and Farm Practices Surveys. EUR
22786 EN – Joint Research Centre – Institute for Environment and Sustainability.
Office for Official Publications of the European Communities Luxembourg 2007 – 65
pp. – 27.9 x 21 cm, EUR – Scientific and Technical Research series – ISSN 1018-5593
ISBN 978-92-79-06475-3
24 de Roo A. et al., 2012, Water resources in Europe and Africa: matching water
supply and water demand, EUR25247EN, European Commission, Office for Official
Publications of the European Communities, Luxemburg, pp.40, ISBN 1018-5593
(print)//1831-9424 (online)
25 Tóth G. (2012): Impact of land take on the land resource base for crop
production in the European Union. Science of the Total Environment 435-436: 202–
214
26 Maria Luisa Paracchini, Jan-Erik Petersen, Ybele Hoogeveen, Catharina
Bamps, Ian Burfield, Chris van Swaay (2008): High Nature Value Farmland in Europe
- An Estimate of the Distribution Patterns on the Basis of Land Cover and
Biodiversity Data. EUR 23480 EN, Luxembourg: Office for Official Publications of the
European Communities 2008, 87 pp. – 21 x 29.7 cm, EUR – Scientific and Technical
Research series – ISSN 1018-5593, ISBN 978-92-79-09568-9
27 http://ec.europa.eu/environment/nature/natura2000/index_en.htm

An Assessment of Land Productivity Dynamics in the EU
63
ANNEX
Table A.1: Land productivity dynamics of low productivity croplands in the Member
States of the European Union (in % of the low productivity croplands).
Countries declining early signs stable, stressed stable increasing
Austria 0.0 0.0 4.8 57.1 38.1
Belgium 0.0 0.0 80.0 20.0 0.0
Bulgaria 0.0 0.0 1.6 79.7 18.8

An Assessment of Land Productivity Dynamics in the EU
64
Cyprus 2.3 0.0 7.0 86.0 4.7
Czech Republic 0.0 0.0 0.0 100.0 0.0
Denmark 0.0 0.0 0.0 100.0 0.0
Estonia 0.0 0.0 0.0 100.0 0.0
Finland 0.0 2.4 0.0 97.6 0.0
France 0.0 9.7 29.6 48.4 12.4
Germany 0.0 0.0 33.3 64.7 2.0
Greece 5.5 10.4 7.4 66.3 10.4
Hungary 0.0 2.3 12.8 83.5 1.5
Irish Republic 0.0 3.8 11.5 50.0 34.6
Italy 16.2 13.5 0.0 67.6 2.7
Latvia 0.0 0.0 2.4 97.6 0.0
Lithuania 0.0 0.7 0.0 98.2 1.1
Luxembourg 0.0 0.0 0.0 100.0 0.0
Malta 0.0 0.0 0.0 0.0 0.0
Netherlands 0.0 0.0 28.9 66.5 4.6
Poland 0.0 0.4 0.0 86.7 12.9
Portugal 5.0 15.0 0.0 70.0 10.0
Romania 0.0 0.0 0.0 77.8 22.2
Slovakia 0.0 0.0 0.9 74.4 24.8
Slovenia 0.0 0.0 0.0 17.4 82.6
Spain 6.4 13.8 17.6 55.6 6.6
Sweden 0.0 0.0 1.1 96.8 2.2
United Kingdom 0.0 10.6 2.1 54.3 33.0
Table A.2: Land productivity dynamics of medium productivity croplands in the
Member States of the European Union (in % of medium productivity croplands).
Countries declining early signs stable, stressed stable increasing
Austria 0.0 0.4 2.0 70.4 27.2
Belgium 0.0 3.6 22.6 64.6 9.1
Bulgaria 0.2 4.3 5.5 74.5 15.6
Cyprus 5.6 0.0 11.1 66.7 16.7
Czech Republic 0.0 0.0 0.6 85.9 13.5
Denmark 0.0 1.9 0.6 89.8 7.7
Estonia 0.0 3.3 0.3 93.4 3.0

An Assessment of Land Productivity Dynamics in the EU
65
Finland 0.0 1.6 0.9 97.3 0.1
France 0.2 8.5 18.4 48.1 24.8
Germany 0.0 2.1 11.0 78.8 8.0
Greece 4.7 15.6 12.3 57.8 9.6
Hungary 0.0 5.4 8.1 72.2 14.3
Irish Republic 0.0 4.5 9.1 56.8 29.5
Italy 2.8 9.2 15.9 51.5 20.7
Latvia 0.0 4.8 0.1 94.0 1.1
Lithuania 0.0 0.7 0.7 96.7 1.8
Luxembourg 0.0 0.0 33.3 66.7 0.0
Malta 0.0 0.0 0.0 0.0 0.0
Netherlands 0.3 2.2 6.9 80.5 10.1
Poland 0.0 3.0 0.7 89.7 6.5
Portugal 9.6 21.1 5.7 58.5 5.1
Romania 0.0 3.9 3.0 78.0 15.1
Slovakia 0.0 2.6 1.9 81.7 13.8
Slovenia 0.0 0.0 1.6 16.9 81.5
Spain 4.2 13.4 9.2 64.9 8.4
Sweden 0.0 2.1 0.2 95.7 1.9
United Kingdom 0.6 10.4 6.8 68.5 13.8
Table A.3: Land productivity dynamics of high productivity croplands in the Member
States of the European Union (in % of high productivity croplands).
Countries declining early signs stable, stressed stable increasing
Austria 0.0 0.0 0.0 84.0 16.0
Belgium 0.0 5.0 30.9 61.2 2.8
Bulgaria 0.0 1.7 1.7 79.2 17.5
Cyprus 0.0 0.0 8.7 73.9 17.4
Czech Republic 0.0 0.7 0.4 94.4 4.5

An Assessment of Land Productivity Dynamics in the EU
66
Denmark 0.0 1.9 0.0 98.1 0.0
Estonia 0.0 1.5 0.0 98.5 0.0
Finland 0.0 0.0 0.0 100.0 0.0
France 0.7 14.7 21.5 46.8 16.3
Germany 0.0 2.6 11.3 82.6 3.5
Greece 3.2 17.7 12.9 54.8 11.3
Hungary 0.0 8.9 8.1 80.7 2.2
Irish Republic 0.0 4.2 9.5 53.0 33.3
Italy 0.7 2.9 25.2 46.6 24.6
Latvia 0.0 0.0 0.0 100.0 0.0
Lithuania 0.0 4.5 1.4 94.1 0.0
Luxembourg 0.0 0.0 53.8 46.2 0.0
Malta 0.0 0.0 0.0 0.0 0.0
Netherlands 0.0 0.0 13.9 83.3 2.8
Poland 0.0 3.7 0.7 88.4 7.1
Portugal 0.0 50.0 6.3 43.8 0.0
Romania 0.1 5.3 5.0 86.8 2.9
Slovakia 0.0 0.0 0.0 92.9 7.1
Slovenia 0.0 0.0 0.0 28.6 71.4
Spain 9.4 12.5 6.3 53.1 18.8
Sweden 0.0 0.0 0.0 77.6 22.4
United Kingdom 0.0 4.4 7.9 63.4 24.2

Europe Direct is a service to help you find answers to your questions about the European Union
Free phone number (*): 00 800 6 7 8 9 10 11
(*) Certain mobile telephone operators do not allow access to 00 800 numbers or these calls may be billed.
A great deal of additional information on the European Union is available on the Internet.
It can be accessed through the Europa server http://europa.eu
How to obtain EU publications
Our publications are available from EU Bookshop (http://bookshop.europa.eu),
where you can place an order with the sales agent of your choice.
The Publications Office has a worldwide network of sales agents.
You can obtain their contact details by sending a fax to (352) 29 29-42758.

doi:10.2788/70673
ISBN 978-92-79-35427-4
LB-N
A-2
6500-E
N-N