Embed Size (px)
Citation preview
1
Land Data Assimilation Systems at NCEP/EMC
Michael Ek, Youlong Xia, Jesse Meng, Weizhong Zheng, Jiarui Dong
Land-Hydrology Team, National Centers for Environmental Prediction / Environmental Prediction Center (NCEP/EMC), Suitland, Maryland, USA
NASA GSFC GMAO Seminar • 24 April 2012

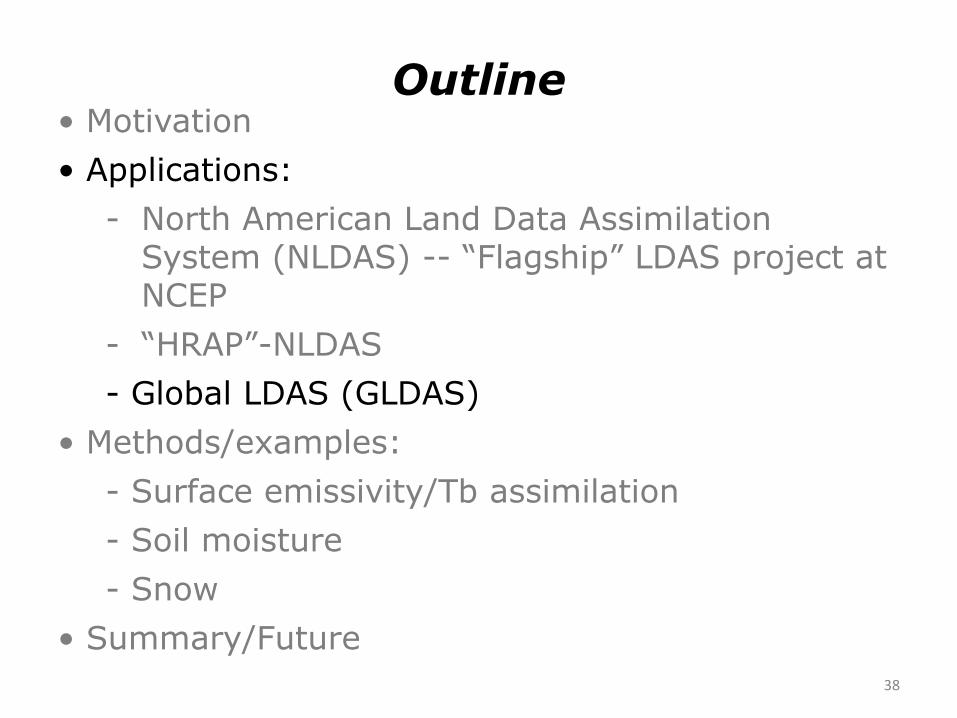
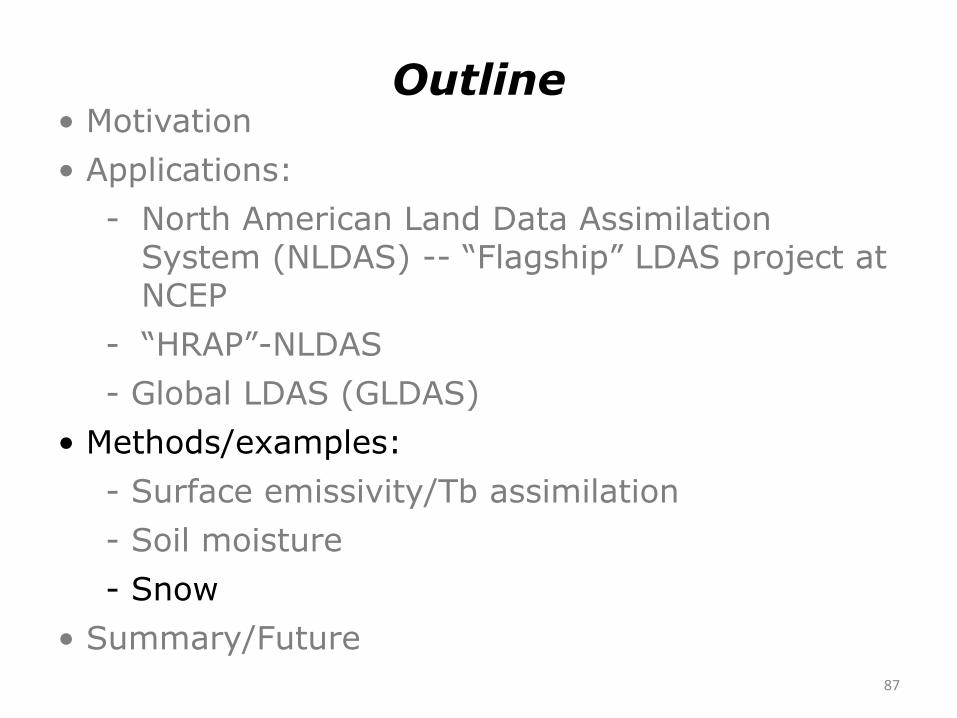
• Motivation
• Applications:
- North American Land Data Assimilation System (NLDAS) -- “Flagship” LDAS project at NCEP
- “HRAP”-NLDAS
- Global LDAS (GLDAS)
• Methods/examples:
- Surface emissivity/Tb assimilation
- Soil moisture
- Snow
• Summary/Future
Outline
2
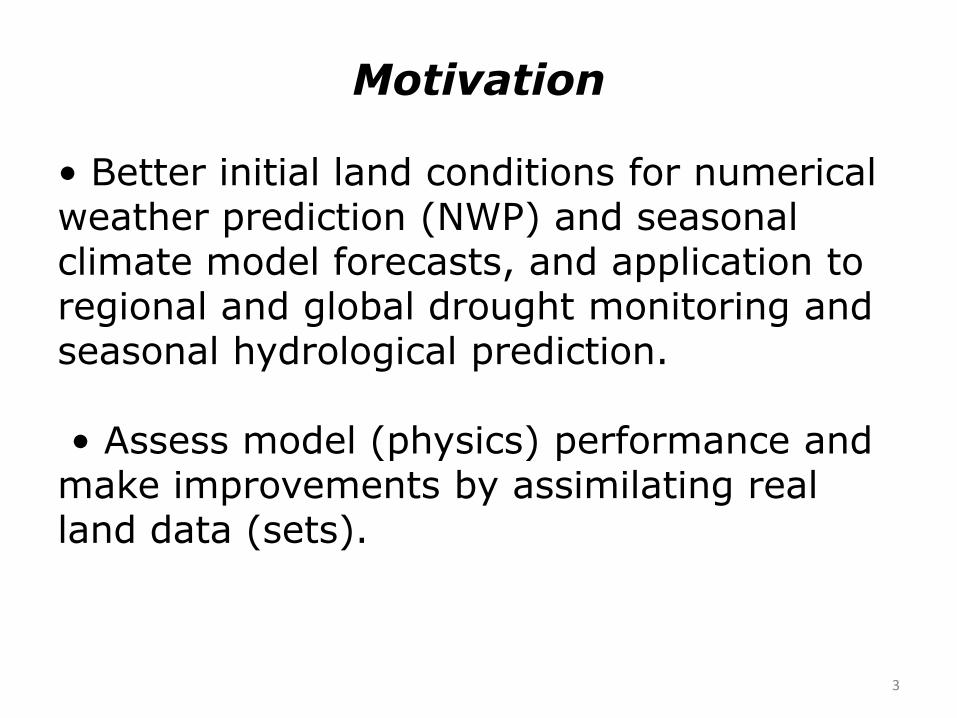
• Better initial land conditions for numerical weather prediction (NWP) and seasonal climate model forecasts, and application to regional and global drought monitoring and seasonal hydrological prediction. • Assess model (physics) performance and make improvements by assimilating real land data (sets).
Motivation
3
• Motivation
• Applications:
- North American Land Data Assimilation System (NLDAS) -- “Flagship” LDAS project at NCEP
- “HRAP”-NLDAS
- Global LDAS (GLDAS)
• Methods/examples:
- Surface emissivity/Tb assimilation
- Soil moisture
- Snow
• Summary/Future
Outline
4
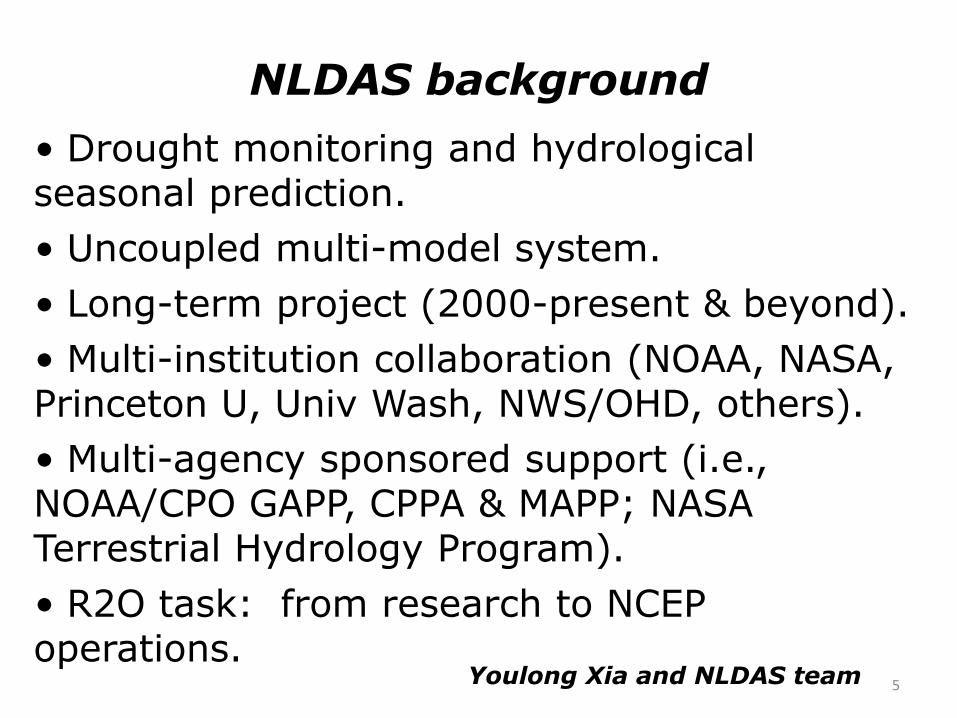
• Drought monitoring and hydrological seasonal prediction.
• Uncoupled multi-model system.
• Long-term project (2000-present & beyond).
• Multi-institution collaboration (NOAA, NASA, Princeton U, Univ Wash, NWS/OHD, others).
• Multi-agency sponsored support (i.e., NOAA/CPO GAPP, CPPA & MAPP; NASA Terrestrial Hydrology Program).
• R2O task: from research to NCEP operations.
5
NLDAS background
Youlong Xia and NLDAS team
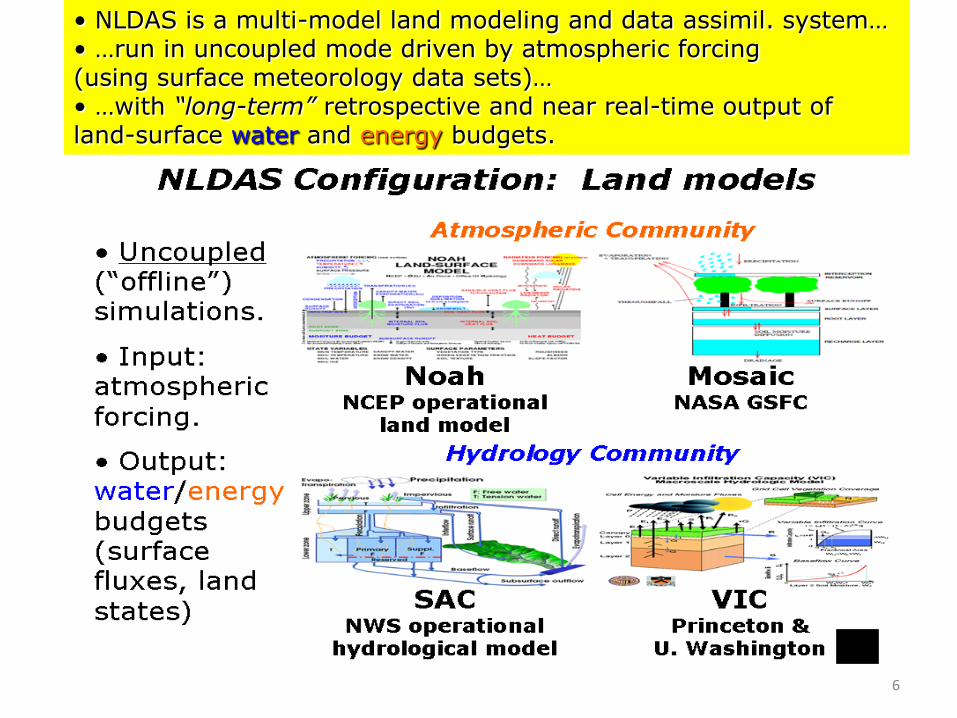
• NLDAS is a multi-model land modeling and data assimil. system… • …run in uncoupled mode driven by atmospheric forcing (using surface meteorology data sets)… • …with “long-term” retrospective and near real-time output of land-surface water and energy budgets.
6
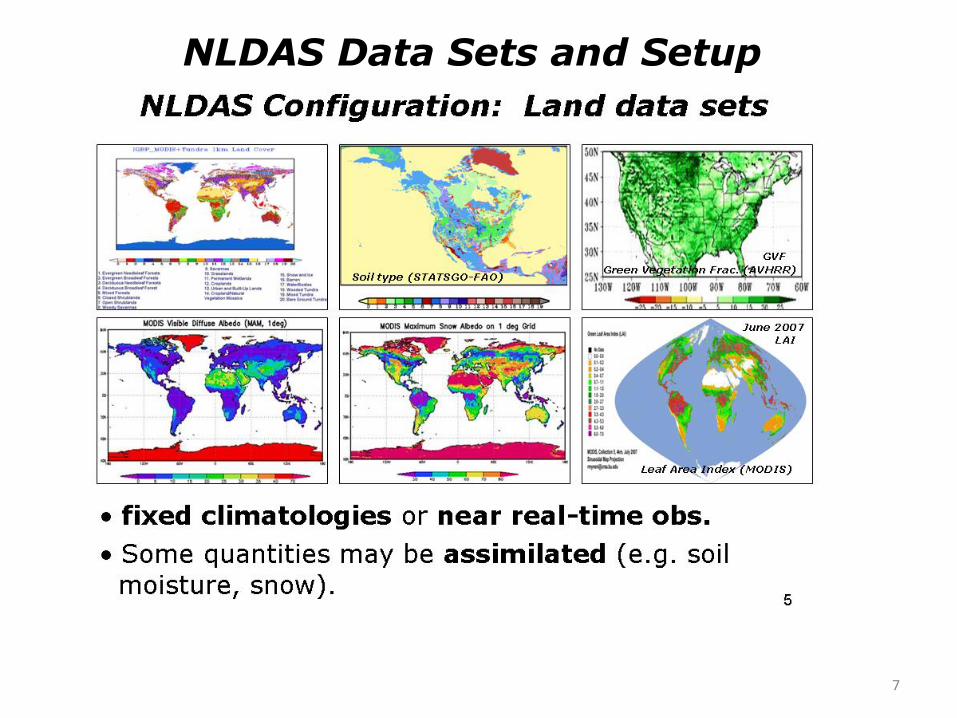
NLDAS Data Sets and Setup
7
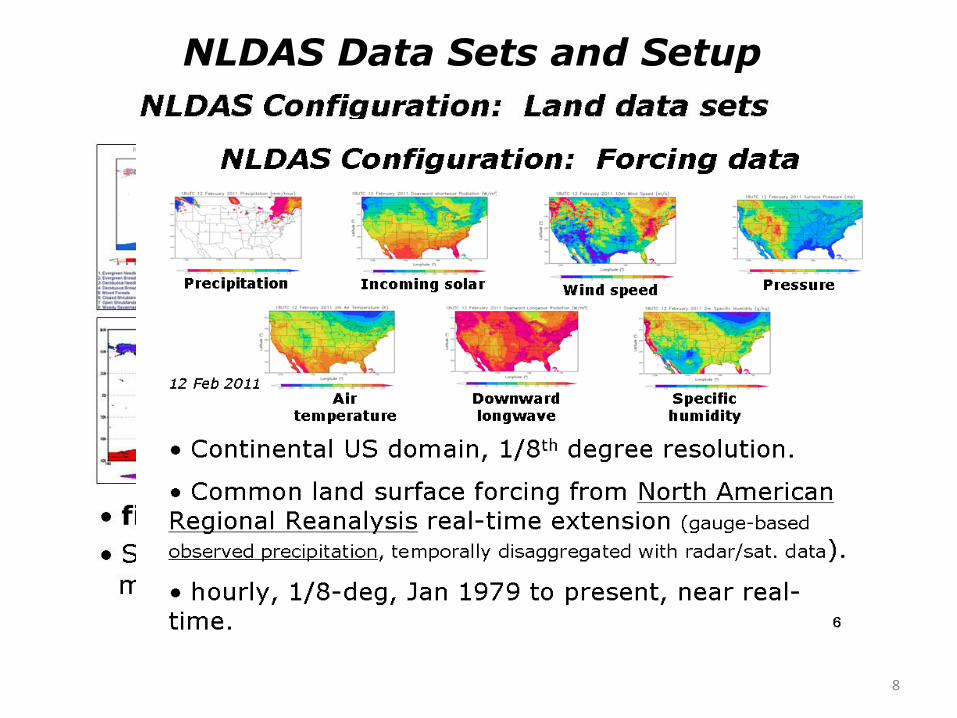
NLDAS Data Sets and Setup
8
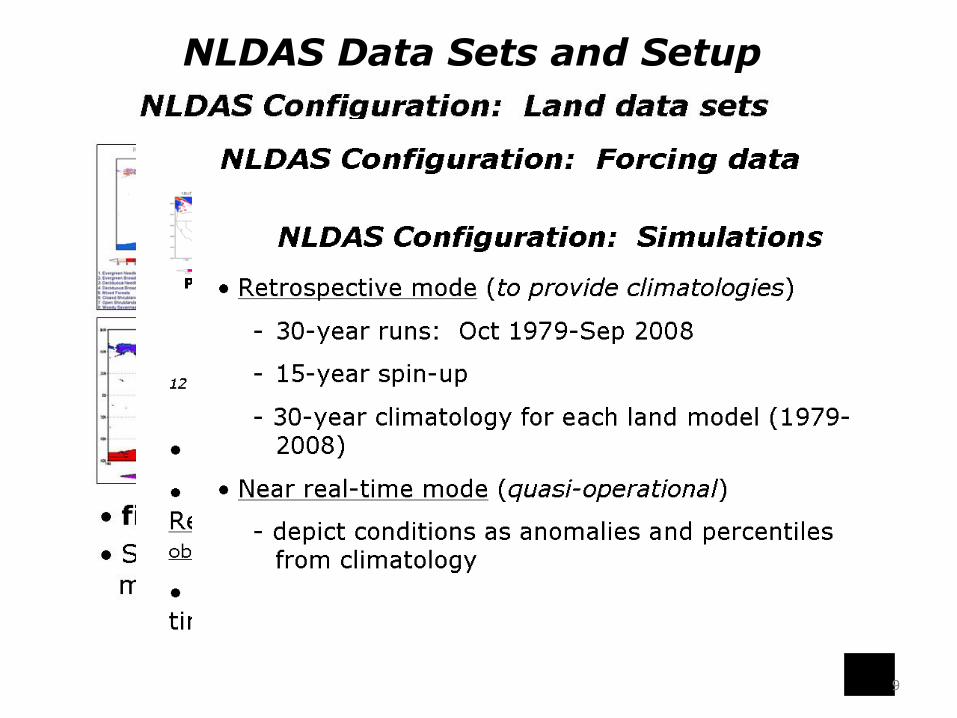
NLDAS Data Sets and Setup
9
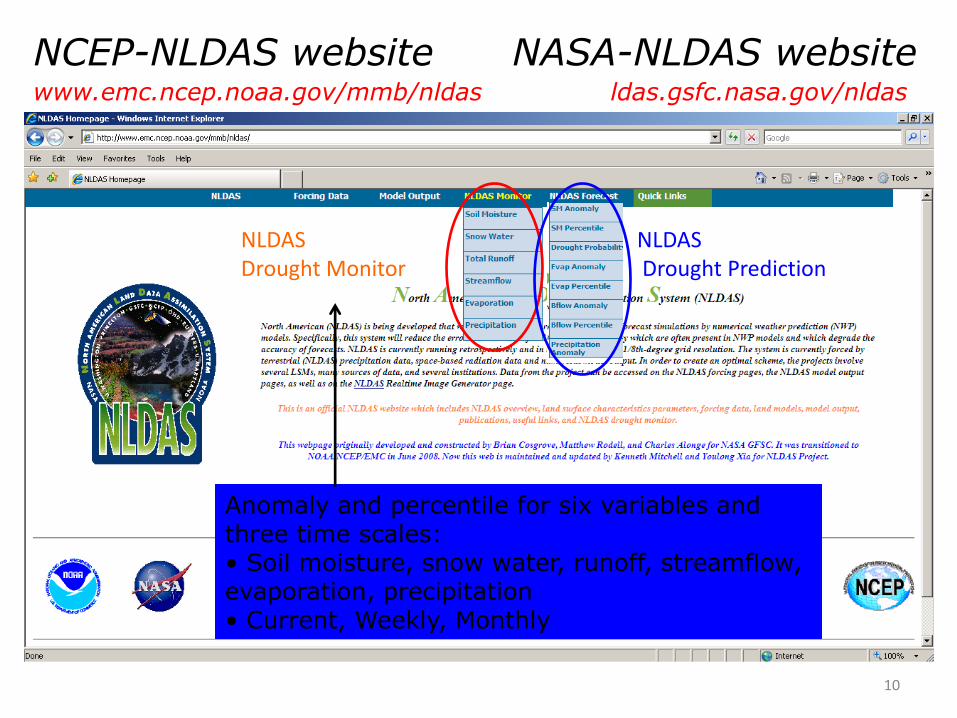
www.emc.ncep.noaa.gov/mmb/nldas
NLDAS Drought Monitor
NLDAS Drought Prediction
Anomaly and percentile for six variables and three time scales: • Soil moisture, snow water, runoff, streamflow, evaporation, precipitation • Current, Weekly, Monthly
NCEP-NLDAS website NASA-NLDAS website
10
ldas.gsfc.nasa.gov/nldas
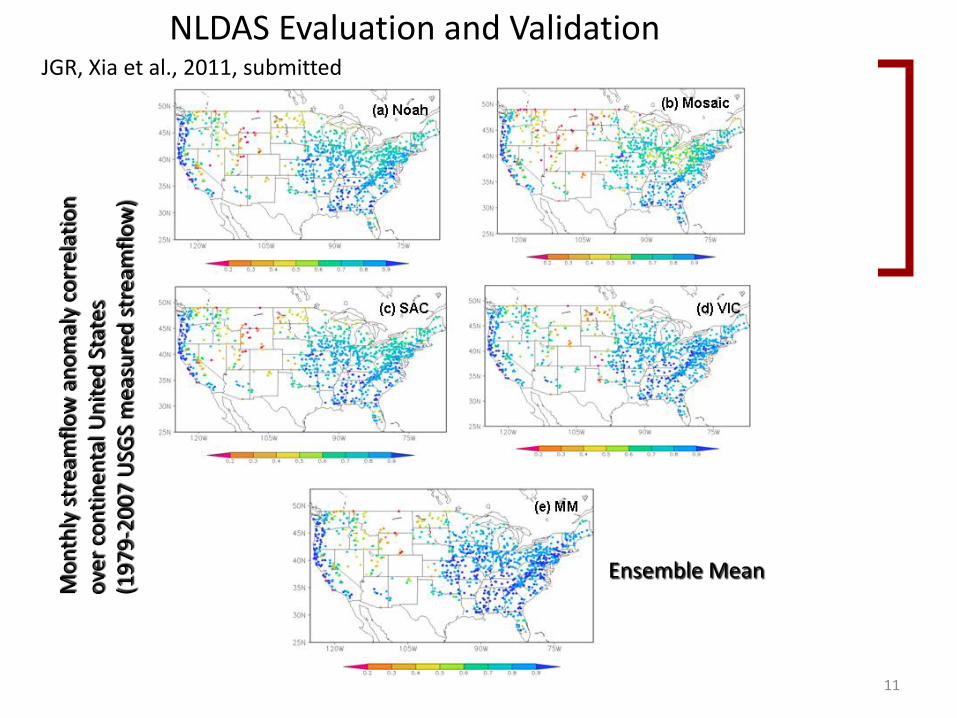
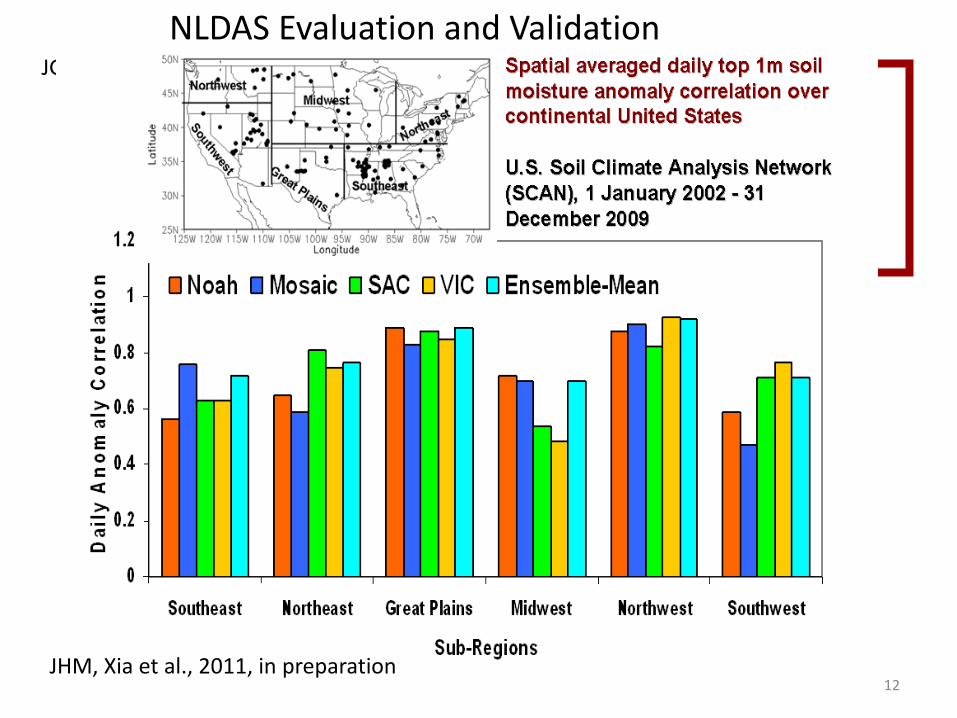
NLDAS Evaluation and Validation
Energy flux validation from tower: net radiation, sensible heat, latent heat, ground heat Water flux: evaporation, total runoff/streamflow State variables: soil moisture, soil temperature, skin temperature, snow water equivalent, snow cover
Mo
nth
ly s
trea
mfl
ow
an
om
aly
corr
elat
ion
o
ver
con
tin
en
tal U
nit
ed S
tate
s (1
97
9-2
00
7 U
SGS
mea
sure
d s
trea
mfl
ow
)
Ensemble Mean
JGR, Xia et al., 2011, submitted
11
NLDAS Evaluation and Validation
Energy flux validation from tower: net radiation, sensible heat, latent heat, ground heat Water flux: evaporation, total runoff/streamflow State variables: soil moisture, soil temperature, skin temperature, snow water equivalent, snow cover
Mo
nth
ly s
trea
mfl
ow
an
om
aly
corr
elat
ion
o
ver
con
tin
en
tal U
nit
ed S
tate
s (1
97
9-2
00
7 U
SGS
mea
sure
d s
trea
mfl
ow
)
Ensemble Mean
JGR, Xia et al., 2011, submitted
JHM, Xia et al., 2011, in preparation 12
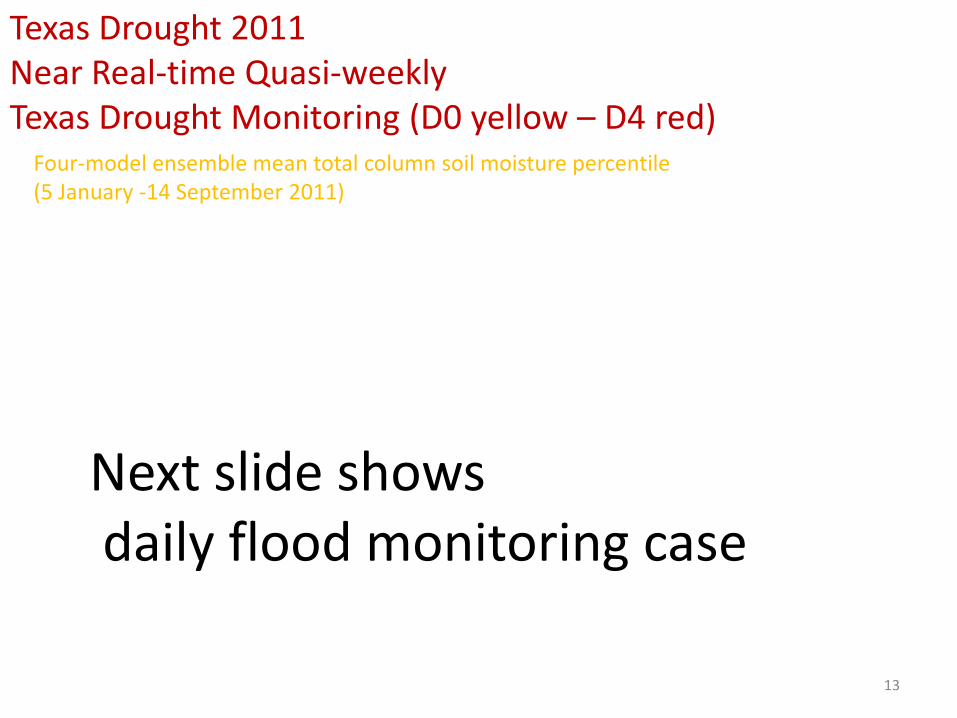
Texas Drought 2011 Near Real-time Quasi-weekly Texas Drought Monitoring (D0 yellow – D4 red)
Four-model ensemble mean total column soil moisture percentile (5 January -14 September 2011)
Next slide shows daily flood monitoring case
13
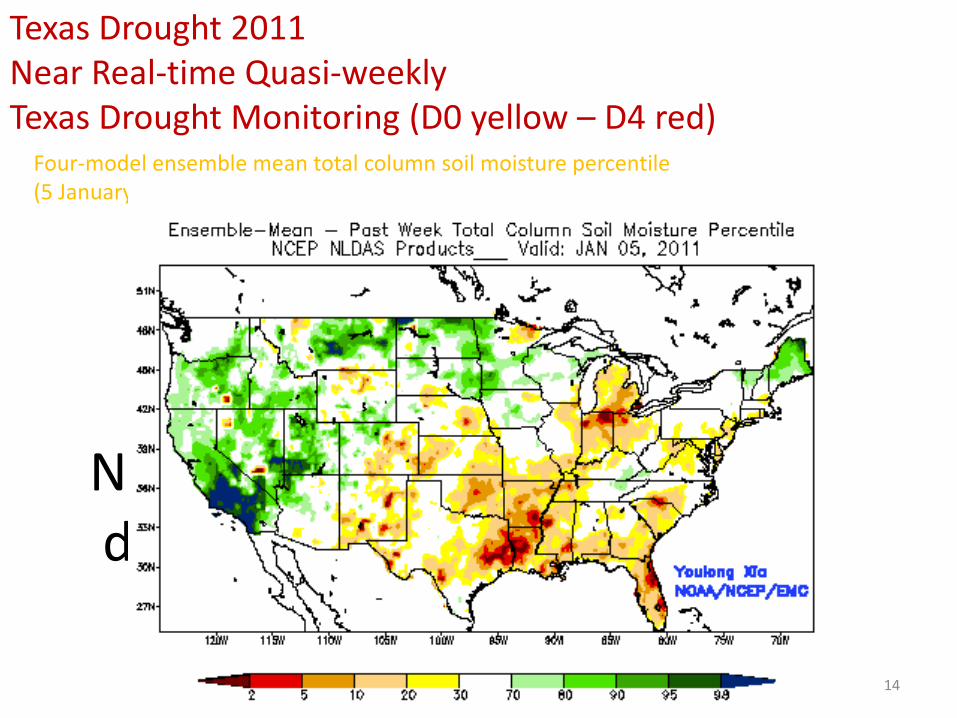
Texas Drought 2011 Near Real-time Quasi-weekly Texas Drought Monitoring (D0 yellow – D4 red)
Four-model ensemble mean total column soil moisture percentile (5 January -14 September 2011)
Next slide shows daily flood monitoring case
14

Northeast Flood 2011 Monitoring
Impact of Hurricane Irene and Tropical Storm Lee
Ensemble mean daily streamflow anomaly (m3/s) 20 Aug – 17 Sep
NLDAS Application to U.S. Drought Monitor (USDM) and USDA
15
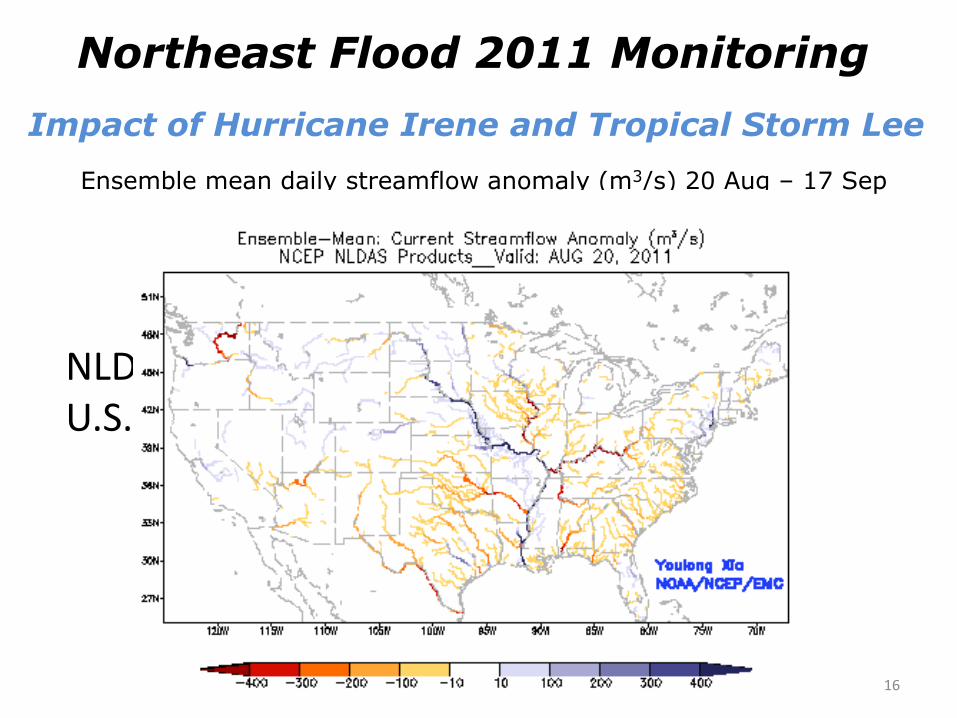
Northeast Flood 2011 Monitoring
Impact of Hurricane Irene and Tropical Storm Lee
Ensemble mean daily streamflow anomaly (m3/s) 20 Aug – 17 Sep
NLDAS Application to U.S. Drought Monitor (USDM) and USDA
16
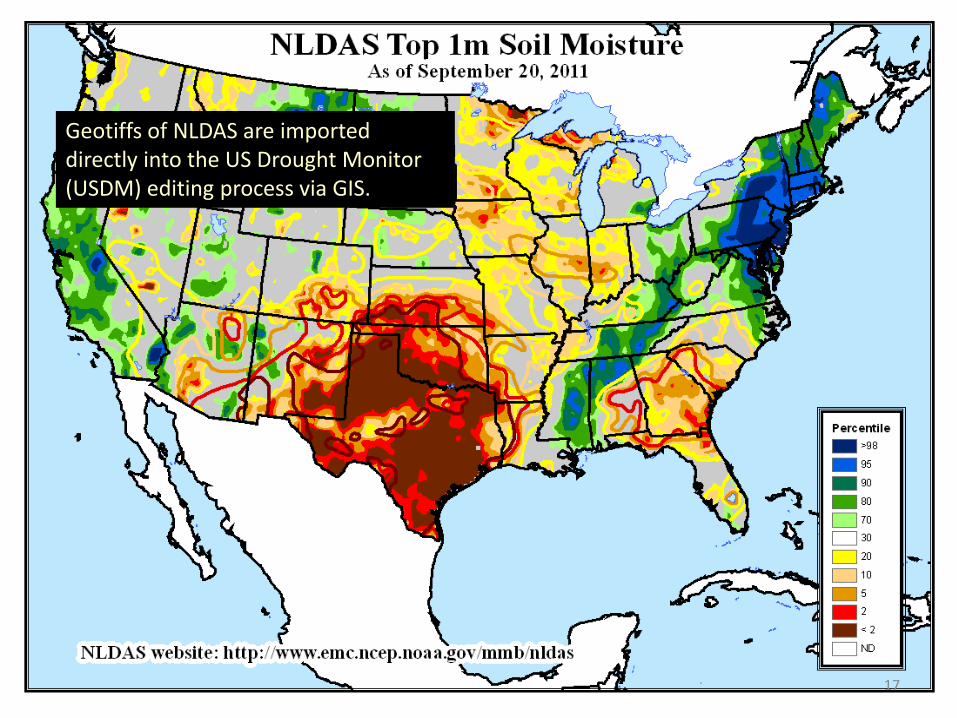
Geotiffs of NLDAS are imported directly into the US Drought Monitor (USDM) editing process via GIS.
17

NLDAS GIS data are an integral part of the USDM process, both operationally and also as part of a weekly ppt sent to the USDM Listserv.
18
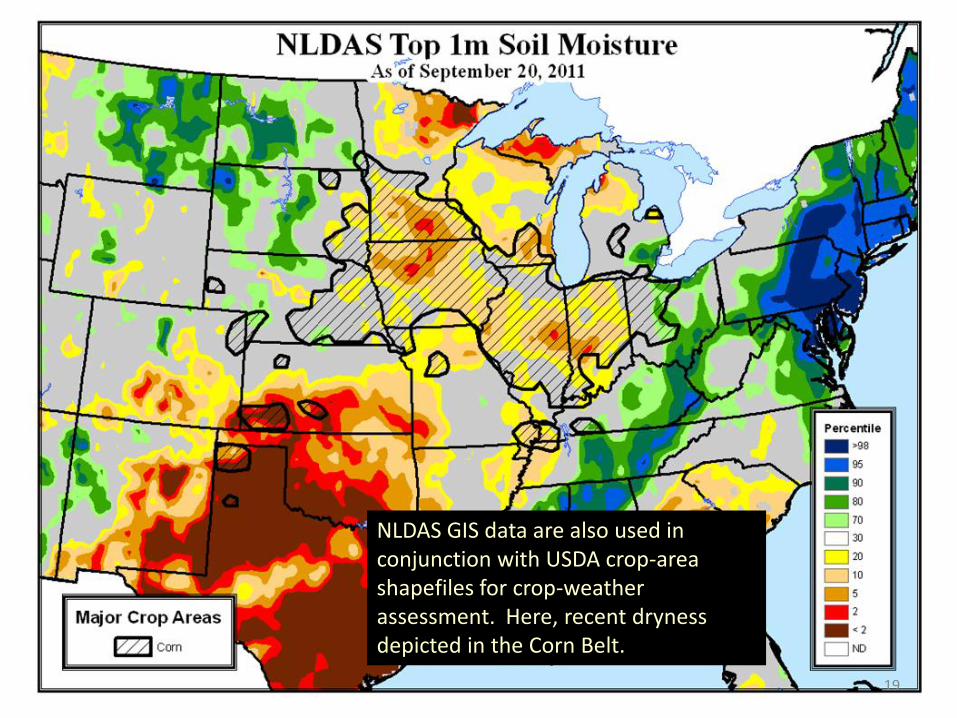
NLDAS GIS data are also used in conjunction with USDA crop-area shapefiles for crop-weather assessment. Here, recent dryness depicted in the Corn Belt.
19
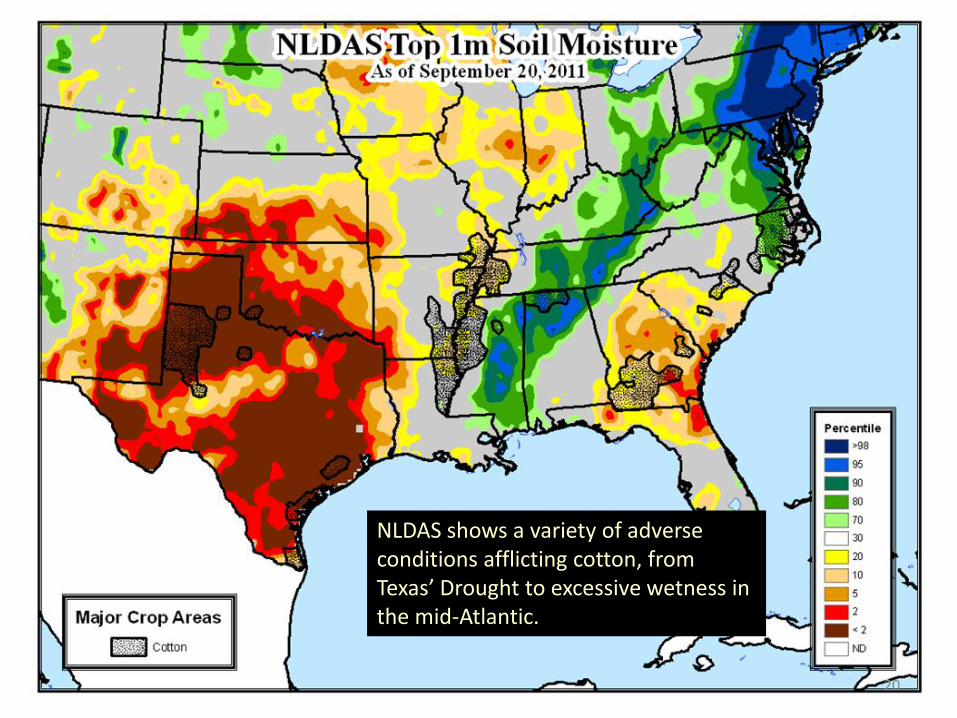
NLDAS shows a variety of adverse conditions afflicting cotton, from Texas’ Drought to excessive wetness in the mid-Atlantic.
20
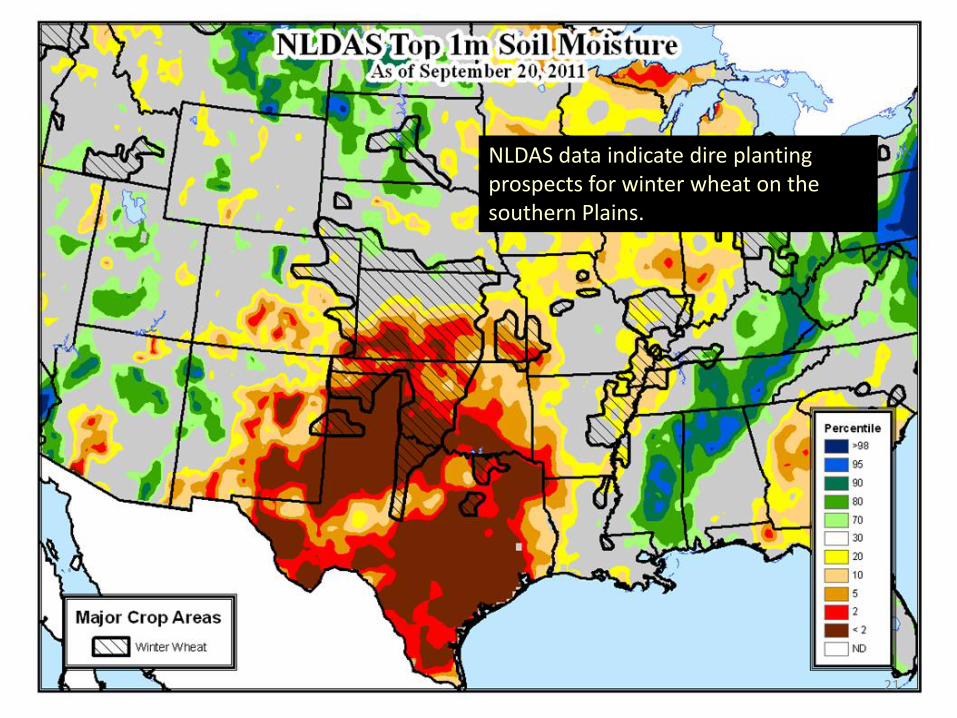
NLDAS data indicate dire planting prospects for winter wheat on the southern Plains.
21
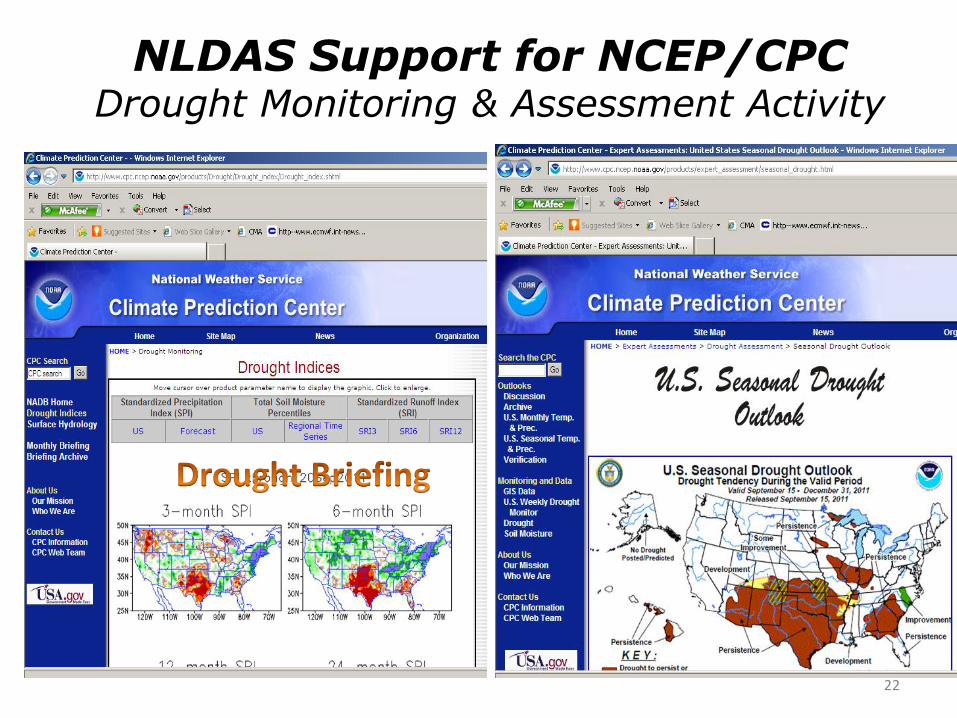
NLDAS Support for NCEP/CPC Drought Monitoring & Assessment Activity
22
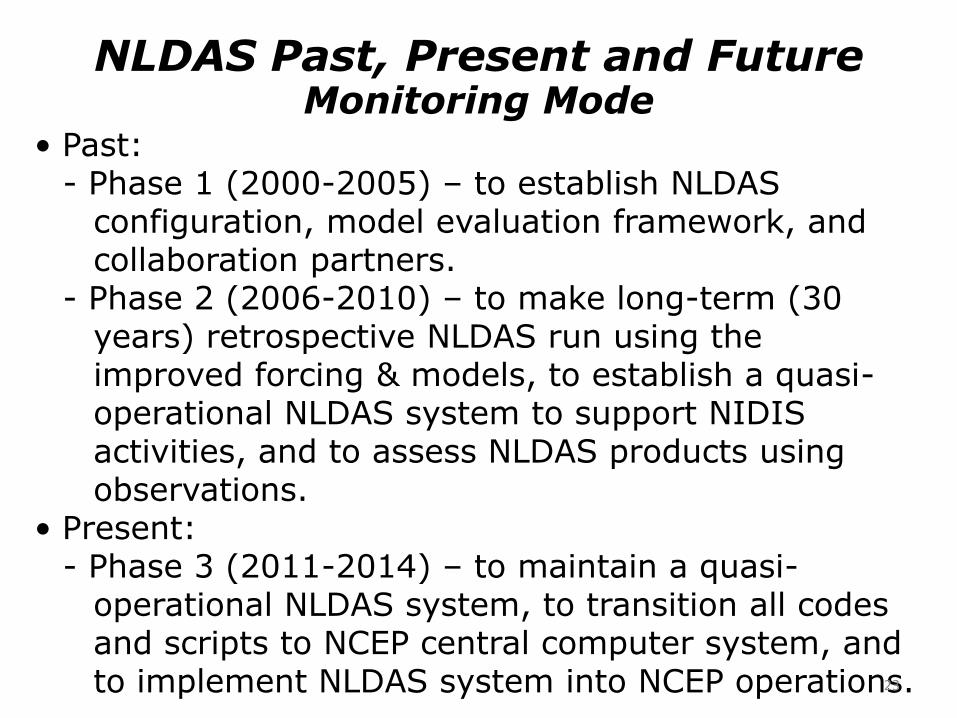
NLDAS Past, Present and Future
• Past: - Phase 1 (2000-2005) – to establish NLDAS
configuration, model evaluation framework, and collaboration partners.
- Phase 2 (2006-2010) – to make long-term (30 years) retrospective NLDAS run using the improved forcing & models, to establish a quasi-operational NLDAS system to support NIDIS activities, and to assess NLDAS products using observations.
• Present: - Phase 3 (2011-2014) – to maintain a quasi-
operational NLDAS system, to transition all codes and scripts to NCEP central computer system, and to implement NLDAS system into NCEP operations.
Monitoring Mode
23

• Future: - EMC will maintain two NLDAS systems: operational
version (current) & research version. Any upgrades from both forcing and models from research community will be quickly implemented in the research version with internal tests at EMC (i.e. “tempest” and/or NCEP CCS computer).
- EMC will collaborate NASA/GSFC to install LIS for the NLDAS system to construct a real data assimilation system to assimilate observed data from both in-situ and remote sensing.
- EMC will collaborate with NWS/OHD to extend a fine scale (~4 km “HRAP” grid) NLDAS system.
24
NLDAS Past, Present and Future Monitoring Mode

• Future: - EMC will extend the NLDAS system from NLDAS
domain to whole North America, to support North American Drought Monitor.
- EMC will collaborate NCEP/CPC and other NLDAS partners to further extend NLDAS system from whole North America to the globe to support Global Drought Monitor being initiated by multi-countries as EMC has developed its own CFS-GLDAS system.
- EMC will collaborate with its partners to improve land surface models (physics) and test the role of NLDAS and GLDAS initial conditions in coupled models.
25
NLDAS Past, Present and Future Monitoring Mode

NLDAS development & evaluation using the NASA Land Information System (LIS)
The Land Information System (LIS)
NLDAS LSMs to be upgraded to the latest model versions (Noah3.2/3.3, Noah-MP, GMAO’s Catchment, etc.) within the Land Information System (LIS) framework, which will allow data assimilation of soil moisture and snow products to help improve drought diagnosis in NLDAS. NLDAS products and drought monitoring skill will be evaluated using numerous observations.
Using NLDAS-2 forcing in LIS with Noah3.2, Peters-Lidard et al. (2011, Hydrological Processes, submitted) showed an improvement of the RMSE of latent heat flux when using data assimilation of remotely-sensed soil moisture as compared to gridded FLUXNET ET data (Jung et al., 2010).
Contact: [email protected] 26
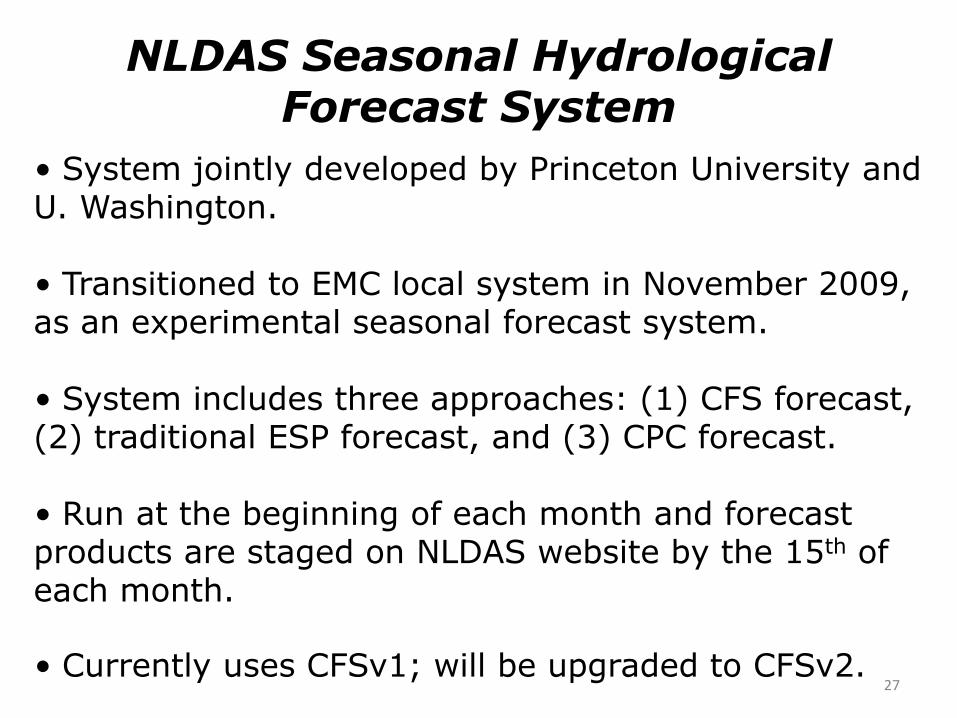
• System jointly developed by Princeton University and U. Washington. • Transitioned to EMC local system in November 2009, as an experimental seasonal forecast system. • System includes three approaches: (1) CFS forecast, (2) traditional ESP forecast, and (3) CPC forecast. • Run at the beginning of each month and forecast products are staged on NLDAS website by the 15th of each month. • Currently uses CFSv1; will be upgraded to CFSv2.
NLDAS Seasonal Hydrological Forecast System
27
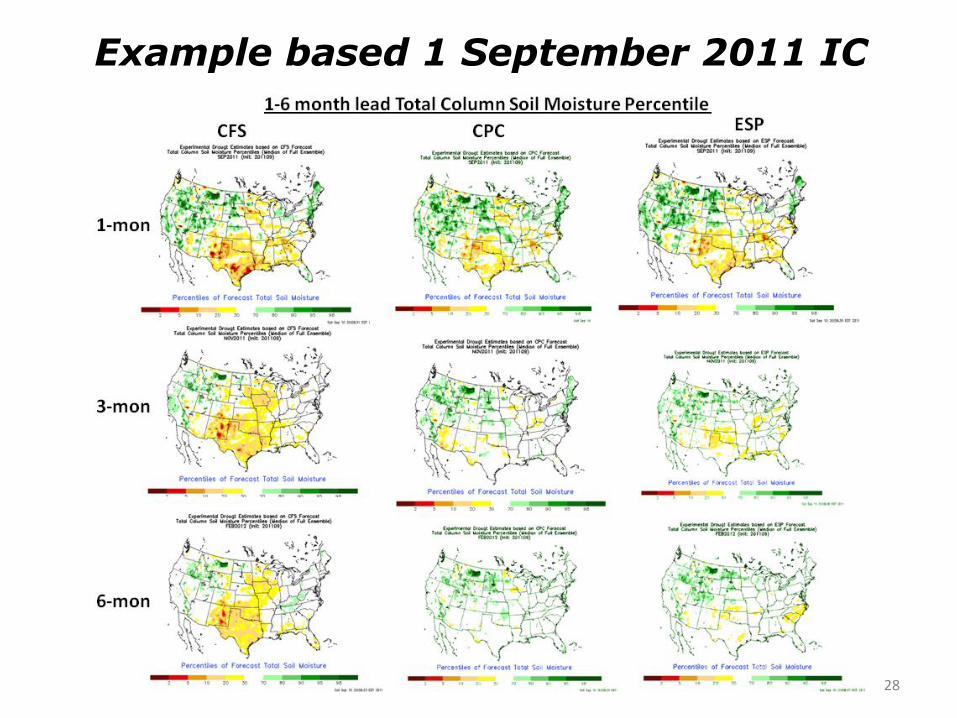
Example based 1 September 2011 IC
28

Example based 1 September 2011 IC
As drought briefing concluded, Texas drought will possibly continue one season. Here CFS shows that Texas drought will continue two seasons and the CPC and ESP do not. This will be verified from USDM and in next several months via CPC.
29
EMC and CPC’s participation in NLDAS Prediction Mode
Seasonal hydrological system will be extended and assessed by a CTB project (PI: Eric Wood). As collaborators, (1) EMC (Youlong Xia) will continue to run transitioned system
(CFSv1) in quasi-operational mode to support CPC’s drought briefing and seasonal drought outlook and will prepare to run its upgrade version CFSv2.
(2) EMC will collaborate with CTB PIs to move the system to CTB computer. EMC will make internal tests and evaluations of this system.
(3) EMC will collaborate with Lifeng Luo via CTB to add SAC-HT and Noah to this system.
(4) CPC (Kingtse Mo) will perform verification and assessment studies.
30
• Motivation
• Applications:
- North American Land Data Assimilation System (NLDAS) -- “Flagship” LDAS project at NCEP
- “HRAP”-NLDAS
- Global LDAS (GLDAS)
• Methods/examples:
- Surface emissivity/Tb assimilation
- Soil moisture
- Snow
• Summary/Future
Outline
31

HRAP-NLDAS: high resolution hydrological modeling over CONUS, HRAP grid (~4km) using operational NOAA NCEP and NOAA OHD models
The study has three main components which together provide a comprehensive suite of modeling-related improvements enabling both improved NOAA/NWS/OHD and NCEP hydrological and land surface forecasts and analyses, as well as investigations into land-atmosphere interactions: I. Model Support-Related Improvements
Improved downscaling of 1/8th degree NLDAS forcing to 4km HRAP grid Enhanced spin-up strategies for retrospective and real-time simulations
II. Model Component Improvements Improved snow assimilation modules for Noah and SAC-HT/Snow17 High-resolution routing capability for Noah and SAC-HT in LIS Testing of NOAA ET physics in SAC-HT Testing of improved sub-surface runoff modeling in SAC-HT Integration of dynamic parameter calculation module into Snow17 Enhanced Noah bundle upgrades including snow albedo, ground water treatment.
III. Model Output Production of 31-year 4km retrospective SAC-HT/Noah simulations Validation of model output Operational application of retrospective simulations
32 Jiarui Dong, Brian Cosgrove (NWS/OHD) et al
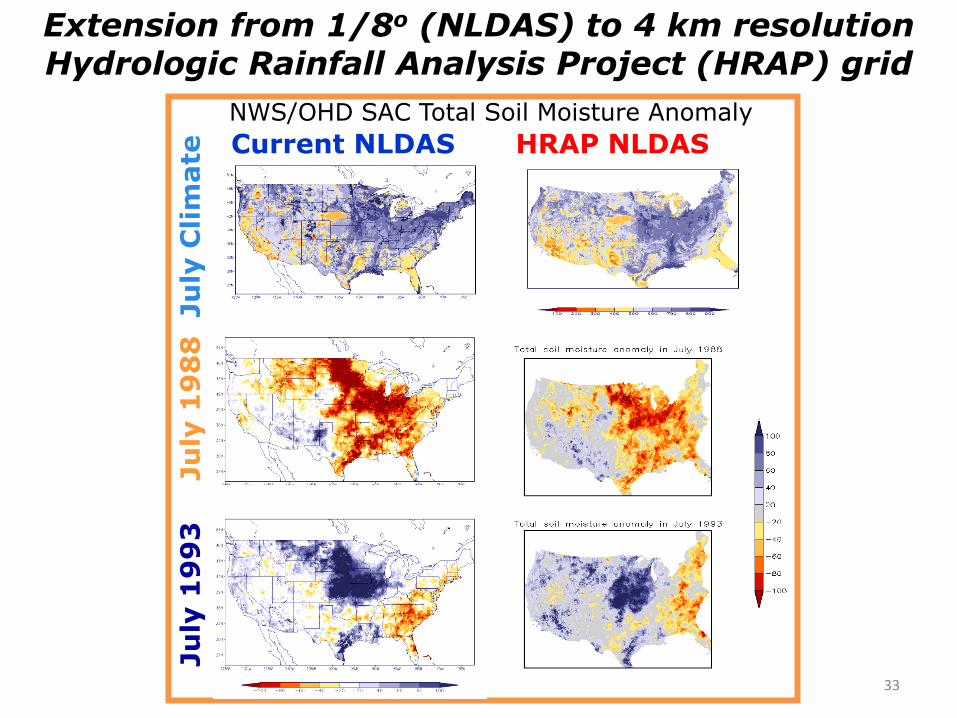
Extension from 1/8o (NLDAS) to 4 km resolution Hydrologic Rainfall Analysis Project (HRAP) grid
Ju
ly C
lim
ate
Ju
ly 1
98
8
Ju
ly 1
99
3
HRAP NLDAS
NWS/OHD SAC Total Soil Moisture Anomaly
Current NLDAS
33
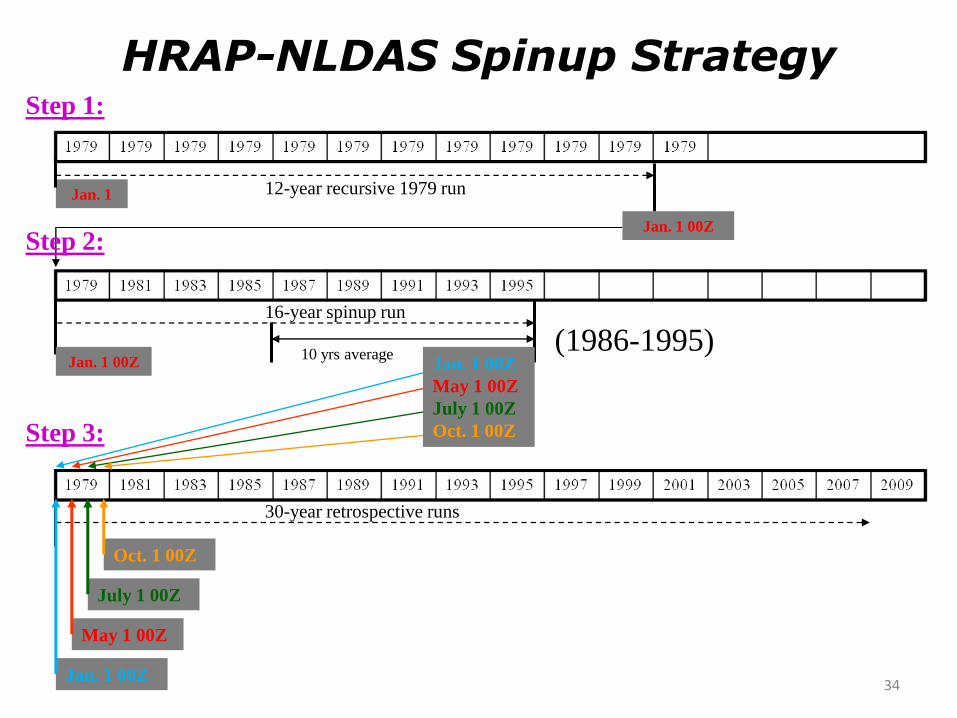
16-year spinup run
10 yrs average Jan. 1 00Z
30-year retrospective runs
12-year recursive 1979 run Jan. 1
HRAP-NLDAS Spinup Strategy
(1986-1995)
Step 1:
Step 2:
Step 3:
Oct. 1 00Z
July 1 00Z
May 1 00Z
Jan. 1 00Z
Jan. 1 00Z
May 1 00Z
July 1 00Z
Oct. 1 00Z
34
Jan. 1 00Z

Soil
Moisture
Spin-up
Run starts 2 Jan 1979
35
CE
NW NC
SW
NE
SE
Layer 1
Layer 4
Layer 2
Layer 3
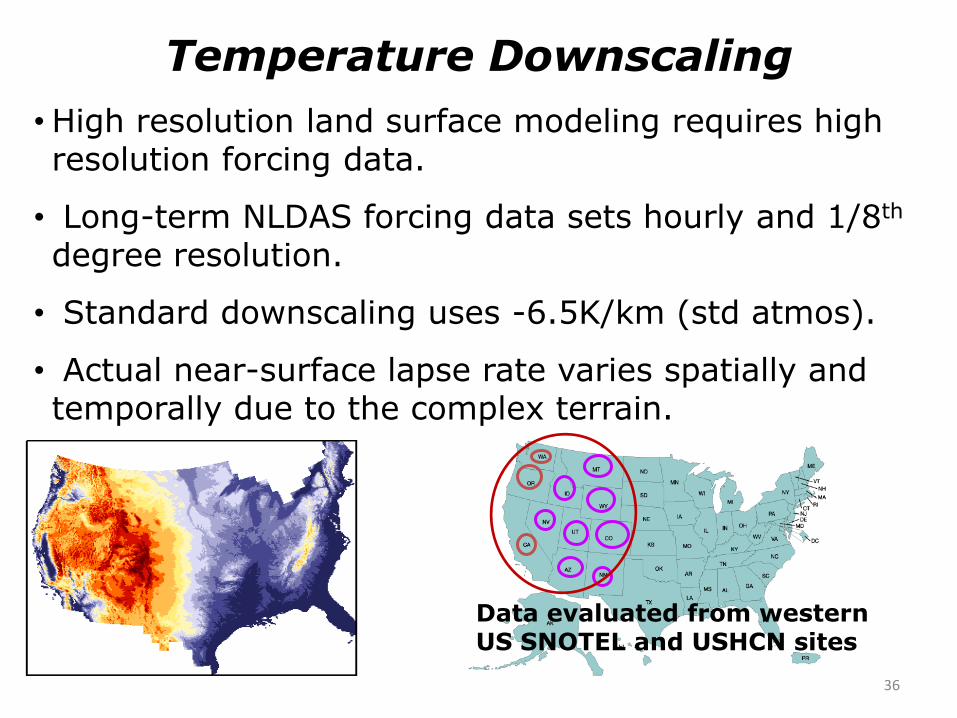
Temperature Downscaling
• High resolution land surface modeling requires high resolution forcing data.
• Long-term NLDAS forcing data sets hourly and 1/8th degree resolution.
• Standard downscaling uses -6.5K/km (std atmos).
• Actual near-surface lapse rate varies spatially and temporally due to the complex terrain.
36
Data evaluated from western US SNOTEL and USHCN sites
-9
-8
-7
-6
-5
-4
-3
-2
-1
0
1 2 3 4 5 6 7 8 9 10 11 12
month
lap
es r
ate
(K
/km
)
tavg_mt
-6.5K/km
tavg_wy
tavg_nv
tavg_co
tavg_utah
tavg_az
tavg_nm
-9
-8
-7
-6
-5
-4
-3
-2
-1
0
1 2 3 4 5 6 7 8 9 10 11 12
month
lap
es
ra
te (K
/km
)
tavg_catavg_or-6.5K/kmtavg_wa
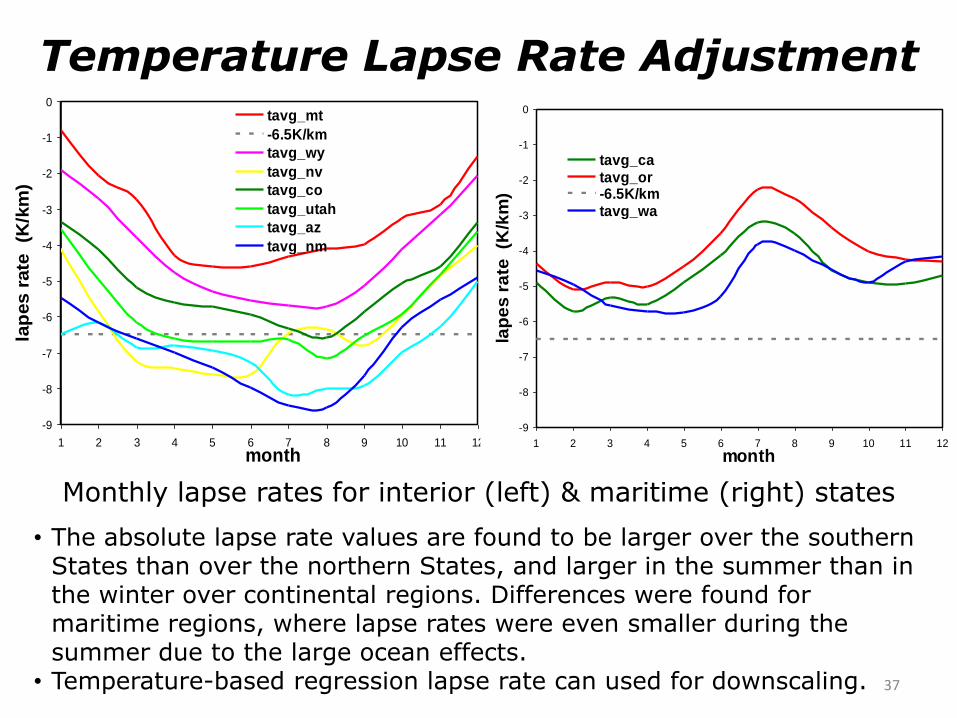
• The absolute lapse rate values are found to be larger over the southern States than over the northern States, and larger in the summer than in the winter over continental regions. Differences were found for maritime regions, where lapse rates were even smaller during the summer due to the large ocean effects.
• Temperature-based regression lapse rate can used for downscaling.
Monthly lapse rates for interior (left) & maritime (right) states
37
Temperature Lapse Rate Adjustment
• Motivation
• Applications:
- North American Land Data Assimilation System (NLDAS) -- “Flagship” LDAS project at NCEP
- “HRAP”-NLDAS
- Global LDAS (GLDAS)
• Methods/examples:
- Surface emissivity/Tb assimilation
- Soil moisture
- Snow
• Summary/Future
Outline
38
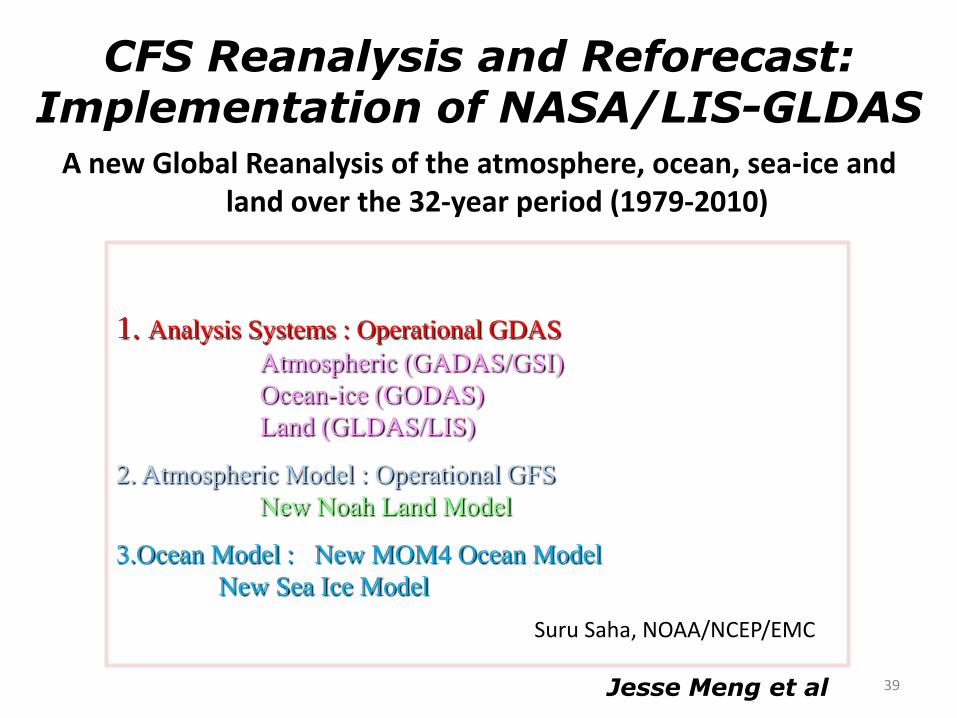
39
A new Global Reanalysis of the atmosphere, ocean, sea-ice and land over the 32-year period (1979-2010)
Suru Saha, NOAA/NCEP/EMC
CFS Reanalysis and Reforecast: Implementation of NASA/LIS-GLDAS
1. Analysis Systems : Operational GDAS
Atmospheric (GADAS/GSI)
Ocean-ice (GODAS)
Land (GLDAS/LIS)
2. Atmospheric Model : Operational GFS
New Noah Land Model
3.Ocean Model : New MOM4 Ocean Model
New Sea Ice Model
Jesse Meng et al
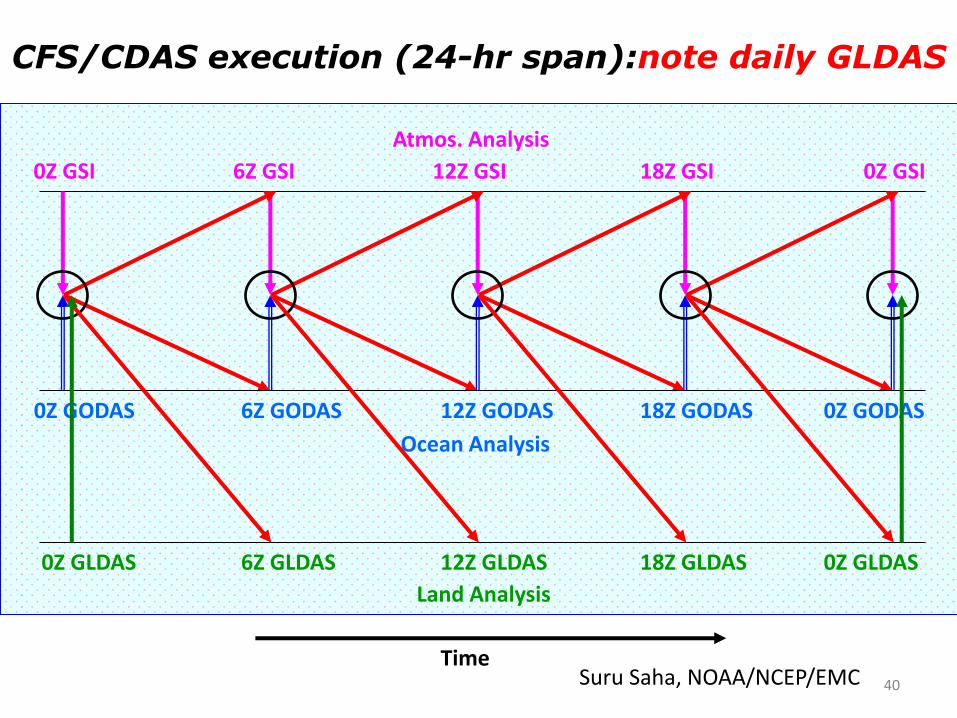
40
0Z GSI 6Z GSI 18Z GSI
0Z GODAS
0Z GSI
CFS/CDAS execution (24-hr span):note daily GLDAS
6Z GODAS 12Z GODAS 0Z GODAS
12Z GSI
18Z GODAS
Atmos. Analysis
Ocean Analysis
12Z GLDAS 6Z GLDAS 18Z GLDAS 0Z GLDAS 0Z GLDAS
Land Analysis
Time Suru Saha, NOAA/NCEP/EMC
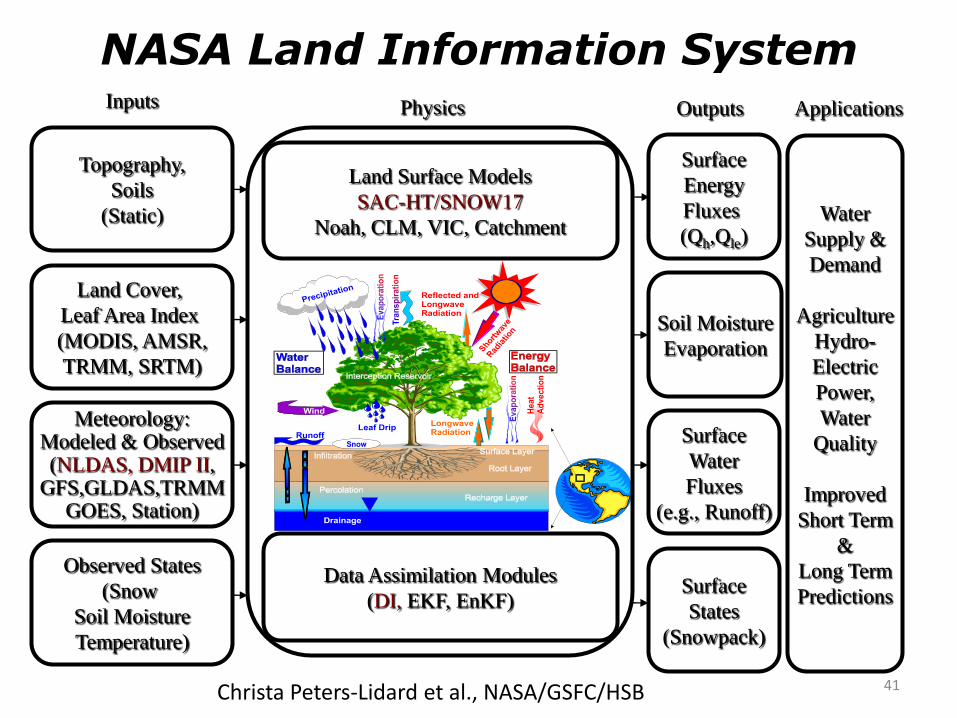
NASA Land Information System
Topography,
Soils
(Static)
Land Cover,
Leaf Area Index
(MODIS, AMSR,
TRMM, SRTM)
Meteorology: Modeled & Observed (NLDAS, DMIP II,
GFS,GLDAS,TRMM GOES, Station)
Observed States
(Snow
Soil Moisture
Temperature)
Land Surface Models
SAC-HT/SNOW17
Noah, CLM, VIC, Catchment
Data Assimilation Modules
(DI, EKF, EnKF)
Surface
Energy
Fluxes
(Qh,Qle)
Soil Moisture
Evaporation
Surface
Water
Fluxes
(e.g., Runoff)
Surface
States
(Snowpack)
Inputs Outputs Physics
Water
Supply &
Demand
Agriculture
Hydro-
Electric
Power,
Water
Quality
Improved
Short Term
&
Long Term
Predictions
Applications
41 Christa Peters-Lidard et al., NASA/GSFC/HSB
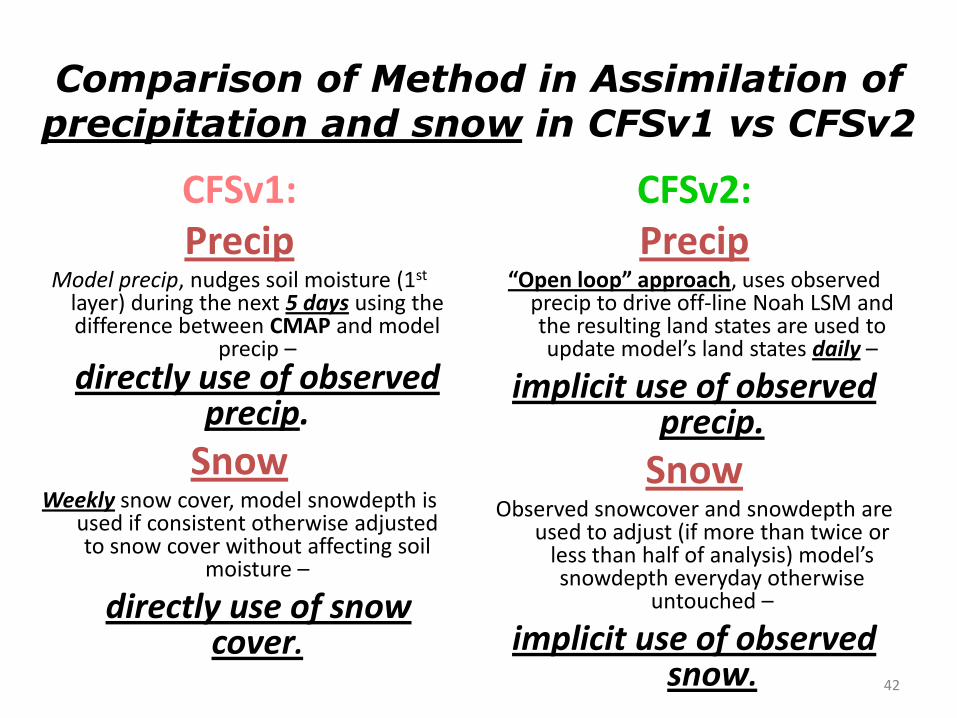
42
CFSv1: Precip
Model precip, nudges soil moisture (1st layer) during the next 5 days using the difference between CMAP and model
precip –
directly use of observed precip.
Snow Weekly snow cover, model snowdepth is
used if consistent otherwise adjusted to snow cover without affecting soil
moisture –
directly use of snow cover.
Comparison of Method in Assimilation of precipitation and snow in CFSv1 vs CFSv2
CFSv2: Precip
“Open loop” approach, uses observed precip to drive off-line Noah LSM and the resulting land states are used to update model’s land states daily –
implicit use of observed precip.
Snow Observed snowcover and snowdepth are
used to adjust (if more than twice or less than half of analysis) model’s snowdepth everyday otherwise
untouched –
implicit use of observed snow.
43
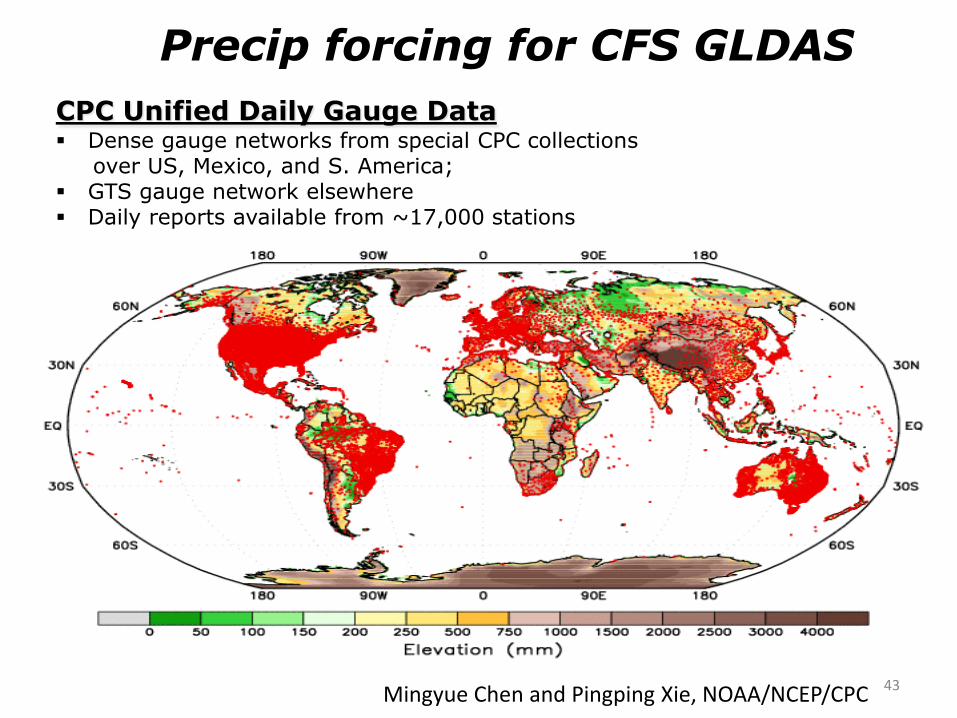
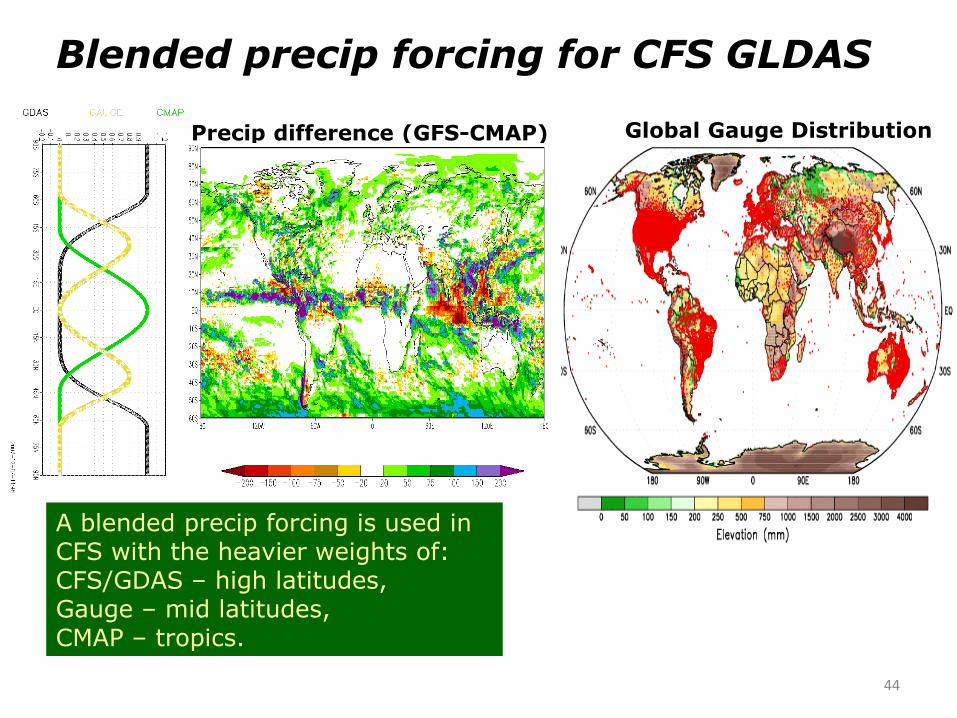
Precip forcing for CFS GLDAS
CPC Unified Daily Gauge Data Dense gauge networks from special CPC collections over US, Mexico, and S. America; GTS gauge network elsewhere Daily reports available from ~17,000 stations
Mingyue Chen and Pingping Xie, NOAA/NCEP/CPC
44
Precip difference (GFS-CMAP) Global Gauge Distribution
Blended precip forcing for CFS GLDAS
A blended precip forcing is used in CFS with the heavier weights of: CFS/GDAS – high latitudes, Gauge – mid latitudes, CMAP – tropics.
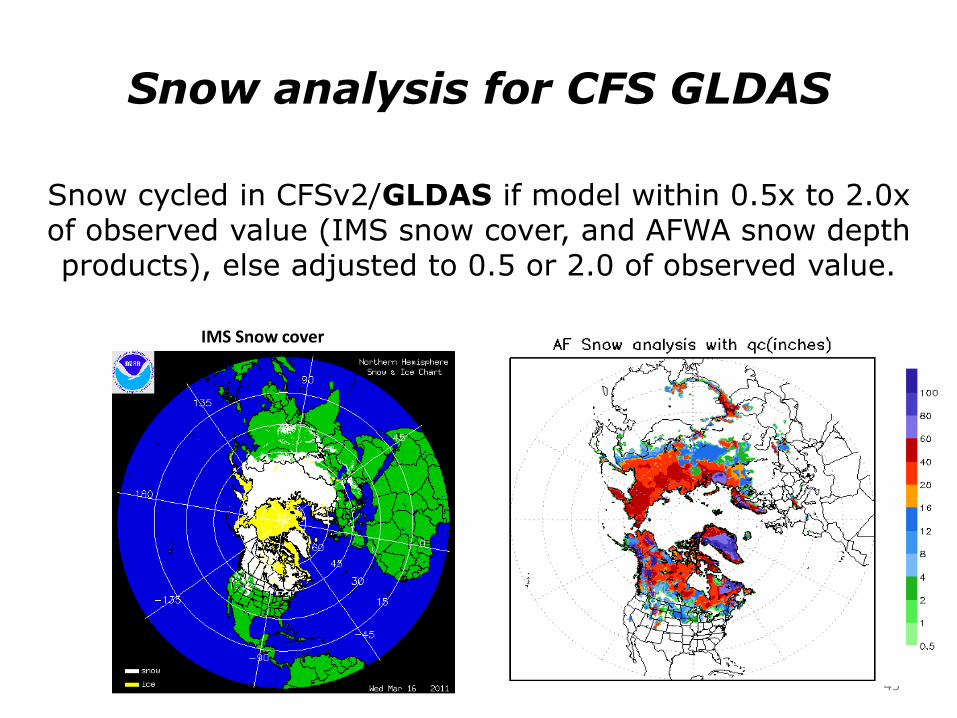
Snow analysis for CFS GLDAS
Snow cycled in CFSv2/GLDAS if model within 0.5x to 2.0x of observed value (IMS snow cover, and AFWA snow depth products), else adjusted to 0.5 or 2.0 of observed value.
45
IMS Snow cover
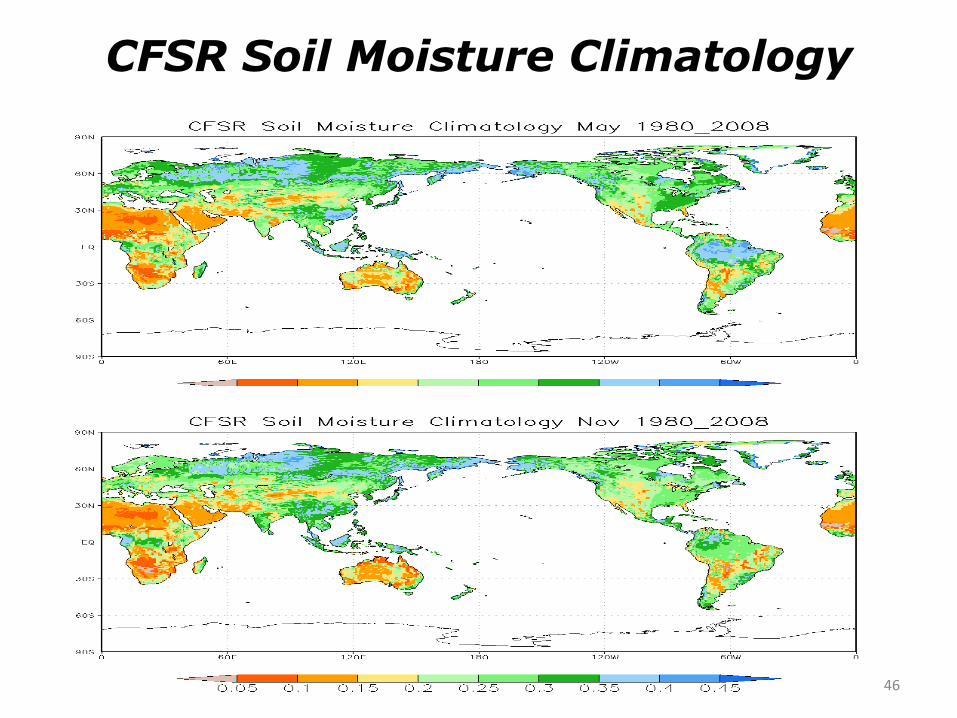
CFSR Soil Moisture Climatology
46
47
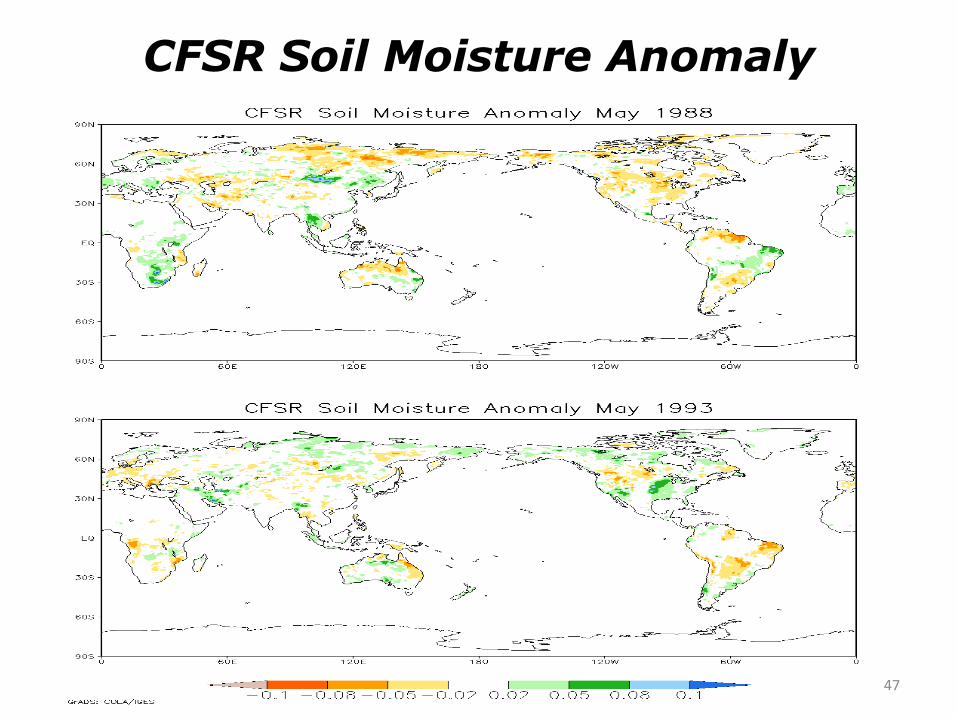
CFSR Soil Moisture Anomaly

48
Surface Water Budget

49
Surface Energy Budget
50
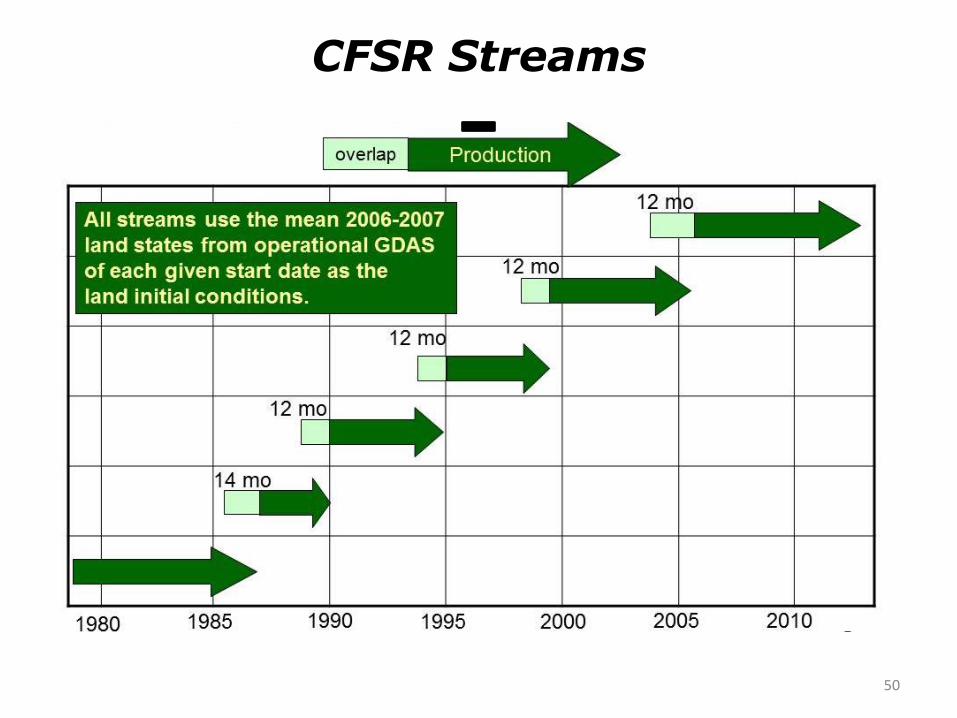
CFSR Streams
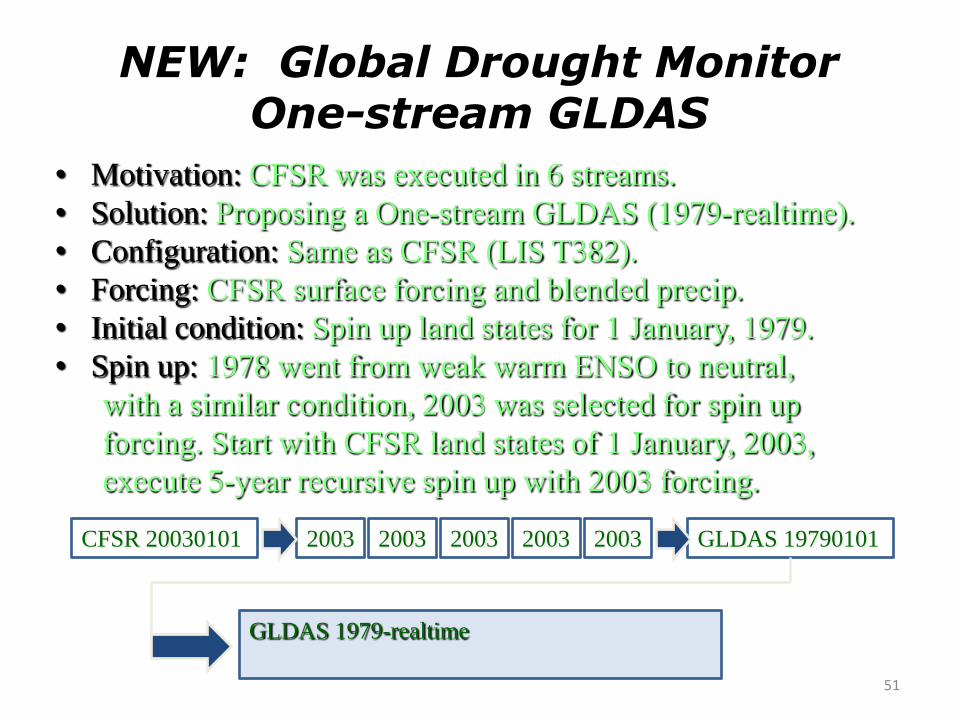
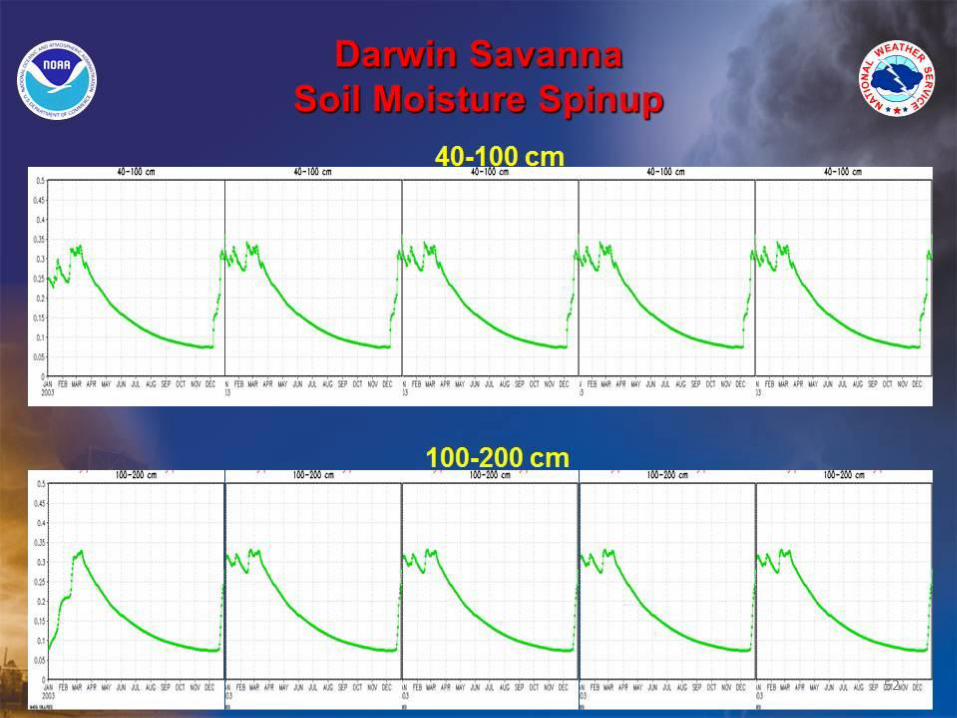
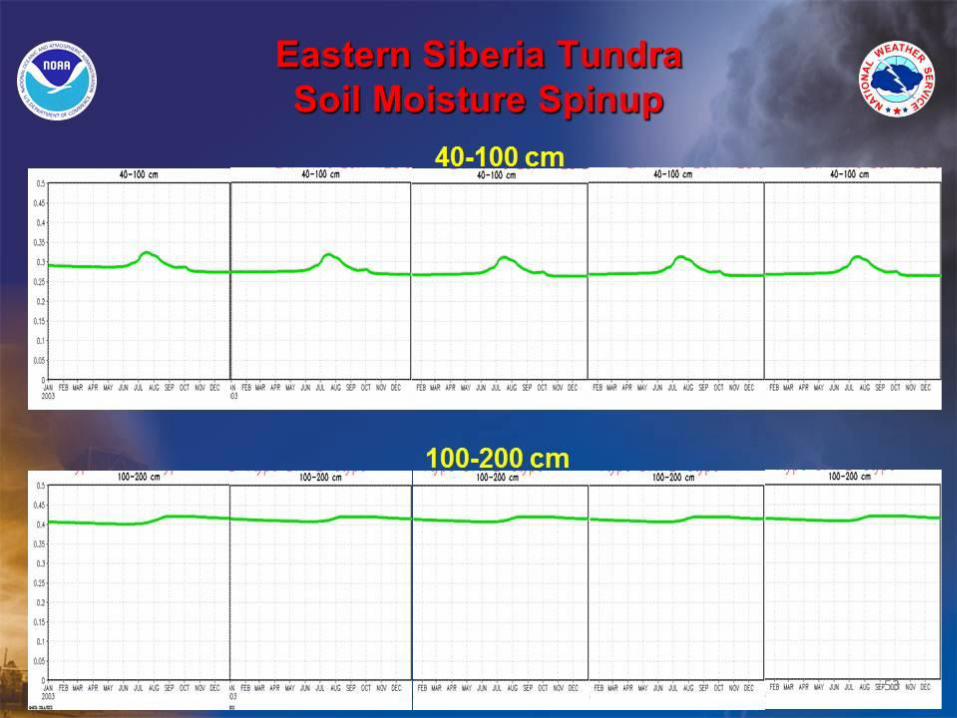
NEW: Global Drought Monitor One-stream GLDAS
• Motivation: CFSR was executed in 6 streams.
• Solution: Proposing a One-stream GLDAS (1979-realtime).
• Configuration: Same as CFSR (LIS T382).
• Forcing: CFSR surface forcing and blended precip.
• Initial condition: Spin up land states for 1 January, 1979.
• Spin up: 1978 went from weak warm ENSO to neutral,
with a similar condition, 2003 was selected for spin up
forcing. Start with CFSR land states of 1 January, 2003,
execute 5-year recursive spin up with 2003 forcing.
2003 2003 2003 2003 2003 CFSR 20030101 GLDAS 19790101
GLDAS 1979-realtime
51
52
53
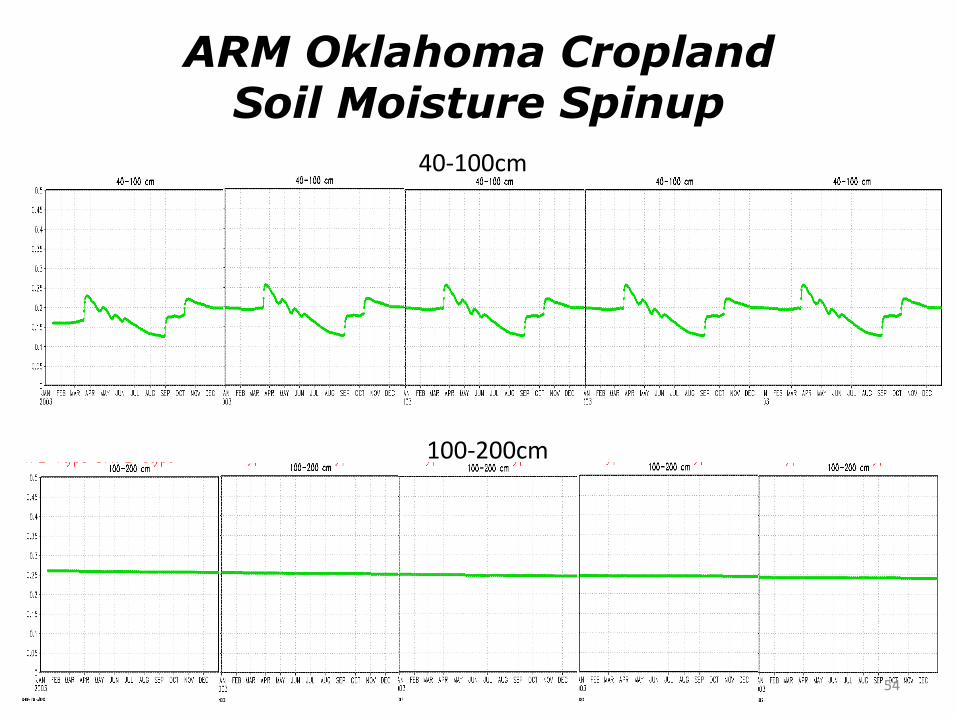
ARM Oklahoma Cropland Soil Moisture Spinup
40-100cm
100-200cm
54

Alaska Needleleaf Soil Moisture Spinup
40-100cm
100-200cm
55
56
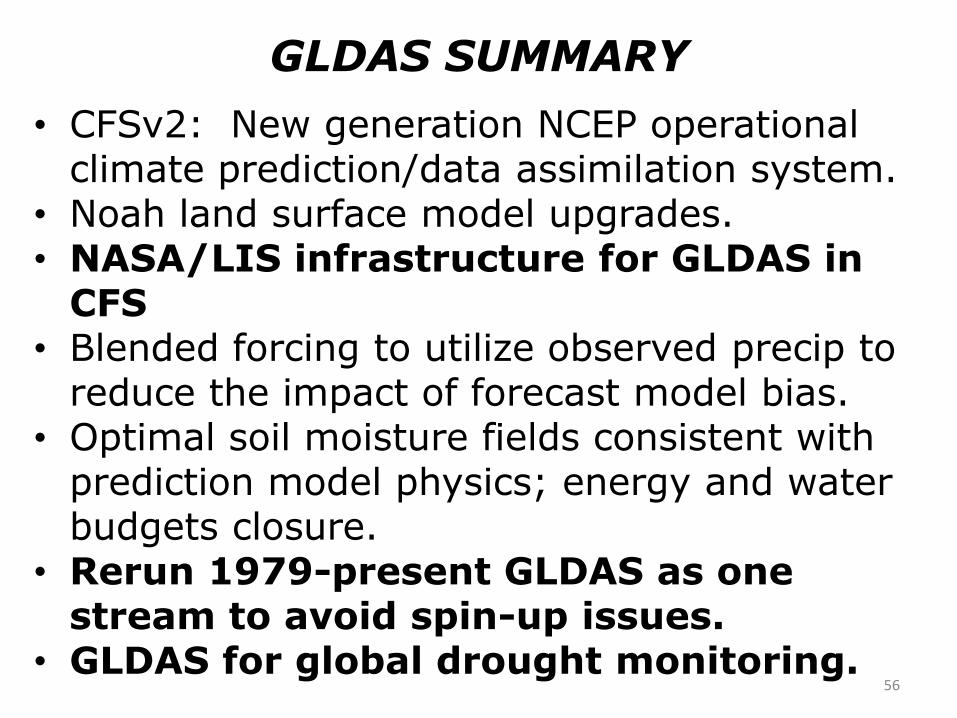
GLDAS SUMMARY
• CFSv2: New generation NCEP operational climate prediction/data assimilation system.
• Noah land surface model upgrades. • NASA/LIS infrastructure for GLDAS in
CFS • Blended forcing to utilize observed precip to
reduce the impact of forecast model bias. • Optimal soil moisture fields consistent with
prediction model physics; energy and water budgets closure.
• Rerun 1979-present GLDAS as one stream to avoid spin-up issues.
• GLDAS for global drought monitoring.

• Motivation
• Applications:
- North American Land Data Assimilation System (NLDAS) -- “Flagship” LDAS project at NCEP
- “HRAP”-NLDAS
- Global LDAS (GLDAS)
• Methods/examples:
- Surface emissivity/Tb assimilation
- Soil moisture
- Snow
• Summary/Future
Outline
57

58
Improvement of Satellite Data Utilization over Desert & Arid Regions
in NCEP Operational NWP Modeling and Data
Assimilation Systems
● Improvement of land surface skin temperature (LST) in GFS – New formula of thermal roughness length (Zot) (X. Zeng et al
ln(z0m / z0t) = (1 − GVF) 2 Czil k (u*z0g/ν) 0.5
ln(z0m) = (1 − GVF) 2 ln(z0g) + [1 − (1 − GVF) 2] ln(z0m)
● New emissivity calculation for MW in GSI/CRTM – Empirical emissivity model over desert region (B. Yan and F. Weng).
● Problem: Satellite data (IR/MW) is rarely used over desert/arid regions in GSI/CRTM (e.g. W. CONUS and N. Africa)
– Substantial cold bias of land surface skin temperature (LST) in GFS. – Inaccurate emissivity calculation for MW in GSI/CRTM
Tb Simulation in GSI:
IR NOAA-17 HIRS3: Ch8: 11-micron
MW NOAA-18 AMSU_A: Ch1: 23.8 Ghz ; Ch15: 89.0 Ghz ;
Ch4: 52.8 Ghz
NCEP GFS OPS: z0t = z0m
Weizhong Zheng et al
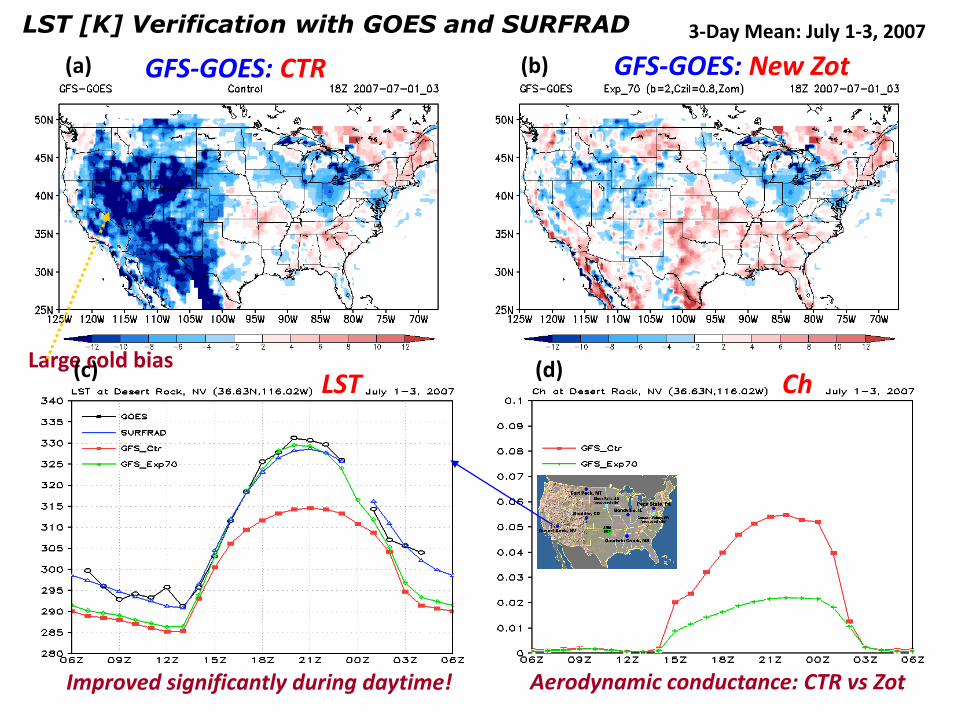
LST [K] Verification with GOES and SURFRAD 3-Day Mean: July 1-3, 2007
GFS-GOES: CTR GFS-GOES: New Zot
Large cold bias
GFS-GOES: New Zot
Improved significantly during daytime!
Ch LST
(a) (b)
(d) (c)
Aerodynamic conductance: CTR vs Zot

● New formula of thermal roughness length (Zot) implemented in the NCEP GFS model to reduce a substantial cold bias of land surface skin temperature over arid and semi-arid regions during daytime in warm seasons.
● The new empirical MW emissivity model, developed by B. Yan and F. Weng at NESDIS, corrected unreasonable MW surface emissivity calculation over desert regions in CRTM.
● With new Zot change and new emissivity MW model together, obvious reduction of large bias in calculated brightness temperatures was found for infrared and microwave satellite sensors for surface channels, so many more satellite measurements can be utilized in GSI data assimilation system.
Improvement of Satellite Data Utilization over Desert & Arid Regions
in NCEP Operational NWP Modeling and Data Assimilation Systems summary
61
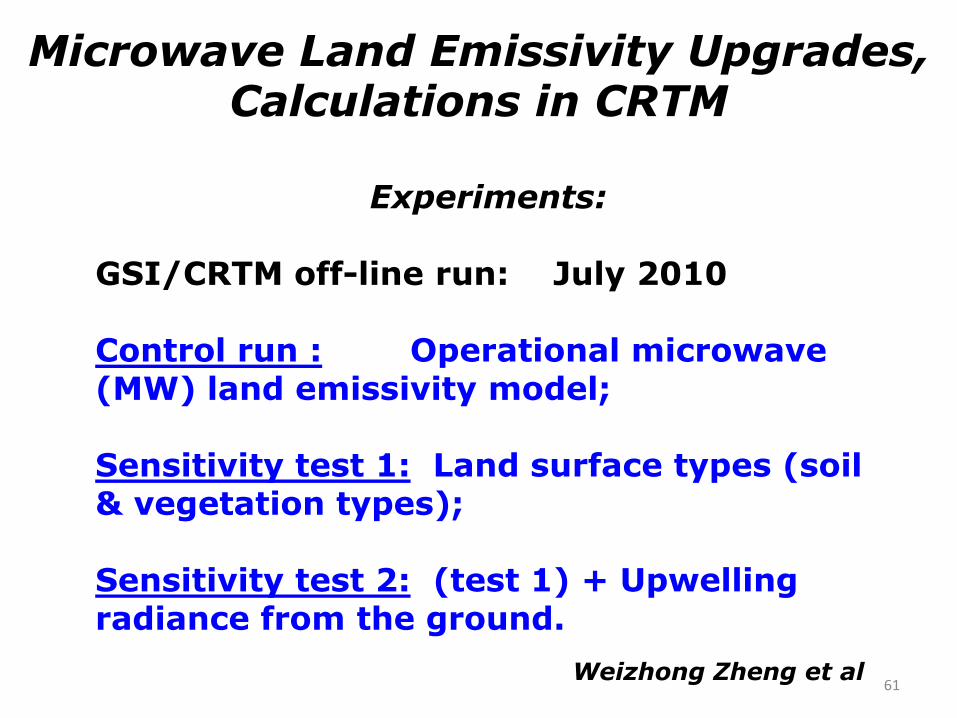
Microwave Land Emissivity Upgrades, Calculations in CRTM
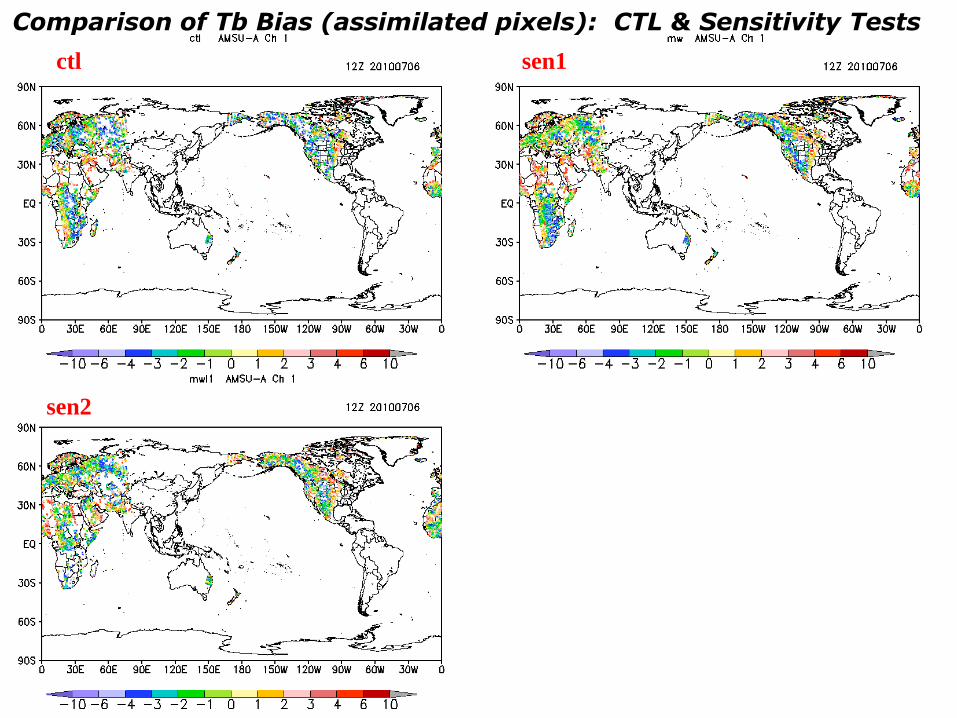
Experiments: GSI/CRTM off-line run: July 2010 Control run : Operational microwave (MW) land emissivity model; Sensitivity test 1: Land surface types (soil & vegetation types); Sensitivity test 2: (test 1) + Upwelling radiance from the ground.
Weizhong Zheng et al
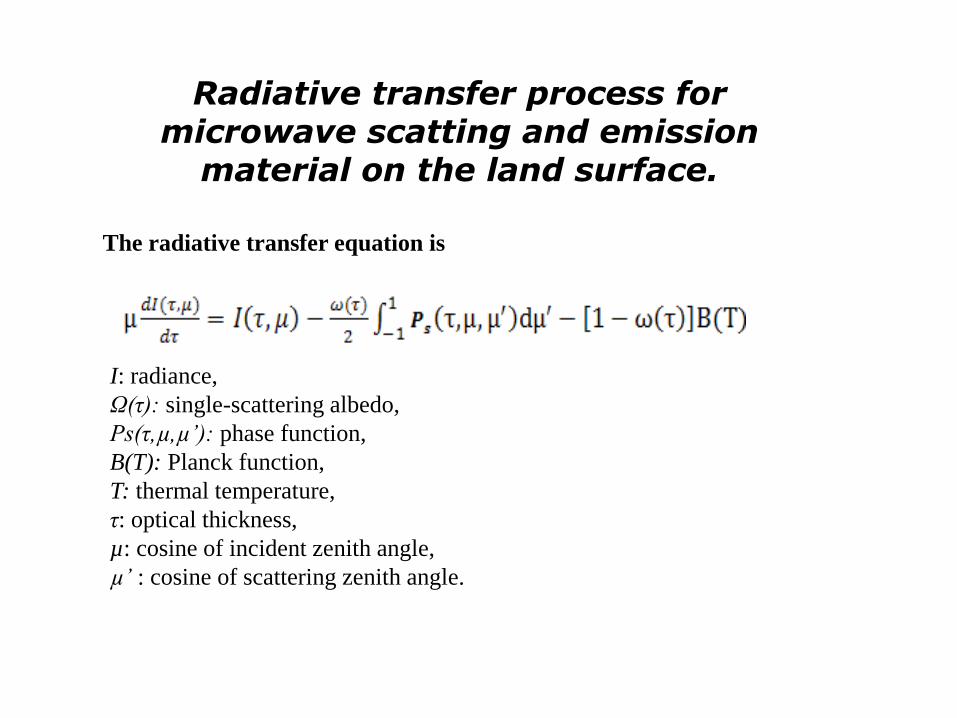
Radiative transfer process for microwave scatting and emission
material on the land surface. The radiative transfer equation is
I: radiance,
Ω(τ): single-scattering albedo,
Ps(τ,µ,µ’): phase function,
B(T): Planck function,
T: thermal temperature,
τ: optical thickness,
µ: cosine of incident zenith angle,
µ’ : cosine of scattering zenith angle.
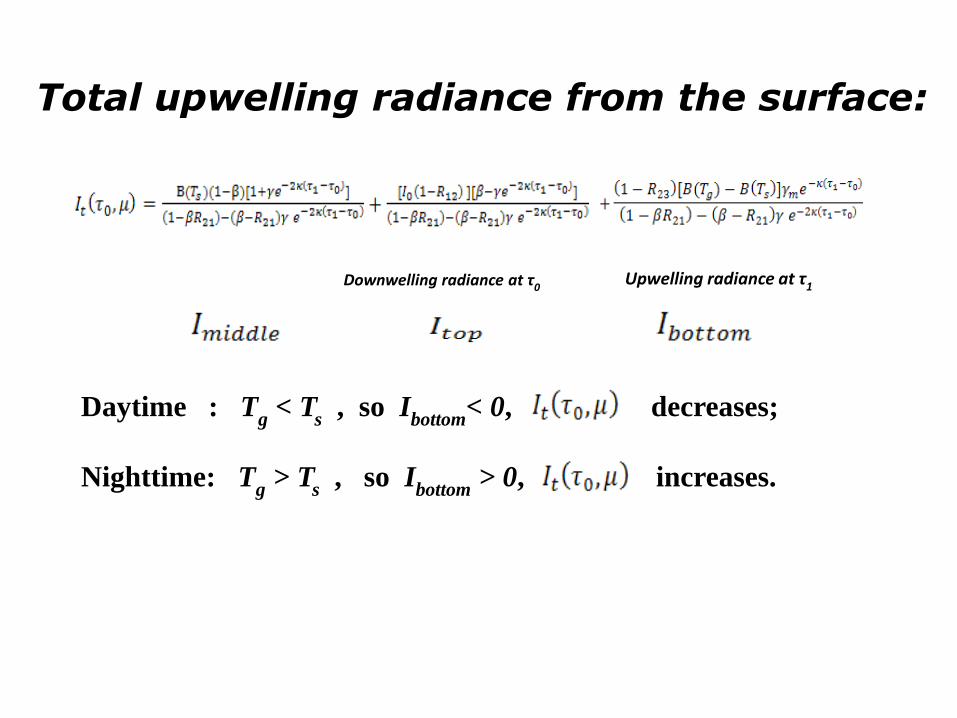
Total upwelling radiance from the surface:
Daytime : Tg < T
s , so I
bottom< 0, decreases;
Nighttime: Tg > T
s , so I
bottom > 0, increases.
Downwelling radiance at τ0 Upwelling radiance at τ1

06Z
18Z 00Z
12Z
64
Operational Monitoring Plots: NOAA-18 AMSU-A, Ch1, 06 July 2010

06Z
18Z 00Z
12Z
Operational Monitoring Plots: NOAA-18 AMSU-A, Ch3, 06 July 2010
65
ctl sen1
sen2
Comparison of Tb Bias (assimilated pixels): CTL & Sensitivity Tests

sen2
ctl sen1
Comparison of Tb Bias (assimilated pixels): CTL & Sensitivity Tests
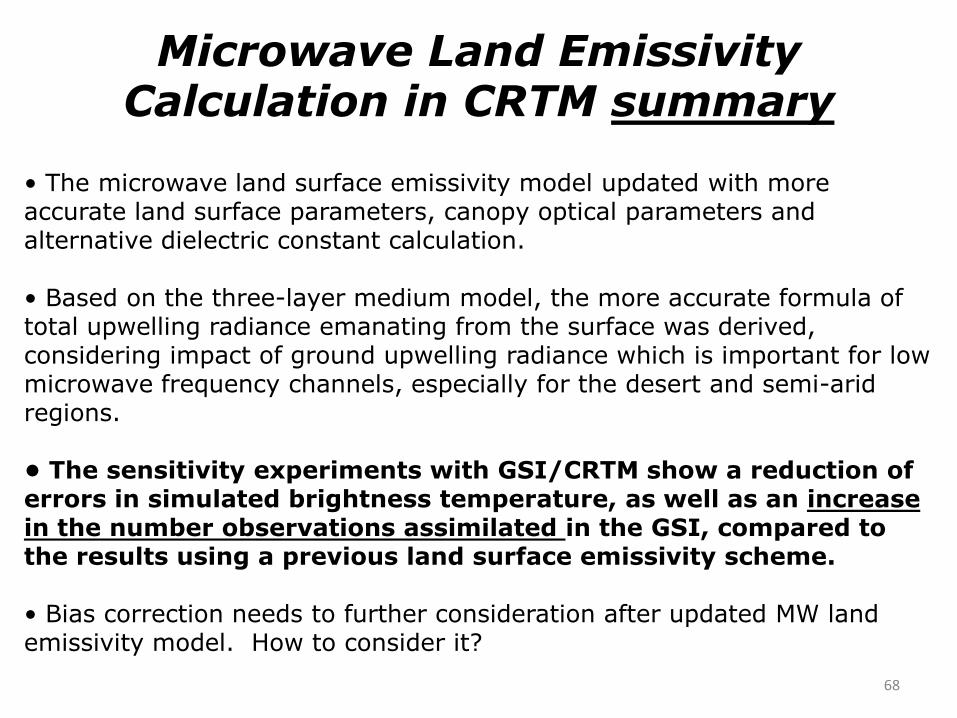
Microwave Land Emissivity Calculation in CRTM summary
68
• The microwave land surface emissivity model updated with more accurate land surface parameters, canopy optical parameters and alternative dielectric constant calculation. • Based on the three-layer medium model, the more accurate formula of total upwelling radiance emanating from the surface was derived, considering impact of ground upwelling radiance which is important for low microwave frequency channels, especially for the desert and semi-arid regions. • The sensitivity experiments with GSI/CRTM show a reduction of errors in simulated brightness temperature, as well as an increase in the number observations assimilated in the GSI, compared to the results using a previous land surface emissivity scheme. • Bias correction needs to further consideration after updated MW land emissivity model. How to consider it?

• Motivation
• Applications:
- North American Land Data Assimilation System (NLDAS) -- “Flagship” LDAS project at NCEP
- “HRAP”-NLDAS
- Global LDAS (GLDAS)
• Methods/examples:
- Surface emissivity/Tb assimilation
- Soil moisture
- Snow
• Summary/Future
Outline
69
Pg. 70
Recent Land Data Assimilation Results with the Land Information System
Christa Peters-Lidard
Chief, Hydrological Sciences Laboratory, NASA/GSFC 20-MAR-2012
Acknowledgements: Sujay Kumar, David Mocko – Science Applications International Corporation (SAIC)
Rolf Reichle – Goddard Modeling and Assimilation Office Joe Santanello, Matt Rodell – Hydrological Sciences Lab, NASA/GSFC
Jim Geiger – Advanced Data Management & Analysis Branch, NASA/GSFC Ken Harrison, Anil Kumar, Soni Yatheendradas – Earth System Science Interdisciplinary Center, U. of
Maryland
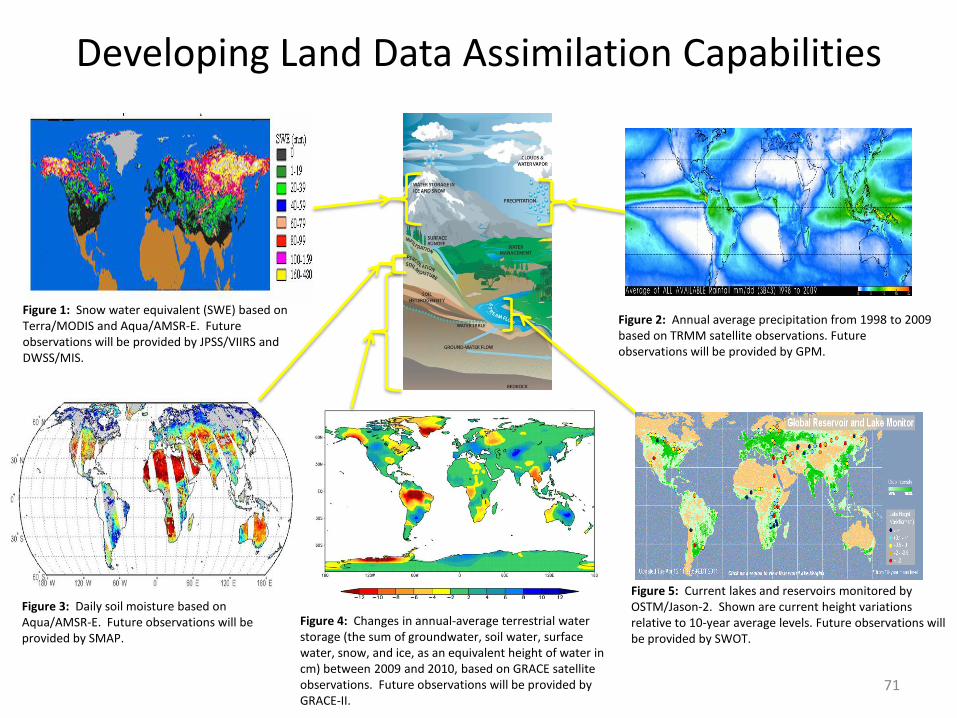
Figure 4: Changes in annual-average terrestrial water storage (the sum of groundwater, soil water, surface water, snow, and ice, as an equivalent height of water in cm) between 2009 and 2010, based on GRACE satellite observations. Future observations will be provided by GRACE-II.
Figure 5: Current lakes and reservoirs monitored by OSTM/Jason-2. Shown are current height variations relative to 10-year average levels. Future observations will be provided by SWOT.
Figure 2: Annual average precipitation from 1998 to 2009 based on TRMM satellite observations. Future observations will be provided by GPM.
Figure 1: Snow water equivalent (SWE) based on Terra/MODIS and Aqua/AMSR-E. Future observations will be provided by JPSS/VIIRS and DWSS/MIS.
Figure 3: Daily soil moisture based on Aqua/AMSR-E. Future observations will be provided by SMAP.
Developing Land Data Assimilation Capabilities
71
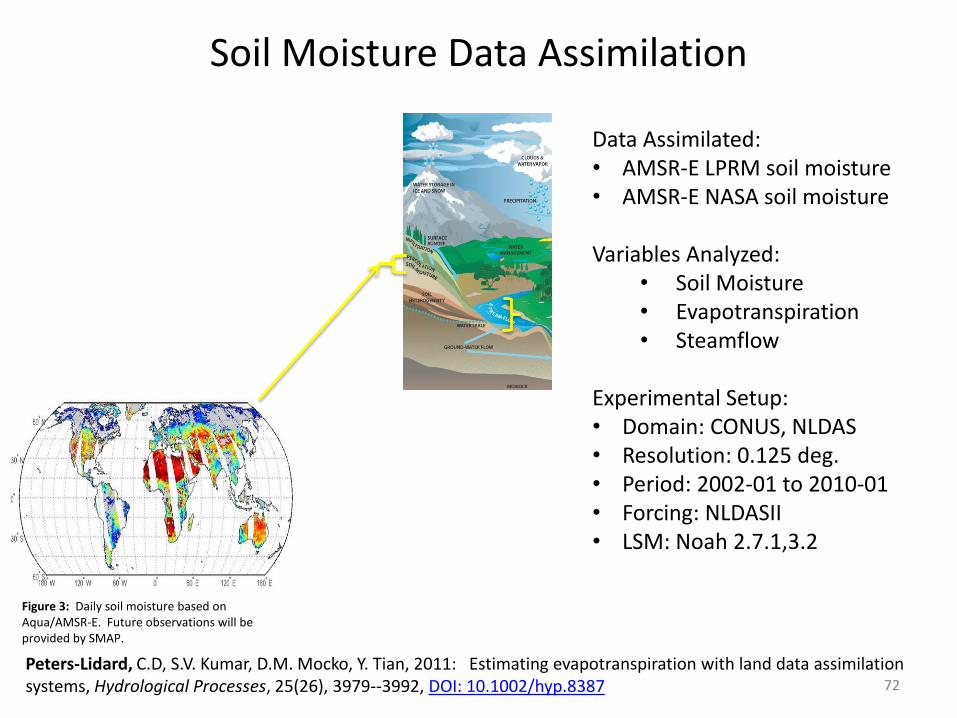
Figure 3: Daily soil moisture based on Aqua/AMSR-E. Future observations will be provided by SMAP.
Soil Moisture Data Assimilation
Data Assimilated: • AMSR-E LPRM soil moisture • AMSR-E NASA soil moisture
Variables Analyzed:
• Soil Moisture • Evapotranspiration • Steamflow
Experimental Setup: • Domain: CONUS, NLDAS • Resolution: 0.125 deg. • Period: 2002-01 to 2010-01 • Forcing: NLDASII • LSM: Noah 2.7.1,3.2
Peters-Lidard, C.D, S.V. Kumar, D.M. Mocko, Y. Tian, 2011: Estimating evapotranspiration with land data assimilation systems, Hydrological Processes, 25(26), 3979--3992, DOI: 10.1002/hyp.8387 72
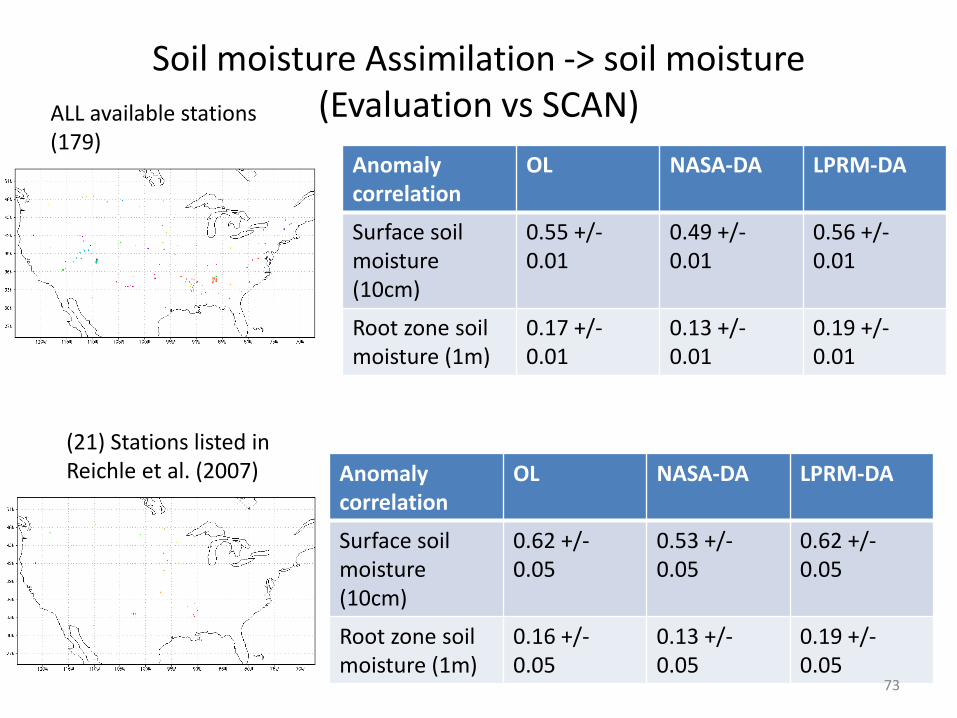
Soil moisture Assimilation -> soil moisture (Evaluation vs SCAN)
Anomaly correlation
OL NASA-DA LPRM-DA
Surface soil moisture (10cm)
0.55 +/- 0.01
0.49 +/- 0.01
0.56 +/- 0.01
Root zone soil moisture (1m)
0.17 +/- 0.01
0.13 +/- 0.01
0.19 +/- 0.01
ALL available stations (179)
(21) Stations listed in Reichle et al. (2007) Anomaly
correlation OL NASA-DA LPRM-DA
Surface soil moisture (10cm)
0.62 +/- 0.05
0.53 +/- 0.05
0.62 +/- 0.05
Root zone soil moisture (1m)
0.16 +/- 0.05
0.13 +/- 0.05
0.19 +/- 0.05
73
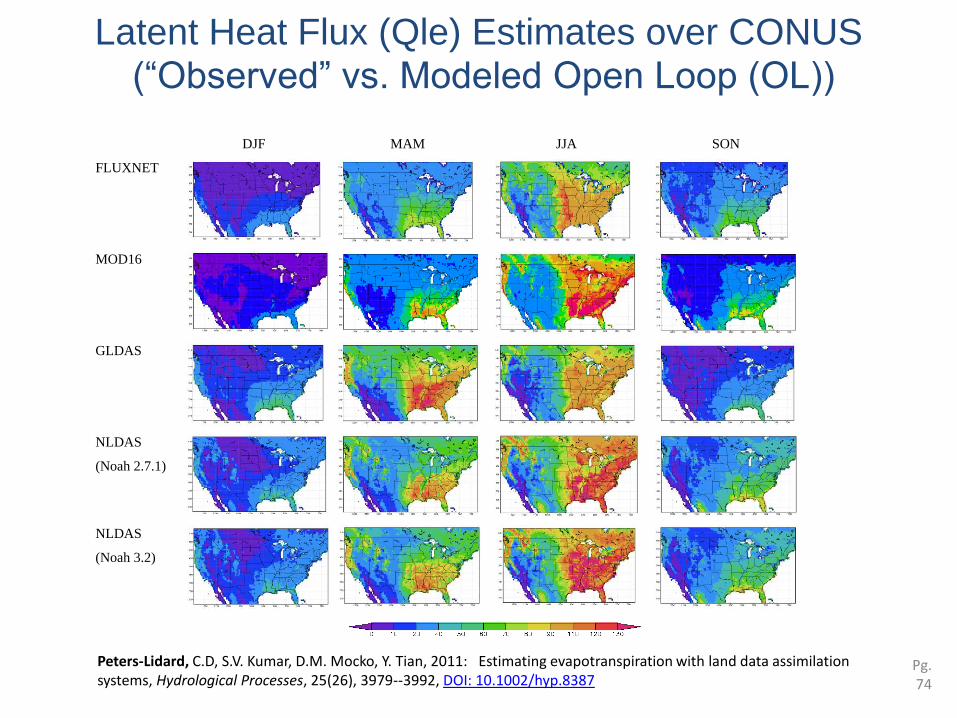
Latent Heat Flux (Qle) Estimates over CONUS (“Observed” vs. Modeled Open Loop (OL))
Pg. 74
Peters-Lidard, C.D, S.V. Kumar, D.M. Mocko, Y. Tian, 2011: Estimating evapotranspiration with land data assimilation systems, Hydrological Processes, 25(26), 3979--3992, DOI: 10.1002/hyp.8387
DJF MAM JJA SON
FLUXNET
MOD16
GLDAS
NLDAS
(Noah 2.7.1)
NLDAS
(Noah 3.2)
1

Soil Moisture Assimilation -> Evapotranspiration (Qle)
Pg. 75
Peters-Lidard, C.D, S.V. Kumar, D.M. Mocko, Y. Tian, 2011: Estimating evapotranspiration with land data assimilation systems, Hydrological Processes, 25(26), 3979--3992, DOI: 10.1002/hyp.8387
FLUXNET MOD16
RMSE
Bias
1
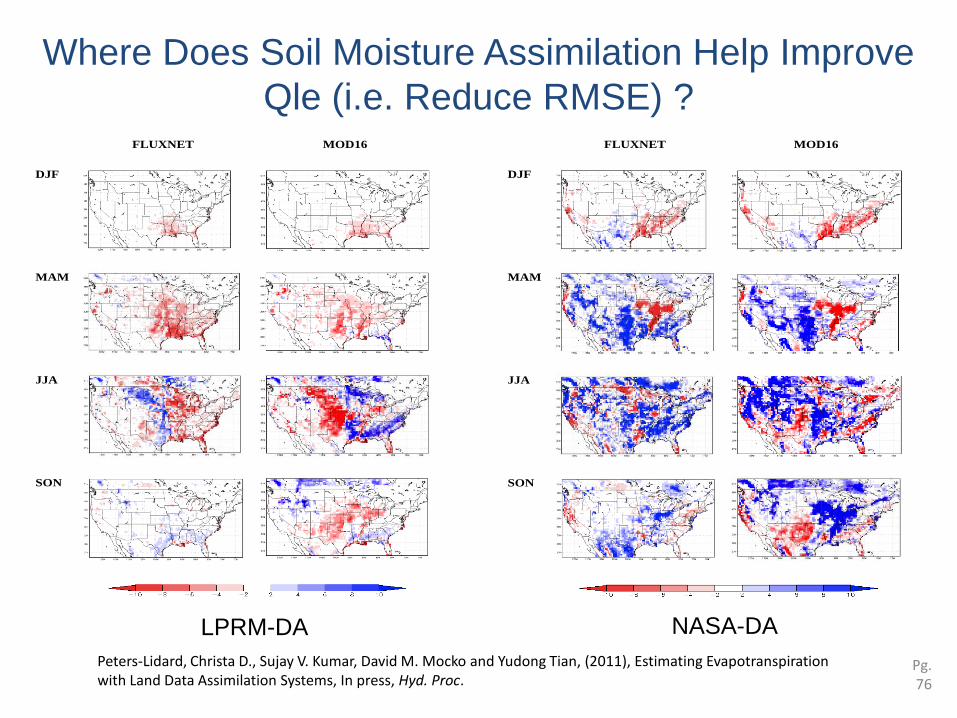
Where Does Soil Moisture Assimilation Help Improve
Qle (i.e. Reduce RMSE) ?
Pg. 76
Peters-Lidard, Christa D., Sujay V. Kumar, David M. Mocko and Yudong Tian, (2011), Estimating Evapotranspiration with Land Data Assimilation Systems, In press, Hyd. Proc.
FLUXNET MOD16
DJF
MAM
JJA
SON
1
FLUXNET MOD16
DJF
MAM
JJA
SON
1
LPRM-DA NASA-DA

Where Does Soil Moisture Assimilation Help Improve
Qle (i.e. Reduce RMSE) ?
Pg. 77
Qle RMSE % Difference
(DA-OL)
FLUXNET MOD16
Landcover type NASA-DA
(Wm-2)
LPRM-DA
(Wm-2)
NASA-DA
(Wm-2)
LPRM-DA
(Wm-2)
Evergreen needleleaf forest 17.6 7.9 10.5 -3.6
Deciduous broadleaf forest 3.2 12.7 0.3 0.7
Mixed forest 1.8 8.0 -0.7 -0.9
Woodlands 16.4 18.9 11.5 -5.9
Wooded grassland 8.8 -0.5 9.6 0.3
Closed shrubland 7.3 3.4 2.5 8.9
Open shrubland 9.0 7.4 3.6 12.1
Grassland 23.9 7.1 32.9 46.4
Cropland 12.3 34.7 30.9 40.8
Bare soil -0.1 0.6 -0.8 1.4
Urban -0.1 -0.1 -0.2 -0.3
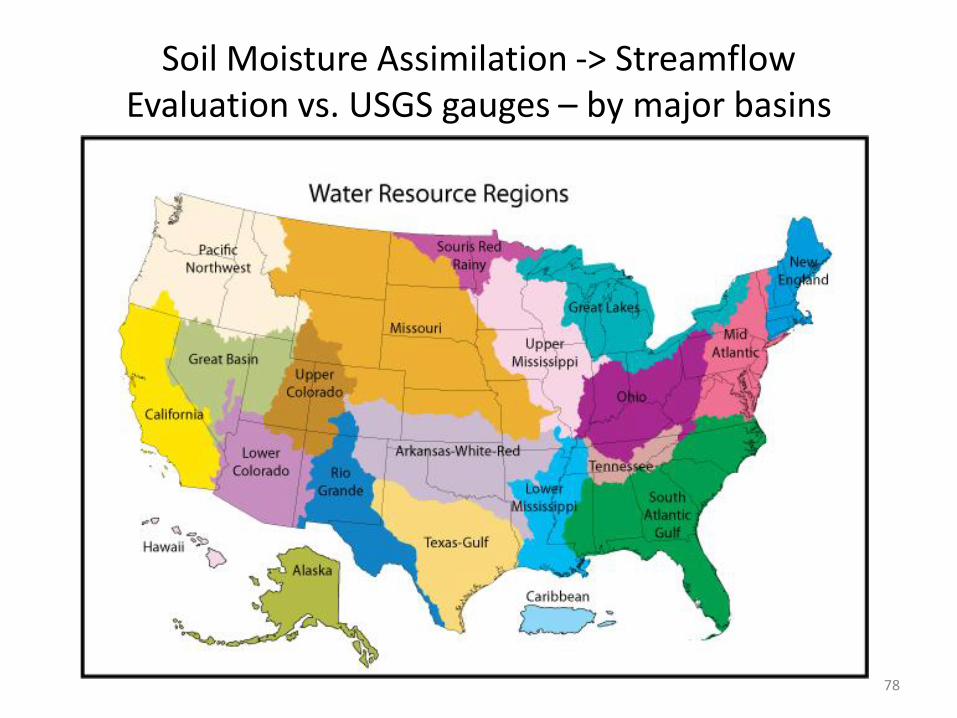
Soil Moisture Assimilation -> Streamflow Evaluation vs. USGS gauges – by major basins
78
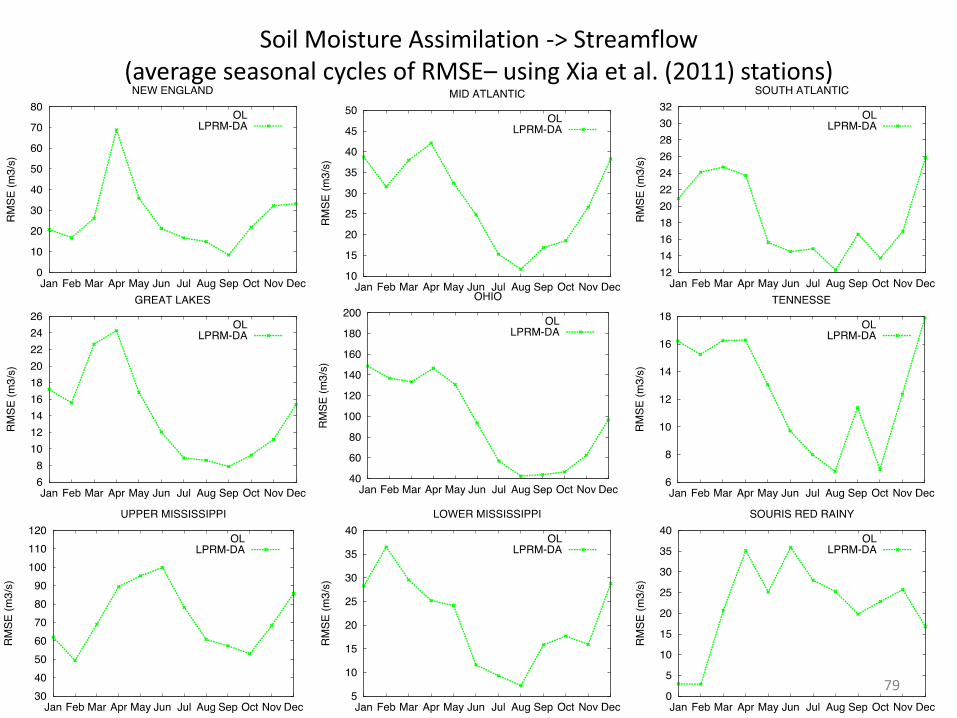
Soil Moisture Assimilation -> Streamflow (average seasonal cycles of RMSE– using Xia et al. (2011) stations)
79

Soil Moisture Assimilation -> Streamflow (average seasonal cycles of RMSE– using Xia et al. (2011) stations)
80
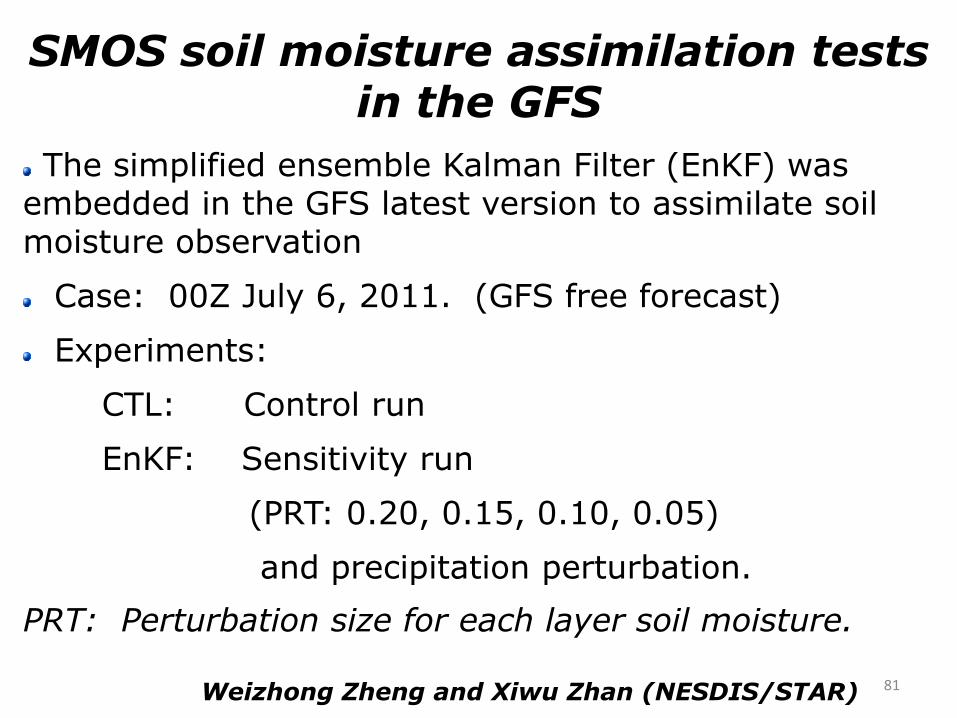
SMOS soil moisture assimilation tests in the GFS
81
The simplified ensemble Kalman Filter (EnKF) was embedded in the GFS latest version to assimilate soil moisture observation
Case: 00Z July 6, 2011. (GFS free forecast)
Experiments:
CTL: Control run
EnKF: Sensitivity run
(PRT: 0.20, 0.15, 0.10, 0.05)
and precipitation perturbation.
PRT: Perturbation size for each layer soil moisture.
Weizhong Zheng and Xiwu Zhan (NESDIS/STAR)
SMOS CTL
EnKF
82
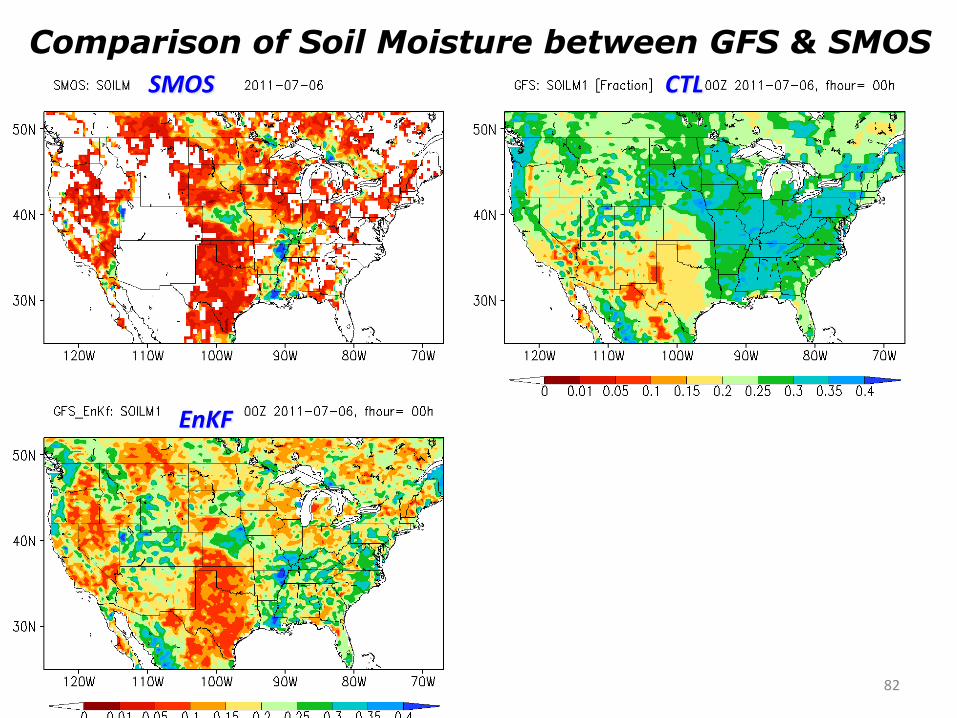
Comparison of Soil Moisture between GFS & SMOS
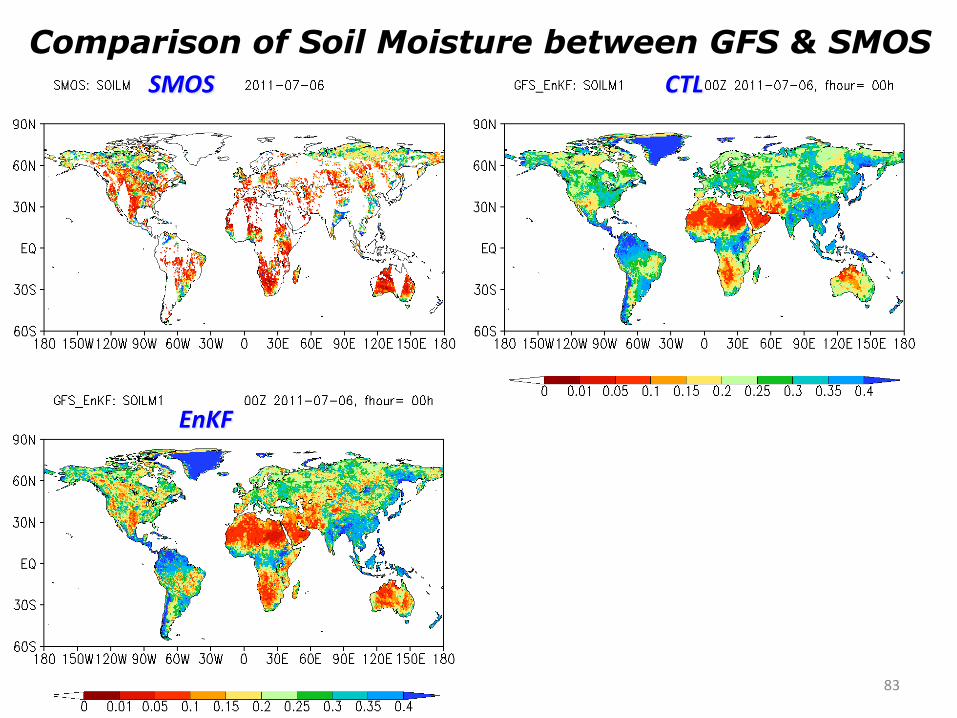
Comparison of Soil Moisture between GFS & SMOS
SMOS CTL
EnKF
83
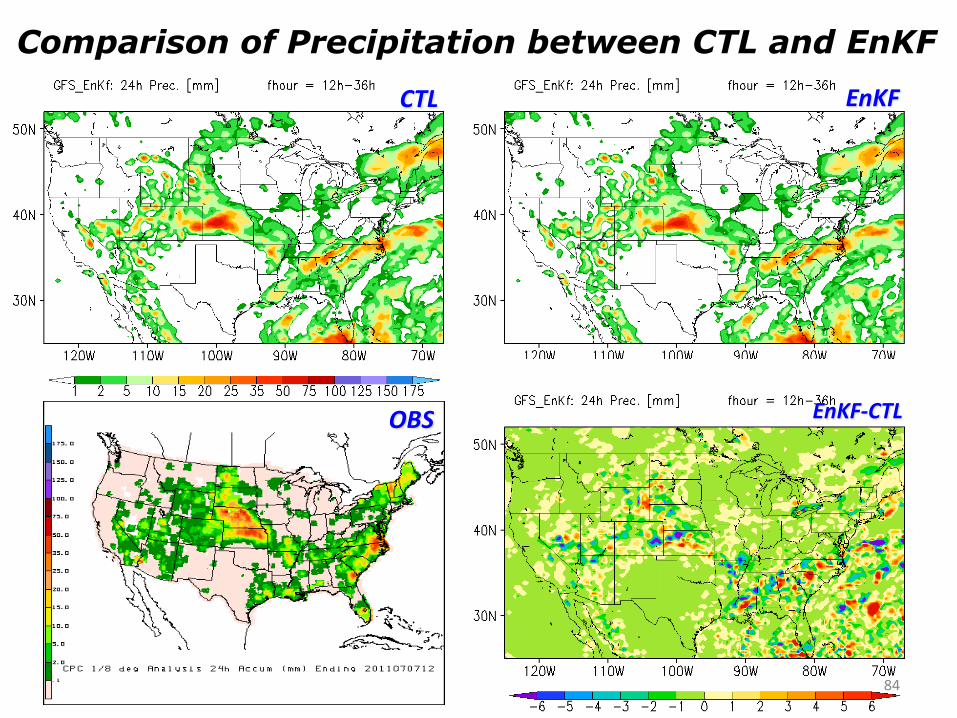
CTL
OBS EnKF-CTL
EnKF
Comparison of Precipitation between CTL and EnKF
84
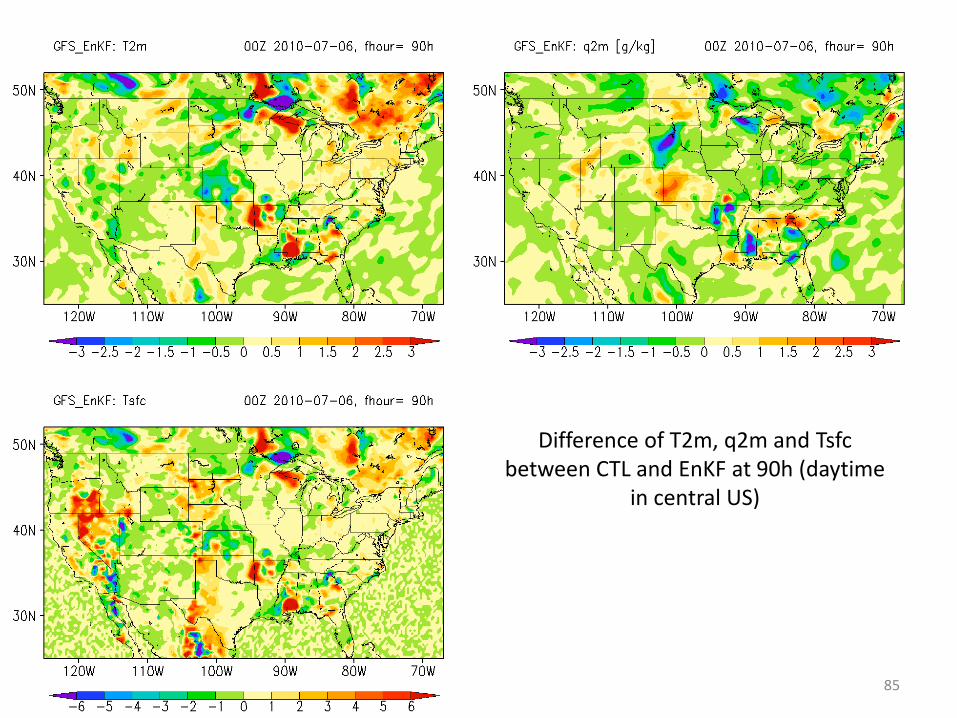
Difference of T2m, q2m and Tsfc between CTL and EnKF at 90h (daytime
in central US)
85
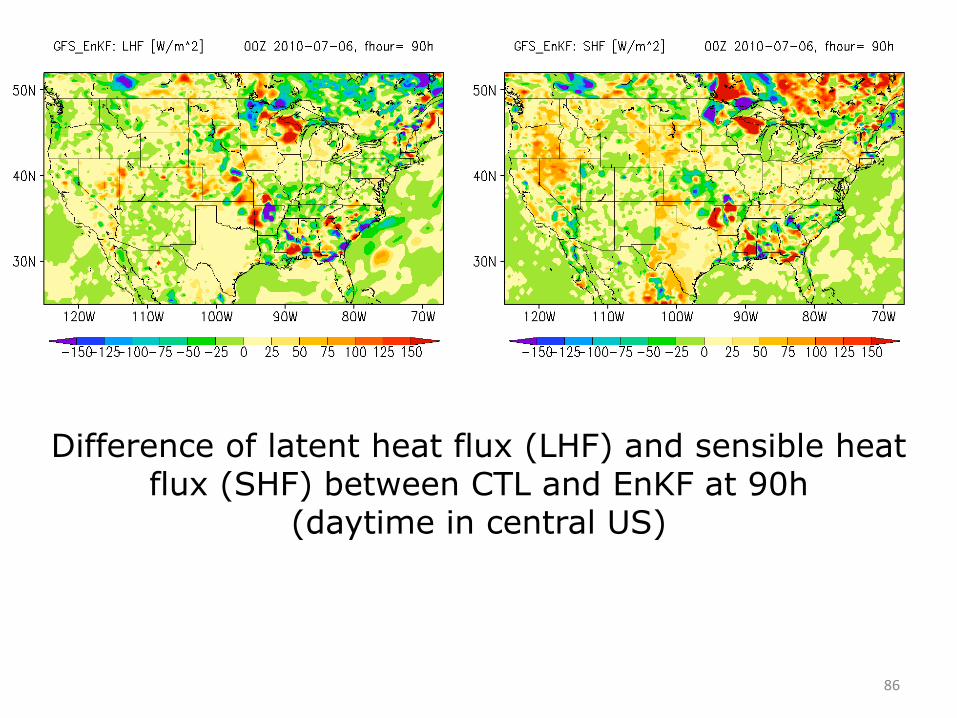
Difference of latent heat flux (LHF) and sensible heat flux (SHF) between CTL and EnKF at 90h
(daytime in central US)
86
• Motivation
• Applications:
- North American Land Data Assimilation System (NLDAS) -- “Flagship” LDAS project at NCEP
- “HRAP”-NLDAS
- Global LDAS (GLDAS)
• Methods/examples:
- Surface emissivity/Tb assimilation
- Soil moisture
- Snow
• Summary/Future
Outline
87
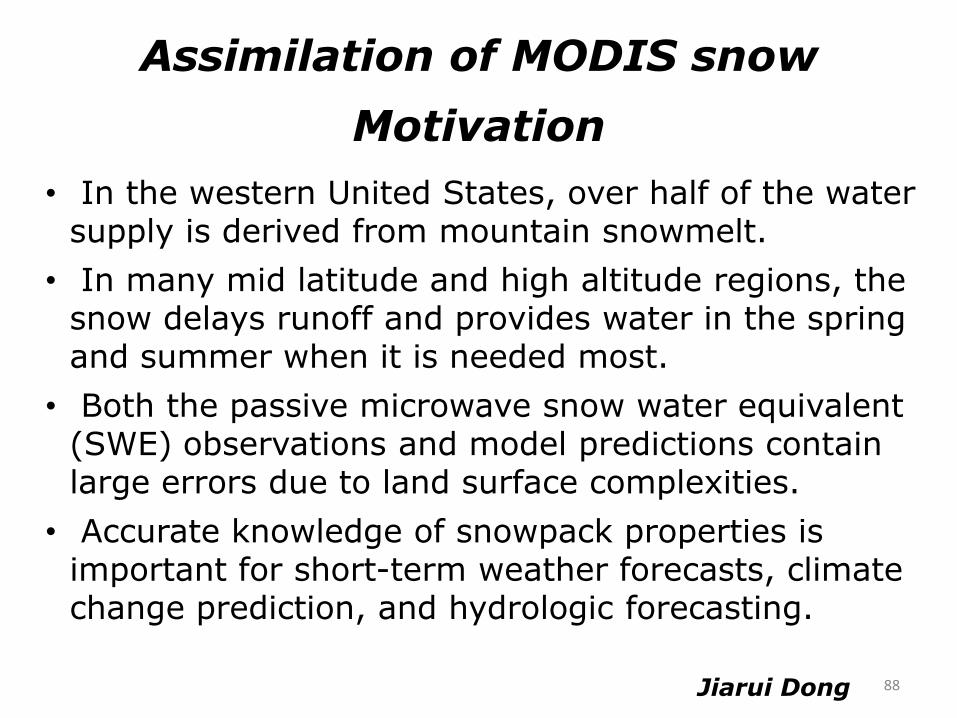
Motivation
• In the western United States, over half of the water supply is derived from mountain snowmelt.
• In many mid latitude and high altitude regions, the snow delays runoff and provides water in the spring and summer when it is needed most.
• Both the passive microwave snow water equivalent (SWE) observations and model predictions contain large errors due to land surface complexities.
• Accurate knowledge of snowpack properties is important for short-term weather forecasts, climate change prediction, and hydrologic forecasting.
Assimilation of MODIS snow
88 Jiarui Dong
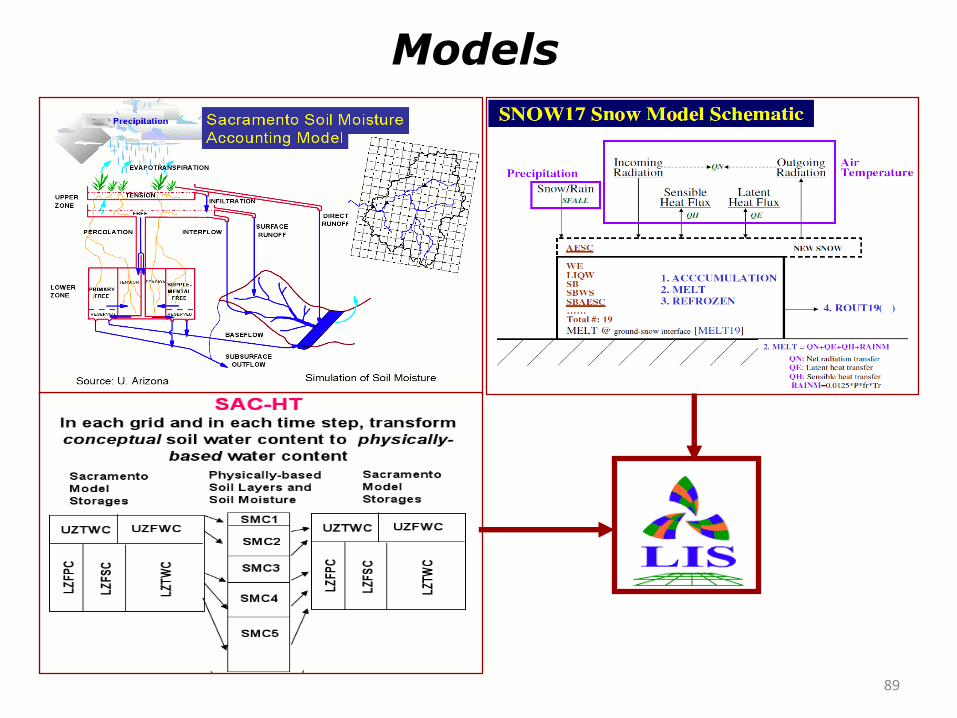
Models
89
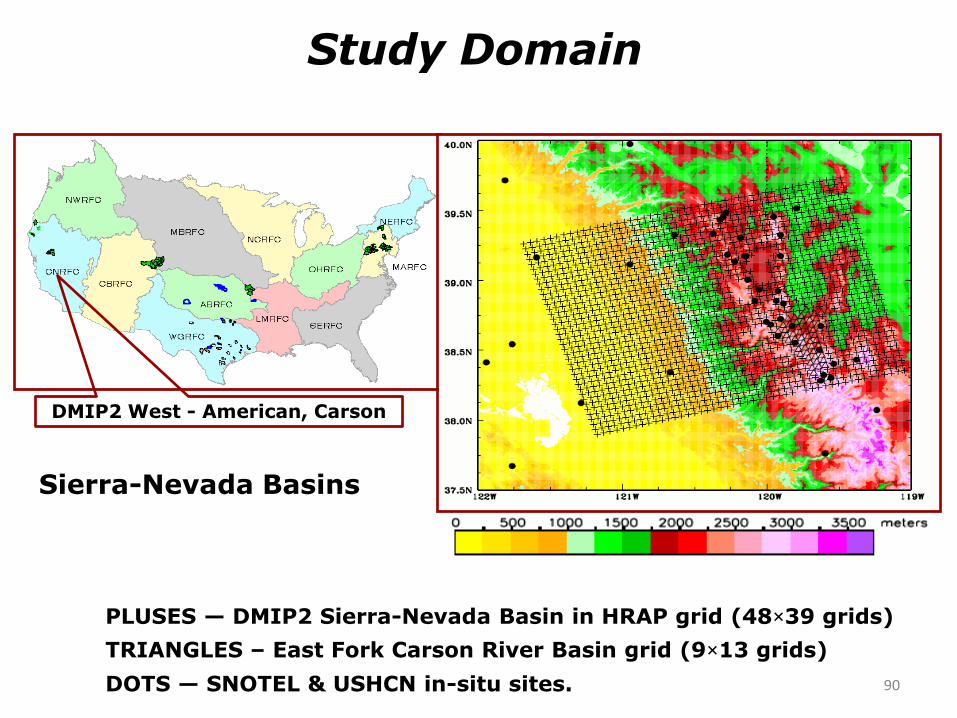
Study Domain
PLUSES — DMIP2 Sierra-Nevada Basin in HRAP grid (48×39 grids)
TRIANGLES – East Fork Carson River Basin grid (9×13 grids)
DOTS — SNOTEL & USHCN in-situ sites.
Sierra-Nevada Basins
DMIP2 West - American, Carson
90
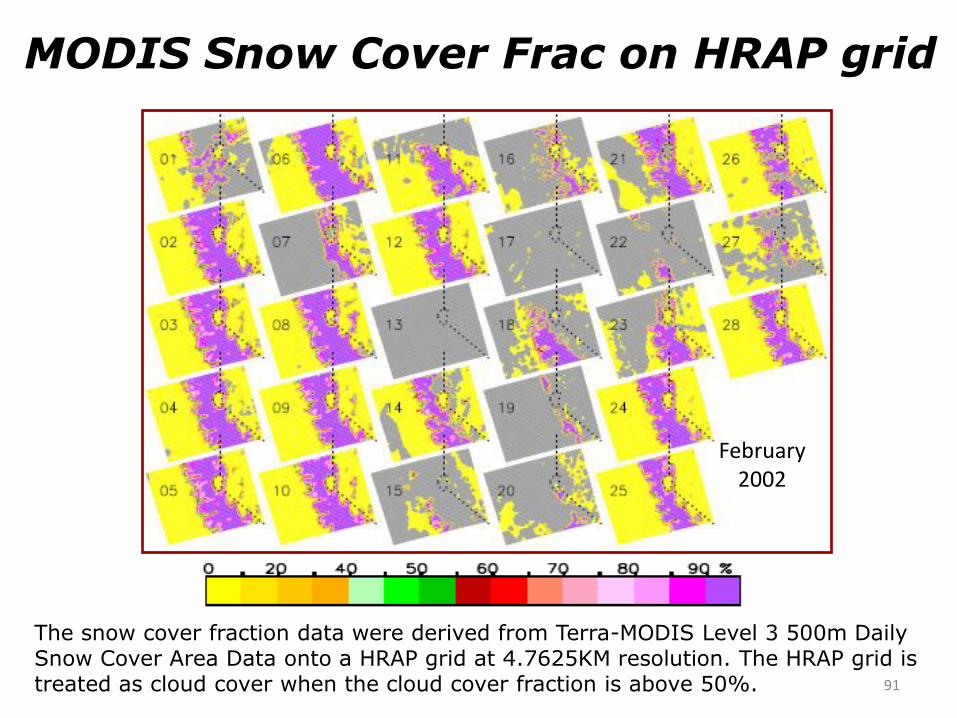
MODIS Snow Cover Frac on HRAP grid
The snow cover fraction data were derived from Terra-MODIS Level 3 500m Daily Snow Cover Area Data onto a HRAP grid at 4.7625KM resolution. The HRAP grid is treated as cloud cover when the cloud cover fraction is above 50%.
February 2002
91
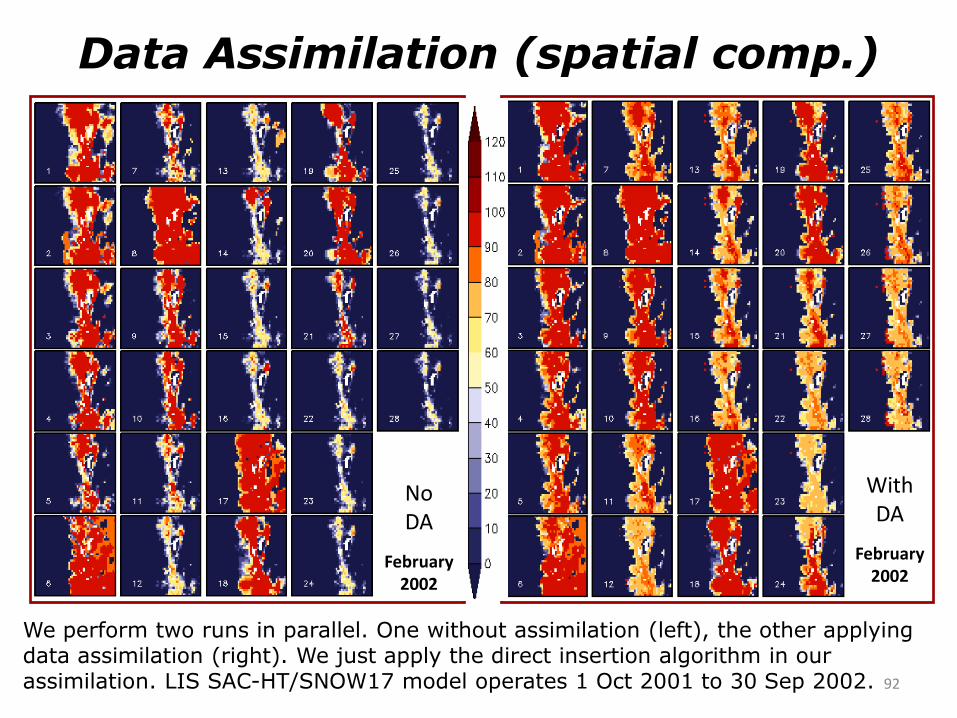
We perform two runs in parallel. One without assimilation (left), the other applying data assimilation (right). We just apply the direct insertion algorithm in our assimilation. LIS SAC-HT/SNOW17 model operates 1 Oct 2001 to 30 Sep 2002.
No DA
With DA
February 2002
February 2002
92
Data Assimilation (spatial comp.)
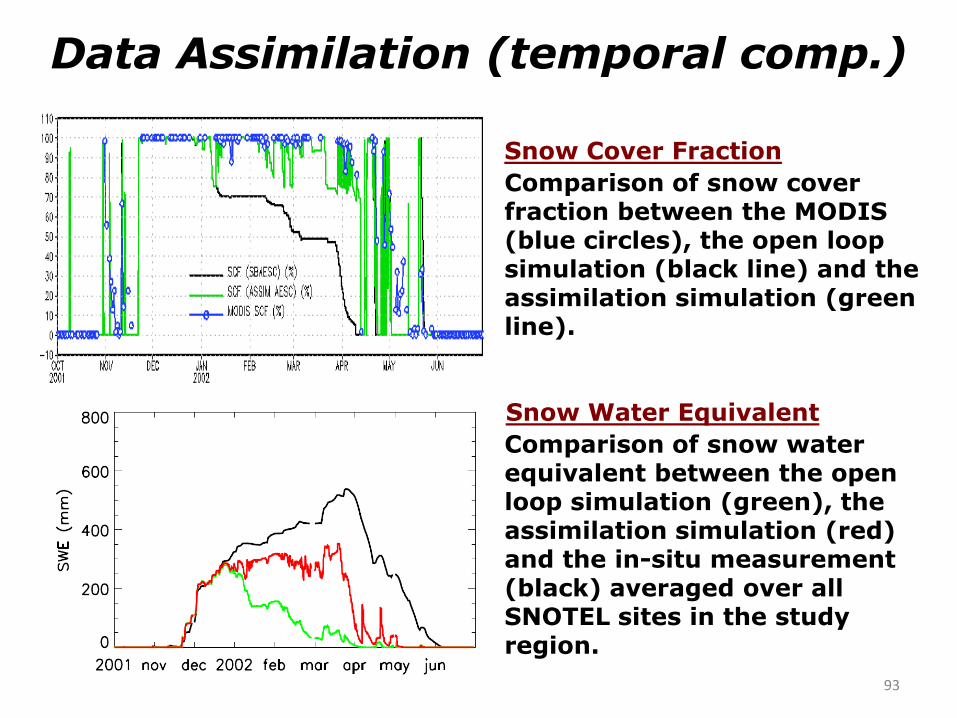
Data Assimilation (temporal comp.)
Comparison of snow cover fraction between the MODIS (blue circles), the open loop simulation (black line) and the assimilation simulation (green line).
Comparison of snow water equivalent between the open loop simulation (green), the assimilation simulation (red) and the in-situ measurement (black) averaged over all SNOTEL sites in the study region.
Snow Cover Fraction
Snow Water Equivalent
93
Snow Assimilation Summary and Future Plans
• This study has investigated remotely-sensed MODIS snow cover estimation uncertainty. For cloud-free pixels, the MODIS SCA retrieval errors can be quantitatively predicted by temperature with regional calibrated parameters.
• The preliminary experiments show that the snow cover fraction after assimilation shows close agreement to the MODIS SCF observations.
• Comparison at an individual grid between open loop and assimilation simulations shows that the snow water equivalent is also modified through assimilation of MODIS SCF.
• We will apply the derived statistical regression equation to prescribe the error in MODIS snow cover fraction, and further apply into the EnKF assimilation.
94
• Motivation
• Applications:
- North American Land Data Assimilation System (NLDAS) -- “Flagship” LDAS project at NCEP
- “HRAP”-NLDAS
- Global LDAS (GLDAS)
• Methods/examples:
- Surface emissivity/Tb assimilation
- Soil moisture
- Snow
• Summary/Future
Outline
95
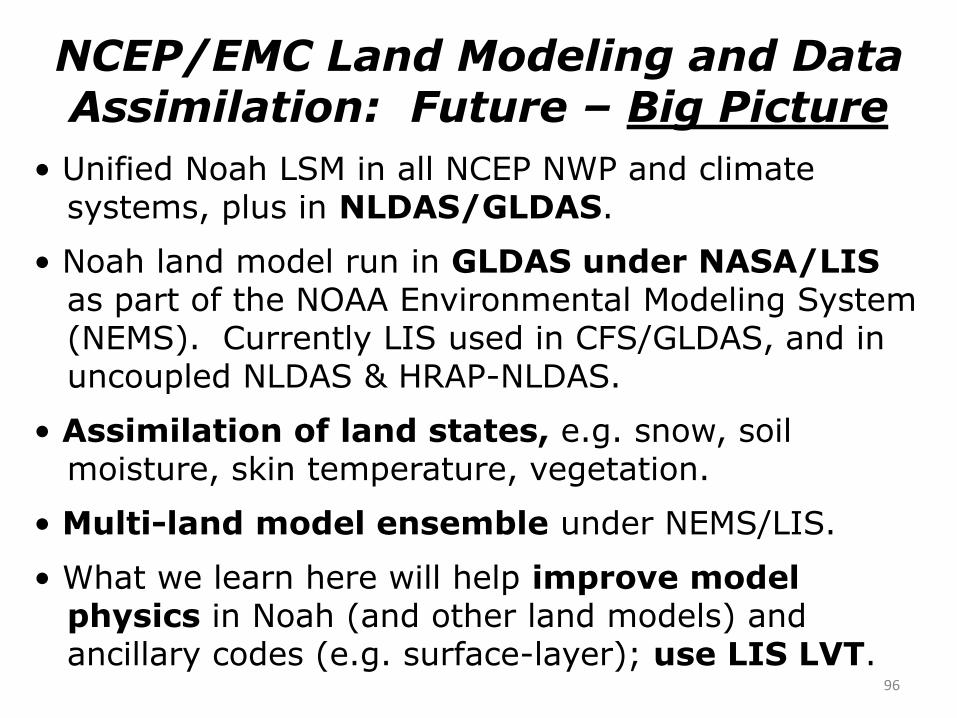
• Unified Noah LSM in all NCEP NWP and climate systems, plus in NLDAS/GLDAS.
• Noah land model run in GLDAS under NASA/LIS as part of the NOAA Environmental Modeling System (NEMS). Currently LIS used in CFS/GLDAS, and in uncoupled NLDAS & HRAP-NLDAS.
• Assimilation of land states, e.g. snow, soil moisture, skin temperature, vegetation.
• Multi-land model ensemble under NEMS/LIS.
• What we learn here will help improve model physics in Noah (and other land models) and ancillary codes (e.g. surface-layer); use LIS LVT.
NCEP/EMC Land Modeling and Data Assimilation: Future – Big Picture
96

97
Thank you!