Embed Size (px)
Citation preview
Centre f or Ecology & Hydrology Maclean Building, Benson Lane Crowmarsh Gifford, Wallingford Oxfordshire, OX10 8BB United Kingdom Telephone: +44 (0)1491 838800 Email: [email protected] www.ceh.ac.uk
© NERC (CEH) 2017.
Land Cover Map 2015 Dataset documentation
Version 1.2, 22nd May 2017

2
Version Date Updates
1.0 6th April 2017 Original release
1.1 4th May 2017 Data set publication year corrected in Tables 4 and 5
1.2 22nd May 2017 Updated vector attribute “composite” in Table 2
3
Contents Introduction ....................................................................................................................... 4
Background ........................................................................................................................ 4
Differences from LCM2007 ................................................................................................ 4
LCM2015 product specification ......................................................................................... 7
LCM2015 product overview ............................................................................................... 8
Example datasets ............................................................................................................... 9
Vector data set ................................................................................................................. 11
Raster data sets ................................................................................................................ 11
Citing LCM2015 (DOI’s) .................................................................................................... 12
Map projection ................................................................................................................ 14
Data access ....................................................................................................................... 14
Further Information ......................................................................................................... 14
References ....................................................................................................................... 14
Appendix 1. Comment on classes as mapped in LCM2015 ............................................. 15
Appendix 2: Biodiversity Action Plan (BAP) Broad Habitats ............................................ 19
Appendix 3: Recipe for standard LCM2015 colour mapping. .......................................... 23
Appendix 4: Composite images used in LCM2015 ........................................................... 24
Please note: LCM2015 is a complex data set.
To help get the most from this data and to guard against inappropriate use it is
important that you familiarise yourself with the information in this document.
Land cover change – users are advised not to use the LCM series for change
mapping in their current state.
Differences between land cover maps are a combination of real change and
classification error, which is compounded by the thematic and spatial differences
between the LCM products over time.
4
Introduction
Land Cover Map 2015 (LCM2015) is provided as a range of data products to support the
diverse requirements of the LCM user community. This report provides a brief introduction
to key aspects of the LCM2015 data sets for users and potential users.
This document only covers LCM2015 data products, for details about previous Land Cover
Maps please consult the appropriate dataset documents.
Background
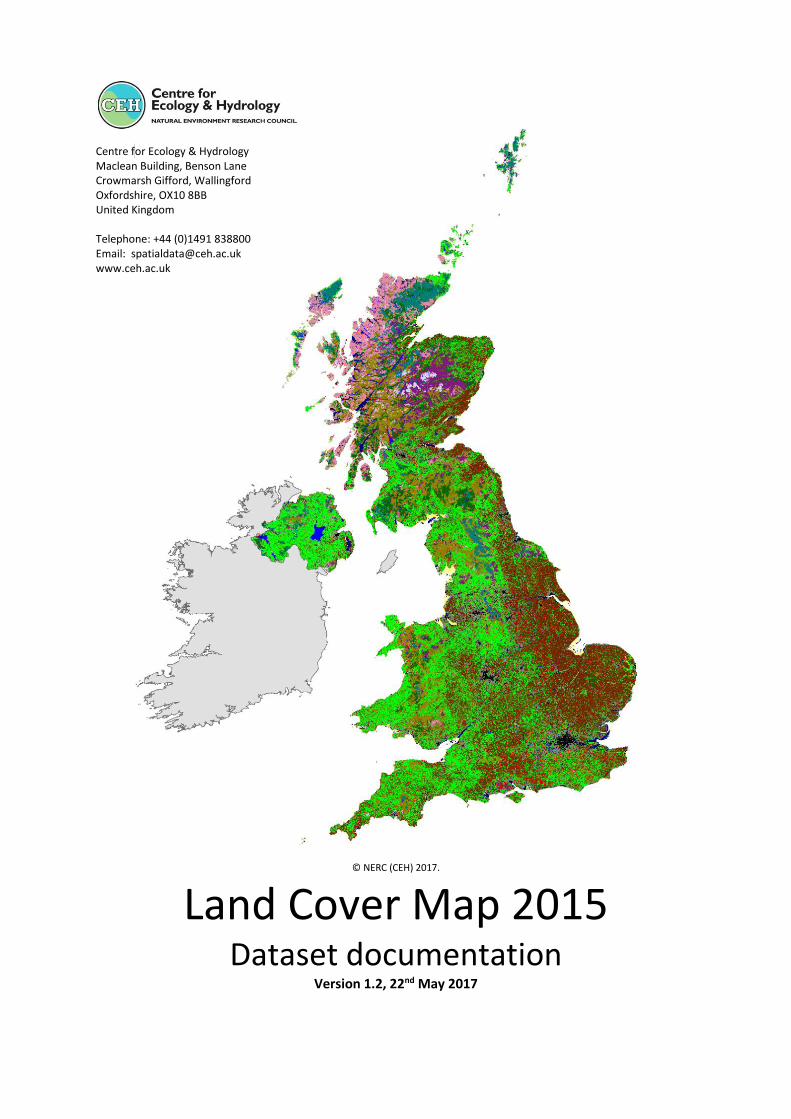
Land Cover Map 2015 (LCM2015) is a parcel-based land cover map for the UK, created by classifying satellite data into 21 land cover classes. The classes are based on the UK Biodiversity Action Plan Broad Habitat definitions (Jackson, 2000). LCM2015 was created by classifying two-date composite images and is based mainly on data from Landsat-8 (30m resolution) supplemented with AWIFS data (60m resolution) as required. LCM2015 updates the 2007 Land Cover Map and uses an updated version of the LCM2007 spatial framework. LCM2015, like LCM2007 before it, is therefore constructed from polygons that reflect real-world boundaries. This increases both its ease of interpretation for users and also its compatibility with other geospatial data sets. The LCM2015 spatial framework was derived from generalised digital cartography (Ordnance Survey MasterMap topographic layer (OSMM) for GB and Land & Property Services Large-scale Vector for Northern Ireland), refined with rural payment boundary data (see Morton et al., 2011 for details).
Differences from LCM2007
Users should be aware that some changes in data format have taken place between LCM2007 and LCM2015. Consequently, users should check all aspects of the data product they intend to use, prior to applying scripts written for LCM2007 data. To date each Land Cover Map has adopted a slightly different method, reflecting the range of influences and the key requirements at the time of production. These influences include evolving user needs, methodological developments, increased availability and accessibility of other spatial data sets and increases in computing power. LCM2015 continues this trend, by reflecting a need to increase the speed of production and decrease the amount of manual input in the production process. This is driven by both a need to release the data in a more timely manner and to create a repeatable method that can be used for mapping change. Consequently a number of modifications to the method have been made and these are described below under two headings, first, the changes that affect the output data and secondly, methodological differences that do not affect the output data.
Differences in output data 1. ‘Montane’ class removed – The montane class was removed, because in LCM2007 it was
mapped purely as a function of a variable altitude threshold (Morton et al., 2011), rather
than from the spectral data. LCM2015 would have adopted the same approach and the
same set of altitude thresholds, consequently, the ‘Montane’ distribution would be constant
over time. Therefore to enable the move to both a method and a set of classes that are
appropriate for change mapping this class was removed. Areas mapped as ‘Montane’ in
LCM2007 are therefore mapped based on the spectral data in LCM2015 and are mapped as
‘Inland Rock’ or one of the other upland habitats. This improves the suitability of the LCM-
5
series for mapping change in the future. Anyone requiring the distribution of ‘Montane’ for
the UK should use the LCM2007 distribution. This change affects all products.
2. Rough grassland class removed – The rough grassland class was first added in LCM2007. For
LCM2007 grassland was mapped by classifying images into ‘Improved Grassland’ and Rough
grassland, after which knowledge-based enhancement (KBE) rules were applied. The KBEs,
taking account the ancillary data, such as soil type, aspect and elevation suggested whether
Rough grassland should be assigned to ‘Neutral Grassland’, ‘Calcareous Grassland’ or ‘Acid
Grassland, or whether it should remain as Rough grassland (Morton et al., 2011). This
caused problems for a number of reasons, including:
a. Lack of consistent soil data across the UK (and across GB)
b. Link between soil type, as recorded in spatial data sets, and grassland type is often
complicated
c. Analysis of Rough grassland mapped by LCM2007 against Countryside Survey data
showed that it was predominantly a mix of ‘Improved grassland’ and ‘Neutral
grassland’.
d. The LCM2015 method requires stable training areas, defined as areas that have
remained constant across LCM2000 and LCM2007, because Rough grassland was not
used in LCM2000.
For all of these reasons, the Rough grassland class was removed, so in LCM2015 grassland
types again match the JNCC Broad Habitat types. No soil data was used in the LCM2015
classification. This change affects all the target class products (vector, 25m and 1km).
3. 25m raster – the 25m raster is a two band image, rather than a single band image, as in
previous LCMs. The first layer contains the classification layer and the second band contains
the mean per-polygon probability value produced by the classification algorithm. This
change affects the 25m raster data only.
4. Differences in the way probability data is recorded – probability information for LCM2007
was given in the ProbList attribute, with the top 5 spectral sub-classes and their respective
probabilities listed. Probability information for LCM2015 is simplified and streamlined, with
the mean probability of the majority class recorded in the vector data and this value (the
mean per polygon probability) given in band 2 of the 25m raster. Probability information is
not given for the 1km products, as it is not appropriate at that scale. This change affects the
vector and 25m raster only.
5. No spectral sub-classes – LCM2007 used a maximum likelihood classification algorithm,
which required training samples for each class to be grouped into spectrally similar sub-
classes. This, in conjunction with the extensive field data, led to the development of spectral
sub-classes. LCM2015 uses a Random Forest classifier that handles multi-modal classes, so
the grouping of spectrally similar sub-classes is not required. This simplifies the process of
preparing training data for classification and means that spectral sub-classes are redundant.
LCM was never validated at the spectral sub-class level and users were always urged to use
caution if using the sub-class data, so this is unlikely to impact many users. This change
affects the vector data only.
6
6. Spatial framework - For LCM2007 the spatial framework derived from the generalised digital
cartography was further refined with image segments, however for LCM2015 polygons
created by these segments have been removed. The segmentation used in LCM2007 was
used to ‘break-up’ large polygons, for example those found in upland areas, into smaller
polygons. There were problems with the segmentation in many cases, as it can vary
significantly with image and with segmentation parameters. For LCM2007, often the image
segmented and incorporated into the spatial framework for an area was not the image that
produced the best classification for the area. Consequently, the segmentation polygons did
not always match the final classifications well and they did not always capture real-world
objects well. Applying different segmentation for different LCMs will also complicate change
mapping, so for these reasons no segmentation has been incorporated in the LCM2015
spatial framework. Identifying the perfect spatial framework for LCM and related products
like CEH LCM Plus: Crops will require balancing competing requirements, as the underlying
LCM2015 product is the per-pixel classification it will be possible to summarise it against
different frameworks in the future if required. The removal of segmentation in LCM2015 will
mainly affect upland areas and will not affect Northern Ireland, as no segmentation was
added to the Northern Ireland LCM2007 data set. In addition some errors in the spatial
framework have been fixed. These changes will affect users of the GB vector data and the
GB 25m raster.
7. Mixed woodland – according to the JNCC Broad Habitat definitions a woodland with > 20%
Deciduous woodland is classified as mixed woodland and as such recorded under the
‘Broadleaf, Mixed and Yew Woodland’ class (see also Appendices 1 & 2). For LCM2007
object-based classification methods were applied and mixed woodland stands were selected
and used for training. In LCM2015 pure stands of Coniferous or Broadleaf woodland were
chosen for training, with individual pixels being classified. The pixels are then summarised at
the polygon level, with the modal_class (Table 2) being assigned as the polygon label. This
means that some mixed woodland with > 20% Broadleaf cover is likely to be assigned to the
‘Coniferous Woodland’ class, rather than the Broadleaved woodland class, users interested
in investigating this can explore the pix_dist attribute in the vector product. This change will
affect all products.
Differences in methodology 1. New classification algorithm – LCM2015 uses a Random Forest classifier, whilst LCM2007
used a Maximum Likelihood Classifier. The key advantage of changing to Random Forest is
that it handles multi-model training data, so training samples do not need grouping into
spectral sub-classes. In addition, Random Forest has been found to match or out-perform
Maximum Likelihood.
2. Stable training areas – for previous LCMs all the training areas used to train the classification
algorithm have been manually defined. This time, building upon the LCM legacy, an initial set
of training areas, defined as areas that were classified the same in both 2000 and 2007, was
used for classification. This initial set was then manually supplemented with additional
training areas for coastal areas (inter-tidal areas were removed from the stable data set, due
to issues with tidal state in the images; sea water was also removed) and classes that LCM
7
has traditionally mapped poorly, such as ‘Fen, Marsh and Swamp’ and the semi-natural
grassland types.
3. Ancillary data and Knowledge-based enhancements – for LCM2007 ancillary data, such as
altitude and soil type data, were applied post-classification to minimise classification errors.
For example, to remove coastal classes from mountainsides that should have been classified
as ‘Inland Rock’ using an altitude-based rule. This process was difficult and time-consuming
as it required the identification of a systematic error and then the definition of a rule that
would correct the error; when classifications cover large areas this is difficult to judge and it
becomes a very subjective process. For LCM2015 the ancillary data sets are part of the input
data along with the satellite data, so the classification algorithm uses the ancillary data as
required making the knowledge-based enhancements objective and an integral part of the
process.
LCM2015 product specification
LCM2015 maps land cover (not land use) LCM2015 maps land cover and whilst this may be synonymous with land use it will not be in all cases. For example, an arable crop cover denotes arable land use, but often land use cannot be inferred, as, for example, grass used for recreation looks very similar to that which is grazed. LCM2015 is a stable, archived data set and as such each data set has a Digital Object Identifier (DOI) The DOI’s should be cited when referring to the data set in publications (see Citing LCM2015 (DOI’s)). LCM2015 sets a minimum mappable area of >0.5 ha Parcels less than 0.5ha and linear features less than 20m were dissolved into the surrounding landscape during the production process. LCM2015 classes LCM2015 maps 21 classes (Table 1), which are based on the UKs terrestrial Broad Habitats (Jackson et al., 2000). In some cases, the Broad Habitats can be reliably divided further, based on their spectral signatures, so:
The ‘Built-up Areas and Gardens’ Broad habitat is divided into ‘Suburban’ and ‘Urban’
classes.
The ‘Dwarf Shrub Heath’ is divided into ‘Heather’ and ‘Heather grassland’ classes.
The ‘Littoral Sediment’ Broad Habitat is divided into ‘Littoral sediment’ and ‘Saltmarsh’ (a
Priority Habitat).
LCM2015 has unique object labelling During the production process each parcel is given a unique label which is stored in the Geometry Id (gid) attribute. All users of the LCM2015 vector products will receive data containing this attribute. It is recommended that the gid attribute is retained within the LCM2015 data set and any developments of it. This will allow unambiguous communication between LCM2015 users.
8
LCM2015 has rich metadata During the production of LCM2015, like LCM2007 and LCM2000 before it, information about processing has been retained where possible. The LCM2015 vector data set therefore has a rich set of metadata for each polygon. The polygon attributes provide details about the dominant class for the polygon, but also a breakdown of the number of pixels classified as each land cover class in the polygon and the mean probability for the polygon from the classification algorithm. LCM2015 has uncertainty information The Random Forest classifier produces an estimate of per-pixel probability. This is included as a mean per-polygon value in the vector and in the 25m raster. LCM2015 has a range of data products The Land Cover Maps cater to a wide range of users requiring the data in a range of formats. LCM2015 has the ‘core’ vector data set, a 25m classification product, as well as percentage and dominant cover products at 1km. The 1km products are available in either the 21 target classes or grouped into 10 aggregate classes.
LCM2015 product overview
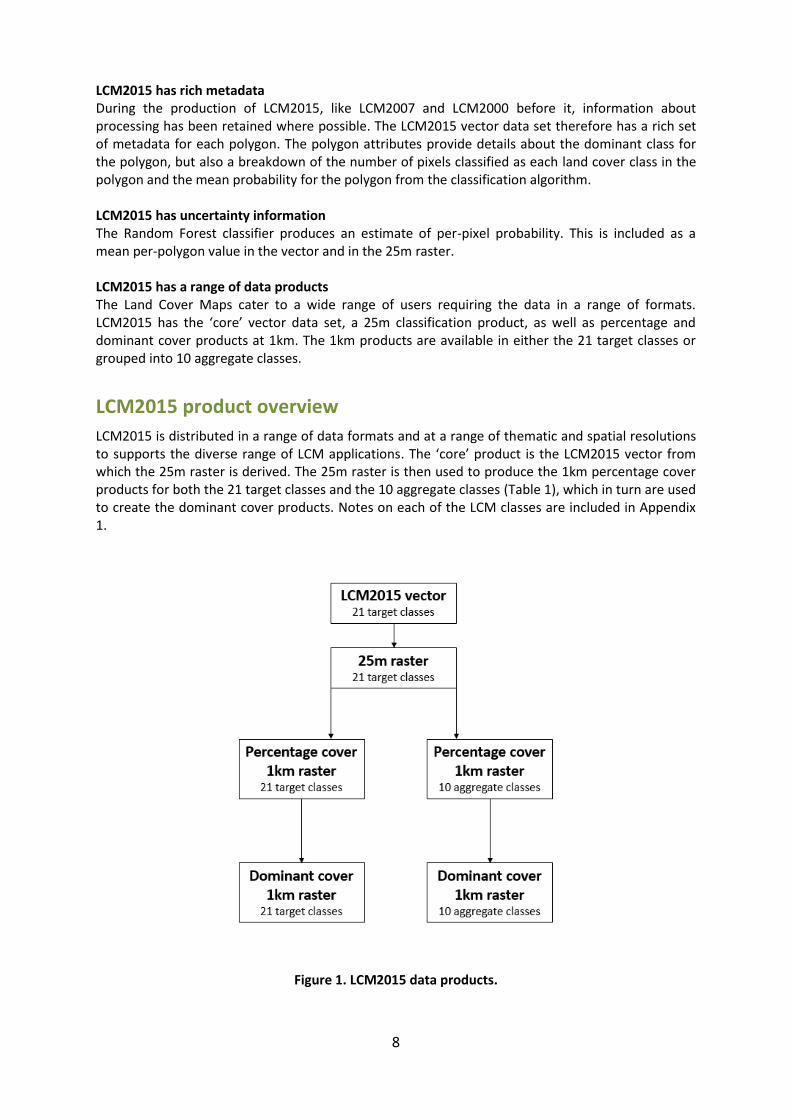
LCM2015 is distributed in a range of data formats and at a range of thematic and spatial resolutions to supports the diverse range of LCM applications. The ‘core’ product is the LCM2015 vector from which the 25m raster is derived. The 25m raster is then used to produce the 1km percentage cover products for both the 21 target classes and the 10 aggregate classes (Table 1), which in turn are used to create the dominant cover products. Notes on each of the LCM classes are included in Appendix 1.
Figure 1. LCM2015 data products.
9
Table 1. Relationship between Aggregate classes, Broad Habitat and LCM2015 classes. Green shading highlights Broad Habitats as documented by JNCC (Jackson, 2000) and summarised in Appendix 2. 1,2 Aggregate class number and LCM2015 class number used for raster data sets.
Aggregate class
Aggregate class
number1 Broad Habitat LCM2015 target class
LCM2015 target class
number2
Broadleaf woodland 1 ‘Broadleaved, Mixed and Yew Woodland’
Broadleaved woodland
1
Coniferous woodland 2 ‘Coniferous Woodland’ ‘Coniferous Woodland’ 2
Arable 3 ‘Arable and Horticulture’
‘Arable and Horticulture’
3
Improved grassland 4 ‘Improved Grassland’ ‘Improved Grassland’ 4
Semi-natural grassland 5
‘Neutral Grassland’ ‘Neutral Grassland’ 5
‘Calcareous Grassland’ ‘Calcareous Grassland’ 6
‘Acid Grassland’ Acid grassland 7
‘Fen, Marsh and Swamp’ ‘Fen, Marsh and Swamp’
8
Mountain, heath, bog 6
‘Dwarf Shrub Heath’ Heather 9
Heather grassland 10
‘Bog’ ‘Bog’ 11
‘Inland Rock’ ‘Inland Rock’ 12
Saltwater 7 Saltwater Saltwater 13
Freshwater 8 Freshwater Freshwater 14
Coastal 9
‘Supra-littoral Rock’ ‘Supra-littoral Rock’ 15
‘Supra-littoral Sediment’ ‘Supra-littoral Sediment’
16
‘Littoral Rock’ ‘Littoral Rock’ 17
‘Littoral Sediment’ Littoral sediment 18
Saltmarsh 19
Built-up areas and gardens
10 ‘Built-up Areas and Gardens’
Urban 20
Suburban 21
Example datasets
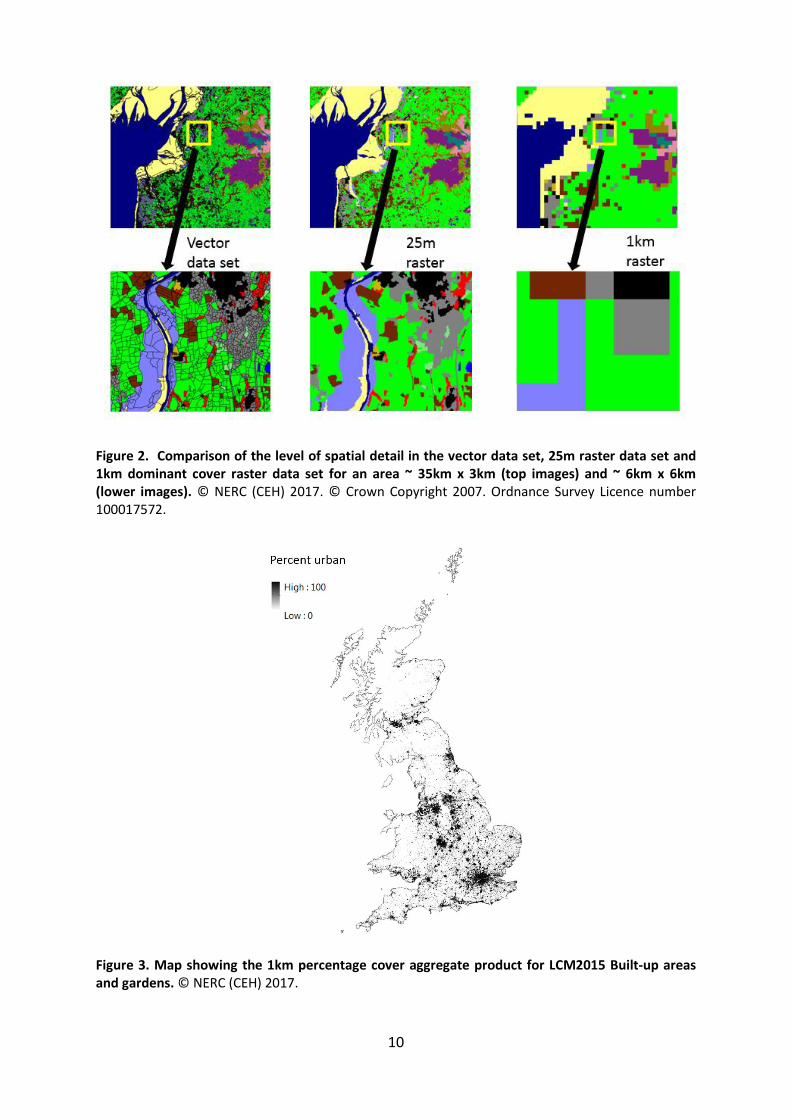
Figure 2 provides illustrations of the data sets available for Land Cover Map 2015 and the level of detail associated with each product. Spatially the vector data set and the 25m raster data set are quite similar, however, the advantage of the vector data set is that each polygon has a set of metadata attached. The disadvantage of the vector is that this increases the file size and may make processing unwieldy for many applications/users. The 25m raster data set maybe useful in such circumstances, as it provides the same land cover detail, but without all of the metadata information and the polygon boundaries; this is more appropriate for many applications. The 1km data sets are typically used for modelling the whole of the UK in conjunction with other data, such as meteorological data or species distribution data. They are created by calculating the percentage of the 1km square covered by each class (e.g. urban) based on the distribution of the class (e.g. urban) in the 25m raster data set. Figure 3 shows the 1km aggregate percentage cover for ‘Built-up areas and gardens’ across the UK.
10
Figure 2. Comparison of the level of spatial detail in the vector data set, 25m raster data set and 1km dominant cover raster data set for an area ~ 35km x 3km (top images) and ~ 6km x 6km (lower images). © NERC (CEH) 2017. © Crown Copyright 2007. Ordnance Survey Licence number 100017572.
Figure 3. Map showing the 1km percentage cover aggregate product for LCM2015 Built-up areas and gardens. © NERC (CEH) 2017.
11
Vector data set
The vector data product is provided as polygons with each one having a list of attributes attached to it. The nine attributes include land cover class (as text and integer), source image, uncertainty information, the number of pixels recorded for each class and the proportion of the polygon classified as the dominant class (Table 2). The vector data set contains 6.7 million polygons for Great Britain and 0.9 million for Northern Ireland.
Table 2. Description of the attributes of the LCM2015 vector data set.
Attribute Description
gid Unique parcel identifier (geometry identifier) for each parcel.
BHAB Dominant land cover at Broad Habitat level e.g. Improved grassland
Pix_dist List of 23 numbers giving the number of pixels of each class within the polygon (numbers 1-21), followed by the number of pixels in the polygon and the majority class (note – these final two are given as the npix and modal_class attributes in their own right).
unc Uncertainty – mean per polygon probability from Random Forest, scaled between 0-255
Unc_stdev Standard deviation of the uncertainty.
npix Number of pixels in polygon
Modal_class RECOMMENDED FOR DISPLAY. This attribute gives the LCM2015 class as an integer code from 1-21 (see Table 2). Note this is often referred to as the LCM2015 target class (see Appendix 3 for standard LCM colour mapping).
Modal_prop Proportion of polygon classified as dominant class
Composite The number of the composite image that the classification is derived from; 99 signifies infill from LCM2007 (see Appendix 4 for details of composite images).
Raster data sets
The raster data were derived from the vector dataset to produce a 25m raster and a series of 1km products. Great Britain and Northern Ireland are provided in separate data sets to allow for their different projections. Not all applications need the thematic resolution of the complete set of LCM2015 classes, so LCM2015 has a defined set of Aggregate classes, based on merging LCM2015 classes (Table 1). The Aggregate classes are used for the 1km raster products.
25m raster This is supplied as a 2-band raster, where band 1 is the LCM2015 classification (dominant) class per-polygon and band 2 is the mean per-polygon probability from the Random Forest classifier. The relationship between the band 1 pixel value and corresponding LCM2015 class is shown in Table 1, with detail on the extent of the data set and other metadata in Table 3.
12
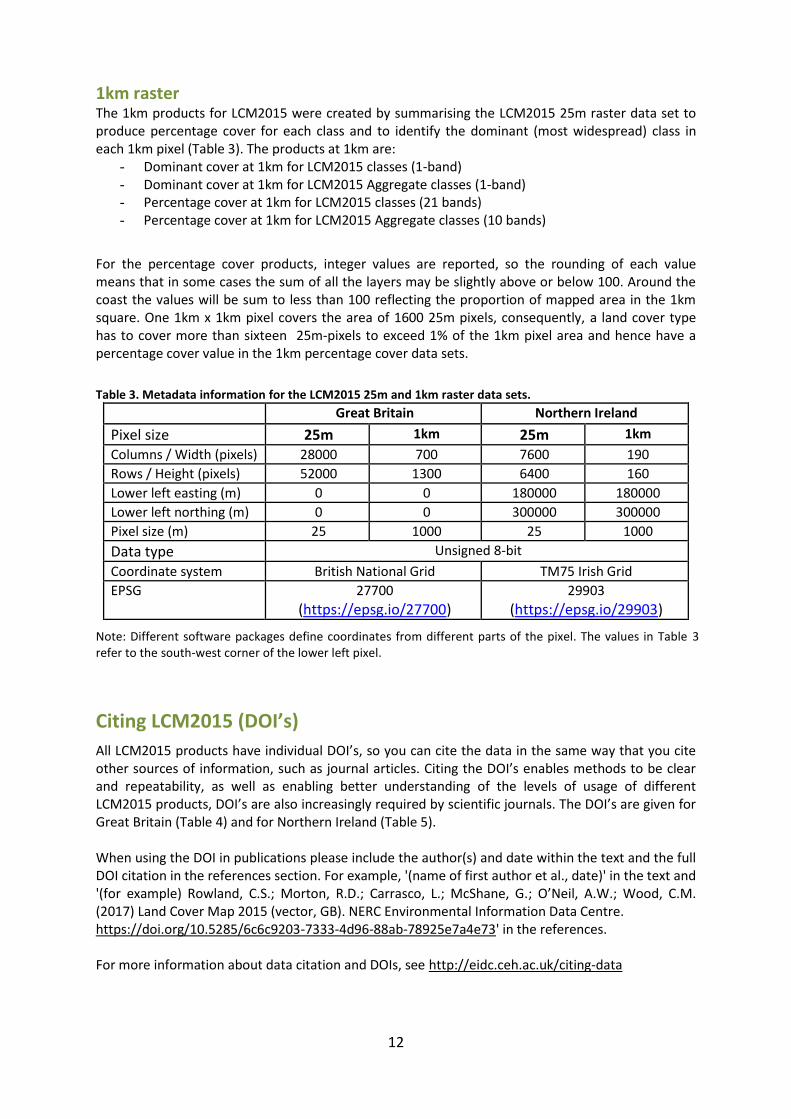
1km raster The 1km products for LCM2015 were created by summarising the LCM2015 25m raster data set to produce percentage cover for each class and to identify the dominant (most widespread) class in each 1km pixel (Table 3). The products at 1km are:
- Dominant cover at 1km for LCM2015 classes (1-band) - Dominant cover at 1km for LCM2015 Aggregate classes (1-band) - Percentage cover at 1km for LCM2015 classes (21 bands) - Percentage cover at 1km for LCM2015 Aggregate classes (10 bands)
For the percentage cover products, integer values are reported, so the rounding of each value means that in some cases the sum of all the layers may be slightly above or below 100. Around the coast the values will be sum to less than 100 reflecting the proportion of mapped area in the 1km square. One 1km x 1km pixel covers the area of 1600 25m pixels, consequently, a land cover type has to cover more than sixteen 25m-pixels to exceed 1% of the 1km pixel area and hence have a percentage cover value in the 1km percentage cover data sets.
Table 3. Metadata information for the LCM2015 25m and 1km raster data sets.
Great Britain Northern Ireland
Pixel size 25m 1km 25m 1km
Columns / Width (pixels) 28000 700 7600 190 Rows / Height (pixels) 52000 1300 6400 160 Lower left easting (m) 0 0 180000 180000
Lower left northing (m) 0 0 300000 300000
Pixel size (m) 25 1000 25 1000
Data type Unsigned 8-bit
Coordinate system British National Grid TM75 Irish Grid EPSG 27700
(https://epsg.io/27700) 29903
(https://epsg.io/29903)
Note: Different software packages define coordinates from different parts of the pixel. The values in Table 3 refer to the south-west corner of the lower left pixel.
Citing LCM2015 (DOI’s)
All LCM2015 products have individual DOI’s, so you can cite the data in the same way that you cite other sources of information, such as journal articles. Citing the DOI’s enables methods to be clear and repeatability, as well as enabling better understanding of the levels of usage of different LCM2015 products, DOI’s are also increasingly required by scientific journals. The DOI’s are given for Great Britain (Table 4) and for Northern Ireland (Table 5). When using the DOI in publications please include the author(s) and date within the text and the full DOI citation in the references section. For example, '(name of first author et al., date)' in the text and '(for example) Rowland, C.S.; Morton, R.D.; Carrasco, L.; McShane, G.; O’Neil, A.W.; Wood, C.M. (2017) Land Cover Map 2015 (vector, GB). NERC Environmental Information Data Centre. https://doi.org/10.5285/6c6c9203-7333-4d96-88ab-78925e7a4e73' in the references. For more information about data citation and DOIs, see http://eidc.ceh.ac.uk/citing-data
13
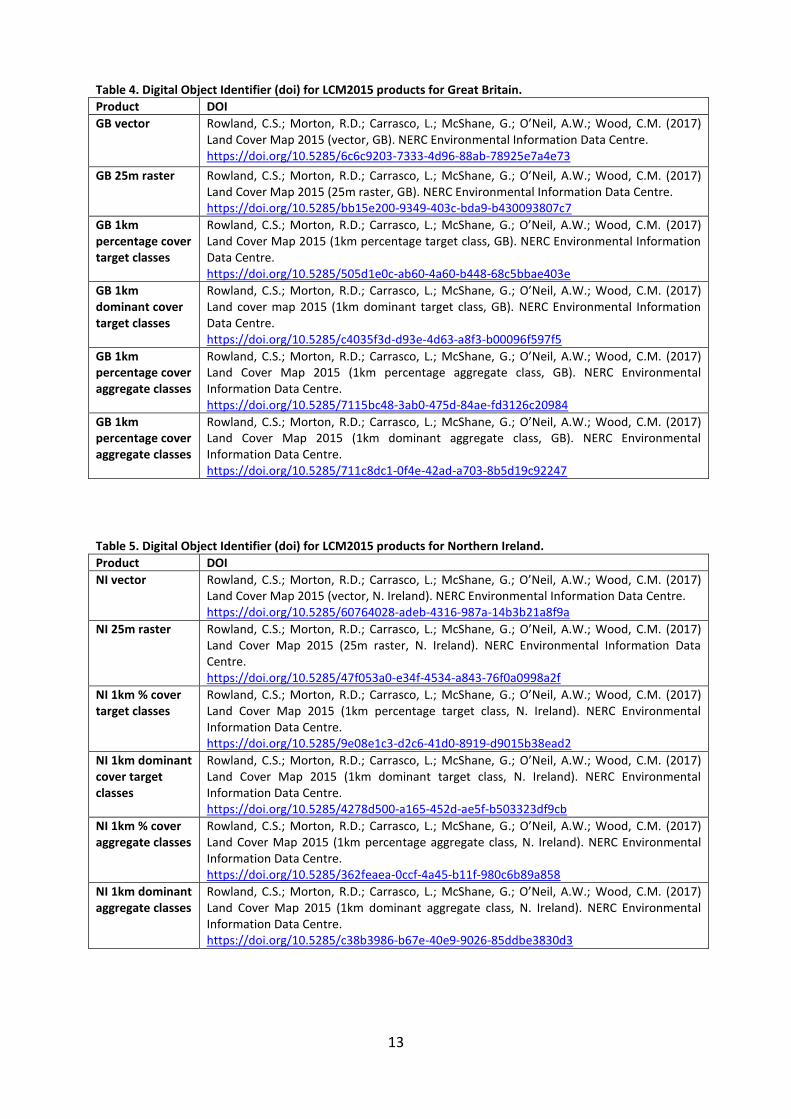
Table 4. Digital Object Identifier (doi) for LCM2015 products for Great Britain.
Product DOI
GB vector Rowland, C.S.; Morton, R.D.; Carrasco, L.; McShane, G.; O’Neil, A.W.; Wood, C.M. (2017) Land Cover Map 2015 (vector, GB). NERC Environmental Information Data Centre. https://doi.org/10.5285/6c6c9203-7333-4d96-88ab-78925e7a4e73
GB 25m raster Rowland, C.S.; Morton, R.D.; Carrasco, L.; McShane, G.; O’Neil, A.W.; Wood, C.M. (2017) Land Cover Map 2015 (25m raster, GB). NERC Environmental Information Data Centre. https://doi.org/10.5285/bb15e200-9349-403c-bda9-b430093807c7
GB 1km percentage cover target classes
Rowland, C.S.; Morton, R.D.; Carrasco, L.; McShane, G.; O’Neil, A.W.; Wood, C.M. (2017) Land Cover Map 2015 (1km percentage target class, GB). NERC Environmental Information Data Centre. https://doi.org/10.5285/505d1e0c-ab60-4a60-b448-68c5bbae403e
GB 1km dominant cover target classes
Rowland, C.S.; Morton, R.D.; Carrasco, L.; McShane, G.; O’Neil, A.W.; Wood, C.M. (2017) Land cover map 2015 (1km dominant target class, GB). NERC Environmental Information Data Centre. https://doi.org/10.5285/c4035f3d-d93e-4d63-a8f3-b00096f597f5
GB 1km percentage cover aggregate classes
Rowland, C.S.; Morton, R.D.; Carrasco, L.; McShane, G.; O’Neil, A.W.; Wood, C.M. (2017) Land Cover Map 2015 (1km percentage aggregate class, GB). NERC Environmental Information Data Centre. https://doi.org/10.5285/7115bc48-3ab0-475d-84ae-fd3126c20984
GB 1km percentage cover aggregate classes
Rowland, C.S.; Morton, R.D.; Carrasco, L.; McShane, G.; O’Neil, A.W.; Wood, C.M. (2017) Land Cover Map 2015 (1km dominant aggregate class, GB). NERC Environmental Information Data Centre. https://doi.org/10.5285/711c8dc1-0f4e-42ad-a703-8b5d19c92247
Table 5. Digital Object Identifier (doi) for LCM2015 products for Northern Ireland.
Product DOI
NI vector Rowland, C.S.; Morton, R.D.; Carrasco, L.; McShane, G.; O’Neil, A.W.; Wood, C.M. (2017) Land Cover Map 2015 (vector, N. Ireland). NERC Environmental Information Data Centre. https://doi.org/10.5285/60764028-adeb-4316-987a-14b3b21a8f9a
NI 25m raster Rowland, C.S.; Morton, R.D.; Carrasco, L.; McShane, G.; O’Neil, A.W.; Wood, C.M. (2017) Land Cover Map 2015 (25m raster, N. Ireland). NERC Environmental Information Data Centre. https://doi.org/10.5285/47f053a0-e34f-4534-a843-76f0a0998a2f
NI 1km % cover target classes
Rowland, C.S.; Morton, R.D.; Carrasco, L.; McShane, G.; O’Neil, A.W.; Wood, C.M. (2017) Land Cover Map 2015 (1km percentage target class, N. Ireland). NERC Environmental Information Data Centre. https://doi.org/10.5285/9e08e1c3-d2c6-41d0-8919-d9015b38ead2
NI 1km dominant cover target classes
Rowland, C.S.; Morton, R.D.; Carrasco, L.; McShane, G.; O’Neil, A.W.; Wood, C.M. (2017) Land Cover Map 2015 (1km dominant target class, N. Ireland). NERC Environmental Information Data Centre. https://doi.org/10.5285/4278d500-a165-452d-ae5f-b503323df9cb
NI 1km % cover aggregate classes
Rowland, C.S.; Morton, R.D.; Carrasco, L.; McShane, G.; O’Neil, A.W.; Wood, C.M. (2017) Land Cover Map 2015 (1km percentage aggregate class, N. Ireland). NERC Environmental Information Data Centre. https://doi.org/10.5285/362feaea-0ccf-4a45-b11f-980c6b89a858
NI 1km dominant aggregate classes
Rowland, C.S.; Morton, R.D.; Carrasco, L.; McShane, G.; O’Neil, A.W.; Wood, C.M. (2017) Land Cover Map 2015 (1km dominant aggregate class, N. Ireland). NERC Environmental Information Data Centre. https://doi.org/10.5285/c38b3986-b67e-40e9-9026-85ddbe3830d3
14
Map projection
The LCM2015 vector and raster data sets for Great Britain and Northern Ireland data sets are in the British National Grid and Irish National Grid projections respectively (see Table 3 for details).
Data access
The LCM2015 1km raster data sets are available via the CEH Environmental Information Platform https://eip.ceh.ac.uk/ The full vector product and 25m product are available under licence on request from CEH. Please complete the online application on the CEH web site [http://www.ceh.ac.uk/services/information-products] or contact [email protected] for further details. Please note that licence fees may apply for some users and some applications.
Further Information
Further information about LCM2015 is available at: https://www.ceh.ac.uk/services/land-cover-map-2015 https://eip.ceh.ac.uk/lcm
Queries should be addressed to: [email protected] The LCM2015 data paper is currently in preparation and will contain additional information.
References
Jackson D.L., (2000), Guidance on the interpretation of the Biodiversity Broad Habitat Classification (terrestrial and freshwater types): Definitions and the relationship with other classifications, JNCC Report 307, 73 pages, ISSN 0963 8091 (available online at: http://www.jncc.gov.uk/page-2433 ). Morton, D., Rowland, C., Wood, C. Meek, L., Marston, C., Smith, G., Wadsworth, R.,
Simpson, I.C. 2011. Final Report for LCM2007 - the new UK land cover map. Countryside
Survey Technical Report No 11/07 NERC/Centre for Ecology & Hydrology 112pp. (CEH
Project Number: C03259).
15
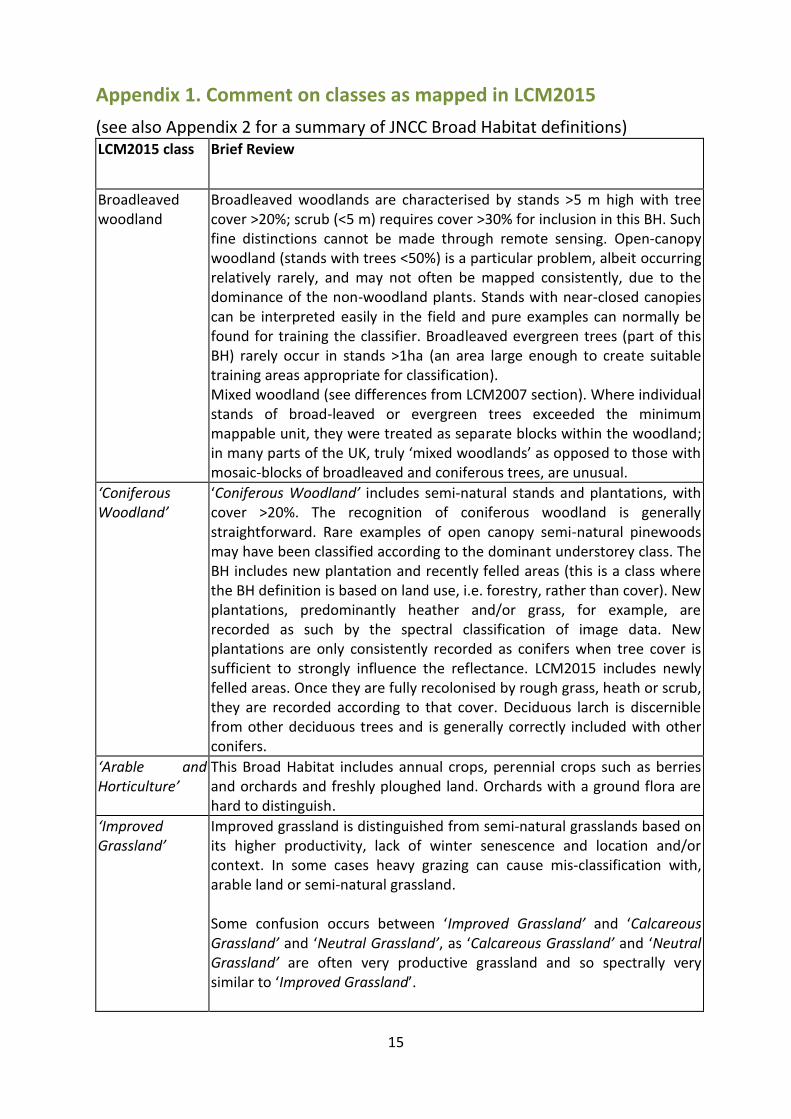
Appendix 1. Comment on classes as mapped in LCM2015
(see also Appendix 2 for a summary of JNCC Broad Habitat definitions) LCM2015 class Brief Review
Broadleaved woodland
Broadleaved woodlands are characterised by stands >5 m high with tree cover >20%; scrub (<5 m) requires cover >30% for inclusion in this BH. Such fine distinctions cannot be made through remote sensing. Open-canopy woodland (stands with trees <50%) is a particular problem, albeit occurring relatively rarely, and may not often be mapped consistently, due to the dominance of the non-woodland plants. Stands with near-closed canopies can be interpreted easily in the field and pure examples can normally be found for training the classifier. Broadleaved evergreen trees (part of this BH) rarely occur in stands >1ha (an area large enough to create suitable training areas appropriate for classification). Mixed woodland (see differences from LCM2007 section). Where individual stands of broad-leaved or evergreen trees exceeded the minimum mappable unit, they were treated as separate blocks within the woodland; in many parts of the UK, truly ‘mixed woodlands’ as opposed to those with mosaic-blocks of broadleaved and coniferous trees, are unusual.
‘Coniferous Woodland’
‘Coniferous Woodland’ includes semi-natural stands and plantations, with cover >20%. The recognition of coniferous woodland is generally straightforward. Rare examples of open canopy semi-natural pinewoods may have been classified according to the dominant understorey class. The BH includes new plantation and recently felled areas (this is a class where the BH definition is based on land use, i.e. forestry, rather than cover). New plantations, predominantly heather and/or grass, for example, are recorded as such by the spectral classification of image data. New plantations are only consistently recorded as conifers when tree cover is sufficient to strongly influence the reflectance. LCM2015 includes newly felled areas. Once they are fully recolonised by rough grass, heath or scrub, they are recorded according to that cover. Deciduous larch is discernible from other deciduous trees and is generally correctly included with other conifers.
‘Arable and Horticulture’
This Broad Habitat includes annual crops, perennial crops such as berries and orchards and freshly ploughed land. Orchards with a ground flora are hard to distinguish.
‘Improved Grassland’
Improved grassland is distinguished from semi-natural grasslands based on its higher productivity, lack of winter senescence and location and/or context. In some cases heavy grazing can cause mis-classification with, arable land or semi-natural grassland. Some confusion occurs between ‘Improved Grassland’ and ‘Calcareous Grassland’ and ‘Neutral Grassland’, as ‘Calcareous Grassland’ and ‘Neutral Grassland’ are often very productive grassland and so spectrally very similar to ‘Improved Grassland’.
16
‘Neutral Grassland’
For LCM2015 ‘Neutral Grassland’ is mapped spectrally, however, the inclusion of ancillary layers for slope and distance to rivers is expected to improve the classification of ‘Neutral Grassland’ on flood plains. Areas identified as ‘Neutral Grassland’ by LCM should probably be treated as having the potential to be ‘Neutral grassland’ as for a conclusive classification field survey is required to make a determination based on botanical composition. ‘Neutral Grassland’ also includes semi-improved grasslands managed for silage, hay or pasture (Jackson, 2000), which in LCM2015 will often be classified as ‘Improved Grassland’.
‘Calcareous Grassland’
For LCM2015 ‘Calcareous Grassland’ is mapped spectrally, however, the inclusion of ancillary layers for slope is expected to improve the classification of ‘Calcareous Grassland’ in some cases. Areas identified as ‘Calcareous Grassland’ by LCM should probably be treated as having the potential to be ‘Calcareous Grassland’ as for a conclusive classification field survey is required to make a determination based on botanical composition.
‘Acid Grassland’ For LCM2015, ‘Acid Grassland’ is mapped spectrally. Bracken can be mapped using LCM2015 methods, but it depends on image timing and suitable training areas (bracken often fails to offer stands sufficiently extensive for classification and training), so for consistency it is assigned to ‘Acid Grassland’. However, some stands of bracken can be identified at the subclass level.
Note about grassland classes
The comparisons between previous LCM data and other data sets (for example the ground reference polygons and Countryside Survey in 2007 Broad Habitat maps) (Morton et al., 2011), have shown that ‘Neutral Grassland’ and ‘Calcareous Grassland’ were often mis-classified as ‘Improved Grassland’. Some users may wish to aggregate the grassland classes together, if this is appropriate for their needs.
‘Heather’ and ‘Heather grassland’ (together form the ‘Dwarf Shrub Heath’ Broad Habitat)
‘Dwarf Shrub Heath’ is divided into two classes, depending on the density of Heather, producing ‘Heather’ and ‘Heather grassland’ classes respectively. This is similar to LCM1990's and LCM2000s Open and Dense Shrub Heath classes.
Note: the Land Cover Maps typically show confusion over the separation of ‘Bog’ and ‘Dwarf Shrub Heath’, however, this only affects the separation of these two BHs and they are often difficult to separate in the field.
Note, the Broad Habitat classification treats ericaceous vegetation on peat > 0.5 m depth as ‘Bog’.
‘Fen, Marsh and Swamp’
‘Fen, Marsh and Swamp’ includes fen, fen meadows, rush pasture, swamp, flushes and springs. From a remote sensing perspective ‘Fen, Marsh and Swamp’ is problematic as it is can be comprised of a wide range of land cover types and many patches of Fen are below the LCM2015 MMU. The small size of ‘Fen, Marsh and Swamp’ patches, plus their typically mosaic nature make it difficult to find representative areas of sufficient size to conduct a spectral classification. Consequently, ‘Fen, Marsh and Swamp’ will be underestimated by LCM2015.
‘Bog’ ‘Bog’ includes ericaceous, herbaceous and mossy swards in areas with a
17
peat depth > 0.5 m. ‘Bog’ forms part of an ecological continuum covering ‘Acid Grassland’, ‘Dwarf Shrub Heath’ and some types of ‘Fen, Marsh and Swamp’ and the separation of these habitats can be difficult, as the surface vegetation (i.e. land cover) maybe very similar and the division rests on the depth of peat. The division in the field can account for species presence, plus peat depth, but for LCM2015 the division is based on the spectral data and presumably also the slope data.
Saltwater Saltwater is mapped to a limited extent around the coastline of the UK. The extent is constrained by the extent of the digital cartography, which covers land and tidal areas, but not sea.
Freshwater
This is based on merging two freshwater BHs (‘Standing Open Water and Canals’ and ‘Rivers and Streams’), as they cannot be reliably separated from each other using the methods and data used for LCM2015. In many cases small and/or narrow water bodies fall below the MMU. Water bodies > 0.5 ha are readily mapped, as are very wide rivers (>50 m). The main exceptions are temporary water bodies, especially in quarries where the water body extent differs between the two images and differs from the associated polygon shape. Water in some quarries is strongly affected by the minerals in the rock and can result in strange water colours that maybe misclassified.
‘Inland Rock’ This Broad Habitat type covers both natural and artificial exposed rock surfaces which are >0.25ha, such as inland cliffs, caves, screes and limestone pavements, as well as various forms of excavations and waste tips such as quarries and quarry waste. To be classified as ‘Inland Rock’ the rock has to be the dominant spectral signature.
‘Urban’ and ‘Suburban’ (together form the ‘Built-up Areas and Gardens’ Broad Habitat)
Within the ‘Built-up Areas and Gardens’ Broad Habitat LCM2015 recognises two categories that can be determined reliably: ‘Urban’ and ‘Suburban’. ‘Urban’ includes dense urban, such as town and city centres, where there is typically little vegetation. ‘Urban’ also includes areas such as dock sides, car parks and industrial estates. ‘Suburban’ includes suburban areas where the spectral signature is a mix of urban and vegetation signatures.
‘Supra-littoral Rock’
Features that may be present in this coastal class include vertical rock, boulders, gullies, ledges and pools. Very limited areas are mappable using satellite remote sensing.
‘Supra- littoral Sediment’
This class includes sand-dunes, which are reliably mapped in this class. Areas of coastal sand may be confused between this class and the ‘Littoral sediment’ class.
‘Littoral Rock’ These classes are those in the maritime zone on a rocky coastline. They are generally more extensive than supra-littoral rock and thus more readily mappable from satellite images.

18
‘Littoral sediment’ and ‘Saltmarsh’ (together form the ‘Littoral Sediment’ Broad Habitat)
Littoral sediment is mapped as two classes: ‘Saltmarsh’ and ‘Littoral sediment’. Saltmarsh is a Priority Habitat and of sufficient extent and spectral distinction to be mapped consistently. The remaining ‘Littoral Sediment’ is mapped spectrally, although there maybe some confusion with the ‘Supra-littoral sediment’ class.
19
Appendix 2: Biodiversity Action Plan (BAP) Broad Habitats (reproduced
from Morton et al., 2011) This section provides a brief summary of the JNCC definitions of the Broad Habitats and is based on Jackson (2000). There is some duplication of material for some classes between Appendix 2 and Appendix 1, however the intention is to provide users with the key information they require to understand the LCM2015 classes and the Broad Habitat definitions they are based on. Note: class numbers here are JNCC’s Broad Habitat class numbers, not LCM2015 numbers.
1. Broadleaved, Mixed and Yew Woodland This Broad Habitat is characterised by vegetation dominated by trees >5m high when mature, with tree cover >20%. Scrub (<5 m) requires cover >30% for inclusion in this Broad Habitat. It includes stands of both native and non-native broadleaved trees and yew. Woodlands dominated by coniferous species but with >20% cover by deciduous species are included in this category. Areas of fen woodland dominated by species such as willow (Salix spp.), alder (Alnus glutinosa) or birch (Betula spp.) are also included.
2. Coniferous Woodland This Broad Habitat is characterised by vegetation dominated by trees >5m high when mature, which forms a canopy having a cover of >20%. ‘Coniferous Woodland’ includes semi-natural stands and plantations and includes both native and non-native coniferous trees.
3. Boundaries and Linear Features This Broad Habitat type covers a range of linearly arranged landscape features such as hedgerows, lines of trees, walls, stone and earth banks, grass strips and dry ditches. These features are not mapped by LCM2007 as they are generally too narrow to be reliably captured from the satellite images. It is included here as its inclusion in Countryside Survey is relevant for the Comparison between LCM2007 and Countryside Survey in Chapter 4.
4. Arable and Horticulture This Broad Habitat includes annual crops, perennial crops, woody crops, intensively managed commercial orchards, commercial horticultural land (such as nurseries, commercial vegetable plots and commercial flower growing areas), freshly-ploughed land, annual leys, rotational set-aside and fallow.
5. Improved Grassland ‘Improved Grassland’ is characterised by vegetation dominated by a few fast-growing grasses such as Lolium spp., and also white clover (Trifolium repens), on fertile, neutral soils. Improved Grasslands are typically either managed as pasture or mown regularly for silage production or in non-agricultural contexts for recreation and amenity purposes.
20
6. Neutral Grassland This Broad Habitat type is characterised by vegetation dominated by grasses and herbs on a range of neutral soils usually with a pH of between 4.5 and 6.5. It includes enclosed dry hay meadows and pastures, together with a range of grasslands which are periodically inundated with water or permanently moist.
7. Calcareous Grassland ‘Calcareous Grassland’ is characterised by vegetation dominated by grasses and herbs on shallow, well-drained soils which are rich in bases (principally calcium carbonate) formed by the weathering of chalk and other types of limestone or base-rich rock. Soil pH tends to be high (>6) although it may be as low as 5.
8. Acid Grassland ‘Acid Grassland’ is characterised by vegetation dominated by grasses and herbs on a range of lime-deficient soils which have been derived from acidic bedrock or from superficial deposits such as sands and gravels. Such soils usually have a low base status, with a pH of <5.5.
9. Bracken This Broad Habitat type covers areas dominated by a continuous canopy cover of bracken (Pteridium aquilinum) at the height of the growing season. It does not include areas with scattered patches of bracken or areas of bracken which are >0.25 ha which are included in the Broad Habitat type with which they are associated.
10. Dwarf Shrub Heath ‘Dwarf Shrub Heath’ is characterised by vegetation that has >25% cover of plant species from the heath family (ericoids) or dwarf gorse Ulex minor. It generally occurs on well-drained, nutrient-poor, acid soils. This habitat type does not include dwarf shrub dominated vegetation in which species characteristic of peat-forming vegetation such as cotton-grass Eriophorum spp. and peat-building sphagna are abundant, or that occurs on deep peat (> 0.5 m) as these are included in the 'Bog' Broad Habitat type.
11. Fen, Marsh and Swamp This habitat includes fen, flushes, springs, fen meadows, rush pasture and swamp. Fens are peatlands which receive water and nutrients from groundwater and surface run-off, as well as from rainfall. Flushes are associated with lateral water movement, and springs with localised upwelling of water. Marsh is a general term usually used to imply waterlogged soil; it is used more specifically here to refer to fen meadows and rush-pasture communities on mineral soils and shallow peats. Swamps are characterised by tall emergent vegetation. Reedbeds (i.e. swamps dominated by stands of common reed Phragmites australis) are also included in this type. Apart from rush pasture, examples of this Broad Habitat are relatively rare.
12. Bog This Broad Habitat type covers wetlands that support vegetation that is usually peat-forming and which receive mineral nutrients principally from precipitation rather than ground water.
21
This is referred to as ombrotrophic (rain-fed) mire. The Bog Broad Habitat includes ericaceous, herbaceous and mossy swards in areas with a peat depth >0.5m.
13. Standing Open Water and Canals This Broad Habitat type includes natural systems such as lakes, meres and pools, as well as man-made waters such as reservoirs, canals, ponds and gravel pits.
14. Rivers and Streams The 'Rivers and Streams' Broad Habitat type covers rivers and streams from bank top to bank top, or where there are no distinctive banks or banks are never overtopped, it includes the extent of the mean annual flood.
15. Montane The ‘Montane Habitats’ category includes a range of vegetation types that occur exclusively in the montane zone such as prostrate dwarf shrub heath, snow-bed communities, sedge and rush heaths, and moss heaths. The distinction between the sub-montane and montane zone is often blurred and the two usually merge through a band of transitional vegetation.
16. Inland Rock This Broad Habitat type covers both natural and artificial exposed rock surfaces which are >0.25ha, such as inland cliffs, caves, screes and limestone pavements, as well as various forms of excavations and waste tips such as quarries and quarry waste.
17. Built-Up Areas and Gardens This Broad Habitat type covers urban and rural settlements, farm buildings, caravan parks and other man-made built structures such as industrial estates, retail parks, waste and derelict ground, urban parkland and urban transport infrastructure. It also includes domestic gardens and allotments. This type does not include amenity grassland which should be included in the 'Improved Grassland' category.
18. Supralittoral Rock ‘Supralittoral Rock’ occurs above the high water mark, in areas influenced by wave splash and sea-spray. Features that may be present include vertical rock, boulders, gullies, ledges and pools, depending on the wave exposure of the site and its geology.
19. Supralittoral Sediment ‘Supralittoral Sediment’ occurs above the high water mark, but in areas influenced by wave splash and sea-spray. Includes shingle beaches, sand dunes and machair.
20. Littoral Rock The geology and wave exposure of the shore influence the form of Littoral Rock habitats, which can be as varied as vertical rock, shore platforms, boulder shores, or rocky reefs surrounded by areas of sediment. In general, ‘Littoral Rock’ tends to be colonised by algae in wave-sheltered conditions, and by limpets, barnacles and mussels as wave-exposure increases.

22
21. Littoral Sediment Areas of ‘Littoral Sediment’ are widespread around the UK forming features such as beaches, sand banks, and intertidal mudflats. A large proportion of this habitat occurs in estuaries and inlets where it can cover extensive areas. Saltmarsh is included within this Broad Habitat.
22. Inshore Sublittoral Sediment All areas of sea and estuary class are assumed to be ‘Inshore Sublittoral Sediment’. It is defined as within six nautical miles of the shoreline by JNCC.
23
Appendix 3: Recipe for standard LCM2015 colour mapping.
LCM2015 class LCM2015class
number
Red Green Blue
Broadleaved woodland 1 255 0 0
‘Coniferous Woodland’ 2 0 102 0
‘Arable and Horticulture’ 3 115 38 0
‘Improved Grassland’ 4 0 255 0
‘Neutral Grassland’ 5 127 229 127
‘Calcareous Grassland’ 6 112 168 0
Acid grassland 7 153 129 0
‘Fen, Marsh and Swamp’ 8 255 255 0
Heather 9 128 26 128
Heather grassland 10 230 140 166
‘Bog’ 11 0 128 115
‘Inland Rock’ 12 210 210 255
Saltwater 13 0 0 128
Freshwater 14 0 0 255
‘Supra-littoral Rock’ 15 204 179 0
‘Supra-littoral Sediment’ 16 204 179 0
‘Littoral Rock’ 17 255 255 128
Littoral sediment 18 255 255 128
Saltmarsh 19 128 128 255
Urban 20 0 0 0
Suburban 21 128 128 128
24
Appendix 4: Composite images used in LCM2015
Composite number Path Row Image date Image date sensor
c2 200 23 30/06/2015 23/12/2015 L8,L8
c3 200 24 30/06/2015 23/12/2015 L8,L8
c4 200 25 30/06/2015 23/12/2015 L8,L8
c5 202 22-23 09/04/2015 02/10/2015 L8,L8
c6 202 22-23 09/04/2015 12/06/2015 L8,L8
c7 202 24-25 09/04/2015 02/10/2015 L8,L8
c8 204 20 20/04/2014 30/09/2015 L8,L8
c9 204 21-22 23/04/2015 30/09/2015 L8,L8
c10 204 21 25/07/2014 30/09/2015 L8,L8
c11 204 22-23 23/04/2015 10/06/2015 L8,L8
c12 204 24-25 07/04/2015 30/09/2015 L8,L8
c13 204 24 07/04/2015 10/06/2015 L8,L8
c14 205 18 26/03/2014 27/04/2014 L8,L8
c15 206 19 18/04/2014 20/05/2014 L8,L8
c16 206 20 18/04/2014 23/07/2014 L8,L8
c17 206 21 18/04/2014 23/07/2014 L8,L8
c18 206 19 05/04/2014 20/05/2014 L8,L8
c19 206 20 18/04/2014 20/05/2014 L8,L8
c20 207 19 24/03/2014 14/05/2015 L8,L8
c21 207 21 14/05/2015 18/08/2015 L8,L8
c22 206 22 21/04/2015 18/06/2014 L8,AWIFS
c23 202 24-25 19/01/2015 09/04/2015 L8,L8
c24 201 23 26/02/2014 17/05/2014 L8,L8
c25 201 23 08/08/2015 12/11/2015 L8,L8
c26 201 24 26/02/2014 04/07/2014 L8,L8
c27 201 25 18/04/2015 08/08/2015 L8,L8
c28 201 25 18/04/2015 04/07/2014 L8,L8
c29 203 22 12/03/2014 09/10/2015 L8,L8
c30 203-204 22-23 12/03/2014 10/06/2015 L8,L8
c31 203-202 22-23 12/06/2015 09/10/2015 L8,L8
c32 201 24 14/03/2014 04/07/2014 L8,L8
c33 202-203 22-23 09/04/2015 09/10/2015 L8,L8
c34 204 22 10/06/2015 30/09/2015 L8,L8
c35 204 23 10/06/2015 01/11/2015 L8,L8
c36 204 23 10/06/2015 30/09/2015 L8,L8
c37 204 23 22/03/2015 10/06/2015 L8,L8
c38 5,207 23,19-20 20/04/2014 14/05/2015 AWIFS, L8
c39 206 22 21/04/2015 23/07/2014 L8,L8
c40 206-205 21-22 21/04/2015 05/11/2014 L8,L8
c41 207-206 22 06/01/2015 21/04/2015 L8,L8
c42 5,7 23 20/04/2014 11/07/2014 AWIFS, AWIFS
c43 205 18 27/04/2014 21/11/2014 L8,L8
25
c45 203 25 16/04/2014 02/07/2014 AWIFS, L8
c46 204 25 16/04/2014 25/07/2014 AWIFS, L8
c47 9,14 30,34 16/04/2014 08/09/2014 AWIFS, AWIFS
c48 9,7 30,28 16/04/2014 17/06/2014 AWIFS, AWIFS
c49 11,14 29,30 09/03/2014 08/09/2014 AWIFS, AWIFS
c50 5 23 20/04/2014 - AWIFS
c51 205 18 27/04/2014 - L8
c52 2 23 27/08/2014 - AWIFS
c53 11 30 09/03/2014 08/09/2014 AWIFS, AWIFS
c54 11,20 30 09/03/2014 17/05/2014 AWIFS, AWIFS
c55 204,14 22,30 23/04/2015 02/10/2014 AWIFS,TM
c56 11,203 30,22-23 09/03/2014 09/10/2015 AWIFS, TM
c57 203 22-23 09/10/2015 - L8
c58 202,9 23, 30 01/02/2014 16/06/2014 L8, AWIFS
c59 11,9 30 09/03/2014 16/04/2014 AWIFS, AWIFS
c60 203 22-23 12/03/2014 - L8
c61 14,204 30,22-23 01/01/2014 10/06/2015 AWIFS, L8
c62 9, 204 30, 24 16/04/2014 10/06/2015 AWIFS, L8
c63 11,9 30,30 09/03/2014 16/04/2014 AWIFS, AWIFS
c64 203 25 15/05/2014 - L8
c65 11 30 09/03/2014 - AWIFS
c66 204, 14 23, 30 07/04/2015 02/10/2014 AWIFS, L8
c67 204 24 07/04/2015 10/06/2015 L8, L8
c68 204 24 23/04/2015 - L8
c69 9,14 30 16/04/2014 02/10/2014 AWIFS, AWIFS
c70 204 22 30/09/2015 - L8
c71 14 30 02/10/2014 - AWIFS
c72 206 21-22 18/04/2014 - L8
c73 205 22 05/11/2014 - L8
c74 11 30 09/03/2014 - AWIFS
c75 205 21 10/12/2015 - L8
c76 206 22 21/04/2015 23/07/2014 L8,L8
c77 205 25 16/04/2014 14/06/2014 AWIFS, L8
c78 208 22 18/02/2015 18/06/2014 L8, AWIFS
c79 208 22 18/02/2015 20/04/2014 L8, AWIFS
c80 20 12 20/04/2014 18/06/2014 AWIFS, AWIFS
c81 207 22 17/08/2015 - L8
c82 208 22 18/03/2015 - L8
c83 206 22 18/04/2014 - L8
c84 20 12 18/06/2014 - AWIFS
c85 20 05 20/04/2014 - AWIFS