Embed Size (px)
Citation preview

Project Partners
TC: Tree canopy (TC) is the layer of branches, stems, and leaves of trees that cover the ground when viewed from above. Land Cover: Physical features on the earth mapped from aerial or satel-lite imagery, such as trees, grass, water, and impervious surfaces. Existing TC: The amount of urban tree canopy present when viewed from above using aerial or satellite imagery. Impervious Possible TC: Asphalt or concrete surfaces, excluding roads and buildings, that are theoretically available for the establishment of tree canopy if improvements were made. Vegetated Possible TC: Grass or shrub area that is theoretically availa-ble for the establishment of tree canopy. Not Suitable: Areas where it is highly unlikely that new tree canopy could be established (primarily buildings and roads).
Key Terms
Overview and Key Findings
Land Cover Change Analysis: Fairfax County, VA
This project applied the USDA Forest Service’s Tree Canopy As-sessment protocols to Fairfax, County. The analysis was conduct-ed using imagery that was acquired in 2015 and LiDAR data that was acquired in 2012 and 2014. The Spatial Analysis Laboratory (SAL) at the University of Vermont’s Rubenstein School of the Environment and Natural Resources carried out the assessment in collaboration with the USDA Forest Service, Spatial Systems Associates, Inc., and Fairfax County. Supporting vector data was provided by Fairfax County.
Figure 2: Tree Canopy metrics for Fairfax County, VA on percent of land area covered by each tree canopy type.
2015 Imagery
2011 Imagery
Change Detection
Land Cover Mapping
Figure 1: Study area and example of the land cover derived from high-resolution imagery for this project.
Fairfax County
Figure 2: Change detection of major development project show-ing Tree Canopy to Building in Magenta, Tree Canopy to Other Paved in Cyan and Tree Canopy to Grass/Shrubs in purple.
The University of Vermont’s Spatial Analysis Laboratory (SAL) performed a land cover change analysis for Fairfax County, VA. The analysis looked at changes in seven land cover classes (Figure 1) from 2011 to 2015. The foun-dation for this analysis was the 2011 land cover dataset produced as part of a prior assessment, along with a new land cover dataset produced using 2015 data. These two land cover datasets were normalized with each other to ensure that change identified between the two periods was due to modifica-tions to the landscape as opposed to offsets that may exist in the source data. Fairfax County has a dynamic landscape. New development over the past four years resulted in thousands of acres of vegetation loss, but this has been offset by tree canopy gain in other areas, largely due to natural regeneration and tree plantings. Overall, there was a net gain of less than 1% (294 acres) tree canopy in the 2011-2015 time period. Impervious surfaces also in-creased 1% (1,513 acres) during this timeframe.
The change detection dataset represents per-pixel change between the two time periods. While theoretically there could be 47 possible land cover com-binations, only 36 were detected in this analysis because some changes are not likely to occur (e.g. Roads/Railroads to Water). The final deliverables were an improved 2011 land cover dataset, a 2015 land cover dataset, and a change detection dataset between the two time periods. An accuracy as-sessment was conducted resulting in 93.5% overall accuracy for the 2015 land cover dataset.
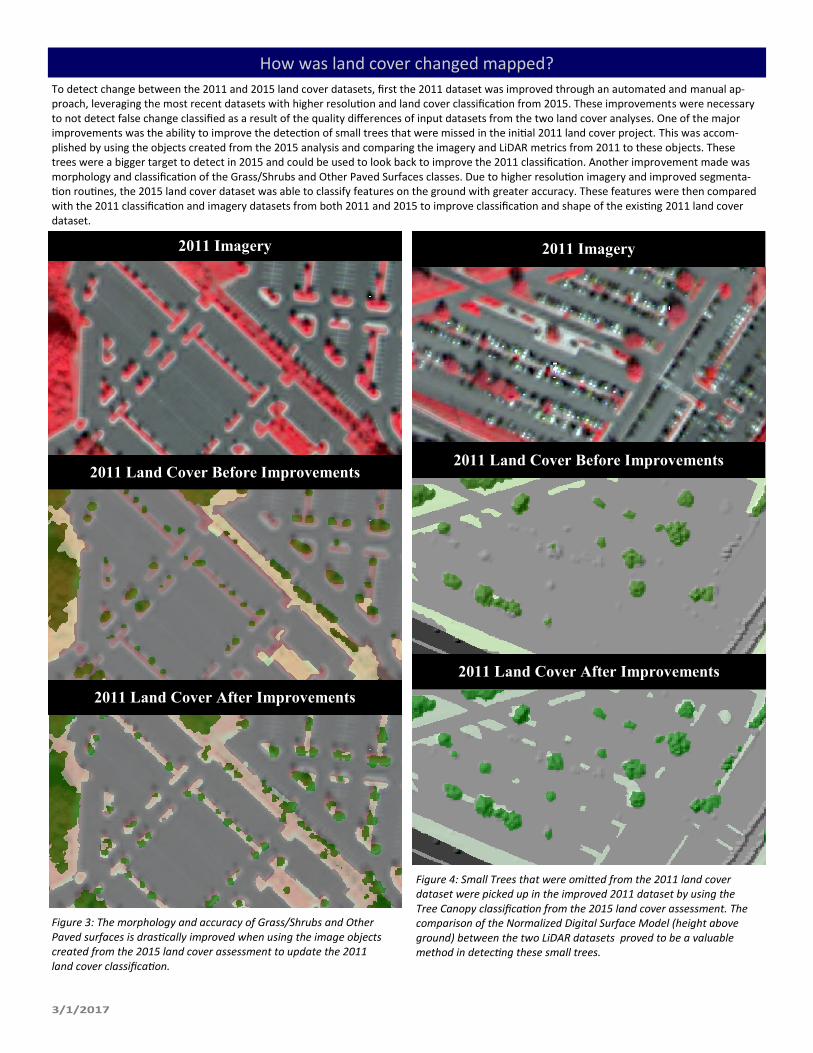
How was land cover changed mapped?
To detect change between the 2011 and 2015 land cover datasets, first the 2011 dataset was improved through an automated and manual ap-proach, leveraging the most recent datasets with higher resolution and land cover classification from 2015. These improvements were necessary to not detect false change classified as a result of the quality differences of input datasets from the two land cover analyses. One of the major improvements was the ability to improve the detection of small trees that were missed in the initial 2011 land cover project. This was accom-plished by using the objects created from the 2015 analysis and comparing the imagery and LiDAR metrics from 2011 to these objects. These trees were a bigger target to detect in 2015 and could be used to look back to improve the 2011 classification. Another improvement made was morphology and classification of the Grass/Shrubs and Other Paved Surfaces classes. Due to higher resolution imagery and improved segmenta-tion routines, the 2015 land cover dataset was able to classify features on the ground with greater accuracy. These features were then compared with the 2011 classification and imagery datasets from both 2011 and 2015 to improve classification and shape of the existing 2011 land cover dataset.
Figure 3: The morphology and accuracy of Grass/Shrubs and Other Paved surfaces is drastically improved when using the image objects created from the 2015 land cover assessment to update the 2011 land cover classification.
2011 Land Cover Before Improvements
2011 Imagery
2011 Land Cover After Improvements
2011 Land Cover Before Improvements
2011 Imagery
2011 Land Cover After Improvements
Figure 4: Small Trees that were omitted from the 2011 land cover dataset were picked up in the improved 2011 dataset by using the Tree Canopy classification from the 2015 land cover assessment. The comparison of the Normalized Digital Surface Model (height above ground) between the two LiDAR datasets proved to be a valuable method in detecting these small trees.

How was land cover change computed?
A classification system was derived to be able to measure how land cover has changed from 2011 to 2015 with ‘From’, ‘To’, or ‘No Change’ as labels. For example, if a forested area is growing over a grassy area the classification will be ‘Grass/Shrubs To Tree Canopy’ (Figure 5). If a building is detected as being in both land cover datasets, it is classified as ‘Buildings No Change’. It is also possible for buildings to change shape, in which case part of the building is classified as ‘Buildings No Change’ and the rest is classified as ‘Building to Grass/Shrubs’ or whichever ground feature ends up in its place (Figure 6). In many instances the differences in spectral values in four years varied greatly, however, the LiDAR was able to detect that nothing had changed using height. This was accomplished by comparing both the height and slope of objects (nDSM and slope of DSM) between two LiDAR datasets. Similarly, in areas where the LiDAR was collected in 2012 and detected no change, the more recent imagery was used to detect change. There was a substantial shift between the 2011 and 2015 imagery datasets, but negligible shift between the LiDAR datasets.
2015 Land Cover
2011 Land Cover
Change Detection
2015 Imagery
2011 Imagery
Change Detection
Figure 5: Tree Canopy growth near the Western border of Fairfax County.
Figure 6: Building being redone between 2011 and 2015 results in several different classifications including Building to Grass/Shrubs (purple) and Building to Other Paved (cyan).

In the 2011 land cover, 53% (150,850 acres) of the total area is existing tree canopy while in 2015 there was 57% (144,768 acres). These num-bers do not make sense considering the area of existing tree canopy increases roughly 6,000 acres from 2011 to 2015 but percentage de-creases by 4%. This is because the total area for 2011 and 2015 are not the same. The metrics derived from the 2011 land cover assessment are not di-rectly comparable to the assessment conducted in 2015 due to a change in the area of interest. The 2011 land cover assessment covered the Greater Fairfax area, including Fairfax County, the City of Fairfax, the City of Alexandria, and Arlington County (Figure 7). The 2015 land cover assessment did not have as large of an area of interest, covering Fairfax County and the City of Fairfax, while omitting the City of Alexan-dria and Arlington County (Figure 8). Change was detected for the area covered in the 2015 land cover assessment, where there is data availa-ble for both 2011 and 2015.
Differences between 2011 and 2015 studies
Figure 7: 2011 land cover assessment of Greater Fairfax County, VA.
Figure 8: 2015 land cover of Fairfax County and the City of Fairfax, VA.
Figure 9: 2015 land cover with extent of Greater Fairfax in yellow.

How much tree canopy does Fairfax County have in 2015?
Figure 10: Tree canopy metrics using percent (left) and acres (right) for Fairfax County, VA.
Figure 11: Tree Canopy percentage summarized by each zoning district.
An analysis of Existing and Possible Tree Canopy for Fairfax County was conducted using the 2015 land cover dataset (Figures 10 & 11). The en-tire land cover was grouped into four categories: Existing Tree Canopy, Possible Tree Canopy—Vegetation, Possible Tree Canopy—Impervious and Not Suitable. The majority of the county is in fact covered by tree canopy, at 57% of the total area (144,768 acres). 30% (77,937 acres) of the county was identified as Possible Tree Canopy (55,118 acres vegetation and 22,820 acres impervious respectively). Possible Tree Canopy-Impervious is asphalt or concrete surfaces, excluding roads and buildings, while Possible Tree Canopy-Vegetation is grass or shrub area. Both of these area types are theoretically available for the establishment of tree canopy. 13% (32,969 acres) is considered Not Suitable, which includes areas where it is highly unlikely that new tree canopy could be established (primary buildings and roads). The Possible category is theoretical because it would not always be likely for tree canopy to be planted there. For example, while soccer fields are technically Possible Tree Cano-py—Vegetation, the field will generally not be removed to plant new trees.
57%
22%
9%
13%
145k
55k
23k
33k Tree Canopy: Tree canopy is the layer of leaves, branches, and stems of trees that cover the ground when viewed from above. Land Cover: Physical features on the earth mapped from aerial or satellite imagery, such as trees, grass, water, and impervious surfaces. Existing Tree Canopy: The amount of urban tree canopy present when viewed from above using aerial or satellite imagery. Impervious Possible Tree Canopy: Asphalt or concrete surfaces, excluding roads and buildings, that are theoreti-cally available for the establishment of tree canopy. Vegetated Possible Tree Canopy: Grass or shrub area that is theoretically available for the establishment of tree can-opy. Not Suitable: Areas where it is highly unlikely that new tree canopy could be established (primarily buildings and roads).
Key Terms

How have tree canopy and impervious surfaces changed from 2011 to 2015?
Net change of tree canopy and impervious surfaces (Buildings, Roads/Railroads, and Other Paved) were relatively stagnant over the 4 year study period. 8,630 acres of Tree Canopy were gained, while 8,336 acres were lost with 135,545 acres experiencing no change. There was even less fluctuation per acre of Impervious Surfaces: 2,895 acres were gained and 1,382 acres were lost with 51,799 acres of no change. Notably, there was substantially more tree canopy loss (8,336 acres) than impervious surfaces gain (2,895 acres) indicating that the majority of tree canopy lost (5,441 acres) remains classified as a pervious surface (Grass/Shrubs, Bare Soil). This could be a temporary phenomenon as new construction con-verts Tree Canopy to Bare Soil, yet once the construction is finalized these surfaces will be paved.
Figure 12: Tree Canopy Gain, Loss and No Change metrics in acres re-sulting in net change of less than 1% (294 acres).
Figure 13: Impervious Surfaces (Buildings, Roads/Railroads, Other Paved) Gain, Loss and No Change metrics also resulting in a net change of less than 1% (1,513 acres).

How is tree canopy distributed by watershed and how has it changed?
Figure 14: Existing tree canopy percent by watersheds.
Figure 15: Possible tree canopy percent by watersheds. Figure 16: Tree canopy percent change by watershed.
Existing and Possible Tree Canopy, along with Tree Canopy change were summarized for each watershed in Fairfax County (Figures 14, 15 & 16). By percent area, Ryan’s Dam has the largest fraction of forested area at 93%, followed by Old Mill Branch at 88%, and High Point at 87%. By acre-age, Difficult Run has the largest area of tree canopy at 22,445 acres, followed by Accotink Creek at 16,164 acres, and then Pohick Creek at 13,707 acres. Difficult Run also has the largest Possible Tree Canopy-Vegetation Area at 7,534 acres. Accotink Creek has the largest Possible Tree Canopy-Vegetation Area at 4,006 acres. Of the 30 watersheds within Fairfax County, 14 experienced tree canopy loss. Belle Haven experienced the largest loss of tree canopy at 5.44% and Little Hunting Creek, Pimmit Run, Accotink Creek, Cameron Run, Scotts Run, and Four Mile Run all experienced greater than 1% tree canopy loss. 16 watersheds experienced tree canopy gain. Horsepen Creek had the most tree canopy growth at 3.19% followed by Mill Branch and Little Rocky Run at 3.08% and 2.86% respectively. Difficult Run, Sandy Run, Cub Run, Bull Run, Nichol Run, Sugarland Run, Bull Neck Run and Occoquan all had more than 1% tree canopy growth.

How is tree canopy distributed by supervisory districts and how has it changed?
Figure 19: Tree canopy percent change by supervisory district.
Figure 17: Existing tree canopy percent by supervisory district.
Figure 18: Possible tree canopy percent by supervisory district.
Existing and Possible Tree Canopy, along with Tree Canopy change was also summarized by supervisory districts (Figures 17, 18, 19, 20, 21 & 22). The three supervisory districts with the largest existing tree canopy by percentage also have the most forested area. Springfield has the most tree canopy at 68% (30,771 acres) followed by Dranesville at 61% (24, 648 acres), and Mount Vernon at 60% (24,099 acres). Lee, Providence, and Mason have the smallest forest cover by both percentage and area at 45% (7,696 acres), 46% (7,900 acres), and 48% (6,697 acres) respectively. Sully has the most Possible Tree Canopy with 27% vegetation and 10% impervious, followed by Lee with 23% vegetation and 13% impervious. Of the nine supervisory districts, four experienced tree canopy loss. Ma-son experienced the largest loss of tree canopy at 3.24% followed by Braddock at 1.88%, Providence at 1.26%, and Mount Vernon at 0.61%. Five supervisory districts experienced tree canopy gain. Sully had the most tree canopy growth at 1.94%, followed by Hunter Mill at 1.48%, Dranesville at 0.94%, Lee at 0.83%, and Springfield at 0.40%.

Supervisory districts continued...
Figure 21: Tree canopy metrics using percent by supervisory dis-Figure 20: Tree canopy metrics in acres by supervisory district.
Figure 22: Tree canopy change in acres by supervisory district.

Conclusions This study provides the foundation for understanding the quantity,
distribution, and configuration of tree canopy within Fairfax Coun-
ty as well as how tree canopy and land cover have changed be-tween 2011 and 2015. The true value of the study will be realized
when the analyses are used to drive and specify goals to conserve existing tree canopy in addition to establishing new tree canopy. Tree canopy in Fairfax County is a vital asset that provides a mul-
titude of ecosystem services: stormwater runoff reduction, im-proved air quality, decreased carbon footprint, enhanced quality
of life, savings on energy bills, and habitat for wildlife.
Overall there has been little net change in tree canopy within Fair-
fax County. The low amount of net change in tree canopy masks the dynamics that have occurred during the 2011-2015 time peri-od. Over 8000 acres of tree canopy were lost and hundreds of
parcels experienced a decrease of 50% or more of their tree cano-py. Fortunately, this loss has been largely offset by new growth
and tree plantings.
Changes in land cover are not evenly distributed across Fairfax
County. Some watersheds experienced losses of tree canopy in excess of 3%, whereas the watersheds with the greatest gains in
tree canopy did not reach a 2% increase. A similar pattern exists with supervisory districts in which the losses were largely concen-trated in a few of the districts.
Impervious surfaces have increased in Fairfax County. This increase
will likely contribute to a corresponding increase in the urban heat
island effect and more stormwater runoff.
The distribution of ecosystem services varies with the trees produc-
ing those services. The data from this study can be used to establish localized canopy goals and targeted plantings and conservation
efforts to maximize limited resources. Selecting a specific ecosys-tem benefit to build an engagement campaign can increase the
success in tree planting action, particularly when such an audience
is already galvanized around a particular issue (e.g. engaging resi-dents concerned about stormwater in a specific neighborhood in
tree planting efforts).
Although tree canopy change in Fairfax County has remained rela-
tively stable, it is important to note that significant changes in tree canopy do occur. The best way for a community to increase tree
canopy is to maintain what it currently has. Existing tree canopy helps to support both natural growth and natural regeneration. Removals of tree canopy, particularly in large quantities, pose a
threat to Fairfax County’s green infrastructure.
This dataset can be used to help determine some of the drivers of
tree canopy change within Fairfax County. New construction is un-doubtedly a driver of change and this dataset could be integrated
with recently approved permitting to explore the relationship be-tween development and tree canopy. Clusters of tree canopy re-
moval may by indicative of a change in attitude by residents to-wards tree canopy. These changes in attitudes can be caused by recent storms in which tree blowdowns have caused property dam-
age, resulting in residents taking preemptive action to remove trees.
Preserving tree canopy is just as important as new planting initia-
tives. Efforts to maintain larger forested areas will facilitate natural
regeneration in addition to insuring the preservation of the unique ecosystem services provided by these areas.
Future tree canopy assessments should be planned to assess chang-
es to the tree canopy in Fairfax County. Such assessments can pro-
vide crucial information on how effective tree planting and preserva-tion efforts are, in addition to understanding how other factors (e.g. development) may be impacting tree canopy. Future assessments
will only be made possible if continued investments in high-resolution remotely imagery and LiDAR are made. It is suggested that the future assessments are conducted at least every 5 years.
Jarlath O’Neil-Dunne University of Vermont Spatial Analysis Laboratory [email protected] 802.656.3324
Prepared by: Additional Information
For more info on the Urban Tree Canopy Assessment please visit http://nrs.fs.fed.us/urban/UTC/
Tree Canopy Assessment Team: Noah Ahles, Jason Black, Ernie Buford, Tayler Engel, Emma Estabrook, Samuel Grubinger, Max Hoover, Sarah Leidinger, Sean MacFaden, Jarlath O’Neil-Dunne, Kyle Onofreo, Anna Royar, Matthias Sirch
Figure 23: Normalized LiDAR point cloud representing height above ground.


![A [simple] land cover change intercomparison](https://img.pdfslide.us/doc/110x75/56814f92550346895dbd4da4/a-simple-land-cover-change-intercomparison.jpg)