Embed Size (px)
Citation preview

30°0'
93°30'
30°0'
93°0'
30°0'
92°30'
92°0'
30°0'
91°30'
91°0'
90°30'
30°0'
90°0'
30°0'
89°30'
30°0'
89°0'
29°30'N
89°30'
90°0'
29°30'
90°30'
91°0'
29°30'
91°30'
29°30'
92°0'92°30'
93°0'
29°0'
29°0'
89°0'
New Orleans
MISSISSIPPI
LOUISIANA
TEXASLOUIS
IANA
Cameron
Lake Pontchartrain
Big Mar
Lake Maurepas
Lake Salvador
Barataria Bay
Timbalier Bay
Terrebonne Bay
Caillou Lake
Lake Mechant
Lake Boudreaux
Little Lake
Atchafalaya Bay
GULF OF MEXICO
Lake Cataouatche
Atchaf
alay
a Ri
ver
Lake
Borg
ne
East Cote Blanche Bay
West Cote Blanche Bay
Vermilion Bay
White Lake
Grand Lake
CalcasieuLake
Black Lake
Fres
hwat
er B
ayou
Wax
Lak
e Out
let
MarshIsland
Lak
e Po
ntch
artra
in C
ause
way
Gulf Intracoastal Waterway
Gulf Intracoastal Waterway
Gulf Intracoastal W
aterway
Mississippi River-Gulf Outlet Canal
Mississippi River
Mississippi River
South
west P
ass
South Pass
Pass a Loutre
East Bay
West Bay
GardenIsland
Bay
Bayou Lafourche
Labranche wetlands
Calcasieu Ship C
hannel
Sweet Lake
Breton Sound
LakeFelicity
GULF OF MEXICO
GULF OF M
EXICO
Chandeleur Sound
Chandeleur Islands
Lac des Allemands
GULF OF MEXICO
Hackberry
Johnsons Bayou Grand Chenier
Wax Lake Delta
Atchafalaya Delta
IntracoastalCity
PecanIsland
Houma
GoldenMeadow
PortFourchon
Montegut
Dulac
Theriot
Amelia
Lake Verret
Lake Palourde
The Pen
Redfish Bay
BlindBay
QuarantineBay
AdamsBay
BastianBay
Lost LakeFour League
Bay
Bayou Perot
Bayou Rigolettes
GrandLake
Lake De Cade
LakeSaint
Catherine
SabineLake
Mermentau Basin
Lake Lery
Calcasieu-Sabine Basin
Teche-Vermilion Basin
Atchafalaya Delta Basin
Terrebonne Basin
Barataria Basin
Breton SoundBasin
PontchartrainBasin
U.S. Department of the InteriorU.S. Geological Survey
Pamphlet to accompanyScientific Investigations Map 3381
Land Area Change in Coastal Louisiana (1932 to 2016)
30°0'
93°30'
30°0'
93°0'
30°0'
92°30'
92°0'
30°0'
91°30'
91°0'
90°30'
30°0'
90°0'
30°0'
89°30'
30°0'
89°0'
29°30'N
89°30'
90°0'
29°30'
90°30'
91°0'
29°30'
91°30'
29°30'
92°0'92°30'
93°0'
29°0'
29°0'
89°0'
New Orleans
MISSISSIPPI
LOUISIANA
TEXASLOUIS
IANA
Cameron
Lake Pontchartrain
Big Mar
Lake Maurepas
Lake Salvador
Barataria Bay
Timbalier Bay
Terrebonne Bay
Caillou Lake
Lake Mechant
Lake Boudreaux
Little Lake
Atchafalaya Bay
GULF OF MEXICO
Lake Cataouatche
Atchaf
alay
a Ri
ver
Lake
Borg
ne
East Cote Blanche Bay
West Cote Blanche Bay
Vermilion Bay
White Lake
Grand Lake
CalcasieuLake
Black Lake
Fres
hwat
er B
ayou
Wax
Lak
e Out
let
MarshIsland
Lak
e Po
ntch
artra
in C
ause
way
Gulf Intracoastal Waterway
Gulf Intracoastal Waterway
Gulf Intracoastal W
aterway
Mississippi River-Gulf Outlet Canal
Mississippi River
Mississippi River
South
west P
ass
South Pass
Pass a Loutre
East Bay
West Bay
GardenIsland
Bay
Bayou Lafourche
Labranche wetlands
Calcasieu Ship C
hannel
Sweet Lake
Breton Sound
LakeFelicity
GULF OF MEXICO
GULF OF M
EXICO
Chandeleur Sound
Chandeleur Islands
Lac des Allemands
GULF OF MEXICO
Hackberry
Johnsons Bayou Grand Chenier
Wax Lake Delta
Atchafalaya Delta
IntracoastalCity
PecanIsland
Houma
GoldenMeadow
PortFourchon
Montegut
Dulac
Theriot
Amelia
Lake Verret
Lake Palourde
The Pen
Redfish Bay
BlindBay
QuarantineBay
AdamsBay
BastianBay
Lost LakeFour League
Bay
Bayou Perot
Bayou Rigolettes
GrandLake
Lake De Cade
LakeSaint
Catherine
SabineLake
Mermentau Basin
Lake Lery
Calcasieu-Sabine Basin
Teche-Vermilion Basin
Atchafalaya Delta Basin
Terrebonne Basin
Barataria Basin
Breton SoundBasin
PontchartrainBasin


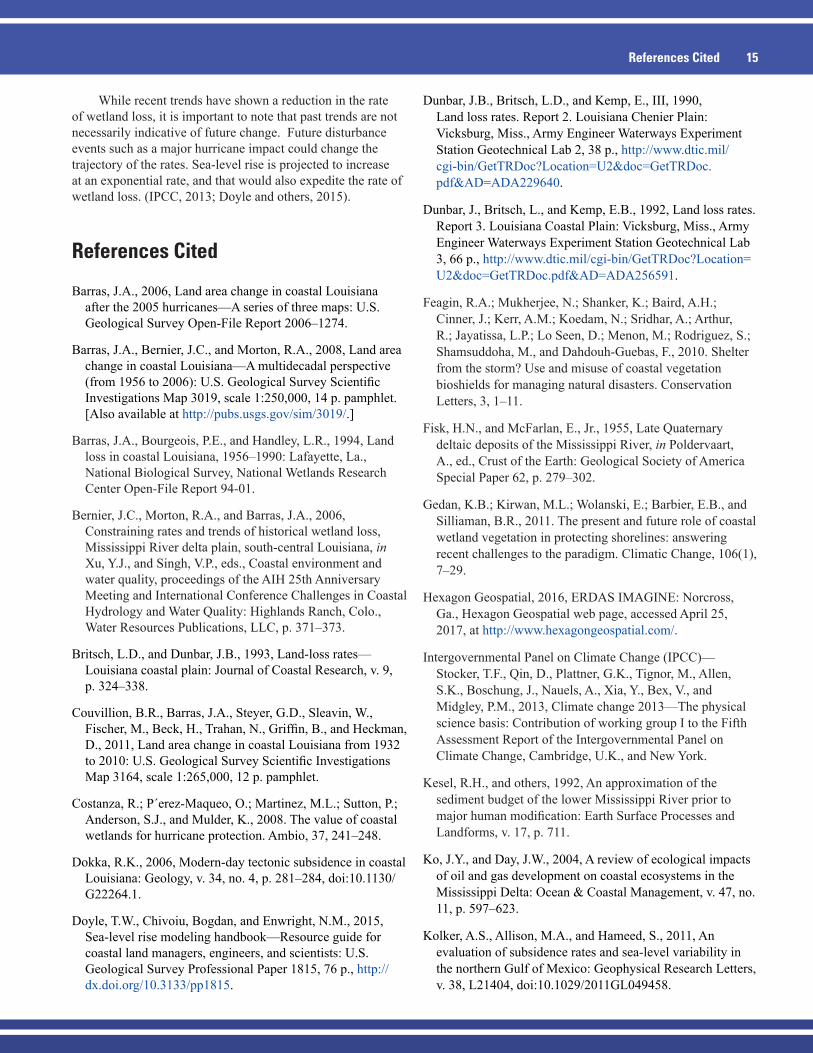
Land Area Change in Coastal Louisiana (1932 to 2016)
By Brady R. Couvillion, Holly Beck, Donald Schoolmaster, and Michelle Fischer
Pamphlet to accompanyScientific Investigations Map 3381
U.S. Department of the InteriorU.S. Geological Survey

U.S. Department of the InteriorRYAN K. ZINKE, Secretary
U.S. Geological SurveyWilliam H. Werkheiser, Acting Director
U.S. Geological Survey, Reston, Virginia: 2017
For more information on the USGS—the Federal source for science about the Earth, its natural and living resources, natural hazards, and the environment—visit http://www.usgs.gov/ or call 1–888–ASK–USGS (1–888–275–8747).
For an overview of USGS information products, including maps, imagery, and publications, visit http://www.usgs.gov/pubprod/.
Any use of trade, firm, or product names is for descriptive purposes only and does not imply endorsement by the U.S. Government.
Although this information product, for the most part, is in the public domain, it also may contain copyrighted materials as noted in the text. Permission to reproduce copyrighted items must be secured from the copyright owner.
Suggested citation: Couvillion, B.R., Beck, Holly, Schoolmaster, Donald, and Fischer, Michelle, 2017, Land area change in coastal Louisiana 1932 to 2016: U.S. Geological Survey Scientific Investigations Map 3381, 16 p. pamphlet, https://doi.org/10.3133/sim3381.
ISSN 2329-1311 (print) ISSN 2329-132X (online) ISBN 978-1-4113-4151-7

Contents
Abstract ...........................................................................................................................................................1Introduction.....................................................................................................................................................1
Study Area..............................................................................................................................................1Methodology ...................................................................................................................................................2Results ...........................................................................................................................................................13
Land Area Changes ...........................................................................................................................13Change in Land Change Rates through Time .................................................................................13
Discussion ....................................................................................................................................................13Conclusions...................................................................................................................................................14References Cited..........................................................................................................................................15
Figures
1. Map showing the study area in coastal Louisiana .................................................................2 2. Graph showing land area in coastal Louisiana, 1932–2016 ...................................................6 3. Graphs showing land area by hydrologic basin in coastal Louisiana, 1932–2016 .............7 4. Graph showing finite-difference approximation of land area change rates
through time in coastal Louisiana, 1932–2016 ..........................................................................9 5. Graphs showing finite-difference approximation of land area change rates
through time in coastal Louisiana by hydrologic basin, 1932–2016 ....................................10
Tables
1. Observed and modeled land area, including Standard Error in hydrologic basins and coastal Louisiana, 1932–2016 .................................................................................4
2. Water levels at a selected gage on the date of acquisition for imagery used in the land area estimates .................................................................................................8
3. Finite-difference approximation estimates of long-term wetland change rates including standard error estimates for each hydrologic basin and coastal Louisiana from 1932 to 2016 ......................................................................................................11
iii

iv
Conversion Factors
International System of Units to U.S. customary units
Multiply By To obtain
Length
meter (m) 3.281 foot (ft) kilometer (km) 0.6214 mile (mi)meter (m) 1.094 yard (yd)
Area
square kilometer (km2) 247.1 acresquare kilometer (km2) 0.3861 square mile (mi2)
DatumHorizontal coordinate information is referenced to the [North American Datum of 1983 (NAD 83)].
Abbreviations
DOA date of acquisition
edf effective degrees of freedom
FAV floating aquatic vegetation
MIR mid-infrared
mNDWI modified Normalized Difference Water Index
MSS Landsat Multispectral Scanner
NWI National Wetlands Inventory
OLI Operational Land Imager
SLR sea-level rise
USGS U.S. Geological Survey


vi
30°0'
93°30'
30°0'
93°0'
30°0'
92°30'
92°0'
30°0'
91°30'
91°0'
90°30'
30°0'
90°0'
30°0'
89°30'
30°0'
89°0'
29°30'N
89°30'
90°0'
29°30'
90°30'
91°0'
29°30'
91°30'
29°30'
92°0'92°30'
93°0'
29°0'
29°0'
89°0'
New Orleans
MISSISSIPPI
LOUISIANA
TEXASLOUIS
IANA
Cameron
Lake Pontchartrain
Big Mar
Lake Maurepas
Lake Salvador
Barataria Bay
Timbalier Bay
Terrebonne Bay
Caillou Lake
Lake Mechant
Lake Boudreaux
Little Lake
Atchafalaya Bay
GULF OF MEXICO
Lake Cataouatche
Atchaf
alay
a Ri
ver
Lake
Borg
ne
East Cote Blanche Bay
West Cote Blanche Bay
Vermilion Bay
White Lake
Grand Lake
CalcasieuLake
Black Lake
Fres
hwat
er B
ayou
Wax
Lak
e Out
let
MarshIsland
Lak
e Po
ntch
artra
in C
ause
way
Gulf Intracoastal Waterway
Gulf Intracoastal Waterway
Gulf Intracoastal W
aterway
Mississippi River-Gulf Outlet Canal
Mississippi River
Mississippi River
South
west P
ass
South Pass
Pass a Loutre
East Bay
West Bay
GardenIsland
Bay
Bayou Lafourche
Labranche wetlands
Calcasieu Ship C
hannel
Sweet Lake
Breton Sound
LakeFelicity
GULF OF MEXICO
GULF OF M
EXICO
Chandeleur Sound
Chandeleur Islands
Lac des Allemands
GULF OF MEXICO
Hackberry
Johnsons Bayou Grand Chenier
Wax Lake Delta
Atchafalaya Delta
IntracoastalCity
PecanIsland
Houma
GoldenMeadow
PortFourchon
Montegut
Dulac
Theriot
Amelia
Lake Verret
Lake Palourde
The Pen
Redfish Bay
BlindBay
QuarantineBay
AdamsBay
BastianBay
Lost LakeFour League
Bay
Bayou Perot
Bayou Rigolettes
GrandLake
Lake De Cade
LakeSaint
Catherine
SabineLake
Mermentau Basin
Lake Lery
Calcasieu-Sabine Basin
Teche-Vermilion Basin
Atchafalaya Delta Basin
Terrebonne Basin
Barataria Basin
Mississippi River Delta Basin
Breton SoundBasin
PontchartrainBasin
0 20 40 KILOMETERS10
0 20 40 MILES10
Scale 1:265,000N
EXPLANATION
1932–56 Persistent land loss2
1956–73 Persistent land loss2,4
1973–75 Persistent land loss2,4
1975–77 Persistent land loss2,4
1977–85 Persistent land loss2,4
1985–88 Persistent land loss2
1988–90 Persistent land loss2
1990–95 Persistent land loss2
1995–98 Persistent land loss2
1998–99 Persistent land loss2
1999–2002 Persistent land loss2
2002–04 Persistent land loss2
2004–06 Persistent land loss2
2006–08 Persistent land loss2
2008–09 Persistent land loss2
2009–10 Persistent land loss2
2010–13 Persistent land loss2
2013–14 Persistent land loss2
2014–15 New water area3
1932–56 Persistent land gain1
1956–73 Persistent land gain1,4
1973–75 Persistent land gain1,4
1975–77 Persistent land gain1,4
1977–85 Persistent land gain1,4
1985–88 Persistent land gain1
1988–90 Persistent land gain1
1990–95 Persistent land gain1
1995–98 Persistent land gain1
1998–99 Persistent land gain1
1999–2002 Persistent land gain1
2002–04 Persistent land gain1
2004–06 Persistent land gain1
2006–08 Persistent land gain1
2008–09 Persistent land gain1
2009–10 Persistent land gain1
2010–13 Persistent land gain1
2013–14 Persistent land gain1
2014–15 New land area3
Basin boundary
1Gain is determined by the last date a particular pixeltransitioned from water to land and remained landthroughout the period of observation.
2Loss is determined by the last date a particular pixeltransitioned from land to water and remained waterthroughout the period of observation.
3Because this date range has only one ending dataset,some of these effects may be temporary phenomena.
4This date range contains at least one date in whichthe land/water data were created from LandsatMultispectral Scanner System (MSS).

Land Area Change in Coastal Louisiana (1932 to 2016)
By Brady R. Couvillion, Holly Beck, Donald Schoolmaster, and Michelle Fischer
AbstractCoastal Louisiana wetlands are one of the most critically
threatened environments in the United States. These wetlands are in peril because Louisiana currently experiences greater coastal wetland loss than all other States in the contiguous United States combined. The analyses of landscape change presented here have utilized historical surveys, aerial, and satellite data to quantify landscape changes from 1932 to 2016. Analyses show that coastal Louisiana has experienced a net change in land area of approximately -4,833 square kilometers (modeled estimate: -5,197 +/- 443 square kilometers) from 1932 to 2016. This net change in land area amounts to a decrease of approximately 25 percent of the 1932 land area. Previous studies have presented linear rates of change over multidecadal time periods which unintentionally suggest that wetland change occurs at a constant rate, although in many cases, wetland change rates vary with time. A penalized regression spline technique was used to determine the model that best fit the data, rather than fitting the data with linear trends. Trend analyses from model fits indicate that coastwide rates of wetland change have varied from -83.5 +/- 11.8 square kilometers per year to -28.01 +/- 16.37 square kilometers per year. To put these numbers into perspective, this equates to long-term average loss rates of approximately an American football field’s worth of coastal wetlands within 34 minutes when losses are rapid to within 100 minutes at more recent, slower rates. Of note is the slowing of the rate of wetland change since its peak in the mid-1970s. Not only have rates of wetland loss been decreasing since that time, a further rate reduction has been observed since 2010. Possible reasons for this reduction include recovery from lows affected by the hurricanes of 2005 and 2008, the lack of major storms in the past 8 years, a possible slowing of subsidence rates, the reduction in and relocation of oil and gas extraction and infrastructure since the peak of such activities in the late 1960s, and restoration activities. In addition, many wetlands in more exposed positions in the landscape have already been lost. Most notable of the factors listed above is the lack of major storms over the past 8 years. The observed coastwide net “stability” in land area observed over the past 6–8 years does not imply that loss has ceased. Future disturbance events such as a major hurricane impact could change the trajectory of the rates. Sea-level rise is projected to increase at an exponential rate, and that would also expedite the rate of wetland loss.
IntroductionThe U.S. Geological Survey (USGS) analyzed
landscape changes in coastal Louisiana by determining land and water classifications for 21 datasets. Coastal Louisiana has been losing wetlands because of multiple compounding and interacting stressors including sea-level rise (SLR), subsidence, storms, sediment deprivation, oil and gas extraction and infrastructure, navigation infrastructure, saltwater intrusion, altered hydrology, and others (Penland and others, 2001). The purpose of this study is to provide updated estimates of persistent land change and historical land change trends for coastal Louisiana and for each hydrologic basin from 1932 to 2016. The use of 21 datasets plus the application of consistent change criteria in this study provide opportunities to better understand the timing and causal mechanisms of wetland loss that are critical for forecasting landscape changes in the future.
Study Area
The Louisiana coastal zone encompasses approximately 37,780 square kilometers (km2) of lowland plains, deltaic lobes, and open water (fig. 1). Coastal Louisiana wetlands are generally considered one of the most important environments in the United States because they support more than 30 percent of the commercial fisheries in the United States, 5 of the Nation’s top 20 ports are located in coastal Louisiana, and 20 percent of the Nation’s oil and gas comes from or is transported through these wetlands (Costanza and others, 2008; Feagin and others, 2010; Gedan and others, 2011; NOAA, 2010; Twilley, 2007). This coast is also considered to be one of the most “at-risk” environments in the Nation because approximately a quarter of these wetlands have been lost in the past 84 years (Couvillion and others, 2011).
Coastal Louisiana was built by sedimentary material sourced from fluvial and tidally redistributed deposits. The bulk of these deposits were delivered via the Mississippi River as a result of upper catchment glaciation and melting associated with sea-level changes. As glaciers retreated (from about 12,000 until 6,000 years ago), meltwater inundated valleys and transported much of the upper catchment sediments to the lower catchment floodplains that compose

2 Land Area Change in Coastal Louisiana (1932 to 2016)
CAMERON
PLAQUEMINES
ST BERNARD
IBERIA
TERREBONNE
VERMILION
ST MARY
LAFOURCHE
STTAMMANY
LIVINGSTON
ORLEANS
ST CHARLES
ASSUMPTIONST JAMES
ST JOHN THE BAPTIST
Area enlarged
Path 24
Path 23
Path 22
Path 21EXPLANATION
Modified Coastal Zone Boundary: 37,780 km2
Landsat Worldwide Reference System-2 (WRS-2)Missing from 1932 and 1956 data: 1,494 km2 within modified Coastal Zone Boundary
Missing from 1932 data: 2,888 km2 within modified Coastal Zone Boundary
Missing from 1956 data: 2,383 km2 within modified Coastal Zone Boundary N
Figure 1. The study area in coastal Louisiana. The coastal zone boundary, the zone for which statistics were calculated, isolates coastal regions while excluding fastlands (defined as developed, agricultural, and other protected areas) from statistical analysis of coastal land change. Of particular note are the areas of non-overlapping data coverage in the 1932 and 1956 datasets (based on survey and aerial data) and in the 1973–2016 datasets (based on satellite imagery data). Because no data exist for these non-overlapping areas, an assumption of no change in those areas has been used for those time periods in the analyses (a reasonable assumption because a majority of these data voids occurs in areas dominated by forested wetlands, a habitat type known to have been particularly stable in past observations). Areas are presented in square kilometers (km2).
coastal Louisiana today. Periodic floodwaters would carry these sediments, and as the floodwaters retreated, rich sediment left behind formed a vast expanse of fertile deltaic wetlands (Fisk and McFarlan, 1955). Hydrology continues to dictate the geomorphic structure and vegetation distribution of this landscape but in a drastically altered fashion. Flood-control structures including dams and levees were built, not only in Louisiana but throughout the Mississippi River catchment, particularly after the flood of 1927. The construction of these features has led to an overall decrease in the amount of sediment carried by the Mississippi River as a result of dam and levee construction throughout the drainage basin (Meade and others, 1990; Kesel and others, 1992). Anthropogenic controls also vary the distribution of sediment within the river by redirecting or altering the amount of sediment distribution at channel mouths, along channel banks, and across floodplains. These flood-control structures have contributed to a reduced capacity for sediment accretion and thereby reduced the ability of wetlands to maintain elevation in response to SLR and subsidence.
MethodologyThis study analyzed changes in the extent of land in
coastal Louisiana by using 21 datasets summarizing land and water areas from 1932 to 2016 (table 1; figs. 2 and 3).
The datasets were derived from multiple sources including (1) historical U.S. Army Corps of Engineers land loss data (1932) (Dunbar and others, 1990, 1992); (2) National Wetlands Inventory (NWI) data based on aerial photography (1956); (3) Landsat Multispectral Scanner (MSS) data (1973–79); (4) Landsat Thematic Mapper (TM) (1985–2010); and (5) Landsat Operational Land Imager (OLI) (2013–2016) satellite imagery classified into land and water categories. Variable data coverage among the 1932 and 1956 datasets and all subsequent data required an assumption of no change in the area of no data coverage in those datasets. No change is assumed in land area from 1932 to 1956 and from 1956 to 1973 in portions of the dataset that occur outside the boundaries of the 1932 and 1956 data coverage. (Refer to fig. 1 for more information regarding the areas within the coastal basins to which this assumption was applied.) The areas missing from the 1932 and 1956 datasets mostly consist of forested wetlands. These areas are historically stable, so the assumption of “no change” is correct in most instances; however, the area and change summaries should be used with the implicit understanding of this assumption in areas lacking data in 1932 and 1956.
Preprocessing of all datasets included use of ERDAS IMAGINE AutoSync software (Hexagon Geospatial, 2016) that uses an automated process to align common landform features between images. To assess change, the geometric registration between datasets must be highly accurate. Misalignment of features at the same location could produce

Methodology 3
invalid land change results. This processing step was critical in ensuring that the 1932 and 1956 data aligned with the later satellite-based data. The Landsat MSS data (1973, 1977, and 1979), which have a native 68- by 83-meter (m) resolution, were first resampled to a 30-m resolution by using a cubic convolution resampling method to facilitate comparability with later Landsat TM- and OLI-based data (native 30-m resolution). All satellite imagery data were then classified into land/water categories by using a methodology which makes use of a modified Normalized Difference Water Index (mNDWI) (Xu, 2005, 2006). The mNDWI enhances water features while cutting down on noise from land, vegetation, and soil (Xu, 2006). The mNDWI is seen in equation 1 below:
mNDWI = (Green-MIR)/(Green+MIR) (1)
Mid-infrared (MIR) is used because the wavelengths in this range, 1.55–1.75 micrometers, are particularly informative and discriminatory with regard to categorizing land and water. The green wavelength range is used as it maximizes reflectance of water and vegetation reflects MIR light more than green light (Xu, 2006). Initial mNDWI values were assigned to their appropriate land/water categories by thresholds. Supervised and unsupervised classification was then used to account for areas that may be incorrectly classified by the mNDWI alone. This step focuses on error-prone classes such as floating aquatic vegetation (FAV), shadows, and bridges. These areas were manually recoded to their appropriate land/water categories by expert analyses.
Land area estimates can vary substantially because of environmental variations such as seasonality and, most notably, water-level variations on the date of acquisition (DOA) (table 2) of the data (Morton and others, 2005; Bernier and others, 2006). A composite coastal land-water dataset was developed from the source-classified satellite data for each time period and was then used to derive the land area by date, basin area, and coastal area (table 1). To reduce some of the errors associated with apparent land change caused by misclassification or transient environmental phenomena, two approaches were utilized. Changes must persist for at least two consecutive time periods (of variable length, depending upon availability of cloud-free imagery) following the initial change, and anomalous changes among land and water categories can only occur in less than 20 percent of the remaining datasets. The mapped dataset identifies only these areas of persistent and consistent change. For this reason, recent land changes (2015 to early 2016) cannot yet be defined as persistent because data are not available to confirm that these changes have persisted into the two following analysis periods. These unconfirmed changes are instead referred to as “new land investigation areas” and “new water investigation areas.”
The resulting land area data were summarized by time period and by basin (fig. 3, table 1). Figures 2 and 3 display the long-term trend in land area over the period of observation. The function of change in land area over time was fit with a smoothing method called penalized regression splines by using the Mixed GAM Computation Vehicle (MGCV) package (Wood, 2000) on the R statistical platform (R Core Team, 2014). This method fits land change as a set of polynomials in a piecewise-continuous fashion across the span of years. Trends computed from this spline technique are smoothed and, as such, generalize trends over time. The intent of this study is to provide long-term, coarse-scale rates of change, and therefore these change rates are not appropriate at finer spatial and temporal scales. The complexity smoothing spline, as determined by the dimensionality of its basis function, was set to a maximum of five, but its final value was determined by cross-validation to prevent overfitting.
One of the assumptions of these modeling methods is that each data point provides equally precise information about the response variable. When this assumption is violated, there is non-zero covariance between the model error and the independent variables, which leads to biased estimates. These data clearly violate this assumption because of differences in data-collection methods. To account for differences in methods across years, points were weighted differently on the basis of expert opinion of the uncertainty inherent in each method. The weights affect how strongly each point contributes to estimates of total deviation. Data before 1973 were given half the weight of data after 1984. Data between 1973 and 1984 were given three-quarters weight of data after 1984. The goodness of fit is described by the coefficient of determination (R2) statistic. Effective degrees of freedom (edf) can be interpreted as being related to the degree of the polynomial fit of the spline (edf = 1 is linear, edf = 2 is quadratic, and so on). We fit the models with and without weighting the data. As suspected, failing to weight the data resulted in overfitting. Specifically, non-weighted models were more complex (larger edf) and had higher R2 values but generated slightly larger out-of-sample prediction error on average. This suggests that weighting data successfully reduced bias and improved the robustness of the models.
Figures 2 and 3 display the change in land area over time, whereas figures 4 and 5 and table 3 display approximations of the rates of land area change over time. Rates of change were calculated from the fitted models by using finite-difference approximation. The uncertainty of the finite differences was calculated by posterior simulations. Each fitted model was simulated 10,000 times, and the finite-difference estimates of the rates were calculated by using the function derivSimulCI() (Simpson, 2016). The 15.9 and 84.1 percentiles (representing the expected value +/- 1 standard deviation) of each rate estimate were calculated and displayed on the graphs.

4
Land Area Change in Coastal Louisiana (1932 to 2016)
Table 1. Observed and modeled land area, including Standard Error (SE) in hydrologic basins and coastal Louisiana, 1932–2016. Units are in square kilometers.Atchafalaya Delta Basin Barataria Basin Breton Sound Basin Calcasieu-Sabine Basin Mermentau Basin
Juliandate
Land area (observed)
Land area (modeled)
SE Land area (observed)
Land area (modeled)
SE Land area (observed)
Land area (modeled)
SE Land area (observed)
Land area (modeled)
SE Land area (observed)
Land area (modeled)
SE
1932 550.58 521.57 37.33 3,832.61 3,837.59 100.40 1,107.56 1,125.39 46.62 2,136.71 2,160.27 94.71 2,481.92 2,464.65 84.071956 511.70 514.08 21.01 3,580.92 3,629.09 76.41 974.02 1,025.31 26.36 2,099.23 1,929.75 54.67 2,379.63 2,321.90 55.971973.9 510.33 516.82 14.06 3,468.16 3,323.22 40.76 1,023.26 937.85 17.50 1,790.73 1,758.19 35.79 2,302.35 2,215.43 36.721975.7 545.24 517.82 13.54 3,172.13 3,282.24 38.65 900.69 927.70 16.83 1,807.18 1,743.12 34.35 2,338.63 2,204.73 34.981977.4 493.43 518.92 13.08 3,361.50 3,241.84 37.05 923.31 917.81 16.23 1,533.22 1,729.53 33.06 2,071.71 2,194.62 33.381985.1 483.82 525.67 11.16 2,977.82 3,047.84 31.52 864.71 869.40 13.83 1,593.98 1,676.63 28.02 2,021.58 2,148.82 27.051988.1 533.26 529.06 10.51 3,031.61 2,973.17 29.46 880.24 849.00 13.05 1,648.17 1,660.18 26.46 2,035.11 2,130.98 25.141990.8 515.21 532.43 9.98 2,859.62 2,909.55 27.90 810.68 829.96 12.43 1,707.41 1,647.40 25.29 2,164.47 2,114.92 23.781995.7 583.21 539.23 9.19 2,659.18 2,808.59 26.88 756.71 794.04 11.54 1,650.64 1,628.64 23.67 2,200.89 2,085.77 22.421998.2 468.64 542.97 8.88 2,829.30 2,766.69 26.94 811.51 775.19 11.15 1,544.00 1,620.92 22.96 1,911.53 2,070.90 22.331999.9 598.89 545.60 8.70 2,734.30 2,742.54 26.81 777.68 762.23 10.89 1,669.00 1,616.24 22.43 2,160.14 2,060.79 22.522002.2 548.25 549.23 8.52 2,802.67 2,715.65 26.10 788.86 744.55 10.58 1,631.37 1,610.50 21.69 2,023.27 2,047.11 23.072004.9 566.94 553.59 8.49 2,715.75 2,692.30 24.35 766.29 723.65 10.37 1,693.97 1,604.42 20.98 2,114.67 2,031.05 24.142006.8 554.23 556.70 8.65 2,683.07 2,680.72 22.88 684.02 708.89 10.44 1,619.11 1,600.42 20.88 1,894.03 2,019.75 25.142008.8 526.17 559.99 9.04 2,632.37 2,672.25 21.90 622.62 693.33 10.83 1,502.79 1,596.37 21.47 1,884.73 2,007.86 26.372009.8 568.12 561.65 9.33 2,618.09 2,669.21 21.97 628.07 685.55 11.17 1,473.35 1,594.38 22.11 1,893.36 2,001.91 27.052010.8 593.91 563.30 9.69 2,652.65 2,666.83 22.58 656.31 677.77 11.63 1,583.57 1,592.40 23.02 2,080.01 1,995.96 27.772013.9 619.64 568.45 11.23 2,656.36 2,662.38 28.31 647.23 653.65 13.68 1,605.89 1,586.31 27.43 2,033.72 1,977.52 30.212014.8 551.35 569.94 11.77 2,656.79 2,661.55 30.89 652.70 646.65 14.44 1,622.24 1,584.55 29.10 2,077.78 1,972.17 30.972015.8 553.12 571.60 12.42 2,679.08 2,660.72 34.08 646.26 638.87 15.34 1,621.26 1,582.59 31.11 1,996.29 1,966.22 31.842016.1 566.90 572.10 12.62 2,712.53 2,660.48 35.09 682.01 636.54 15.63 1,619.01 1,582.01 31.73 1,993.69 1,964.44 32.11

Methodology
5
Table 1. Observed and modeled land area, including Standard Error (SE) in hydrologic basins and coastal Louisiana, 1932–2016. Units are in square kilometers.—ContinuedMississippi River Delta Basin Pontchartrain Basin Teche-Vermilion Basin Terrebonne Basin Coastwide Totals
Juliandate
Land area (observed)
Land area (modeled)
SE Land area (observed)
Land area (modeled)
SE Land area (observed)
Land area (modeled)
SE Land area (observed)
Land area (modeled)
SE Land area (observed)
Land area (modeled)
SE
1932 678.75 702.35 70.42 2,862.43 2,873.36 27.67 1,421.74 1,419.80 34.53 4,471.55 4,490.11 128.40 19,543.84 19,658.05 419.201956 626.31 486.15 51.80 2,689.07 2,722.32 18.42 1,347.43 1,377.98 24.12 4,191.70 4,246.20 91.66 18,400.01 18,271.63 280.891973.9 208.08 335.04 28.45 2,666.67 2,609.67 12.08 1,372.11 1,329.91 13.82 4,139.91 3,883.05 51.61 17,481.59 16,897.92 166.251975.7 244.16 326.14 26.99 2,587.61 2,598.35 11.51 1,367.83 1,323.47 13.13 3,961.86 3,838.01 48.99 16,925.32 16,748.29 158.091977.4 359.27 319.42 25.84 2,573.73 2,587.65 10.99 1,295.86 1,317.09 12.56 3,615.95 3,794.44 46.88 16,227.97 16,606.40 151.251985.1 315.01 308.05 21.85 2,536.17 2,539.19 8.90 1,275.20 1,286.24 10.54 3,433.10 3,593.55 39.45 15,501.38 15,976.75 126.601988.1 334.27 310.59 20.46 2,567.17 2,520.31 8.27 1,262.45 1,274.44 9.91 3,609.35 3,518.61 37.02 15,901.61 15,747.99 119.181990.8 357.39 315.08 19.45 2,514.53 2,503.32 7.83 1,237.77 1,264.54 9.46 3,425.47 3,455.23 35.30 15,592.54 15,555.21 114.131995.7 354.60 325.11 18.77 2,420.37 2,472.48 7.38 1,235.07 1,249.57 9.13 3,271.51 3,353.72 34.08 15,132.18 15,243.84 109.911998.2 295.37 329.39 18.75 2,491.55 2,456.75 7.35 1,255.36 1,243.95 9.07 3,281.10 3,309.97 33.93 14,888.36 15,106.21 108.661999.9 393.70 331.41 18.61 2,452.49 2,446.05 7.41 1,267.35 1,241.04 8.97 3,291.05 3,283.62 33.59 15,344.58 15,021.13 107.092002.2 346.00 332.60 18.06 2,446.46 2,431.58 7.59 1,258.42 1,238.35 8.67 3,351.74 3,252.32 32.53 15,197.04 14,916.65 103.352004.9 308.25 331.41 16.86 2,426.08 2,414.59 7.95 1,228.45 1,236.97 8.11 3,245.28 3,221.54 30.40 15,065.67 14,808.26 96.972006.8 274.49 328.83 15.91 2,362.91 2,402.63 8.27 1,236.53 1,237.05 7.71 3,215.95 3,203.29 28.80 14,524.36 14,739.97 92.802008.8 294.57 324.63 15.34 2,333.54 2,390.04 8.68 1,203.24 1,237.96 7.52 3,119.94 3,186.61 27.96 14,119.96 14,673.89 91.472009.8 281.50 322.02 15.44 2,339.36 2,383.75 8.90 1,219.41 1,238.67 7.61 3,119.51 3,179.07 28.24 14,140.76 14,642.67 92.962010.8 357.50 319.11 15.91 2,359.36 2,377.46 9.14 1,221.36 1,239.54 7.87 3,161.68 3,171.96 29.15 14,666.35 14,612.41 96.312013.9 306.83 308.79 19.88 2,364.85 2,357.95 9.94 1,289.79 1,242.86 9.77 3,213.18 3,151.80 36.31 14,737.51 14,522.81 118.922014.8 324.68 305.57 21.64 2,366.89 2,352.28 10.19 1,232.92 1,243.94 10.59 3,139.95 3,146.25 39.41 14,625.29 14,497.48 128.392015.8 315.79 301.96 23.80 2,364.48 2,345.99 10.48 1,234.85 1,245.14 11.59 3,142.53 3,140.14 43.23 14,553.67 14,469.43 139.992016.1 303.98 300.87 24.48 2,390.08 2,344.10 10.57 1,272.90 1,245.51 11.91 3,169.56 3,138.31 44.44 14,710.66 14,461.03 143.65

6 Land Area Change in Coastal Louisiana (1932 to 2016)
14,000
15,000
16,000
17,000
18,000
19,000
20,000Coastal Louisiana
Year
Land
are
a, in
squ
are
kilo
met
ers
1930 1940 1950 1960 1970 1980 1990 2000 2010 2020
EXPLANATION
edf = 2.903R2 = 0.923
Penalized Regression Spline, 1932–201695 percent confidence band
Note:
Figure 2. Land area in coastal Louisiana, 1932–2016. (See table 1 for specific area measurements.) The red line represents a penalized regression spline which approximates the data. The blue dotted lines represent a 95-percent confidence interval. Effective degrees of freedom (edf) can be interpreted as being related to the degree of the polynomial fit of the spline (edf = 1 is linear, edf = 2 is quadratic, and so on). The goodness of fit is described by the coefficient of determination (R2) statistic.

Methodology
7
laf170791_fig 03
500
550
600
Land
are
a, in
squ
are
kilo
met
ers
1930 1940 1950 1960 1970 1980 1990 2000 2010 2020
Atchafalaya Delta
2,60
02,
800
3,00
03,
200
3,40
03,
600
3,80
0 Barataria
1930 1940 1950 1960 1970 1980 1990 2000 2010 2020
edf = 3.378R2 = 0.937
700
800
900
1000
1100 Breton Sound
1930 1940 1950 1960 1970 1980 1990 2000 2010 2020
edf = 2.008R2 = 0.897
1,50
01,
600
1,70
01,
800
1,90
02,
000
2,10
0 Calcasieu-Sabine
1930 1940 1950 1960 1970 1980 1990 2000 2010 2020
edf = 2.206Land
are
a, in
squ
are
kilo
met
ers
R2 = 0.659
1,90
02,
000
2,10
02,
200
2,30
02,
400
2,50
0
Mermentau
edf = 1
1930 1940 1950 1960 1970 1980 1990 2000 2010 2020
R2 = 0.522edf = 3.252
1930 1940 1950 1960 1970 1980 1990 2000 2010 2020
200
300
400
500
600
Mississippi River Delta
R2 = 0.609
2,40
02,
500
2,60
02,
700
2,80
0
Pontchartrain
Year1930 1940 1950 1960 1970 1980 1990 2000 2010 2020
edf = 1Land
are
a, in
squ
are
kilo
met
ers
R2 = 0.922
1,20
01,
250
1,30
01,
350
1,40
0 Teche Vermilion
Year1930 1940 1950 1960 1970 1980 1990 2000 2010 2020
edf = 3.06R2 = 0.719 3,
200
3,40
03,
600
3,80
04,
000
4,20
04,
400 Terrebonne
Year1930 1940 1950 1960 1970 1980 1990 2000 2010 2020
edf = 3.14R2 = 0.915
EXPLANATION
Penalized Regression Spline, 1932–2016
95 percent confidence band
edf = 1.77R2 = 0.245
Figure 3. Land area by hydrologic basin in coastal Louisiana, 1932–2016. (See table 1 for specific area measurements.) The red line represents a penalized regression spline which approximates the data. The blue dotted lines represent a 95-percent confidence interval. Effective degrees of freedom (edf) can be interpreted as being related to the degree of the polynomial fit of the spline (edf = 1 is linear, edf = 2 is quadratic, and so on). The goodness of fit is described by the coefficient of determination (R2) statistic.

8 Land Area Change in Coastal Louisiana (1932 to 2016)
Table 2. Water levels at a selected gage (Station ID: 8761724, located near Grand Isle, Louisiana) on the date of acquisition for imagery used in the land area estimates. Elevations provided in meters (m) relative to station datum.
Path 21* Path 22* Path 23* Path 24*
Year Date Gauge height (m)
Date Gauge height (m)
Date Gauge height (m)
Date Gauge height (m)
1932 Variable Not Available Variable Not Available Variable Not Available Variable Not Available1956 Variable Not Available Variable Not Available Variable Not Available Variable Not Available1973.9 12/5/1973 Not Available 2/3/1973 Not Available 12/7/1973 Not Available 12/9/1973 Not Available1975.7 10/11/1975 Not Available 4/15/1975 Not Available 9/25/1975 Not Available 9/26/1975 Not Available1977.4 7/2/1977 Not Available 6/3/1977 Not Available 1/23/1977 Not Available 4/6/1977 Not Available1985.1 10/11/1985 2.07 1/19/1985 1.77 1/26/1985 1.81 12/3/1985 1.921988.1 12/4/1987 1.97 1/28/1988 1.53 12/2/1987 1.93 1/26/1988 1.821990.8 2/14/1991 1.82 11/1/1990 2.00 11/24/1990 1.95 10/30/1990 2.041995.7 10/7/1995 2.10 9/28/1995 2.09 10/5/1995 2.11 9/10/1995 2.081998.2 2/17/1998 1.84 2/24/1998 1.72 3/3/1998 1.87 3/10/1998 1.881999.9 11/27/1999 1.94 11/18/1999 1.97 11/16/1999 1.98 10/24/1999 2.052002.2 1/3/2002 1.83 2/27/2002 1.66 2/2/2002 1.82 1/8/2002 1.832004.9 10/15/2004 2.06 11/7/2004 1.97 10/13/2004 2.07 11/5/2004 2.012005.8 10/18/2005 2.05 10/25/2005 1.86 10/16/2005 2.03 10/23/2005 2.042006.8 1/25/2007 1.82 10/28/2006 1.99 11/4/2006 2.03 12/13/2006 1.902008.8 10/26/2008 2.08 10/1/2008 2.10 10/8/2008 2.10 9/29/2008 2.102009.8 11/14/2009 2.03 11/5/2009 2.04 11/12/2009 2.03 11/3/2009 2.052010.8 10/16/2010 1.99 10/7/2010 1.92 10/14/2010 1.94 10/5/2010 2.092013.9 10/24/2013 1.96 12/18/2013 1.76 2/27/2014 1.83 12/16/2013 1.802014.8 12/14/2014 1.90 11/19/2014 1.99 11/26/2014 1.81 11/1/2014 2.062015.8 10/14/2015 2.05 11/22/2015 2.02 12/15/2015 1.78 11/20/2015 1.992016.1 1/18/2016 1.88 2/10/2016 1.80 2/17/2016 1.88 2/8/2016 1.75

Methodology 9
EXPLANATION
Finite Difference Slope Approximation, 1932–201695 percent confidence band
Coastal Louisiana
Land
are
a ch
ange
rate
, in
squa
re k
ilom
eter
s pe
r yea
r
-100
-80
-60
-40
-20
0
Year
1930 1940 1950 1960 1970 1980 1990 2000 2010 2020
Figure 4. Finite-difference approximation of land area change rates through time in coastal Louisiana, 1932–2016; negative measurements indicate a net land loss rate, whereas positive measurements indicate net land gain rates. See table 3 for specific values.

10
Land Area Change in Coastal Louisiana (1932 to 2016)
laf170791_fig 05
EXPLANATION
Finite Difference Slope Approximation, 1932–2016
95 percent confidence band
Atchafalaya Delta
Land
are
a lo
ss ra
te,
in s
quar
e ki
lom
eter
s pe
r yea
r-2
-10
12
3
1930 1940 1950 1960 1970 1980 1990 2000 2010 2020
Barataria
-30
-25
-20
-15
-10
-50
5
1930 1940 1950 1960 1970 1980 1990 2000 2010 2020
Breton Sound
-10
-9-8
-7-6
-5-4
-3-2
1930 1940 1950 1960 1970 1980 1990 2000 2010 2020
Calcasieu/Sabine
-15
-10
-50
5
1930 1940 1950 1960 1970 1980 1990 2000 2010 2020
Land
are
a lo
ss ra
te,
in s
quar
e ki
lom
eter
s pe
r yea
r
Mermentau
-10
-8-6
-4-2
0
1930 1940 1950 1960 1970 1980 1990 2000 2010 2020
Mississippi River Delta
-15
-10
-50
5
1930 1940 1950 1960 1970 1980 1990 2000 2010 2020
Pontchartrain
-10
-8-6
-4-2
0
Land
are
a lo
ss ra
te,
in s
quar
e ki
lom
eter
s pe
r yea
r
Year1930 1940 1950 1960 1970 1980 1990 2000 2010 2020
Teche/Vermilion
-6-4
-20
24
Year1930 1940 1950 1960 1970 1980 1990 2000 2010 2020
Terrebonne
-30
-25
-20
-15
-10
-50
5
Year1930 1940 1950 1960 1970 1980 1990 2000 2010 2020
Figure 5. Finite-difference approximation of land area change rates through time in coastal Louisiana by hydrologic basin (as defined by the Louisiana Coastal Wetlands Planning, Protection and Restoration Act Program, n.d.), 1932–2016; negative measurements indicate land loss, whereas positive measurements indicate land gain. See table 3 for specific values.

Methodology
11
Table 3. Finite-difference approximation estimates of long-term wetland change rates including standard error (SE) estimates for each hydrologic basin and coastal Louisiana from 1932 to 2016. Units are in square kilometers per year.
Atchafalaya Delta Basin Barataria Breton Sound Calcasieu Mermentau Basin
Year Change rate per year
1 SE low
1 SE high
Change rate per year
1 SE low
1 SE high
Change rate per year
1 SE low
1 SE high
Change rate per year
1 SE low
1 SE high
Change rate per year
1 SE low
1 SE high
1932 -0.40 -1.69 0.88 -6.82 -13.28 -0.16 -4.05 -5.82 -2.31 -9.45 -13.26 -5.51 -5.95 -7.18 -4.721956 -0.13 -0.97 0.71 -12.43 -15.14 -9.75 -4.42 -5.48 -3.34 -9.92 -12.21 -7.67 -5.95 -7.18 -4.721973 0.47 -0.26 1.16 -21.66 -25.56 -17.87 -5.47 -6.41 -4.48 -8.72 -10.91 -6.55 -5.95 -7.18 -4.721975 0.57 -0.13 1.23 -22.89 -26.53 -19.41 -5.66 -6.57 -4.71 -8.33 -10.46 -6.25 -5.95 -7.18 -4.721977 0.67 -0.01 1.31 -24.01 -27.31 -20.79 -5.86 -6.74 -4.93 -7.90 -9.95 -5.90 -5.95 -7.18 -4.721985 1.06 0.43 1.67 -25.34 -27.96 -22.71 -6.65 -7.47 -5.81 -5.91 -7.74 -4.10 -5.95 -7.18 -4.721988 1.19 0.57 1.80 -24.36 -27.04 -21.66 -6.93 -7.74 -6.11 -5.11 -6.89 -3.33 -5.95 -7.18 -4.721990 1.27 0.66 1.87 -23.25 -25.95 -20.50 -7.10 -7.90 -6.29 -4.59 -6.34 -2.83 -5.95 -7.18 -4.721995 1.44 0.85 2.04 -18.96 -21.49 -16.40 -7.44 -8.23 -6.66 -3.45 -5.12 -1.80 -5.95 -7.18 -4.721998 1.52 0.93 2.12 -15.51 -17.68 -13.31 -7.59 -8.36 -6.83 -2.91 -4.51 -1.32 -5.95 -7.18 -4.721999 1.54 0.94 2.15 -14.27 -16.35 -12.17 -7.63 -8.40 -6.85 -2.76 -4.35 -1.17 -5.95 -7.18 -4.722002 1.60 0.95 2.24 -10.51 -12.53 -8.49 -7.71 -8.56 -6.88 -2.39 -4.10 -0.67 -5.95 -7.18 -4.722004 1.62 0.93 2.32 -8.11 -10.39 -5.85 -7.75 -8.67 -6.84 -2.21 -4.13 -0.33 -5.95 -7.18 -4.722006 1.64 0.89 2.40 -5.93 -8.67 -3.23 -7.77 -8.77 -6.77 -2.09 -4.26 0.01 -5.95 -7.18 -4.722008 1.65 0.83 2.47 -4.05 -7.35 -0.84 -7.78 -8.88 -6.67 -2.02 -4.44 0.33 -5.95 -7.18 -4.722009 1.65 0.80 2.50 -3.25 -6.83 0.22 -7.78 -8.93 -6.63 -2.00 -4.55 0.46 -5.95 -7.18 -4.722010 1.66 0.78 2.53 -2.56 -6.41 1.15 -7.78 -8.98 -6.59 -1.98 -4.66 0.56 -5.95 -7.18 -4.722013 1.66 0.73 2.59 -1.18 -5.55 3.05 -7.78 -9.07 -6.51 -1.96 -4.86 0.82 -5.95 -7.18 -4.722014 1.66 0.72 2.61 -0.96 -5.42 3.35 -7.78 -9.08 -6.50 -1.96 -4.90 0.85 -5.95 -7.18 -4.722015 1.66 0.72 2.61 -0.85 -5.34 3.51 -7.78 -9.09 -6.49 -1.96 -4.92 0.87 -5.95 -7.18 -4.72

12
Land Area Change in Coastal Louisiana (1932 to 2016)Table 3. Finite-difference approximation estimates of long-term wetland change rates including standard error (SE) estimates for each hydrologic basin and coastal Louisiana from 1932 to 2016. Units are in square kilometers per year.—Continued
Mississippi River Delta Basin Pontchartrain Basin Teche/Vermilion Basin Terrebonne Basin Coastal Louisiana
Year Change rate per year
1 SE low
1 SE high
Change rate per year
1 SE low
1 SE high
Change rate per year
1 SE low
1 SE high
Change rate per year
1 SE low
1 SE high
Change rate per year
1 SE low
1 SE high
1932 -8.71 -13.09 -4.38 -6.29 -6.69 -5.88 -1.57 -3.61 0.45 -7.62 -15.30 0.00 -52.66 -75.13 -29.821956 -9.61 -11.44 -7.78 -6.29 -6.69 -5.88 -2.09 -2.99 -1.19 -15.25 -18.58 -11.84 -67.98 -78.71 -57.051973 -5.91 -8.43 -3.34 -6.29 -6.69 -5.88 -3.38 -4.54 -2.22 -24.29 -28.73 -19.82 -82.47 -95.42 -69.231975 -4.84 -7.18 -2.45 -6.29 -6.69 -5.88 -3.59 -4.69 -2.50 -25.10 -29.26 -20.91 -83.19 -95.38 -70.741977 -3.70 -5.85 -1.47 -6.29 -6.69 -5.88 -3.80 -4.81 -2.78 -25.76 -29.60 -21.89 -83.51 -94.87 -71.871985 0.26 -1.51 2.07 -6.29 -6.69 -5.88 -4.02 -4.88 -3.18 -25.61 -28.84 -22.43 -78.54 -88.54 -68.641988 1.31 -0.49 3.14 -6.29 -6.69 -5.88 -3.83 -4.70 -2.98 -24.33 -27.62 -21.14 -74.05 -83.90 -64.161990 1.79 -0.04 3.65 -6.29 -6.69 -5.88 -3.60 -4.48 -2.75 -23.14 -26.46 -19.89 -70.38 -80.37 -60.551995 2.02 0.31 3.74 -6.29 -6.69 -5.88 -2.71 -3.52 -1.93 -19.28 -22.35 -16.27 -59.66 -68.97 -50.591998 1.49 -0.04 2.99 -6.29 -6.69 -5.88 -1.99 -2.70 -1.29 -16.51 -19.19 -13.82 -52.55 -60.94 -44.431999 1.21 -0.24 2.64 -6.29 -6.69 -5.88 -1.72 -2.41 -1.05 -15.55 -18.14 -12.99 -50.16 -58.36 -42.242002 0.17 -1.23 1.57 -6.29 -6.69 -5.88 -0.91 -1.59 -0.24 -12.73 -15.31 -10.16 -43.32 -51.83 -35.212004 -0.62 -2.21 0.96 -6.29 -6.69 -5.88 -0.40 -1.17 0.37 -11.01 -13.88 -8.14 -39.23 -48.78 -30.092006 -1.42 -3.30 0.46 -6.29 -6.69 -5.88 0.08 -0.81 0.97 -9.49 -12.84 -6.12 -35.67 -46.81 -25.172008 -2.18 -4.40 0.06 -6.29 -6.69 -5.88 0.49 -0.56 1.55 -8.21 -12.17 -4.26 -32.75 -45.57 -20.512009 -2.52 -4.93 -0.09 -6.29 -6.69 -5.88 0.67 -0.46 1.81 -7.68 -11.96 -3.43 -31.54 -45.28 -18.562010 -2.82 -5.39 -0.24 -6.29 -6.69 -5.88 0.82 -0.38 2.03 -7.23 -11.79 -2.66 -30.52 -45.09 -16.802013 -3.45 -6.35 -0.53 -6.29 -6.69 -5.88 1.13 -0.22 2.49 -6.34 -11.45 -1.20 -28.53 -44.62 -13.082014 -3.55 -6.50 -0.58 -6.29 -6.69 -5.88 1.18 -0.19 2.56 -6.20 -11.41 -0.96 -28.22 -44.57 -12.542015 -3.61 -6.59 -0.60 -6.29 -6.69 -5.88 1.21 -0.18 2.60 -6.12 -11.37 -0.84 -28.06 -44.58 -12.26

Discussion 13
Results
Land Area Changes
These analyses show that coastal Louisiana has experienced a net land area change of approximately -4,833 km2 (modeled estimate: -5,197 +/- 443 km2) from 1932 to 2016 (fig. 2, table 1), roughly the size of the land area of the State of Delaware. This net change in land area amounts to a decrease of approximately 25 percent of the 1932 land area. Although this decrease in net land area is pervasive throughout much of the coast and the time period analyzed, the land area of recent data points (2013–16) is approximately equivalent and, in some cases, slightly greater than that of the 2010 estimate (Couvillion and others, 2011).
The model which best approximated the coastwide net land area change is similar to that of a third order polynomial (edf = 2.903) (R2=0.923) (fig. 2). Within these data, 2005 and 2008 land area data from hurricane-induced effects are evident as low outliers. Also evident is a perceived “stability” in coastwide net land area in recent years.
All basins, with the exception of Atchafalaya Delta Basin, have experienced a net decrease in wetland area during the period of observation (1932–2016) (fig. 3). In terms of total area, Terrebonne Basin has experienced the greatest decrease in wetland area (-1,302 km2 observed; -1,352 +/- 136 km2 modeled), followed by Barataria Basin (-1,120 km2 observed; -1,177 +/- 106 km2 modeled), Calcasieu-Sabine Basin (-517 km2 observed; -578 +/- 100 km2 modeled), Mermentau Basin (-488 km2 observed; -500 +/- 90 km2 modeled), Pontchartrain Basin (-472 km2 observed; -529 +/- 30 km2 modeled), Breton Sound Basin (-426 km2 observed; -489 +/- 49 km2 modeled), Mississippi River Delta Basin (-375 km2 observed; -401 +/- 75 km2 modeled), and Teche-Vermilion Basin (-149 km2 observed; -174 +/- 37 km2 modeled) (table 1). Atchafalaya Delta Basin experienced an increase (+16 km2 observed; +51 +/- 39 km2 modeled) in total land area across the entire period of record (table 1). As a percent of starting area, Mississippi River Delta Basin has experienced the greatest percentage decrease in wetland area (-55 percent observed; -57 percent modeled), followed by Breton Sound Basin (-38 percent observed; -43 percent modeled), Barataria Basin (-29 percent observed; -31 percent modeled), Terrebonne Basin (-29 percent observed; -30 percent modeled), Calcasieu-Sabine Basin (-24 percent observed; -27 percent modeled), Mermentau Basin (-20 percent observed and modeled), Pontchartrain Basin (-17 percent observed; -18 percent modeled), and Teche-Vermilion Basin (-10 percent observed; -12 percent modeled). Atchafalaya Delta Basin was the only basin to experience an increase (+3 percent observed; +9 percent modeled) in land area, as a percentage of starting area, across the entire period of record (table 1).
Change in Land Change Rates through Time
Trend analyses from model fits indicate that coastwide rates of wetland change have varied from -83.5 +/- 11.8 square kilometers per year to -28.01 +/- 16.37 square kilometers per year. Excluding the high rates of wetland loss due to the 2005 and 2008 hurricanes (Katrina, Rita, Gustav, and Ike), recent wetland loss rates have decreased from the peak loss rates observed in the 1970s which are known to have exceeded 80 square kilometers per year (km2/yr) (Britsch and Dunbar, 1993; Barras and others, 1994, 2003). This analysis indicates wetland change rates averaged -83 km2/yr during the 1973–78 time period, followed by a steady reduction in the rate since that time (fig. 4). Britsch and Dunbar (1993) and Barras and others (2008) observed a similar trend of decreasing loss after 1978.
The rate of wetland change in most basins has changed drastically over the period of record. Only two basins, Mermentau and Pontchartrain, were best fit by a linear model (edf = 1), suggesting that the rate of change has not changed significantly over the period of record in those basins (fig. 5). The remaining basins were best fit by non-linear functions. Barataria, Terrebonne, and Teche-Vermilion Basins follow a similar pattern to that of the coastwide trend of loss rates increasing to a peak in the late 1970s, followed by a reduction in loss rates since that time. In Breton Sound Basin, wetland loss rates have continued to increase and have only recently begun to suggest a decrease in that rate (fig. 5). Calcasieu-Sabine Basin experienced the highest rates of wetland loss prior to the 1970s, with rates slowly decreasing since that time, with the exception of hurricane-induced losses in 2005 and 2008. The Mississippi River Delta Basin experienced a reduction in wetland loss rate since the 1960s, reaching a point of wetland gain, only to be followed by a negative trend due to the effects of Hurricane Katrina in 2005 (Barras, 2006). Finally, the Atchafalaya Delta Basin experienced an increasing land area trend (positive land change slope) since 1961 (fig. 5). Prior to 1961, this basin was initially on a negative trajectory; however, following the opening of the Wax Lake Outlet in 1942, sediment deposition increased, and a subaerial active delta emerged after the flood of 1973.
Discussion The spatial and temporal patterns of wetland change
observed in this assessment reveal a dynamic landscape changing as a result of the complex and often interactive effects of natural and human-induced processes. Coastwide total net land area suggests an increase in land area by 2015 as compared to the previous estimate in 2010 (Couvillion and others, 2011); however, these values are well within the standard error associated with the datasets and, as such, are not necessarily indicative of a true change in the long-term trend. This increase in coastwide net land area may not yet

14 Land Area Change in Coastal Louisiana (1932 to 2016)
be interpreted as “gain” because the persistence of said areas has yet to be assessed and much of this may be interpreted as recovery from the ephemeral lows associated with the hurricanes of 2005 and 2008; however, specific areas of gain can be detected in the dataset, many of which are showing persistence throughout the newly added data points.
It is important to note that there is a difference between net land area change (figs. 2 and 3, table 1) and persistent losses and gains (mapped dataset) and long term trends (figs. 4 and 5, table 3). Classification of an area as “loss” or “gain” is dependent on persistence criteria, where the amount of area of persistent loss or gain for a particular period can be less than or greater than the net land area change for that period. This effect occurs because persistent losses in a particular location can be offset by transitory gains in another.
This analysis has fostered an ability to examine variability in rates of wetland change through time by fitting data with non-linear models. Most of the models fit the coastwide and basin-level land area change data well, with a couple of notable exceptions. In the Atchafalaya Delta Basin, a basin in which water levels are known to greatly influence assessments, the R2 of the model is 0.245 (fig. 3). Mississippi River Delta Basin, another basin in which water levels affect our ability to assess land area, also had one of the lower R2 values (R2 = 0.609) (fig. 3). The two Chenier Plain basins, Calcasieu-Sabine (R2 = 0.659) and Mermentau (R2 = 0.522), contain several water-control structures and are therefore also subject to variability. Barataria, Breton Sound, Pontchartrain, and Terrebonne Basins all have an R2 value at or exceeding 0.9.
This analysis has shown decreasing rates of wetland loss after the 1970s. The possible causes of this decline in land change rate are as numerous as the causes of wetland change itself. One of the first possible causes relates to the loss of wetlands. Trends have shown that as wetlands are lost, there are fewer wetlands remaining to be lost, and as such, the rate of wetland loss will decrease. Although there is still a substantial area of wetlands remaining, at some point the influence of this artifact should be considered. Similarly, many of the wetlands in the most precarious locations have already been lost. What remains are wetlands in less “at-risk” positions in the landscape which are consequently less vulnerable and contribute to this reduction in loss rate; however, even stable wetlands may be impacted by a single event or cumulative episodic events over time (Morton and Barras, 2011).
The lack of major storms since 2008 is likely the most influential factor causing the decrease in net loss rates. This period of relative calm has led to fewer disturbances in the form of wave energy, thereby reducing erosion-induced losses. The storm hiatus also allowed vegetation to colonize new areas of shallow water bodies or to reestablish once vegetated areas. Some of these areas may have begun life as FAV but may have since attached to the substrate (Russell, 1942).
Oil and gas extraction in the Louisiana coastal zone began in 1926 and peaked in 1969 (Ko and Day, 2004). Infrastructure, such as canals, pipelines, and other features,
contributes to wetland loss not only through direct removal of material but also by altering hydrologic flow. This altered hydrology can lead to indirect effects such as the propagation of wave energy and salinity into interior wetland areas. Following this peak, oil and gas activities started to move from the shallow wetland areas in one of two directions: inland or far offshore. As a result of this shift, Morton and others (2005) concluded that the decrease in the rate of land loss in Barataria Basin was attributable to a decrease in the rate of hydrocarbon production in that area after 1974.
Another contributing factor involves a reduction in tectonic activity and subsidence due to active faulting (Dokka, 2006; Kolker and others, 2011). The extent to which submergence due to natural versus anthropologically influenced subsidence is poorly understood. Regardless of the causes, some evidence is beginning to point toward a reduction in the rate of subsidence. Kolker and others (2011) observed a decrease in subsidence rates which corresponds with the decrease in the rate of wetland loss.
Finally, restoration activities, such as marsh creation and barrier island nourishments, can be observed in the datasets which constitute this analysis. Although these projects may have small effects in the coastwide total land area numbers, in specific areas, they have substantially changed the composition and configuration of the local landscape. These projects are in many cases building new land or sustaining existing land, again contributing to a reduction in loss rates. It is important to note that the effects of restoration projects are not always visible in the persistent change map because areas which were lost and then regained as a result of restoration do not meet the persistent change criteria.
ConclusionsThis assessment provides a comprehensive analysis
of historical trends and rates of land area change in coastal Louisiana from 1932 to 2016. The primary improvements over past efforts are an improved statistical analysis allowing for the observation of rates other than linear and the inclusion of additional datasets for assessing coastal wetland change since 2010 (Couvillion and others, 2011). This dataset provides the ability to better quantify the amount of wetland loss and the time period in which it was lost. This information will allow gradual loss patterns to be distinguished from losses due to episodic events such as hurricanes. The observed spatial and temporal patterns reveal a dynamic landscape changing as a result of the complex and often interactive effects of natural and human-induced processes.
The temporal frequency of land change provided by this study allows for further investigation of the causal mechanisms of the loss that has occurred. These investigations will provide improved information to develop tools to monitor ecosystems, forecast possible impacts, and plan protection and restoration activities. These data will support the development of strategies to adapt to our changing environment.
References Cited 15
While recent trends have shown a reduction in the rate of wetland loss, it is important to note that past trends are not necessarily indicative of future change. Future disturbance events such as a major hurricane impact could change the trajectory of the rates. Sea-level rise is projected to increase at an exponential rate, and that would also expedite the rate of wetland loss. (IPCC, 2013; Doyle and others, 2015).
References Cited
Barras, J.A., 2006, Land area change in coastal Louisiana after the 2005 hurricanes—A series of three maps: U.S. Geological Survey Open-File Report 2006–1274.
Barras, J.A., Bernier, J.C., and Morton, R.A., 2008, Land area change in coastal Louisiana—A multidecadal perspective (from 1956 to 2006): U.S. Geological Survey Scientific Investigations Map 3019, scale 1:250,000, 14 p. pamphlet. [Also available at http://pubs.usgs.gov/sim/3019/.]
Barras, J.A., Bourgeois, P.E., and Handley, L.R., 1994, Land loss in coastal Louisiana, 1956–1990: Lafayette, La., National Biological Survey, National Wetlands Research Center Open-File Report 94-01.
Bernier, J.C., Morton, R.A., and Barras, J.A., 2006, Constraining rates and trends of historical wetland loss, Mississippi River delta plain, south-central Louisiana, in Xu, Y.J., and Singh, V.P., eds., Coastal environment and water quality, proceedings of the AIH 25th Anniversary Meeting and International Conference Challenges in Coastal Hydrology and Water Quality: Highlands Ranch, Colo., Water Resources Publications, LLC, p. 371–373.
Britsch, L.D., and Dunbar, J.B., 1993, Land-loss rates—Louisiana coastal plain: Journal of Coastal Research, v. 9, p. 324–338.
Couvillion, B.R., Barras, J.A., Steyer, G.D., Sleavin, W., Fischer, M., Beck, H., Trahan, N., Griffin, B., and Heckman, D., 2011, Land area change in coastal Louisiana from 1932 to 2010: U.S. Geological Survey Scientific Investigations Map 3164, scale 1:265,000, 12 p. pamphlet.
Costanza, R.; P´erez-Maqueo, O.; Martinez, M.L.; Sutton, P.; Anderson, S.J., and Mulder, K., 2008. The value of coastal wetlands for hurricane protection. Ambio, 37, 241–248.
Dokka, R.K., 2006, Modern-day tectonic subsidence in coastal Louisiana: Geology, v. 34, no. 4, p. 281–284, doi:10.1130/G22264.1.
Doyle, T.W., Chivoiu, Bogdan, and Enwright, N.M., 2015, Sea-level rise modeling handbook—Resource guide for coastal land managers, engineers, and scientists: U.S. Geological Survey Professional Paper 1815, 76 p., http://dx.doi.org/10.3133/pp1815.
Dunbar, J.B., Britsch, L.D., and Kemp, E., III, 1990, Land loss rates. Report 2. Louisiana Chenier Plain: Vicksburg, Miss., Army Engineer Waterways Experiment Station Geotechnical Lab 2, 38 p., http://www.dtic.mil/cgi-bin/GetTRDoc?Location=U2&doc=GetTRDoc.pdf&AD=ADA229640.
Dunbar, J., Britsch, L., and Kemp, E.B., 1992, Land loss rates. Report 3. Louisiana Coastal Plain: Vicksburg, Miss., Army Engineer Waterways Experiment Station Geotechnical Lab 3, 66 p., http://www.dtic.mil/cgi-bin/GetTRDoc?Location=U2&doc=GetTRDoc.pdf&AD=ADA256591.
Feagin, R.A.; Mukherjee, N.; Shanker, K.; Baird, A.H.; Cinner, J.; Kerr, A.M.; Koedam, N.; Sridhar, A.; Arthur, R.; Jayatissa, L.P.; Lo Seen, D.; Menon, M.; Rodriguez, S.; Shamsuddoha, M., and Dahdouh-Guebas, F., 2010. Shelter from the storm? Use and misuse of coastal vegetation bioshields for managing natural disasters. Conservation Letters, 3, 1–11.
Fisk, H.N., and McFarlan, E., Jr., 1955, Late Quaternary deltaic deposits of the Mississippi River, in Poldervaart, A., ed., Crust of the Earth: Geological Society of America Special Paper 62, p. 279–302.
Gedan, K.B.; Kirwan, M.L.; Wolanski, E.; Barbier, E.B., and Silliaman, B.R., 2011. The present and future role of coastal wetland vegetation in protecting shorelines: answering recent challenges to the paradigm. Climatic Change, 106(1), 7–29.
Hexagon Geospatial, 2016, ERDAS IMAGINE: Norcross, Ga., Hexagon Geospatial web page, accessed April 25, 2017, at http://www.hexagongeospatial.com/.
Intergovernmental Panel on Climate Change (IPCC)—Stocker, T.F., Qin, D., Plattner, G.K., Tignor, M., Allen, S.K., Boschung, J., Nauels, A., Xia, Y., Bex, V., and Midgley, P.M., 2013, Climate change 2013—The physical science basis: Contribution of working group I to the Fifth Assessment Report of the Intergovernmental Panel on Climate Change, Cambridge, U.K., and New York.
Kesel, R.H., and others, 1992, An approximation of the sediment budget of the lower Mississippi River prior to major human modification: Earth Surface Processes and Landforms, v. 17, p. 711.
Ko, J.Y., and Day, J.W., 2004, A review of ecological impacts of oil and gas development on coastal ecosystems in the Mississippi Delta: Ocean & Coastal Management, v. 47, no. 11, p. 597–623.
Kolker, A.S., Allison, M.A., and Hameed, S., 2011, An evaluation of subsidence rates and sea-level variability in the northern Gulf of Mexico: Geophysical Research Letters, v. 38, L21404, doi:10.1029/2011GL049458.

16 Land Area Change in Coastal Louisiana (1932 to 2016)
Louisiana Coastal Wetlands Planning, Protection and Restoration Act Program, n.d., Coastal Louisiana basins: Louisiana Coastal Wetlands Planning, Protection and Restoration Act Program website, accessed May 5, 2011, at http://lacoast.gov/new/About/Basins.aspx.
Meade, R.H., Yuzyk, T.R., and Day, T.J., 1990, Movement and storage of sediment in rivers of the United States and Canada, in Wolman, M.G., and Riggs, H.C., eds., Surface water hydrology: Geological Society of America, Geology of North America Series, v. 0-1, p. 255–280.
Morton, R.A., Bernier, J.C., Barras, J.A., and Fernia, N.F., 2005, Rapid subsidence and historical wetland loss in the Mississippi Delta Plain, likely causes and future implications: U.S. Geological Survey Open-File Report 2005–1216, 124 p. [Also available at http://pubs.usgs.gov/of/2005/1216/.]
Morton, R.A. and J. A. Barras (2011) Hurricane Impacts on Coastal Wetlands: A Half-Century Record of Storm-Generated Features from Southern Louisiana. Journal of Coastal Research: Volume 27, Issue 6A: pp. 27 – 43.
National Oceanic and Atmospheric Administration (NOAA), 2010. Annual Commercial Landing Statistics. http://www.st.nmfs.noaa.gov/st1/commercial/landings/annual_landings.html.
Penland, S., Wayne, L., Britsch, L.D., Williams, S.J., Beall, A.D., and Butterworth, V.C., 2001, Geomorphic classification of coastal land loss between 1932 and 1990 in the Mississippi River Delta Plain, southeastern Louisiana: U.S. Geological Survey Open-File Report 00-417.
R Core Team, 2014, R—A language and environment for statistical computing: Vienna, Austria, R Foundation for Statistical Computing web page, accessed September 22, 2016, at http://www.R-project.org/.
Russell, R.J., 1942, Flotant: Geographical Review, v. 32, no. 1, p. 74–98. [Also available at http://www.jstor.org/stable/210360.]
Simpson, G., 2016, derivSimulCI.R: GitHub Repository, accessed September 22, 2016, at https://gist.github.com/gavinsimpson/ca18c9c789ef5237dbc6.
Twilley, R.R., 2007. Coastal Wetlands and Global Climate Change: Gulf Coast Wetland Sustainability in a Changing Climate. Arlington, Virginia: Pew Center on Global Climate.
Wood, S.N., 2000, Modelling and smoothing parameter estimation with multiple quadratic penalties: Journal of the Royal Statistical Society Series B, v. 62, no. 2, p. 413–428.
Xu, H., 2005, Using the improved normalized difference water index (MNDWI) to extract water body information research: International Journal of Remote Sensing, v. 9, p. 589–595.
Xu, H., 2006, Modification of normalised difference water index (NDWI) to enhance open water features in remotely sensed imagery: International Journal of Remote Sensing, v. 27, no. 14, p. 3025–3033.
Publishing support provided by Lafayette Publishing Service Center
For more information concerning this publication contact: Director, USGS, Wetland and Aquatic Research Center 700 Cajundome Blvd. Lafayette, LA 70506 https://www.usgs.gov/centers/wetland-and-aquatic-research-center-warc


30°0'
93°30'
30°0'
93°0'
30°0'
92°30'
92°0'
30°0'
91°30'
91°0'
90°30'
30°0'
90°0'
30°0'
89°30'
30°0'
89°0'
29°30'N
89°30'
90°0'
29°30'
90°30'
91°0'
29°30'
91°30'
29°30'
92°0'92°30'
93°0'
29°0'
29°0'
89°0'
New Orleans
MISSISSIPPI
LOUISIANA
TEXASLOUIS
IANA
Cameron
Lake Pontchartrain
Big Mar
Lake Maurepas
Lake Salvador
Barataria Bay
Timbalier Bay
Terrebonne Bay
Caillou Lake
Lake Mechant
Lake Boudreaux
Little Lake
Atchafalaya Bay
GULF OF MEXICO
Lake Cataouatche
Atchaf
alay
a Ri
ver
Lake
Borg
ne
East Cote Blanche Bay
West Cote Blanche Bay
Vermilion Bay
White Lake
Grand Lake
CalcasieuLake
Black Lake
Fres
hwat
er B
ayou
Wax
Lak
e Out
let
MarshIsland
Lak
e Po
ntch
artra
in C
ause
way
Gulf Intracoastal Waterway
Gulf Intracoastal Waterway
Gulf Intracoastal W
aterway
Mississippi River-Gulf Outlet Canal
Mississippi River
Mississippi River
South
west P
ass
South Pass
Pass a Loutre
East Bay
West Bay
GardenIsland
Bay
Bayou Lafourche
Labranche wetlands
Calcasieu Ship C
hannel
Sweet Lake
Breton Sound
LakeFelicity
GULF OF MEXICO
GULF OF M
EXICO
Chandeleur Sound
Chandeleur Islands
Lac des Allemands
GULF OF MEXICO
Hackberry
Johnsons Bayou Grand Chenier
Wax Lake Delta
Atchafalaya Delta
IntracoastalCity
PecanIsland
Houma
GoldenMeadow
PortFourchon
Montegut
Dulac
Theriot
Amelia
Lake Verret
Lake Palourde
The Pen
Redfish Bay
BlindBay
QuarantineBay
AdamsBay
BastianBay
Lost LakeFour League
Bay
Bayou Perot
Bayou Rigolettes
GrandLake
Lake De Cade
LakeSaint
Catherine
SabineLake
Mermentau Basin
Lake Lery
Calcasieu-Sabine Basin
Teche-Vermilion Basin
Atchafalaya Delta Basin
Terrebonne Basin
Barataria Basin
Breton SoundBasin
PontchartrainBasin
Couvillion and others—Land A
rea Change in Coastal Louisiana (1932 to 2016)—Scientific Investigations M
ap 3381
ISBN 978-1-4113-4151-7
9 7 8 1 4 1 1 3 4 1 5 1 7
ISSN 2329-1311 (print) ISSN 2329-132X (online)https://doi.org/10.3133/sim3381


![2012 Louisiana Coastal Master Plan [1]](https://img.pdfslide.us/doc/110x75/553390a94a79599f5e8b497e/2012-louisiana-coastal-master-plan-1.jpg)