Embed Size (px)
Citation preview
Geophysical Survey Report
Lancaster University Turbines
for
Oxford Archaeology North
January 2010
Job Number 2678
Robbie Austrums
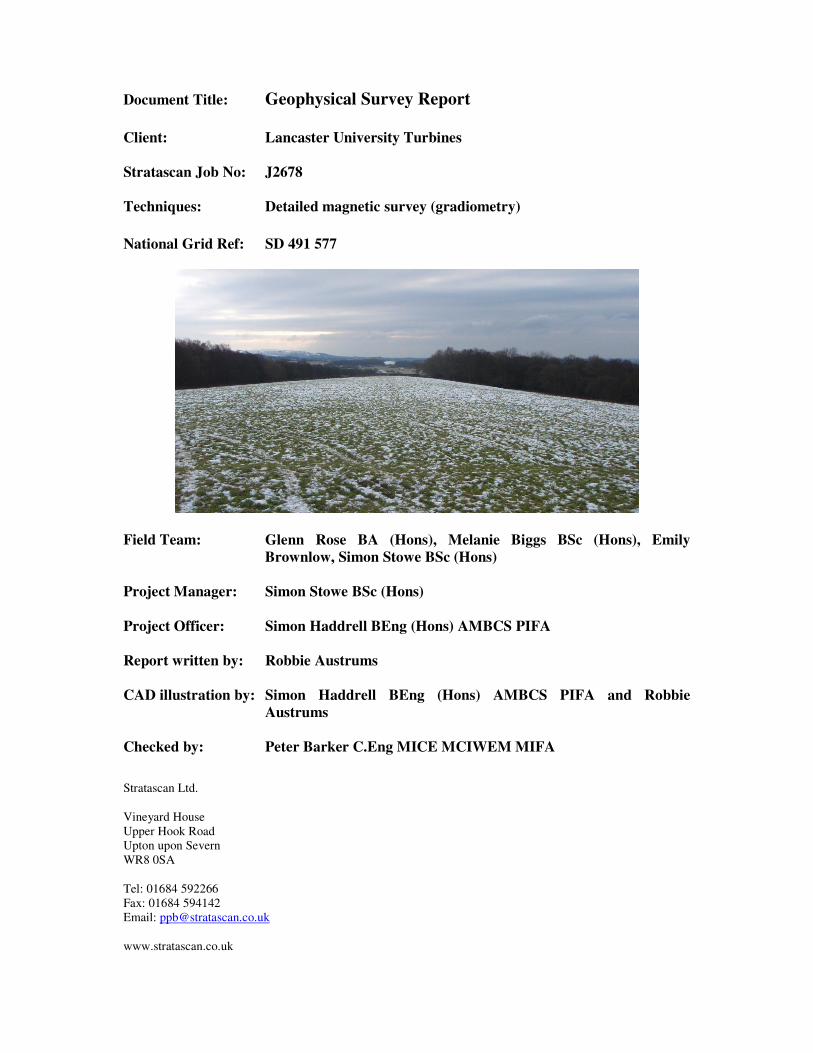
Document Title: Geophysical Survey Report
Client: Lancaster University Turbines
Stratascan Job No: J2678
Techniques: Detailed magnetic survey (gradiometry)
National Grid Ref: SD 491 577
Field Team: Glenn Rose BA (Hons), Melanie Biggs BSc (Hons), Emily
Brownlow, Simon Stowe BSc (Hons)
Project Manager: Simon Stowe BSc (Hons)
Project Officer: Simon Haddrell BEng (Hons) AMBCS PIFA
Report written by: Robbie Austrums
CAD illustration by: Simon Haddrell BEng (Hons) AMBCS PIFA and Robbie
Austrums
Checked by: Peter Barker C.Eng MICE MCIWEM MIFA Stratascan Ltd.
Vineyard House
Upper Hook Road
Upton upon Severn
WR8 0SA
Tel: 01684 592266
Fax: 01684 594142
Email: [email protected]
www.stratascan.co.uk

Oxford Archaeology North
Geophysical Survey
Lancaster University Turbines January 2009
Stratascan Page No. 1
1 SUMMARY OF RESULTS............................................................................................3
2 INTRODUCTION ..........................................................................................................3
2.1 Background synopsis ..............................................................................................3
2.2 Site location ............................................................................................................3
2.3 Description of site ...................................................................................................3
2.4 Geology and soils....................................................................................................3
2.5 Site history and archaeological potential .................................................................4
2.6 Survey objectives ....................................................................................................4
2.7 Survey methods.......................................................................................................4
3 METHODOLOGY .........................................................................................................4
3.1 Date of fieldwork ....................................................................................................4
3.2 Grid locations..........................................................................................................5
3.3 Survey equipment ...................................................................................................5
3.4 Sampling interval, depth of scan, resolution and data capture ..................................6
3.4.1 Sampling interval ............................................................................................6
3.4.2 Depth of scan and resolution ...........................................................................6
3.4.3 Data capture ....................................................................................................6
3.5 Processing, presentation of results and interpretation...............................................6
3.5.1 Processing .......................................................................................................6
3.5.2 Presentation of results and interpretation .........................................................7
4 RESULTS ......................................................................................................................7
5 CONCLUSION ..............................................................................................................8
APPENDIX A – Basic principles of magnetic survey .........................................................9
APPENDIX B – Glossary of magnetic anomalies .............................................................10
Oxford Archaeology North
Geophysical Survey
Lancaster University Turbines January 2009
Stratascan Page No. 2
LIST OF FIGURES
Figure 1 1:50 000 General location plan
Figure 2 1:4000 Site plan showing location of grids and referencing
Figure 3 1:1000 Plot of raw magnetometer data – Viewport 1
Figure 4 1:1000 Colour plot showing strong values – Viewport 1
Figure 5 1:1000 Plot of processed magnetometer data – Viewport 1
Figure 6 1:1000 Abstraction and interpretation of magnetometer anomalies –
Viewport 1
Figure 7 1:1000 Plot of raw magnetometer data – Viewport 2
Figure 8 1:1000 Colour plot showing strong values – Viewport 2
Figure 9 1:1000 Plot of processed magnetometer data – Viewport 2
Figure 10 1:1000 Abstraction and interpretation of magnetometer anomalies –
Viewport 2
Figure 11 1:1000 Plot of raw magnetometer data – Viewport 3
Figure 12 1:1000 Colour plot showing strong values – Viewport 3
Figure 13 1:1000 Plot of processed magnetometer data – Viewport 3
Figure 14 1:1000 Abstraction and interpretation of magnetometer anomalies –
Viewport 3
Figure 15 1:1000 Plot of raw magnetometer data – Viewport 4
Figure 16 1:1000 Colour plot showing strong values – Viewport 4
Figure 17 1:1000 Plot of processed magnetometer data – Viewport 4
Figure 18 1:1000 Abstraction and interpretation of magnetometer anomalies –
Viewport 4
Figure 19 1:1000 Plot of raw magnetometer data – Viewport 5
Figure 20 1:1000 Colour plot showing strong values – Viewport 5
Figure 21 1:1000 Plot of processed magnetometer data – Viewport 5
Figure 22 1:1000 Abstraction and interpretation of magnetometer anomalies –
Viewport 5
Figure 23 1:1000 Plot of raw magnetometer data – Viewport 6
Figure 24 1:1000 Colour plot showing strong values – Viewport 6
Figure 25 1:1000 Plot of processed magnetometer data – Viewport 6
Figure 26 1:1000 Abstraction and interpretation of magnetometer anomalies –
Viewport 6
Figure 27 1:4000 Plot of processed magnetometer data – Overview
Figure 28 1:4000 Abstraction and interpretation of magnetometer anomalies –
Overview

Oxford Archaeology North
Geophysical Survey
Lancaster University Turbines January 2009
Stratascan Page No. 3
1 SUMMARY OF RESULTS
Stratascan were commissioned by Oxford Archaeology North to undertake a magnetic
gradiometer survey of an area outlined for development as a wind farm. The site
comprises approximately 20.4ha of pasture beside the M6 motorway, opposite the
Lancaster University, at OS ref. SD 490 575.
The survey results appear to be dominated by modern activity with construction related
anomalies in the north and agricultural in the central region. The southern part of the
survey shows more of potential archaeological interest with two possible enclosures and
one possible thermoremanent feature which may represent a former kiln or other intense
fire; these anomalies are all of unknown date and may warrant further investigation. A
general scatter of possible pits may also be considered for sampling.
2 INTRODUCTION
2.1 Background synopsis
Stratascan were commissioned by Oxford Archaeology North to undertake a
geophysical survey of an area outlined for development as a wind farm. This survey
forms part of an archaeological investigation being undertaken by Oxford Archaeology
North.
2.2 Site location
The site is located beside the M6 motorway, opposite the Lancaster University, at OS
ref. SD 490 575.
2.3 Description of site
The survey area comprises approximately 20.4ha of gently undulating pasture.
2.4 Geology and soils
The underlying geology is Namurian “Millstone Grit Series” (British Geological Survey
South Sheet, Fourth Edition Solid, 2001); this is overlain by Quaternary boulder clay
and morainic drift deposits (Institute of Geological Sciences, 1977).
The overlying soils are known as Brickfield 2 which are typical cambic stagnogley
soils. These consist of slowly permeable seasonally waterlogged fine loamy soils (Soil
Survey of England and Wales, Sheet 1 Northern England).

Oxford Archaeology North
Geophysical Survey
Lancaster University Turbines January 2009
Stratascan Page No. 4
2.5 Site history and archaeological potential
A desk-based assessment prepared by Oxford Archaeology North (Blythe, 2009) was
made available to Stratascan and provides the following information.
There is some evidence of Bronze Age activity in the locality of the survey area. A
Bronze Age axe has been found approximately 50m outside the south-east end of the
survey area at NGR SD 4928 5711. A log boat was discovered during works on Blea
Tarn Reservoir approximately 600m north of the survey area. A flint scatter has been
recorded at Galgate approximately 2km south-south-west of the survey area. There may
therefore be a reasonable chance of Bronze Age activity within the area.
No evidence of Iron Age activity is known.
A Romano-British settlement has been excavated approximately 1km south-west of the
survey area, and a Roman road is thought to have passed near to its eastern boundary.
Medieval remains in the region include an area of ridge-and-furrow approximately
500m south-east of the survey area and a medieval field system approximately 500m
west of the southern tip of the survey area.
The area appears to have been enclosed between 1806 and 1841. Since that time, the
area has seen some changes to field boundaries as well as the infilling of a few pits and
ponds.
2.6 Survey objectives
The objective of the survey was to locate any features of possible archaeological
significance in order that they may be assessed prior to development.
2.7 Survey methods
Detailed magnetic survey (gradiometry) was used as an efficient and effective method
of locating archaeological anomalies. More information regarding this technique is
included in the Methodology section below.
3 METHODOLOGY
3.1 Date of fieldwork
The fieldwork was carried out over 7 days between the 5th
and the 12th
January. Weather
conditions during the survey were cold, dry and sunny, with snow lying on the ground.
Oxford Archaeology North
Geophysical Survey
Lancaster University Turbines January 2009
Stratascan Page No. 5
3.2 Grid locations
The location of the survey grids has been plotted in Figure 2 together with the
referencing information.
The location of the survey grids is based on the Ordnance Survey National Grid, see
Figure 2. The referencing and alignment of grids was achieved using a Leica DGPS
System 500.
A DGPS (differential Global Positioning System) can locate a point on the ground to a
far greater accuracy than a standard GPS unit. A standard GPS suffers from errors
created by satellite orbit errors, clock errors and atmospheric interference, resulting in
an accuracy of 5m-10m. Calculations to correct for these errors are performed at an
accurately located base station. The base station then transmits the corrections which are
received by DGPS consoles giving sub metre accuracy averaging around 0.5m error.
3.3 Survey equipment
Although the changes in the magnetic field resulting from differing features in the soil
are usually weak, changes as small as 0.2 nanoTesla (nT) in an overall field strength of
48,000nT, can be accurately detected using an appropriate instrument.
The mapping of the anomaly in a systematic manner will allow an estimate of the type
of material present beneath the surface. Strong magnetic anomalies will be generated by
buried iron-based objects or by kilns or hearths. More subtle anomalies such as pits and
ditches can be seen if they contain more humic material which is normally rich in
magnetic iron oxides when compared with the subsoil.
To illustrate this point, the cutting and subsequent silting or backfilling of a ditch may
result in a larger volume of weakly magnetic material being accumulated in the trench
compared to the undisturbed subsoil. A weak magnetic anomaly should therefore appear
in plan along the line of the ditch.
The magnetic survey was carried out using a dual sensor Grad601-2 Magnetic
Gradiometer manufactured by Bartington Instruments Ltd. The instrument consists of
two fluxgates very accurately aligned to nullify the effects of the Earth's magnetic field.
Readings relate to the difference in localised magnetic anomalies compared with the
general magnetic background. The Grad601-2 consists of two high stability fluxgate
gradiometers suspended on a single frame. Each gradiometer has a 1m separation
between the sensing elements so enhancing the response to weak anomalies.

Oxford Archaeology North
Geophysical Survey
Lancaster University Turbines January 2009
Stratascan Page No. 6
3.4 Sampling interval, depth of scan, resolution and data capture
3.4.1 Sampling interval
Readings were taken at 0.25m centres along traverses 1m apart. This equates to 3600
sampling points in a full 30m x 30m grid.
3.4.2 Depth of scan and resolution
The Grad 601 has a typical depth of penetration of 0.5m to 1.0m. This would be
increased if strongly magnetic objects have been buried in the site. The collection of
data at 0.5m centres provides an optimum methodology for the task balancing cost and
time with resolution.
3.4.3 Data capture
The readings are logged consecutively into the data logger which in turn is daily down-
loaded into a portable computer whilst on site. At the end of each job, data is transferred
to the office for processing and presentation.
3.5 Processing, presentation of results and interpretation
3.5.1 Processing
Processing is performed using specialist software known as Geoplot 3. This can
emphasise various aspects contained within the data but which are often not easily seen
in the raw data. Basic processing of the magnetic data involves 'flattening' the
background levels with respect to adjacent traverses and adjacent grids. Once the basic
processing has flattened the background it is then possible to carry out further
processing which may include low pass filtering to reduce 'noise' in the data and hence
emphasise the archaeological or man-made anomalies.
The following schedule shows the basic processing carried out on all processed
gradiometer data used in this report:
1. Zero mean traverse (sets the background mean of each traverse within a grid
to zero and is useful for removing striping effects)
Geoplot parameters:
Least mean square fit = off
Oxford Archaeology North
Geophysical Survey
Lancaster University Turbines January 2009
Stratascan Page No. 7
2. Destagger (shifts adjacent traverses to correct staggered anomalies
produced during zigzag surveying)
Geoplot parameters:
various
3.5.2 Presentation of results and interpretation
The presentation of the data for each site involves a print-out of the raw data as
greyscale (Figures 3, 7, 11, 15, 19 & 23), together with a colour plots showing strong
values (Figures 4, 8, 12, 16, 20 & 24) and a greyscale plot of the processed data
(Figures 5, 9, 13, 17, 21 & 25). Magnetic anomalies have been identified and plotted
onto the 'Abstraction and Interpretation of Anomalies' drawing for the site (Figures 6,
10, 14, 18, 22 & 26).
4 RESULTS
(Letters in bold refer to labels on interpretation plots).
The results appear to be dominated by modern agricultural and ferrous anomalies, with
only a few anomalies of potential archaeological interest, mainly towards the south of
the survey.
The northern part of the survey contains a large number of strong responses. Some of
these are linear (A) and represent modern pipes or cables, others are scattered (B) and
probably indicate modern debris related to the construction of the meteorological
station.
The central area is dominated by parallel straight linear anomalies (C) which are most
likely to have been produced by ploughing. The area is currently under pasture so these
anomalies represent past activity; however, the straightness and close spacing of the
anomalies is consistent with modern agriculture and they are perhaps best interpreted as
having a modern origin.
Towards the south of the central area is a moderate strength discrete bipolar anomaly
(D) which may represent a thermoremanent feature, this could therefore be the site of an
intense fire such as a furnace or kiln. A linear positive anomaly (E) across the thinnest
section of the survey probably represents a former field boundary.
The southernmost quarter of the survey contains a greater number of potentially
significant anomalies. Of particular interest are two sets of broad weak positive
anomalies (F) which may represent small enclosures of unknown date. Parallel
agricultural anomalies (G) associated with these appear slightly curved and which may
indicate an older date than similar anomalies elsewhere. A set of curving linear
anomalies (H) radiating from the field boundary may represent tracks emerging from a
Oxford Archaeology North
Geophysical Survey
Lancaster University Turbines January 2009
Stratascan Page No. 8
former field entry point; however the form is also similar to some natural (geological or
pedological) anomalies.
A number of positive discrete anomalies are found scattered over the entire survey.
These may represent pits of potential archaeological significance. A scatter of strong
bipolar anomalies represents iron objects; these are of possible archaeological
significance, but are more likely to be modern.
5 CONCLUSION
The survey results appear to be dominated by modern activity with construction related
anomalies in the north and agricultural in the central region. The southern part of the
survey shows more of potential archaeological interest with two possible enclosures and
one possible thermoremanent feature which may represent a former kiln or other intense
fire; these anomalies are all of unknown date and may warrant further investigation. A
general scatter of possible pits may also be worth sampling.
6 REFERENCES
Blythe, K, 2009. Lancaster University Wind Turbine Development, Lancaster,
Lancashire: Archaeological Desk-Based Assessment. Oxford Archaeology North, Job
Number L10186
British Geological Survey, 2001. Geological Survey Ten Mile Map, South Sheet, Fourth
Edition (Solid). British Geological Society.
Institute of Geological Sciences, 1977. Geological Survey Ten Mile Map, South Sheet,
First Edition (Quaternary). Institute of Geological Sciences.
Soil Survey of England and Wales, 1983. Soils of England and Wales, Sheet 1 Northern
England. Soil Survey of England and Wales

Oxford Archaeology North
Geophysical Survey
Lancaster University Turbines January 2009
Stratascan Page No. 9
APPENDIX A – Basic principles of magnetic survey
Detailed magnetic survey can be used to effectively define areas of past human activity
by mapping spatial variation and contrast in the magnetic properties of soil, subsoil and
bedrock.
Weakly magnetic iron minerals are always present within the soil and areas of
enhancement relate to increases in magnetic susceptibility and permanently magnetised
thermoremanent material.
Magnetic susceptibility relates to the induced magnetism of a material when in the
presence of a magnetic field. This magnetism can be considered as effectively
permanent as it exists within the Earth’s magnetic field. Magnetic susceptibility can
become enhanced due to burning and complex biological or fermentation processes.
Thermoremanence is a permanent magnetism acquired by iron minerals that, after
heating to a specific temperature known as the Curie Point, are effectively demagnetised
followed by re-magnetisation by the Earth’s magnetic field on cooling.
Thermoremanent archaeological features can include hearths and kilns and material
such as brick and tile may be magnetised through the same process.
Silting and deliberate infilling of ditches and pits with magnetically enhanced soil
creates a relative contrast against the much lower levels of magnetism within the subsoil
into which the feature is cut. Systematic mapping of magnetic anomalies will produce
linear and discrete areas of enhancement allowing assessment and characterisation of
subsurface features. Material such as subsoil and non-magnetic bedrock used to create
former earthworks and walls may be mapped as areas of lower enhancement compared
to surrounding soils.
Magnetic survey is carried out using a fluxgate gradiometer which is a passive
instrument consisting of two sensors mounted vertically either 0.5 or 1m apart. The
instrument is carried about 30cm above the ground surface and the top sensor measures
the Earth’s magnetic field whilst the lower sensor measures the same field but is also
more affected by any localised buried field. The difference between the two sensors will
relate to the strength of a magnetic field created by a buried feature, if no field is present
the difference will be close to zero as the magnetic field measured by both sensors will
be the same.
Factors affecting the magnetic survey may include soil type, local geology, previous
human activity, disturbance from modern services etc.
Oxford Archaeology North
Geophysical Survey
Lancaster University Turbines January 2009
Stratascan Page No. 10
APPENDIX B – Glossary of magnetic anomalies
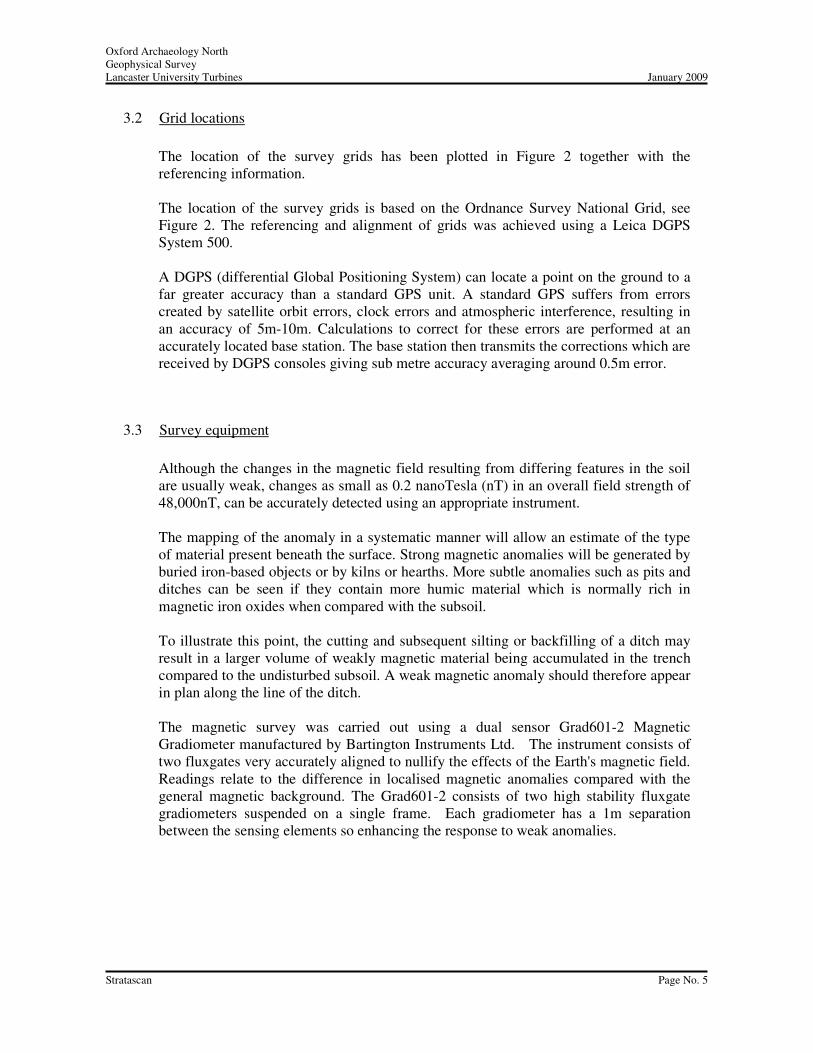
Bipolar
A bipolar anomaly is one that is composed of both a positive
response and a negative response. It can be made up of any number
of positive responses and negative responses. For example a pipeline
consisting of alternating positive and negative anomalies is said to
be bipolar. See also dipolar which has only one area of each polarity.
The interpretation of the anomaly will depend on the magnitude of
the magnetic field strength. A weak response may be caused by a
clay field drain while a strong response will probably be caused by a
metallic service.
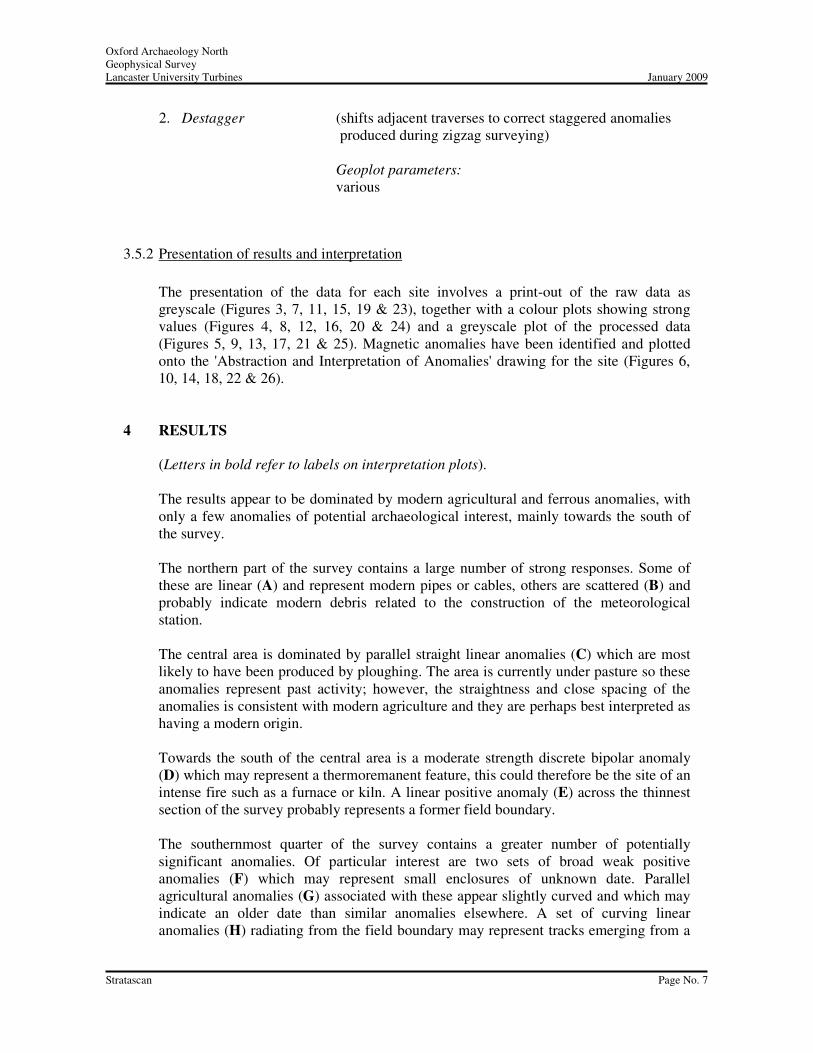
Dipolar
This consists of a single positive anomaly with an associated
negative response. There should be no separation between the two
polarities of response. These responses will be created by a single
feature. The interpretation of the anomaly will depend on the
magnitude of the magnetic measurements. A very strong anomaly is
likely to be caused by a ferrous object.
Positive anomaly with associated negative response
See bipolar and dipolar.
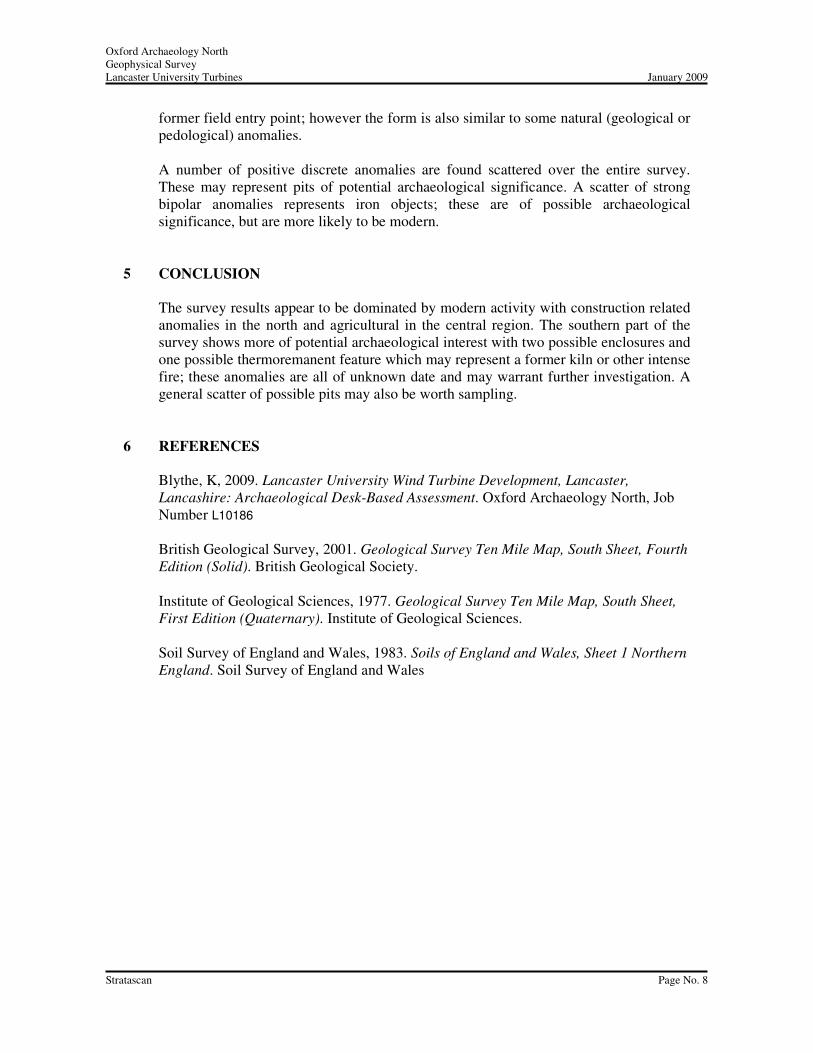
Positive linear
A linear response which is entirely positive in polarity. These are
usually related to infilled cut features where the fill material is
magnetically enhanced compared to the surrounding matrix. They
can be caused by ditches of an archaeological origin, but also former
field boundaries, ploughing activity and some may even have a
natural origin.
Oxford Archaeology North
Geophysical Survey
Lancaster University Turbines January 2009
Stratascan Page No. 11
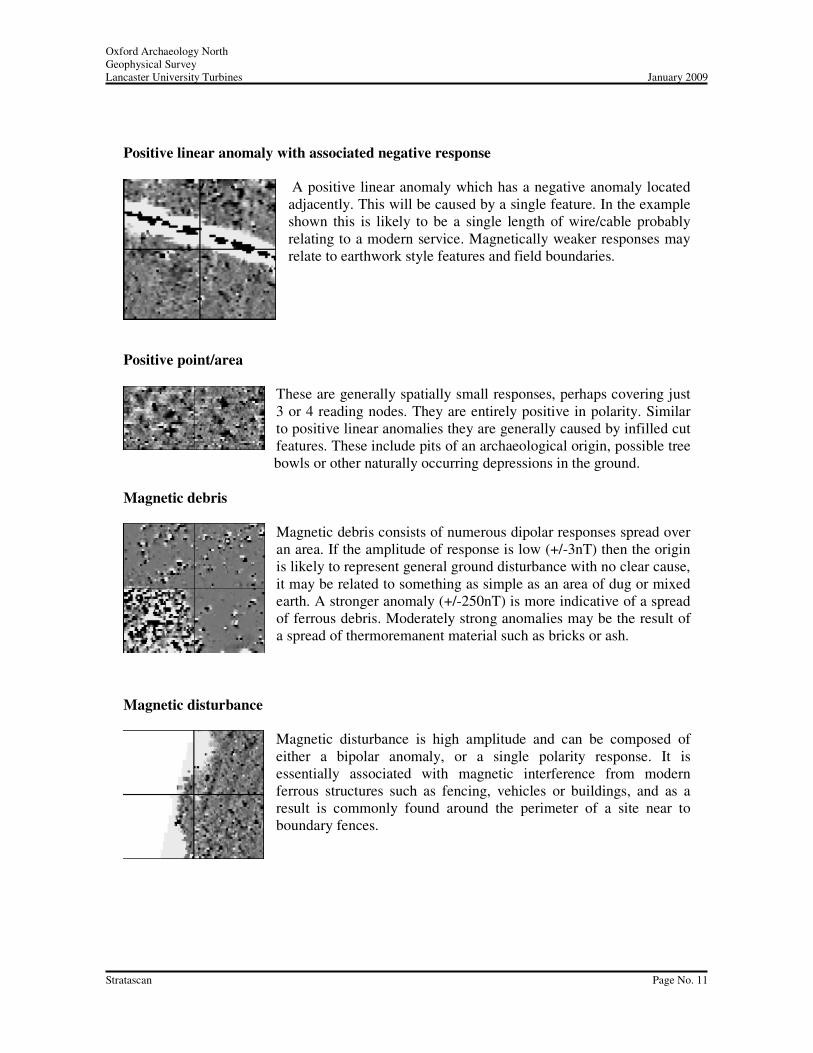
Positive linear anomaly with associated negative response
A positive linear anomaly which has a negative anomaly located
adjacently. This will be caused by a single feature. In the example
shown this is likely to be a single length of wire/cable probably
relating to a modern service. Magnetically weaker responses may
relate to earthwork style features and field boundaries.
Positive point/area
These are generally spatially small responses, perhaps covering just
3 or 4 reading nodes. They are entirely positive in polarity. Similar
to positive linear anomalies they are generally caused by infilled cut
features. These include pits of an archaeological origin, possible tree
bowls or other naturally occurring depressions in the ground.
Magnetic debris
Magnetic debris consists of numerous dipolar responses spread over
an area. If the amplitude of response is low (+/-3nT) then the origin
is likely to represent general ground disturbance with no clear cause,
it may be related to something as simple as an area of dug or mixed
earth. A stronger anomaly (+/-250nT) is more indicative of a spread
of ferrous debris. Moderately strong anomalies may be the result of
a spread of thermoremanent material such as bricks or ash.
Magnetic disturbance
Magnetic disturbance is high amplitude and can be composed of
either a bipolar anomaly, or a single polarity response. It is
essentially associated with magnetic interference from modern
ferrous structures such as fencing, vehicles or buildings, and as a
result is commonly found around the perimeter of a site near to
boundary fences.
Oxford Archaeology North
Geophysical Survey
Lancaster University Turbines January 2009
Stratascan Page No. 12
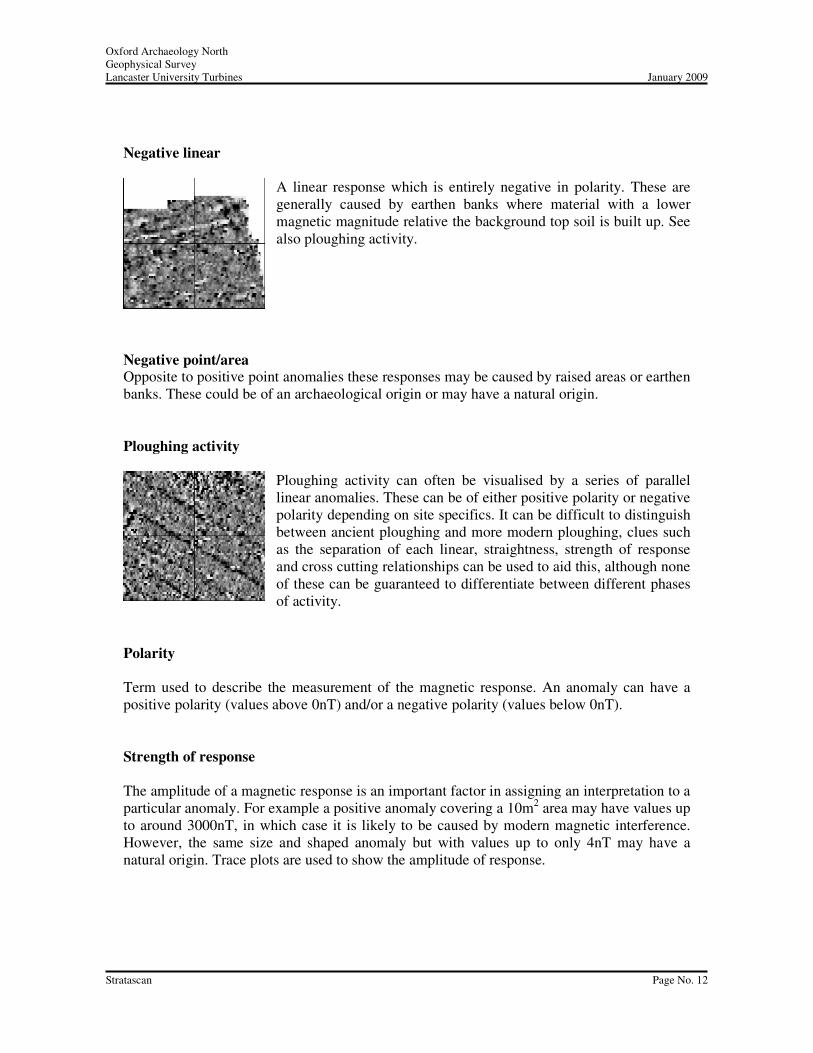
Negative linear
A linear response which is entirely negative in polarity. These are
generally caused by earthen banks where material with a lower
magnetic magnitude relative the background top soil is built up. See
also ploughing activity.
Negative point/area Opposite to positive point anomalies these responses may be caused by raised areas or earthen
banks. These could be of an archaeological origin or may have a natural origin.
Ploughing activity
Ploughing activity can often be visualised by a series of parallel
linear anomalies. These can be of either positive polarity or negative
polarity depending on site specifics. It can be difficult to distinguish
between ancient ploughing and more modern ploughing, clues such
as the separation of each linear, straightness, strength of response
and cross cutting relationships can be used to aid this, although none
of these can be guaranteed to differentiate between different phases
of activity.
Polarity
Term used to describe the measurement of the magnetic response. An anomaly can have a
positive polarity (values above 0nT) and/or a negative polarity (values below 0nT).
Strength of response
The amplitude of a magnetic response is an important factor in assigning an interpretation to a
particular anomaly. For example a positive anomaly covering a 10m2 area may have values up
to around 3000nT, in which case it is likely to be caused by modern magnetic interference.
However, the same size and shaped anomaly but with values up to only 4nT may have a
natural origin. Trace plots are used to show the amplitude of response.
Oxford Archaeology North
Geophysical Survey
Lancaster University Turbines January 2009
Stratascan Page No. 13
Thermoremanent response
A feature which has been subject to heat may result in it acquiring a magnetic field. This can
be anything up to approximately +/-100 nT in value. These features include clay fired drains,
brick, bonfires, kilns, hearths and even pottery. If the heat application has occurred insitu (e.g.
a kiln) then the response is likely to be bipolar compared to if the heated objects have been
disturbed and moved relative to each other, in which case they are more likely to take an
irregular form and may display a debris style response (e.g. ash).
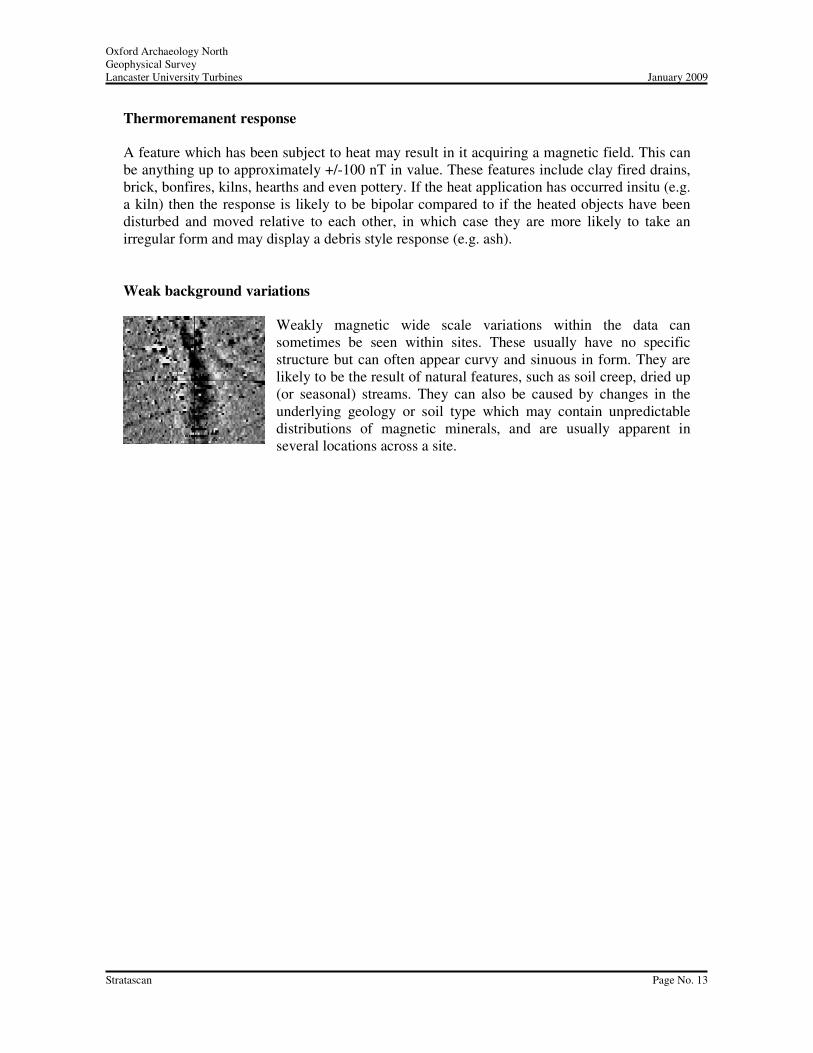
Weak background variations
Weakly magnetic wide scale variations within the data can
sometimes be seen within sites. These usually have no specific
structure but can often appear curvy and sinuous in form. They are
likely to be the result of natural features, such as soil creep, dried up
(or seasonal) streams. They can also be caused by changes in the
underlying geology or soil type which may contain unpredictable
distributions of magnetic minerals, and are usually apparent in
several locations across a site.