Embed Size (px)
Citation preview
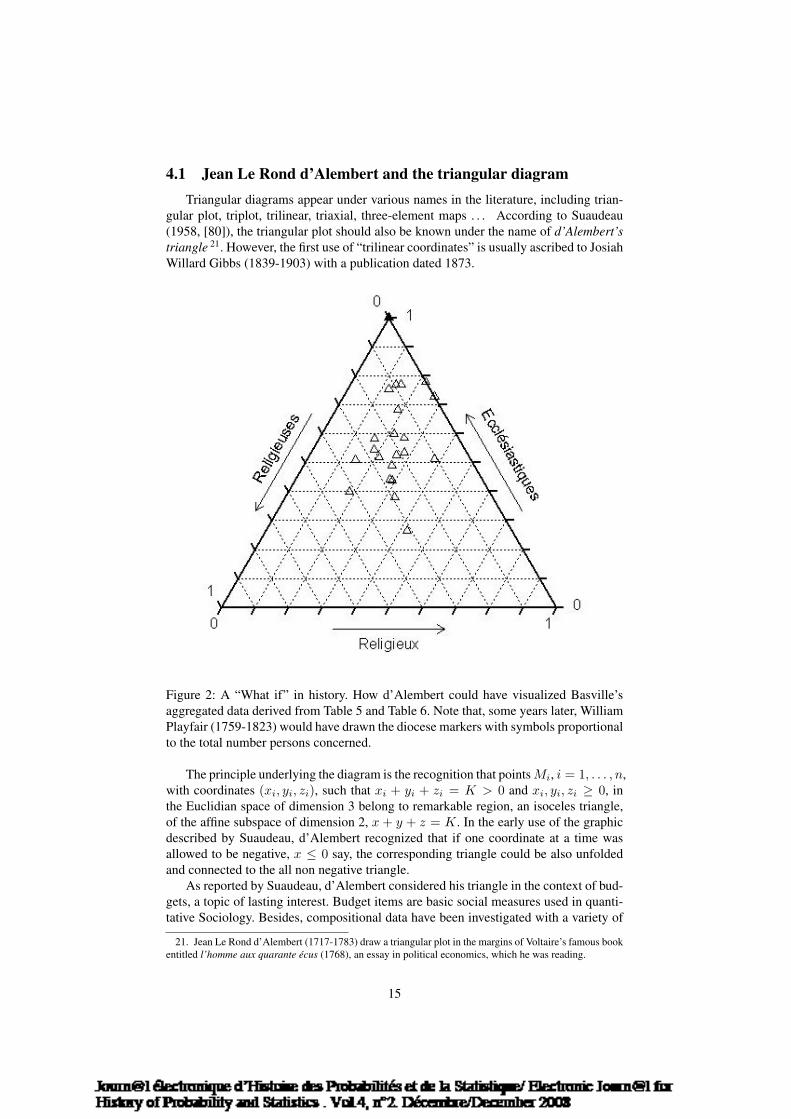
Journ@l Electronique d’Histoire desProbabilités et de la Statistique
Electronic Journ@l for History ofProbability and Statistics
Vol 4, n°2; Décembre/December 2008
www.jehps.net
L’analyse des donnees ; before and around
Antoine de Falguerolles ∗
Resume
Quelques etapes du developpement exceptionnel de l’analyse des donnees enFrance dans les annees 1965-1985 sont rappelees. S’agit-il d’une ecole specifiqueet durable de la statistique descriptive multivariee ou seulement de la conver-gence de considerations methodologiques sur des problemes poses dans un en-vironnement calculatoire completement transforme par l’usage de l’ordinateur ?Des exemples montrent que, si les reponses sont nouvelles, les problemes peuventetre anciens. Il semble aussi que les reponses de l’analyse des donnees tendent a sefondre dans l’arsenal commun des outils statistiques. Un effet de la Mondialisationen statistique ?
Abstract
Some milestones of the influential development of multivariate data analysisin France in the years 1965-1985 are recalled. Is l’analyse des donnees a distinc-tive and long-lived French school of multivariate descriptive statistics or simplythe convergence of methodological concerns in response to questions arising ina drastically transformed computing environment? Examples show that if the an-swers are novel, the problems can be ancient. It seems also that the answers ofl’analyse des donnees tend to merge into the common arsenal of statistical tools.An effect of Globalization on statistics?
Remerciements : L’auteur voudrait remercier le groupe informel mais actif des che-valiers des albums de statistique graphique pour son soutien amical, Marc Barbutpour lui avoir signale le travail de Rene Suaudeau, les organisateurs de la cinquiemeconference CARME tenue a Rotterdam (Pays-Bas) les 25-27 juin 2007 pour leur ai-mable invitation a presenter une partie de ce travail. L’auteur s’excuse de son anglaisque les francais liront certainement beaucoup plus facilement que tous autres.
∗Institut de Mathematiques, Laboratoire de statistique et probabilites, Universite de Toulouse III, 118route de Narbonne, F-31062 Toulouse cedex 9, France.
1
1 IntroductionWhat is l’analyse des donnees? Several French speaking authors have drawn the
contours of what can be considered a French connotated extension of descriptive statis-tics: Edwin Diday and Ludovic Lebart (1977, [28]), Jean-Marie Bouroche and GilbertSaporta (1978, [14]), Michel Volle (1978, [85]), Gilles Celeux and Edwin Diday (1980,[20]), Gilbert Saporta (1984, [78]) . . . Is the existence of a French school of data anal-ysis known as l’analyse des donnees a scientific reality? To what extent the existenceof this School is related to its publication language? to the emergence of new tools?
In this paper, the following working definition is used: l’analyse des donnees is aset of methods for the descriptive analysis of multivariate data observed on large setsof units. These methods are commanded by the following ingredients which in practiceare blended in varying proportions:
1. A firm belief in multidimensional descriptions.
2. A search for latent variables giving sense to the observed data and allowing di-mension reduction.
3. A conviction that proper graphical representations best convey the structure ofeither the original data or the result of their analyses.
4. A manifest (and possibly overplayed) claim from their authors to avoid any mod-eling driven by probabilistic considerations.
There is some form of agreement on dividing the methods of l’analyse des donnees intwo groups: “clustering methods” (classification automatique) and “factorial methods”(methodes factorielles 1).
This paper is written by neither a pioneer nor a strict follower of l’analyse desdonnees. It addresses the “before” and the “around” of l’analyse des donnees. The“before” is an excuse to present early material sharing some of the characteristics ofl’analyse des donnees, as just defined. The “around” is an opportunity to describe oneof the evolutionary branches of multivariate statistics. The article is organised as fol-lows. Section 2 consists in an overview of the development of l’analyse des donneesin the period 1965-1985. Section 3 gives some examples of multivariate quantificationpublished even before the word “statistics” existed. Section 4 describes some early at-tempts of data visualization where dimensionality is a real concern. Section 5 brieflyconsider a French “school of statistics” recognized in its time but foregone after aquarter of a century of existence. A bad omen for the future of l’analyse des donnees!Finally, Section 6 depicts the motivations behind an evolutionary branch of l’analysedes donnees.
2 An overview of the history of l’analyse des donneesIn its French flavour, l’analyse des donnees emerged in the late sixties with seminal
lectures by Jean-Paul Benzecri. However Benzecri did not arise by spontaneous gen-eration. Except for a few radical French researchers, l’analyse des donnees has alwaysbeen carefully replaced in the main corpus of statistics and due respect has always been
1. A word to word translation of the French methodes factorielles into the English factorial methodsto refer to methods such as principal component analysis, correspondence analysis, metric multidimen-sional scaling . . . is somewhat ambiguous. The terminology “eigen decomposition based methods” would beclearer.
2
paid to the founding fathers 2. The same period also saw the rise of main frame com-puters and, some years later, of personal computers. The coupling of computer accesswith l’analyse des donnees is frequently emphasized by French authors 3. The noveltywas that statistical methods which required “heavy-for-their-time” computations couldbe effectively investigated. Moreover, the number of users having data (on decks ofpunched cards or magnetic tapes) and not knowing precisely what to do with them(except to reject the null hypotheses in simple tests) did increase. This dialog betweenusers and statisticians under the protecting wing of computers is often advanced to ex-plain the success of the methods of l’analyse des donnees. One celebrated example isthe reiterated use of correspondence analysis by Pierre Bourdieu 4.
2.1 Development in the period 1965-1985L’analyse des donnees developed substantially in France in the years 1965-1985.
This explosion can be measured by the number of publications and even more by thediversity of fields in which, nowadays, its methods are fully used: economy, sociology,geography, data mining, text mining, bibliometry, environmetrics . . . L’analyse desdonnees even became fashionable in weekly magazines!
2.1.1 Books and handouts
Excellent comprehensive books, with frequent reeditions, have been written byLudovic Lebart and Jean-Pierre Fenelon (1971, [53]), Jean-Paul Benzecri (1973, [5]and [6]), Patrice Bertier and Jean-Marie Bouroche (1975, [8]), Ludovic Lebart, AlainMorineau and Nicole Tabard (1977, [54]), Michel Volle (1978, [86]), Edwin Didayet al. (1980, [27]), Michel Masson (1980, [65]), Edwin Diday, Jacques Lemaire, JeanPouget, Francoise Testu (1982, [29]), . . .
Many handouts circulated: the neatly calligraphied notes by Israel-Cesar Lerman,the series of booklets issued in 1971 by the Centre d’Etudes Economiques d’Entreprises(C3E), the Cours d’analyse des donnees 1978-1979 by Yves Escoufier (1978, [35]) . . .
Israel-Cesar Lerman published his book on clustering in 1970 [57]. The C3E book-lets, edited by Francis Cailliez and Jean-Pierre Pages, were combinedinto a book entitled Introduction a l’analyse des donnees 5 (1976, [16]), covering
2. In his preface dated 1971 to l’introduction a l’analyse des donnees, Georges Morlat quotes G. Dar-mois, B. de Finetti, R. A. Fisher, J. Neyman, J.W. Tukey, A. Wald ([16, pages I-V]). Not surprisingly, JohnW.Tukey’s leading paper on “the future of data analysis” in the annals of statistics (1962, [81]) is explicitedlyreferred to.
3. This coupling is reflected in the title of an early book on l’analyse des donnees, namely statistique etinformatique appliquee by Ludovic Lebart and Jean-Pierre Fenelon (1971, [53]). See also Georges Morlat inthe Preface dated 1971 of l’introduction a l’analyse des donnees (Cailliez and Pages [16], 1976 ), Jean-PaulBenzecri in the first issue of les Cahiers de l’analyse des donnees (1976, [7, Part I, page 9, first line]), JacquesDauxois and Alain Pousse (1976, [22, Introduction, page 1]) . . .
4. Pierre Bourdieux (1930-2002) is perhaps the most noted French sociologist of recent times. An exam-ple of use of correspondence analysis can be found in his famous analysis of academic sociology Homo aca-demicus (1984,[13]). Further details on scientific and personal links between Pierre Bourdieu and the Frenchstatisticians Jean-Paul Benzecri and Henry Rouanet (1932-2008) can be easily obtained from a search on theweb.
5. The names of co-authors listed on the Front page of Introduction a l’analyse des donnees are F.Cailliez, J.P. Pages (editors), G. Morlat (direction), J.-C. Amiard, J. Andres, M.-F. Bara, J.-M. Braun, J.Brenot, P. Cazes, J. Dehedin, B. Diop, Y. Escoufier, C. Guegen, N. Lacourly, J.-P. Mailles, B. Marchadier, M.Pietri, E. Roy, G. Saporta, F. Testu, R.Thomas. In the Foreword to this book, Cailliez and Pages acknowledgethe leading role of T.W. Anderson and J.-P. Benzecri and mention also a few names of researchers andresearch teams in France: Y. Escoufier in Montpellier, J. Dauxois and A. Pousse in Toulouse, G. Saporta and
3
both clustering and factorial methods 6.
2.1.2 Statistical Software packages
The development of statistical software packages dedicated to l’analyse des donneeswas stimulated by the accessibility of personal computers after 1980. Examples of soft-wares are SPAD, CHADOC . . .
2.1.3 French statistical journals
It would be a difficult task to list all journals which published either theoretical ar-ticles or applications of l’analyse des donnees. Numerous examples of the flexibility ofl’analyse des donnees can be found in the series of Cahiers de l’analyse des donneespublished between 1976 and 1997 under the editorship of Jean-Paul Benzecri. The con-tent of Revue de statistique appliquee (published since 1953 and merged in 2004 withanother statistical journal) is also a fair indicator of the attention given to l’analyse desdonnees in France. Under the supervision of Pierre Cazes, this journal addressed, alongwith more traditional topics, an astonishing variety of theoretical and practical aspectsof factorial and clustering methods. In addition, Statistique et analyse des donnees 7,the journal of the Association des statisticiens universitaires 8 (ASU) published severaltheoretical papers on l’analyse des donnees.
More remarkably, Economie et Statistique, a monthly journal edited and publishedby the Institut National de la Statistique et des Etudes Economique (INSEE) also pub-lished numerous articles where the methods of l’analyse des donnees were used.
2.1.4 French statistical meetings
In the seventies and the eighties, the latest progresses in l’analyse des donneeswere thoroughly discussed during the Journees de Statistique, the annual meeting or-ganised by the ASU since 1969. During the Journees de Statistique special sessionswere dedicated to cluster analysis in close contact with the Societe francophone declassification 9 (SFC). In 1992, the SFC decided to hold its own annual meeting calledles rencontres de la SFC where l’analyse des donnees is obviously at home. The offi-cial (and dominant) language was and still is the French language but both meetings are
M. Masson in Paris, E. Diday at the IRIA [Institut de Recherche en Informatique et Automatique created in1967, nowadays the INRIA with a national N], J.M. Bouroche and collaborators ([16, pages VII-VIII]).
6. Similarly in the Netherlands, the mimeographed text of Albert Gifi, a pen name for an active groupin the Netherlands, that was circulated in English since 1981 became a book in 1990 [41].
7. The first volume of Statistique et analyse des donnees appeared in 1976; the journal ceased publicationin 1991. Its editors were Henri Caussinus and Guy Romier, Yves Escoufier, and Bernard Van Cutsem. Whileserving on the Board of the Association des statisticiens universitaires, I remember with mixed feelingsthe discutions at the meeting when the title of its journal was chosen: Statistique et Analyse des Donnees.Clarification or pleonasm? The alleged opposition between Statistique and Analyse des donnees is thoroughlydiscussed by Henri Caussinus in the section Statistique, modeles et analyse des donnees of a methodologicalpaper (1993,[18]).
8. The Association des Statisticiens Universitaires was founded in 1969 mostly by academics, mainlyfrom “provincial” universities, for a variety of reasons: the enthusiasm in the 1968 era for the creation of newstructures; the Malthusianism of existing statistical societies, e.g. Societe de Statistique de Paris; the rejectionof Societies suspected of “imperialistic” views on statistics, e.g. Societe mathematique de France . . . Inparticular, the ASU was a forum where activities linked to the mass emergence of statistical curriculum innewly created universities were discussed. Its name was changed in 1987 into Association pour la Statistiqueet ses Utilisations to reflect the growing number of members who were non academic statisticians.
9. The Societe francophone de classification was founded in 1977. See Lerman (1998, [58]) for anhistorical note.
4
regularly attended by a few non-francophones, either sympathizers or invited speakers,delivering their talks in English. An international forum for l’analyse des donnees wasalso the series Journees d’Analyse des Donnees et Informatique organized by the In-stitut National de Recherche en Informatique et Automatique (INRIA) in 1977, 1979,1983 . . . .
2.1.5 International projects
It would be informative to establish an exhaustive list of international projects inwhich French teams of researchers in l’analyse des donnees were involved. This wouldrequire access to the archives of research institutions and has not be done. A specialissue of the Journal de la Statistique Appliquee (1987, Vol. 35(3)) addresses someof the issues discussed below in subsection 2.3. It reflects the methodological resultsobtained in a joint program of the Economic and Social Research Council (ESRC)and the Centre National de la Recherche Scientifique (CNRS). Surely, there must havebeen a number of similar projects. Their joint analysis would be of real interest for thehistory of multivariate data analysis.
2.1.6 The come back of probability calculus
As anticipated by Georges Morlat in his Preface to the introduction a l’analysedes donnees [16] the probabilistic framework was to come back 10 . Broadly speaking,its reintroduction followed two distinct paths, a “within” and a “between”. The for-mer consists in extending the framework of data analysis to answer either mathemati-cal questions such as the mathematical generality of methods or traditional statisticalquestions or . . . It includes detailed treatment of the convergence of eigen elementsor of tests of equality for covariance operators. Seminal works for the “within” are byMichel Masson, Jean-Claude Naouri, Jacques Dauxois and Alain Pousse, Jean-ClaudeDeville . . . A typical example is Dauxois, Pousse and Romain (1982, [23]).
The “between” consists in building bridges between methods of l’analyse des don-nees and statistical modeling methods which were developed in the same period. Anglo-Saxon publications which had a real impact in France on statistical data analysis areby Yvonne Bishop, Stephen Fienberg and Paul Holland (1975, [11]), John Nelder andRobert Wedderburn (1972, [68]), Peter McCullagh and John Nelder (1983, 1989, [66]),Murray Aitkin, Dorothy Anderson, Brian Francis and John Hinde (1988, [2]). At thejunction of the “between” and “within” are useful considerations on the role of modelsin l’analyse des donnees (Henri Caussinus, 1986 [17], 1993 [18]) with applications torobustness and to metric or dimension choice.
2.2 Nowadays in France?An observer of the present-day landscape of research in statistical methodology
in France, may be disconcerted to notice that the portion of l’analyse des donneeshas been substantially reduced from it was in its glorious period. Methodological pro-gresses in l’analyse des donnees are no more considered as “cutting edges” statisticsby the academic world. Is l’analyse des donnees nothing else than an useful extensionof descriptive statistics widely researched in the period 1965-1985?
10. To assess the stability of results from l’analyse des donnees, validation procedures such as the jack-knife, the bootstrap or permutation tests were naturally considered. But these probabilistic methods are pe-ripheral to the methods of l’analyse des donnees.
5
A provocative observer can be tempted to plagiarize Paul F. Lazarsfeld 11’s con-clusion on Le Play and his methode d’observation. Not only the text nicely transposesto l’analyse des donnees (and Jean-Paul Benzecri) but it raises a series of impertinentquestions:
“We are thus faced with the following situation. Here is a school createdby a charismatic personality who makes an important innovation in socialmethodology and intertwines it with very strong and activitistic ideolog-ical beliefs. One group of his disciples share his beliefs and want at thesame time to make methodological progress. Under normal circumstances,a scientific innovator is respected by his students, and it is taken for grantedthat his successors make continuous advances beyond the teacher. In acharismatic context, this leads to a tension between the scientific and thesectarian element in the tradition. This would be a matter of only sec-ondary interest if it were not for the fact that rather suddenly, the LePlay-istes disappeared from the French sociological scene. At least as far as onecan see from a distance, the school which was so extensive and articulateup to the First World War has been completely replaced by the Durkheimtradition to which they paid only casual and rare attention in the “ScienceSociale”. In various reviews of French sociology which Frenchmen haverecently written the LePlayistes are not even mentioned. Do we face herea political phenomenon? Did the few relevant university posts all go tothe Durkheim group at a time when the French government had an anti-clerical tendency? Did the descriptive fervor of the LePlayistes exhaust itspotentialities, and make it less attractive than the conceptualizing of theDurkheim School to a younger generation? Do we face here the difficultya charismatic movement has: in spite of their ambivalence to the founder,did the LePlayistes form too much of a sect to be acceptable to the regularacademic bureaucracy?I cannot tell. Certainly the methodological ideas of the school were inter-esting and susceptible of further development as I shall discuss presently.But first, I must trace briefly the effect which LePlay had abroad, espe-cially in England and in the United States and here, strangely enough, thetheme of the purge can be continued. While we find outspoken and clam-orous admirers of his in the two Anglo-Saxon countries, they changed hisideas even more than did his French disciples, each in his own way andperhaps without knowing it. . . . ” Lazarsfeld [52, pages 320-321].
As seen in the Introduction, the aims of this paper are more modest. In particular,French research policy will not be discussed and “outspoken and clamorous admirers”in France and outside France will not be ranked!
2.3 Globalization versus French exceptionWhat is the specificity of l’analyse des donnees as compared to descriptive multi-
variate data analysis?
11. Paul F. Lazarsfeld (1901-1976) is one of the leading figures in 20th century American sociology.Lazarsfeld was also influential in France. See subsection 6.1 below.
6
2.3.1 Globalization
In the 2008 augmented Spanish translation [46] of his English book, correspon-dence analysis in practice [45], Michael Greenacre gives 14 references in the bibli-ography (Appendix C). These divide into 12 English publications and 2 French pub-lications, namely Jean-Paul Benzecri’s two 1973 volumes ([5] and [6]) and the bookpublished in honor of Brigitte Escoffier-Cordier after her death in 1994 [34]. How-ever, all have a Benzecri connection. Expectedly, with time, the link with Benzecri willbe through Ludovic Lebart, Michael Greenacre, Fionn Murthagh . . . But the startingpoint is undoubtedly the seminal work of Benzecri. In contrast, the review by PierreCazes (2008, [19])) of the Proceedings (2006, [47]) of the fourth CARME 12 meet-ing held in Barcelona in 2003 clearly shows that correspondence analysis is not anymore a French exception. Besides, globalization is at work for the whole spectrum ofl’analyse des donnees as can be seen by numerous publications by non-French authorsin international journals.
2.3.2 The French exception
Then, was there an identifiable French touch in l’analyse des donnees? In the dis-cussion of a paper entitled “data analysis in Official socio-economic Statistics” [26]which Jean-Claude Deville and Edmond Malinvaud presented in 1983 at the RoyalStatistical Society, John Gower made the following comment:
Tonight’s speakers are right in suggesting that British and French statis-ticians should know more of each others’ work. However, I do not thinkthat things are quite as bad as they make out, for although many of us arenot as fluent as we would like to be in speaking French, many can and doread it. My feeling is that the style of French mathematical presentation isoften more of a barrier than is the language, but this is not a problem withtonight’s paper.
John Gower’s comment addresses two questions, a language barrier and a differencein mathematical presentation which can be differently evaluated according to the na-tionality of the discussant. Moreover the situation may have changed since 1983. Bothquestions are reconsidered below.
The language barrierThe language barrier is sometimes advanced as an explanation of the gaps between
existing schools of data-analytic thought. The French prevention to the use of Englishand the decline of French as an international scientific exchange language during thesecond half of the 20th century are well known 13. Clearly, the French had difficultiesto write articles in English or to present talks in an English which could be reason-ably understood (by others than their French colleagues). Moreover a few couldn’tread English at all. This barrier has certainly contributed to a form of isolated devel-opment of multivariate data analysis. The barrier also showed some porosity: Kanti V.Mardia, John T. Bibby and John M. Kent’s multivariate analysis (1979, [63]) crossedthe Channel and found its place in French university libraries while Ludovic Lebart,
12. Correspondence Analysis and Related Methods.13. As an example of late resistance, the French government issued in 1982 regulations stating that no
public funds should go to scientific activities held in France where the French language was not the officiallanguage! And the regulations were well accepted in academic circles.
7
Alain Morineau and Kenneth M. Warwick’s multivariate descriptive statistical analy-sis (1984, [55]) ventured in the wilderness of non French speaking countries.
Note in passing that nowadays the use of English is not any more felt either as animpossible task or as a betrayal of the French culture. However the increasing numberof French researchers who have improved their English does not balance the rapidlydecreasing number of non Francophone researchers who “can and do read” French!
The mathematical presentationAn article published by Jean-Pierre Pages, Francis Cailliez and Yves Escoufier
(1979, [70]) in the Revue de Statistique Appliquee can illustrate this aspect. The pa-per addresses factorial analyses and is structured as follows. Firstly, the methods areplaced in line with Anglo-Saxon forerunning research by Charles Spearman, Karl Pear-son and Harold Hotelling 14. Secondly, a classification of the types of data and therelevant variants of factorial methods are recalled. Thirdly, the central mathematicalconcept underlying these methods, namely the “duality scheme”, is described in an in-volved statistical environment. When read from today’s perspective, the French flavourin the paper resides in the use of the “duality scheme” which makes the paper lookrather mathematical. The “duality scheme” certainly brings a clear understanding ofthe interplay of the metrics in the various spaces involved. But nowadays, generalizedsingular value decomposition is considered as a tool much easier to understand and touse than the “duality scheme”.
Articles addressing clustering analysis show a comparable difference which maybe due in France to the formalism introduced in the teaching of set and graph theory.Again, the understanding of the mathematical structures put at work in statistics isemphasized.
To a large extent the mathematical background in statistical papers do reflect thestructure of statistics teaching and the process of career choice in the previous years.Certainly, Post-1968 students felt more at ease with l’analyse des donnees than with“traditional” statistics to which they had a limited exposure. Note that the specificationof a proper articulation between mathematics and statistics is certainly an issue for thefuture of statistical research.
3 Multivariate quantificationMultivariate quantification existed long before the word “statistics”. As expected,
the early examples which are presented below call for modern analyses provided byl’analyse des donnees.
3.1 La Felicissima Armada, 1588During the preparation of the Armada 15, several accounts of its formidable strength
were circulated to reassure allied powers of Spain or to intimidate its enemies. How the
14. The remembrance of this filiation is the result of a constant concern for at least two reasons: appro-priate scientific behaviour and genuine interest. An example of the former is the note by Gilbert Saportaconcerning the fathers of correspondence analysis (1975, [77]). An example of the latter is the French trans-lation, with a foreword by Georges Darmois, of the second edition of Charles Spearman’s book entitled Theabilities of man by Francois Brachet (1936, [79]).
15. The Spanish Armada was the fleet intended to invade England in 1588. La Felicissima Armada wasunder the command of the Duke of Medina Sidonia; second in command was the famous sailor Juan Martinezde Recalde. It was all destroyed by a week’s fighting.
8
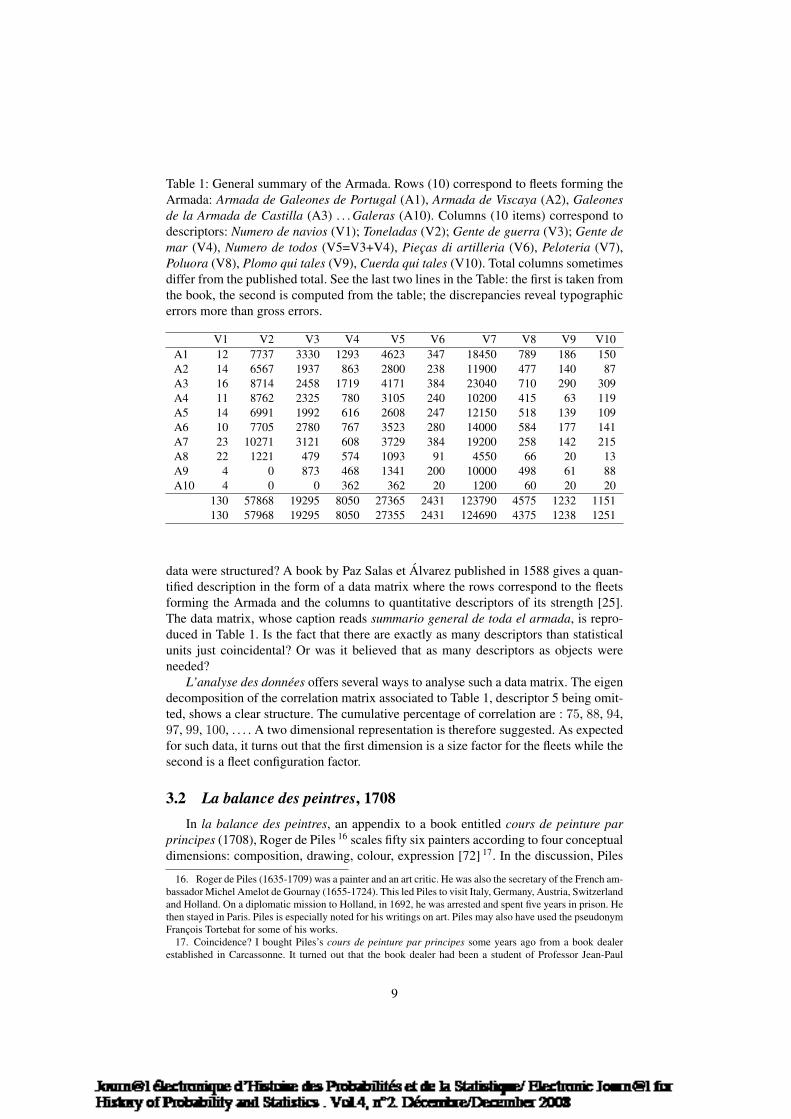
Table 1: General summary of the Armada. Rows (10) correspond to fleets forming theArmada: Armada de Galeones de Portugal (A1), Armada de Viscaya (A2), Galeonesde la Armada de Castilla (A3) . . . Galeras (A10). Columns (10 items) correspond todescriptors: Numero de navios (V1); Toneladas (V2); Gente de guerra (V3); Gente demar (V4), Numero de todos (V5=V3+V4), Piecas di artilleria (V6), Peloteria (V7),Poluora (V8), Plomo qui tales (V9), Cuerda qui tales (V10). Total columns sometimesdiffer from the published total. See the last two lines in the Table: the first is taken fromthe book, the second is computed from the table; the discrepancies reveal typographicerrors more than gross errors.
V1 V2 V3 V4 V5 V6 V7 V8 V9 V10A1 12 7737 3330 1293 4623 347 18450 789 186 150A2 14 6567 1937 863 2800 238 11900 477 140 87A3 16 8714 2458 1719 4171 384 23040 710 290 309A4 11 8762 2325 780 3105 240 10200 415 63 119A5 14 6991 1992 616 2608 247 12150 518 139 109A6 10 7705 2780 767 3523 280 14000 584 177 141A7 23 10271 3121 608 3729 384 19200 258 142 215A8 22 1221 479 574 1093 91 4550 66 20 13A9 4 0 873 468 1341 200 10000 498 61 88A10 4 0 0 362 362 20 1200 60 20 20
130 57868 19295 8050 27365 2431 123790 4575 1232 1151130 57968 19295 8050 27355 2431 124690 4375 1238 1251
data were structured? A book by Paz Salas et Alvarez published in 1588 gives a quan-tified description in the form of a data matrix where the rows correspond to the fleetsforming the Armada and the columns to quantitative descriptors of its strength [25].The data matrix, whose caption reads summario general de toda el armada, is repro-duced in Table 1. Is the fact that there are exactly as many descriptors than statisticalunits just coincidental? Or was it believed that as many descriptors as objects wereneeded?
L’analyse des donnees offers several ways to analyse such a data matrix. The eigendecomposition of the correlation matrix associated to Table 1, descriptor 5 being omit-ted, shows a clear structure. The cumulative percentage of correlation are : 75, 88, 94,97, 99, 100, . . . . A two dimensional representation is therefore suggested. As expectedfor such data, it turns out that the first dimension is a size factor for the fleets while thesecond is a fleet configuration factor.
3.2 La balance des peintres, 1708In la balance des peintres, an appendix to a book entitled cours de peinture par
principes (1708), Roger de Piles 16 scales fifty six painters according to four conceptualdimensions: composition, drawing, colour, expression [72] 17. In the discussion, Piles
16. Roger de Piles (1635-1709) was a painter and an art critic. He was also the secretary of the French am-bassador Michel Amelot de Gournay (1655-1724). This led Piles to visit Italy, Germany, Austria, Switzerlandand Holland. On a diplomatic mission to Holland, in 1692, he was arrested and spent five years in prison. Hethen stayed in Paris. Piles is especially noted for his writings on art. Piles may also have used the pseudonymFrancois Tortebat for some of his works.
17. Coincidence? I bought Piles’s cours de peinture par principes some years ago from a book dealerestablished in Carcassonne. It turned out that the book dealer had been a student of Professor Jean-Paul
9
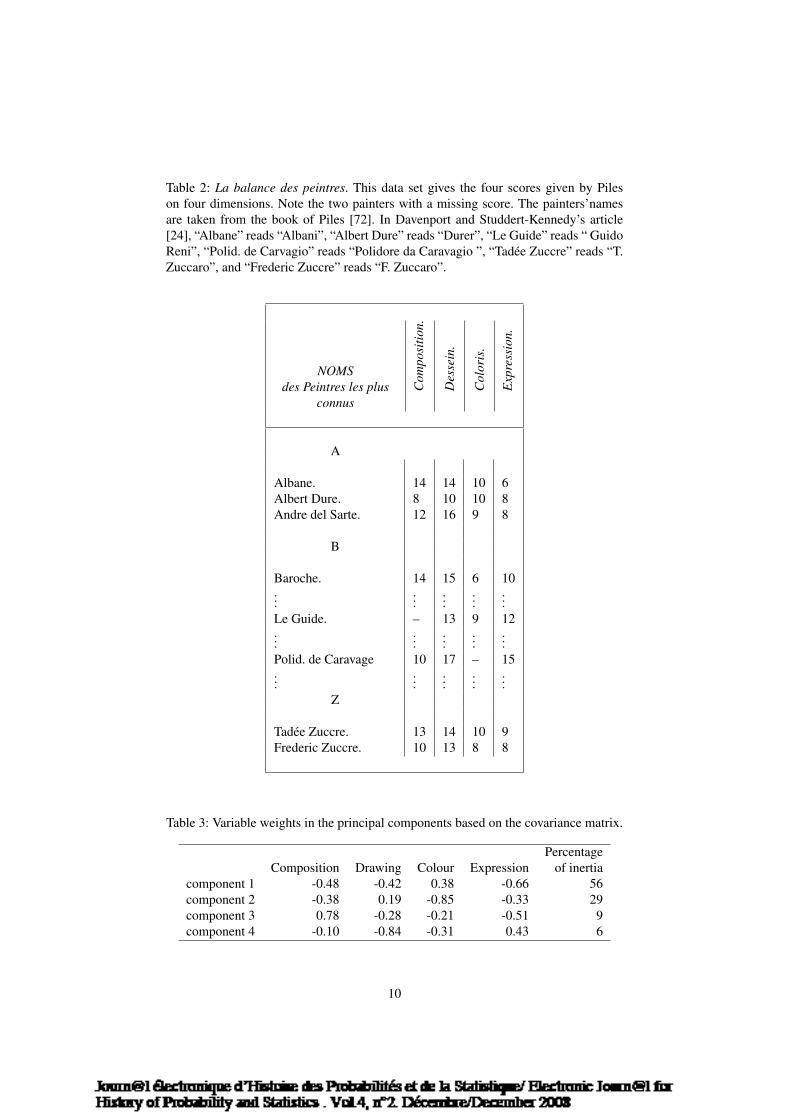
Table 2: La balance des peintres. This data set gives the four scores given by Pileson four dimensions. Note the two painters with a missing score. The painters’namesare taken from the book of Piles [72]. In Davenport and Studdert-Kennedy’s article[24], “Albane” reads “Albani”, “Albert Dure” reads “Durer”, “Le Guide” reads “ GuidoReni”, “Polid. de Carvagio” reads “Polidore da Caravagio ”, “Tadee Zuccre” reads “T.Zuccaro”, and “Frederic Zuccre” reads “F. Zuccaro”.
NOMSdes Peintres les plus
connusC
ompo
sitio
n.
Des
sein
.
Col
oris
.
Exp
ress
ion.
A
Albane. 14 14 10 6Albert Dure. 8 10 10 8Andre del Sarte. 12 16 9 8
B
Baroche. 14 15 6 10...
......
......
Le Guide. – 13 9 12...
......
......
Polid. de Caravage 10 17 – 15...
......
......
Z
Tadee Zuccre. 13 14 10 9Frederic Zuccre. 10 13 8 8
Table 3: Variable weights in the principal components based on the covariance matrix.
PercentageComposition Drawing Colour Expression of inertia
component 1 -0.48 -0.42 0.38 -0.66 56component 2 -0.38 0.19 -0.85 -0.33 29component 3 0.78 -0.28 -0.21 -0.51 9component 4 -0.10 -0.84 -0.31 0.43 6
10
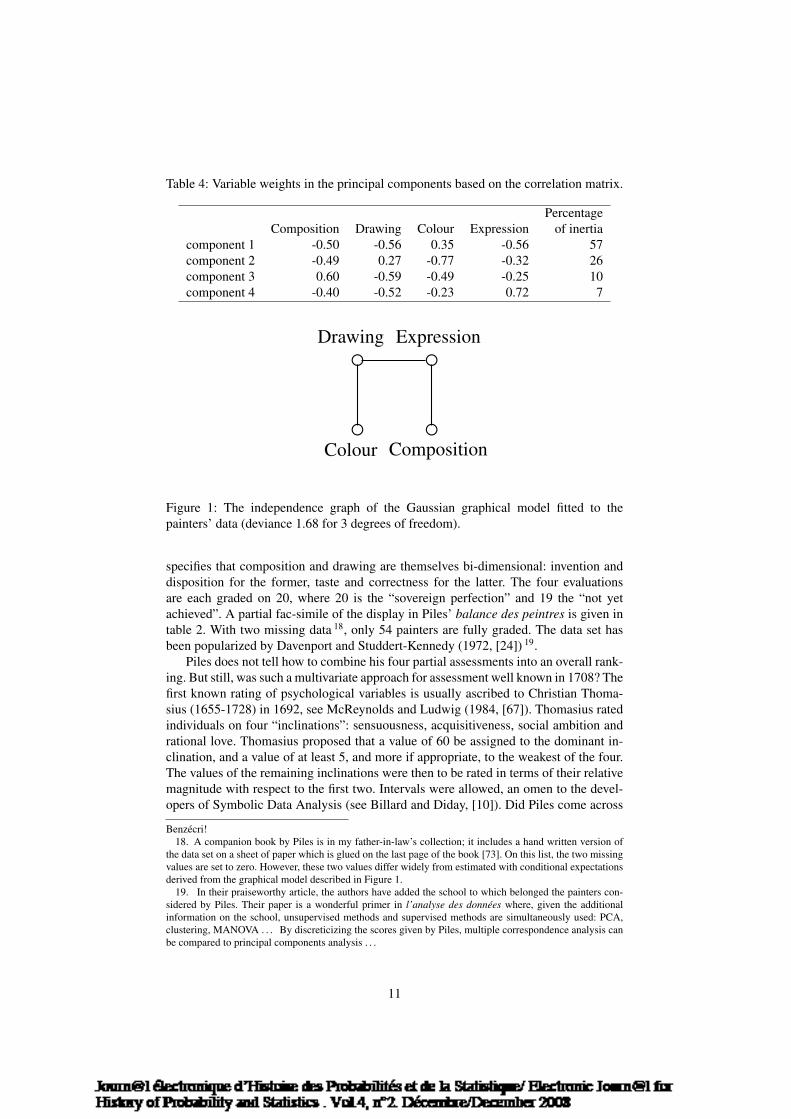
Table 2: La balance des peintres. This data set gives the four scores given by Pileson four dimensions. Note the two painters with a missing score. The painters’namesare taken from the book of Piles [72]. In Davenport and Studdert-Kennedy’s article[24], “Albane” reads “Albani”, “Albert Dure” reads “Durer”, “Le Guide” reads “ GuidoReni”, “Polid. de Carvagio” reads “Polidore da Caravagio ”, “Tadee Zuccre” reads “T.Zuccaro”, and “Frederic Zuccre” reads “F. Zuccaro”.
NOMSdes Peintres les plus
connus
Com
posi
tion.
Des
sein
.
Col
oris
.
Exp
ress
ion.
A
Albane. 14 14 10 6Albert Dure. 8 10 10 8Andre del Sarte. 12 16 9 8
B
Baroche. 14 15 6 10...
......
......
Le Guide. – 13 9 12...
......
......
Polid. de Caravage 10 17 – 15...
......
......
Z
Tadee Zuccre. 13 14 10 9Frederic Zuccre. 10 13 8 8
Table 3: Variable weights in the principal components based on the covariance matrix.
PercentageComposition Drawing Colour Expression of inertia
component 1 -0.48 -0.42 0.38 -0.66 56component 2 -0.38 0.19 -0.85 -0.33 29component 3 0.78 -0.28 -0.21 -0.51 9component 4 -0.10 -0.84 -0.31 0.43 6
10
Table 4: Variable weights in the principal components based on the correlation matrix.
PercentageComposition Drawing Colour Expression of inertia
component 1 -0.50 -0.56 0.35 -0.56 57component 2 -0.49 0.27 -0.77 -0.32 26component 3 0.60 -0.59 -0.49 -0.25 10component 4 -0.40 -0.52 -0.23 0.72 7
Composition
Drawing
Colour
Expression
Figure 1: The independence graph of the Gaussian graphical model fitted to thepainters’ data (deviance 1.68 for 3 degrees of freedom).
specifies that composition and drawing are themselves bi-dimensional: invention anddisposition for the former, taste and correctness for the latter. The four evaluationsare each graded on 20, where 20 is the “sovereign perfection” and 19 the “not yetachieved”. A partial fac-simile of the display in Piles’ balance des peintres is given intable 2. With two missing data 18, only 54 painters are fully graded. The data set hasbeen popularized by Davenport and Studdert-Kennedy (1972, [24]) 19.
Piles does not tell how to combine his four partial assessments into an overall rank-ing. But still, was such a multivariate approach for assessment well known in 1708? Thefirst known rating of psychological variables is usually ascribed to Christian Thoma-sius (1655-1728) in 1692, see McReynolds and Ludwig (1984, [67]). Thomasius ratedindividuals on four “inclinations”: sensuousness, acquisitiveness, social ambition andrational love. Thomasius proposed that a value of 60 be assigned to the dominant in-clination, and a value of at least 5, and more if appropriate, to the weakest of the four.The values of the remaining inclinations were then to be rated in terms of their relativemagnitude with respect to the first two. Intervals were allowed, an omen to the devel-opers of Symbolic Data Analysis (see Billard and Diday, [10]). Did Piles come across
Benzecri!18. A companion book by Piles is in my father-in-law’s collection; it includes a hand written version of
the data set on a sheet of paper which is glued on the last page of the book [73]. On this list, the two missingvalues are set to zero. However, these two values differ widely from estimated with conditional expectationsderived from the graphical model described in Figure 1.
19. In their praiseworthy article, the authors have added the school to which belonged the painters con-sidered by Piles. Their paper is a wonderful primer in l’analyse des donnees where, given the additionalinformation on the school, unsupervised methods and supervised methods are simultaneously used: PCA,clustering, MANOVA . . . By discreticizing the scores given by Piles, multiple correspondence analysis canbe compared to principal components analysis . . .
11
(the work of) Thomasius? The apparent connection is not documented.The Piles data call for an analysis of either the variance matrix or the correlation
matrix by factorial methods. As can bee seen in Tables 3 and 4, each eigen vectoropposes in turn one of Piles criterion to the other three. The ordering is the same in botheigen decompositions: colour against composition, drawing and expression, drawingagainst composition, colour and expression . . . An alternative strategy is to look forconditional independence between colour, composition, drawing, and expression andto fit a Gaussian graphical model (Whittaker [88], Edwards [33]). The independencegraph of the fitted model is given in Figure 1. Given the goodness of fit of the graphicalmodel, the fitted covariance does not fail to replicate the pattern of oppositions foundin the empirical covariance and correlation matrices.
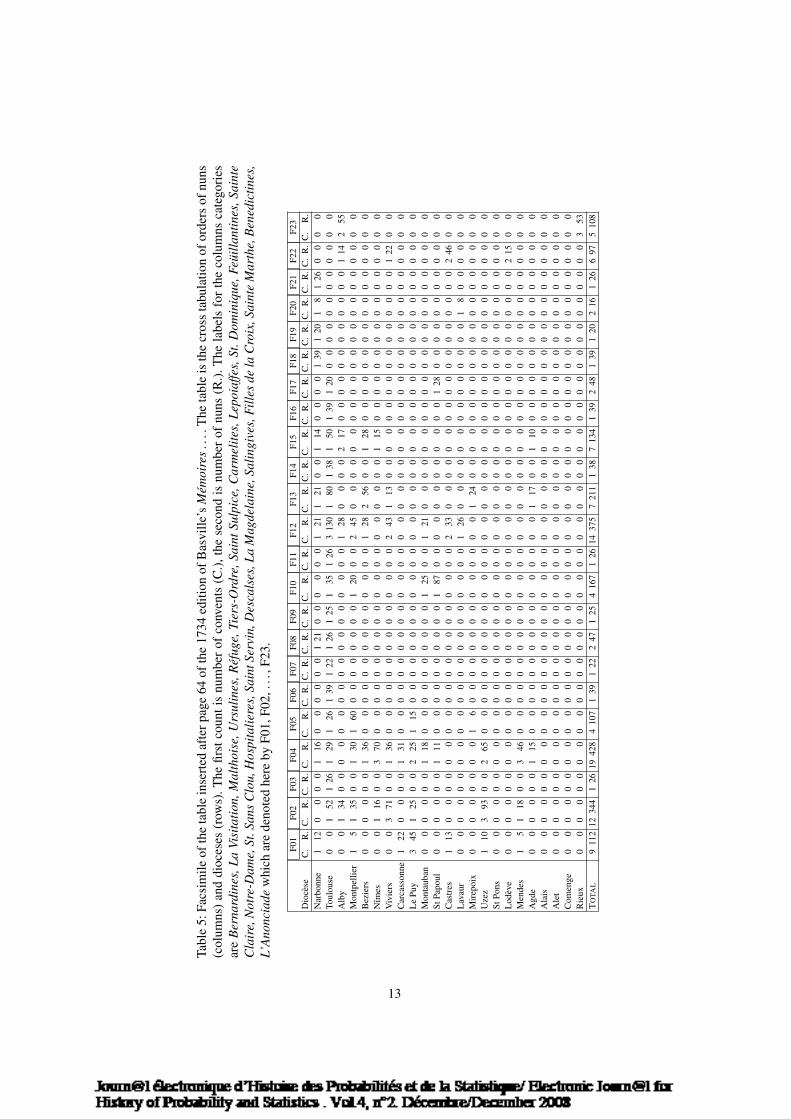
3.3 Basville, the intendant of LanguedocNicolas de Lamoignon de Basville (1648-1724) was Intendant of the King of France,
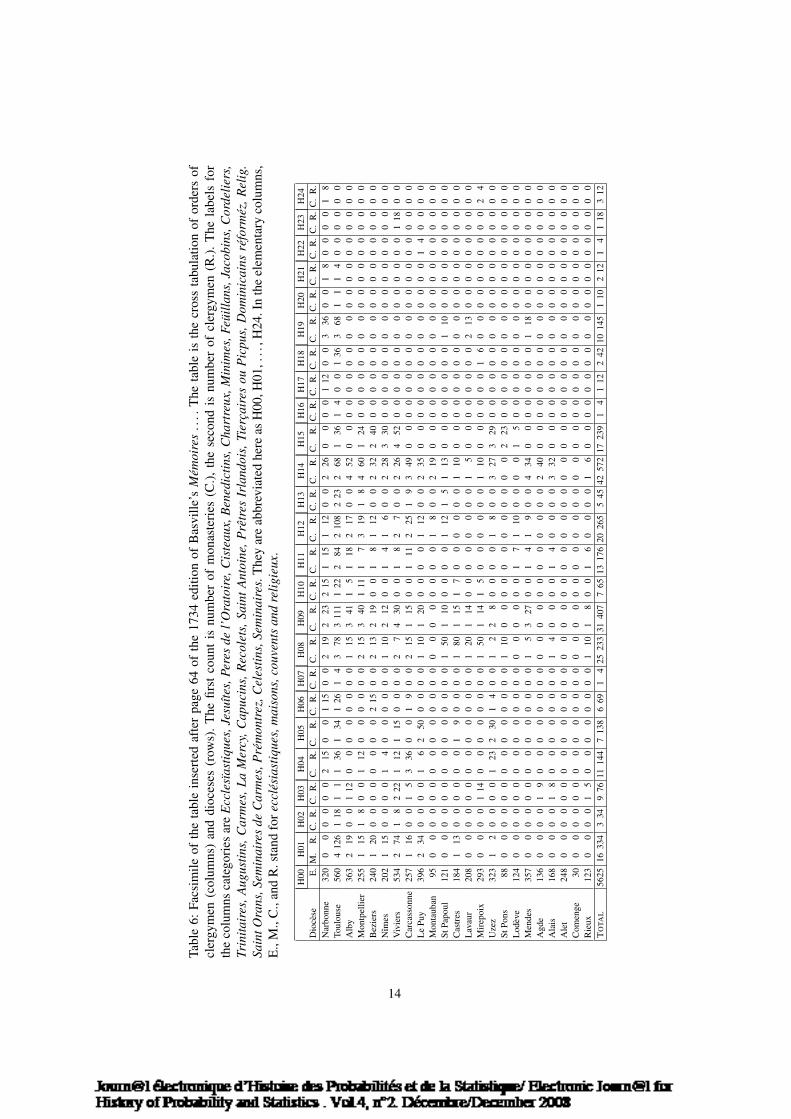
Louis the XIVth, for the Province of Languedoc. His administration took place duringtroubled times of the persecutions of the Protestant population whose religion had beenbanned in 1685. Basville is the author of a Memoires sur la province de Languedocwritten in the years 1696-1697 for the instruction of the Duke of Burgundy, a heir tothe French Crown (1734, [4]). Basville had received a good mathematical education bythe Jesuits which may explain his skilfulness in using numbers. His report contains 5data sets displayed according to modern formats.
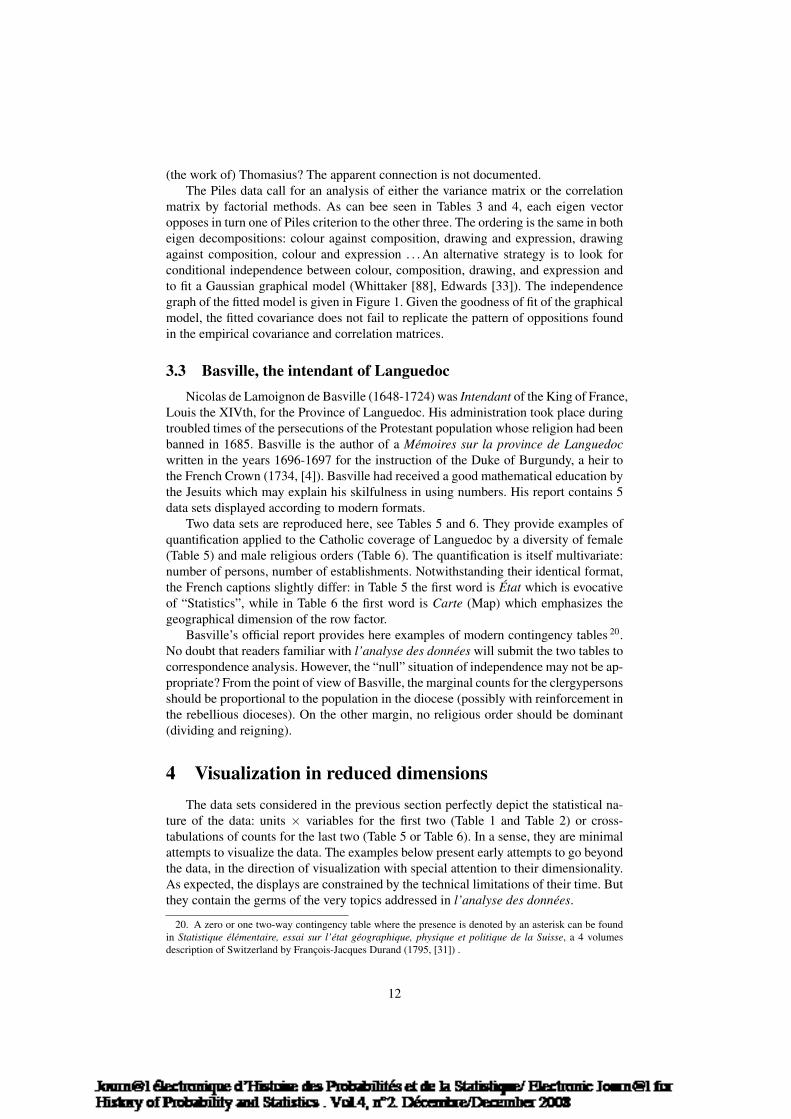
Two data sets are reproduced here, see Tables 5 and 6. They provide examples ofquantification applied to the Catholic coverage of Languedoc by a diversity of female(Table 5) and male religious orders (Table 6). The quantification is itself multivariate:number of persons, number of establishments. Notwithstanding their identical format,the French captions slightly differ: in Table 5 the first word is Etat which is evocativeof “Statistics”, while in Table 6 the first word is Carte (Map) which emphasizes thegeographical dimension of the row factor.
Basville’s official report provides here examples of modern contingency tables 20.No doubt that readers familiar with l’analyse des donnees will submit the two tables tocorrespondence analysis. However, the “null” situation of independence may not be ap-propriate? From the point of view of Basville, the marginal counts for the clergypersonsshould be proportional to the population in the diocese (possibly with reinforcement inthe rebellious dioceses). On the other margin, no religious order should be dominant(dividing and reigning).
4 Visualization in reduced dimensionsThe data sets considered in the previous section perfectly depict the statistical na-
ture of the data: units × variables for the first two (Table 1 and Table 2) or cross-tabulations of counts for the last two (Table 5 or Table 6). In a sense, they are minimalattempts to visualize the data. The examples below present early attempts to go beyondthe data, in the direction of visualization with special attention to their dimensionality.As expected, the displays are constrained by the technical limitations of their time. Butthey contain the germs of the very topics addressed in l’analyse des donnees.
20. A zero or one two-way contingency table where the presence is denoted by an asterisk can be foundin Statistique elementaire, essai sur l’etat geographique, physique et politique de la Suisse, a 4 volumesdescription of Switzerland by Francois-Jacques Durand (1795, [31]) .
12
(the work of) Thomasius? The apparent connection is not documented.The Piles data call for an analysis of either the variance matrix or the correlation
matrix by factorial methods. As can bee seen in Tables 3 and 4, each eigen vectoropposes in turn one of Piles criterion to the other three. The ordering is the same in botheigen decompositions: colour against composition, drawing and expression, drawingagainst composition, colour and expression . . . An alternative strategy is to look forconditional independence between colour, composition, drawing, and expression andto fit a Gaussian graphical model (Whittaker [88], Edwards [33]). The independencegraph of the fitted model is given in Figure 1. Given the goodness of fit of the graphicalmodel, the fitted covariance does not fail to replicate the pattern of oppositions foundin the empirical covariance and correlation matrices.
3.3 Basville, the intendant of LanguedocNicolas de Lamoignon de Basville (1648-1724) was Intendant of the King of France,
Louis the XIVth, for the Province of Languedoc. His administration took place duringtroubled times of the persecutions of the Protestant population whose religion had beenbanned in 1685. Basville is the author of a Memoires sur la province de Languedocwritten in the years 1696-1697 for the instruction of the Duke of Burgundy, a heir tothe French Crown (1734, [4]). Basville had received a good mathematical education bythe Jesuits which may explain his skilfulness in using numbers. His report contains 5data sets displayed according to modern formats.
Two data sets are reproduced here, see Tables 5 and 6. They provide examples ofquantification applied to the Catholic coverage of Languedoc by a diversity of female(Table 5) and male religious orders (Table 6). The quantification is itself multivariate:number of persons, number of establishments. Notwithstanding their identical format,the French captions slightly differ: in Table 5 the first word is Etat which is evocativeof “Statistics”, while in Table 6 the first word is Carte (Map) which emphasizes thegeographical dimension of the row factor.
Basville’s official report provides here examples of modern contingency tables 20.No doubt that readers familiar with l’analyse des donnees will submit the two tables tocorrespondence analysis. However, the “null” situation of independence may not be ap-propriate? From the point of view of Basville, the marginal counts for the clergypersonsshould be proportional to the population in the diocese (possibly with reinforcement inthe rebellious dioceses). On the other margin, no religious order should be dominant(dividing and reigning).
4 Visualization in reduced dimensionsThe data sets considered in the previous section perfectly depict the statistical na-
ture of the data: units × variables for the first two (Table 1 and Table 2) or cross-tabulations of counts for the last two (Table 5 or Table 6). In a sense, they are minimalattempts to visualize the data. The examples below present early attempts to go beyondthe data, in the direction of visualization with special attention to their dimensionality.As expected, the displays are constrained by the technical limitations of their time. Butthey contain the germs of the very topics addressed in l’analyse des donnees.
20. A zero or one two-way contingency table where the presence is denoted by an asterisk can be foundin Statistique elementaire, essai sur l’etat geographique, physique et politique de la Suisse, a 4 volumesdescription of Switzerland by Francois-Jacques Durand (1795, [31]) .
12
Tabl
e5:
Facs
imile
ofth
eta
ble
inse
rted
afte
rpag
e64
ofth
e17
34ed
ition
ofB
asvi
lle’s
Mem
oire
s..
..T
heta
ble
isth
ecr
oss
tabu
latio
nof
orde
rsof
nuns
(col
umns
)an
ddi
oces
es(r
ows)
.The
first
coun
tis
num
ber
ofco
nven
ts(C
.),th
ese
cond
isnu
mbe
rof
nuns
(R.).
The
labe
lsfo
rth
eco
lum
nsca
tego
ries
are
Ber
nard
ines
,La
Visi
tatio
n,M
alth
oise
,Urs
ulin
es,R
efug
e,Ti
ers-
Ord
re,S
aint
Sulp
ice,
Car
mel
ites,
Lepo
iaffe
s,St
.Dom
iniq
ue,F
euill
antin
es,S
aint
eC
lair
e,N
otre
-Dam
e,St
.San
sC
lou,
Hos
pita
liere
s,Sa
intS
ervi
n,D
esca
lses
,La
Mag
dela
ine,
Salin
give
s,Fi
lles
dela
Cro
ix,S
aint
eM
arth
e,B
ened
ictin
es,
L’A
nonc
iade
whi
char
ede
note
dhe
reby
F01,
F02,
...,
F23.
F01
F02
F03
F04
F05
F06
F07
F08
F09
F10
F11
F12
F13
F14
F15
F16
F17
F18
F19
F20
F21
F22
F23
Dio
cese
C.
R.
C.
R.
C.
R.
C.
R.
C.
R.
C.
R.
C.
R.
C.
R.
C.
R.
C.
R.
C.
R.
C.
R.
C.
R.
C.
R.
C.
R.
C.
R.
C.
R.
C.
R.
C.
R.
C.
R.
C.
R.
C.
R.
C.
R.
Nar
bonn
e1
120
00
01
160
00
00
01
210
00
00
01
211
210
01
140
00
01
391
201
81
260
00
0To
ulou
se0
01
521
261
291
261
391
221
261
251
351
263
130
180
138
150
139
120
00
00
00
00
00
00
Alb
y0
01
340
00
00
00
00
00
00
00
00
01
280
00
02
170
00
00
00
00
00
01
142
55M
ontp
ellie
r1
51
350
01
301
600
00
00
00
01
200
02
450
00
00
00
00
00
00
00
00
00
00
0B
ezie
rs0
00
00
01
360
00
00
00
00
00
00
01
282
560
01
280
00
00
00
00
00
00
00
0N
ımes
00
116
00
370
00
00
00
00
00
00
00
00
00
00
115
00
00
00
00
00
00
00
00
Viv
iers
00
371
00
136
00
00
00
00
00
00
00
243
113
00
00
00
00
00
00
00
00
122
00
Car
cass
onne
122
00
00
131
00
00
00
00
00
00
00
00
00
00
00
00
00
00
00
00
00
00
00
Le
Puy
345
125
00
225
115
00
00
00
00
00
00
00
00
00
00
00
00
00
00
00
00
00
00
Mon
taub
an0
00
00
01
180
00
00
00
00
01
250
01
210
00
00
00
00
00
00
00
00
00
00
0St
Papo
ul0
00
00
01
110
00
00
00
00
01
870
00
00
00
00
00
01
280
00
00
00
00
00
0C
astr
es1
130
00
00
00
00
00
00
00
00
00
02
330
00
00
00
00
00
00
00
00
02
460
0L
avau
r0
00
00
00
00
00
00
00
00
00
00
01
260
00
00
00
00
00
00
01
80
00
00
0M
irep
oix
00
00
00
00
16
00
00
00
00
00
00
00
124
00
00
00
00
00
00
00
00
00
00
Uze
z1
103
930
02
650
00
00
00
00
00
00
00
00
00
00
00
00
00
00
00
00
00
00
0St
Pons
00
00
00
00
00
00
00
00
00
00
00
00
00
00
00
00
00
00
00
00
00
00
00
Lod
eve
00
00
00
00
00
00
00
00
00
00
00
00
00
00
00
00
00
00
00
00
00
215
00
Men
des
15
118
00
346
00
00
00
00
00
00
00
00
00
00
00
00
00
00
00
00
00
00
00
Agd
e0
00
00
01
150
00
00
00
00
00
00
00
01
170
01
100
00
00
00
00
00
00
00
0A
lais
00
00
00
00
00
00
00
00
00
00
00
00
00
00
00
00
00
00
00
00
00
00
00
Ale
t0
00
00
00
00
00
00
00
00
00
00
00
00
00
00
00
00
00
00
00
00
00
00
0C
omen
ge0
00
00
00
00
00
00
00
00
00
00
00
00
00
00
00
00
00
00
00
00
00
00
0R
ieux
00
00
00
00
00
00
00
00
00
00
00
00
00
00
00
00
00
00
00
00
00
00
353
TO
TAL
911
212
344
126
1942
84
107
139
122
247
125
416
71
2614
375
721
11
387
134
139
248
139
120
216
126
697
510
8
13
Tabl
e6:
Facs
imile
ofth
eta
ble
inse
rted
afte
rpa
ge64
ofth
e17
34ed
ition
ofB
asvi
lle’s
Mem
oire
s..
..T
heta
ble
isth
ecr
oss
tabu
latio
nof
orde
rsof
cler
gym
en(c
olum
ns)
and
dioc
eses
(row
s).T
hefir
stco
unt
isnu
mbe
rof
mon
aste
ries
(C.),
the
seco
ndis
num
ber
ofcl
ergy
men
(R.).
The
labe
lsfo
rth
eco
lum
nsca
tego
ries
are
Ecc
lesı
astiq
ues,
Jesu
ıtes,
Pere
sde
l’O
rato
ire,
Cis
teau
x,B
ened
ictin
s,C
hart
reux
,Min
imes
,Feu
illan
s,Ja
cobi
ns,C
orde
liers
,Tr
inita
ires
,Aug
ustin
s,C
arm
es,L
aM
ercy
,Cap
ucin
s,R
ecol
ets,
Sain
tAnt
oine
,Pre
tres
Irla
ndoi
s,Ti
erca
ires
ouP
icpu
s,D
omin
icai
nsre
form
ez,R
elig
.Sa
intO
rans
,Sem
inai
res
deC
arm
es,P
rem
ontr
ez,C
eles
tins,
Sem
inai
res.
The
yar
eab
brev
iate
dhe
reas
H00
,H01
,...
,H24
.In
the
elem
enta
ryco
lum
ns,
E.,
M.,
C.,
and
R.s
tand
fore
ccle
sias
tique
s,m
aiso
ns,c
ouve
nts
and
relig
ieux
.
H00
H01
H02
H03
H04
H05
H06
H07
H08
H09
H10
H11
H12
H13
H14
H15
H16
H17
H18
H19
H20
H21
H22
H23
H24
Dio
cese
E.
M.
R.
C.
R.
C.
R.
C.
R.
C.
R.
C.
R.
C.
R.
C.
R.
C.
R.
C.
R.
C.
R.
C.
R.
C.
R.
C.
R.
C.
R.
C.
R.
C.
R.
C.
R.
C.
R.
C.
R.
C.
R.
C.
R.
C.
R.
C.
R.
Nar
bonn
e32
00
00
00
02
150
01
150
02
192
232
151
151
120
02
260
00
01
120
03
360
01
80
00
01
8To
ulou
se56
04
126
118
11
136
134
126
14
378
311
11
222
842
108
223
268
136
14
00
136
368
11
14
00
00
00
Alb
y36
32
190
01
120
00
00
00
01
153
411
51
182
170
04
520
00
00
00
00
00
00
00
00
00
0M
ontp
ellie
r25
51
151
80
01
120
00
00
02
153
401
111
73
191
84
601
240
00
00
00
00
00
00
00
00
0B
ezie
rs24
01
200
00
00
00
02
150
02
132
190
01
81
120
02
322
400
00
00
00
00
00
00
00
00
0N
ımes
202
115
00
00
14
00
00
00
110
212
00
14
16
00
228
330
00
00
00
00
00
00
00
00
00
Viv
iers
534
274
18
222
112
115
00
00
27
430
00
18
27
00
226
452
00
00
00
00
00
00
00
118
00
Car
cass
onne
257
116
00
15
336
00
19
00
215
115
00
111
225
19
349
00
00
00
00
00
00
00
00
00
00
Le
Puy
396
234
00
00
16
250
00
00
110
120
00
00
112
00
235
00
00
00
00
00
00
00
14
00
00
Mon
taub
an95
00
00
00
00
00
00
00
00
00
00
00
18
00
219
00
00
00
00
00
00
00
00
00
00
StPa
poul
121
00
00
00
00
00
00
00
150
110
00
00
112
15
113
00
00
00
00
110
00
00
00
00
00
Cas
tres
184
113
00
00
00
19
00
00
180
115
17
00
00
00
110
00
00
00
00
00
00
00
00
00
00
Lav
aur
208
00
00
00
00
00
00
00
120
114
00
00
00
00
15
00
00
00
00
213
00
00
00
00
00
Mir
epoi
x29
30
00
01
140
00
00
00
01
501
141
50
00
00
01
100
00
00
01
60
00
00
00
00
02
4U
zez
323
12
00
00
123
230
14
00
12
28
00
00
18
00
327
329
00
00
00
00
00
00
00
00
00
StPo
ns88
00
00
00
00
00
00
00
110
00
00
00
00
00
00
223
00
00
00
00
00
00
00
00
00
Lod
eve
124
00
00
00
00
00
00
00
00
00
00
17
110
00
00
15
00
00
00
00
00
00
00
00
00
Men
des
357
00
00
00
00
00
00
00
15
327
00
14
19
00
434
00
00
00
00
118
00
00
00
00
00
Agd
e13
60
00
01
90
00
00
00
00
00
00
00
00
00
02
400
00
00
00
00
00
00
00
00
00
0A
lais
168
00
00
18
00
00
00
00
14
00
00
14
00
00
332
00
00
00
00
00
00
00
00
00
00
Ale
t24
80
00
00
00
00
00
00
00
00
00
00
00
00
00
00
00
00
00
00
00
00
00
00
00
0C
omen
ge30
00
00
00
00
00
00
00
00
00
00
00
00
00
00
00
00
00
00
00
00
00
00
00
00
Rie
ux12
30
00
01
50
00
00
00
01
101
80
01
60
00
01
60
00
00
00
00
00
00
00
00
00
0T
OTA
L56
2516
334
334
976
1114
47
138
669
14
2523
331
407
765
1317
620
265
545
4257
217
239
14
112
242
1014
51
102
121
41
183
12
14
4.1 Jean Le Rond d’Alembert and the triangular diagramTriangular diagrams appear under various names in the literature, including trian-
gular plot, triplot, trilinear, triaxial, three-element maps . . . According to Suaudeau(1958, [80]), the triangular plot should also be known under the name of d’Alembert’striangle 21. However, the first use of “trilinear coordinates” is usually ascribed to JosiahWillard Gibbs (1839-1903) with a publication dated 1873.
Figure 2: A “What if” in history. How d’Alembert could have visualized Basville’saggregated data derived from Table 5 and Table 6. Note that, some years later, WilliamPlayfair (1759-1823) would have drawn the diocese markers with symbols proportionalto the total number persons concerned.
The principle underlying the diagram is the recognition that points Mi, i = 1, . . . , n,with coordinates (xi, yi, zi), such that xi + yi + zi = K > 0 and xi, yi, zi ≥ 0, inthe Euclidian space of dimension 3 belong to remarkable region, an isoceles triangle,of the affine subspace of dimension 2, x + y + z = K. In the early use of the graphicdescribed by Suaudeau, d’Alembert recognized that if one coordinate at a time wasallowed to be negative, x ≤ 0 say, the corresponding triangle could be also unfoldedand connected to the all non negative triangle.
As reported by Suaudeau, d’Alembert considered his triangle in the context of bud-gets, a topic of lasting interest. Budget items are basic social measures used in quanti-tative Sociology. Besides, compositional data have been investigated with a variety of
21. Jean Le Rond d’Alembert (1717-1783) draw a triangular plot in the margins of Voltaire’s famous bookentitled l’homme aux quarante ecus (1768), an essay in political economics, which he was reading.
15
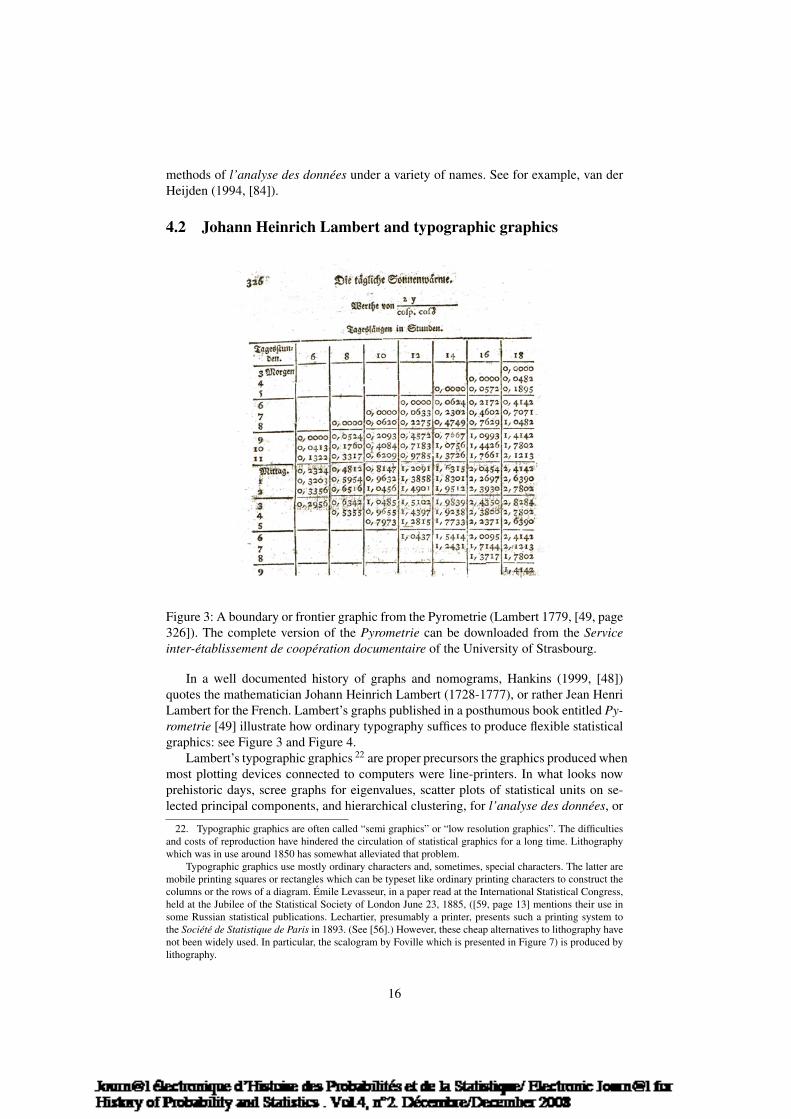
methods of l’analyse des donnees under a variety of names. See for example, van derHeijden (1994, [84]).
4.2 Johann Heinrich Lambert and typographic graphics
Figure 3: A boundary or frontier graphic from the Pyrometrie (Lambert 1779, [49, page326]). The complete version of the Pyrometrie can be downloaded from the Serviceinter-etablissement de cooperation documentaire of the University of Strasbourg.
In a well documented history of graphs and nomograms, Hankins (1999, [48])quotes the mathematician Johann Heinrich Lambert (1728-1777), or rather Jean HenriLambert for the French. Lambert’s graphs published in a posthumous book entitled Py-rometrie [49] illustrate how ordinary typography suffices to produce flexible statisticalgraphics: see Figure 3 and Figure 4.
Lambert’s typographic graphics 22 are proper precursors the graphics produced whenmost plotting devices connected to computers were line-printers. In what looks nowprehistoric days, scree graphs for eigenvalues, scatter plots of statistical units on se-lected principal components, and hierarchical clustering, for l’analyse des donnees, or
22. Typographic graphics are often called “semi graphics” or “low resolution graphics”. The difficultiesand costs of reproduction have hindered the circulation of statistical graphics for a long time. Lithographywhich was in use around 1850 has somewhat alleviated that problem.
Typographic graphics use mostly ordinary characters and, sometimes, special characters. The latter aremobile printing squares or rectangles which can be typeset like ordinary printing characters to construct thecolumns or the rows of a diagram. Emile Levasseur, in a paper read at the International Statistical Congress,held at the Jubilee of the Statistical Society of London June 23, 1885, ([59, page 13] mentions their use insome Russian statistical publications. Lechartier, presumably a printer, presents such a printing system tothe Societe de Statistique de Paris in 1893. (See [56].) However, these cheap alternatives to lithography havenot been widely used. In particular, the scalogram by Foville which is presented in Figure 7) is produced bylithography.
16
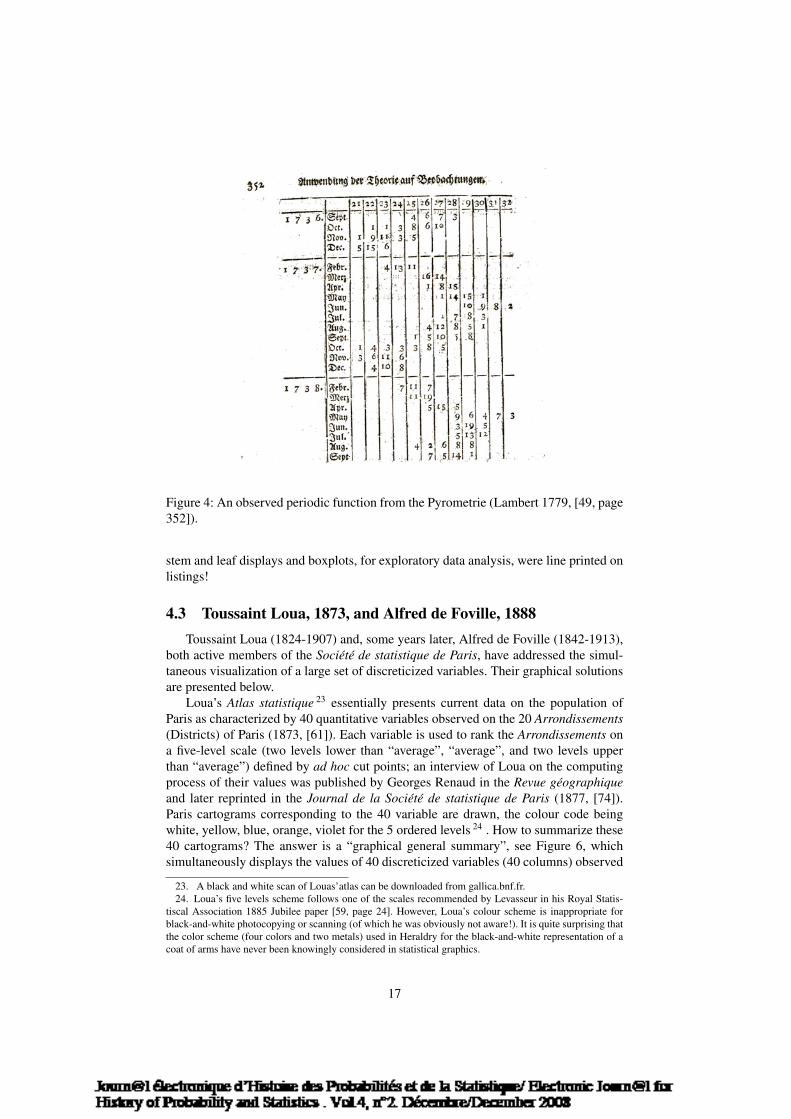
Figure 4: An observed periodic function from the Pyrometrie (Lambert 1779, [49, page352]).
stem and leaf displays and boxplots, for exploratory data analysis, were line printed onlistings!
4.3 Toussaint Loua, 1873, and Alfred de Foville, 1888Toussaint Loua (1824-1907) and, some years later, Alfred de Foville (1842-1913),
both active members of the Societe de statistique de Paris, have addressed the simul-taneous visualization of a large set of discreticized variables. Their graphical solutionsare presented below.
Loua’s Atlas statistique 23 essentially presents current data on the population ofParis as characterized by 40 quantitative variables observed on the 20 Arrondissements(Districts) of Paris (1873, [61]). Each variable is used to rank the Arrondissements ona five-level scale (two levels lower than “average”, “average”, and two levels upperthan “average”) defined by ad hoc cut points; an interview of Loua on the computingprocess of their values was published by Georges Renaud in the Revue geographiqueand later reprinted in the Journal de la Societe de statistique de Paris (1877, [74]).Paris cartograms corresponding to the 40 variable are drawn, the colour code beingwhite, yellow, blue, orange, violet for the 5 ordered levels 24 . How to summarize these40 cartograms? The answer is a “graphical general summary”, see Figure 6, whichsimultaneously displays the values of 40 discreticized variables (40 columns) observed
23. A black and white scan of Louas’atlas can be downloaded from gallica.bnf.fr.24. Loua’s five levels scheme follows one of the scales recommended by Levasseur in his Royal Statis-
tiscal Association 1885 Jubilee paper [59, page 24]. However, Loua’s colour scheme is inappropriate forblack-and-white photocopying or scanning (of which he was obviously not aware!). It is quite surprising thatthe color scheme (four colors and two metals) used in Heraldry for the black-and-white representation of acoat of arms have never been knowingly considered in statistical graphics.
17
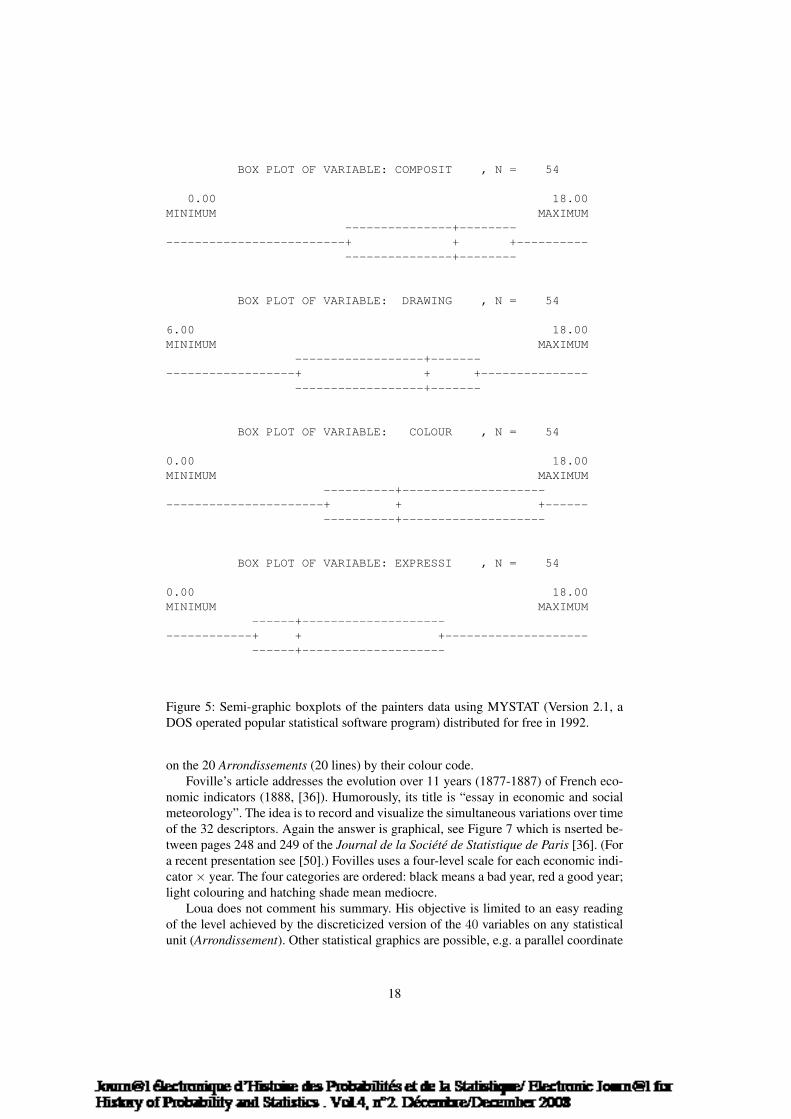
BOX PLOT OF VARIABLE: COMPOSIT , N = 54
0.00 18.00MINIMUM MAXIMUM
---------------+---------------------------------+ + +----------
---------------+--------
BOX PLOT OF VARIABLE: DRAWING , N = 54
6.00 18.00MINIMUM MAXIMUM
------------------+-------------------------+ + +---------------
------------------+-------
BOX PLOT OF VARIABLE: COLOUR , N = 54
0.00 18.00MINIMUM MAXIMUM
----------+------------------------------------------+ + +------
----------+--------------------
BOX PLOT OF VARIABLE: EXPRESSI , N = 54
0.00 18.00MINIMUM MAXIMUM
------+--------------------------------+ + +--------------------
------+--------------------
Figure 5: Semi-graphic boxplots of the painters data using MYSTAT (Version 2.1, aDOS operated popular statistical software program) distributed for free in 1992.
on the 20 Arrondissements (20 lines) by their colour code.Foville’s article addresses the evolution over 11 years (1877-1887) of French eco-
nomic indicators (1888, [36]). Humorously, its title is “essay in economic and socialmeteorology”. The idea is to record and visualize the simultaneous variations over timeof the 32 descriptors. Again the answer is graphical, see Figure 7 which is nserted be-tween pages 248 and 249 of the Journal de la Societe de Statistique de Paris [36]. (Fora recent presentation see [50].) Fovilles uses a four-level scale for each economic indi-cator × year. The four categories are ordered: black means a bad year, red a good year;light colouring and hatching shade mean mediocre.
Loua does not comment his summary. His objective is limited to an easy readingof the level achieved by the discreticized version of the 40 variables on any statisticalunit (Arrondissement). Other statistical graphics are possible, e.g. a parallel coordinate
18
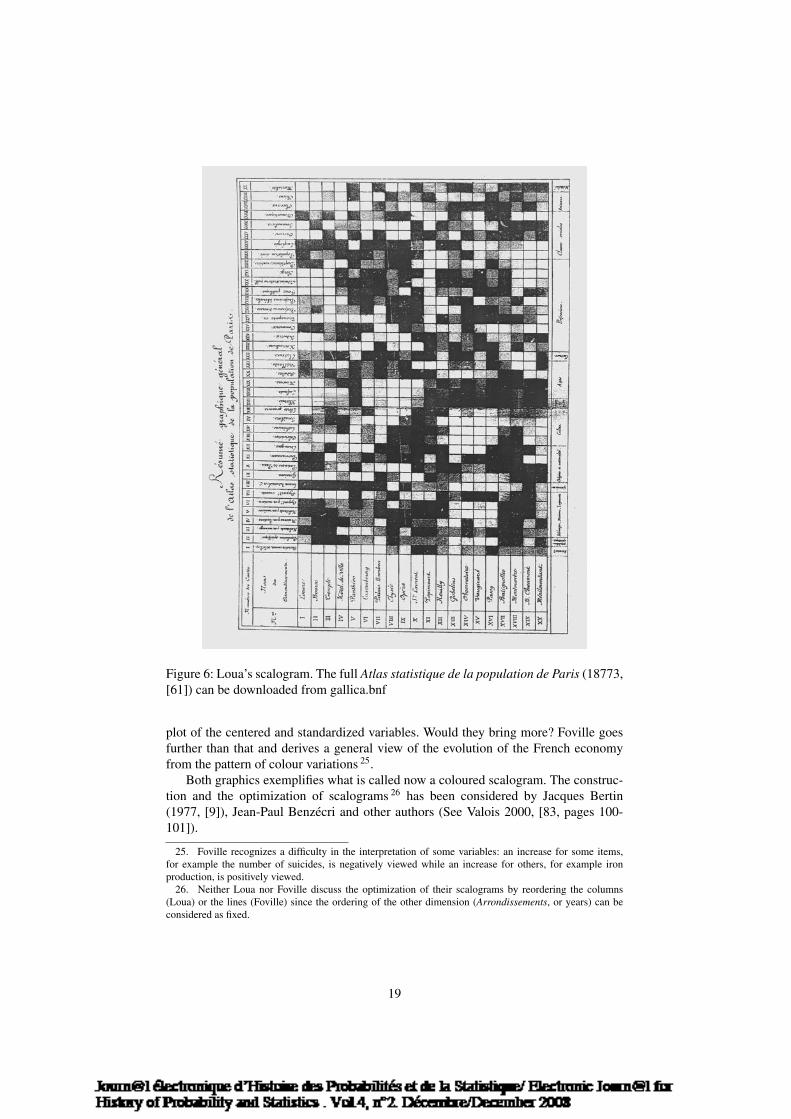
Figure 6: Loua’s scalogram. The full Atlas statistique de la population de Paris (18773,[61]) can be downloaded from gallica.bnf
plot of the centered and standardized variables. Would they bring more? Foville goesfurther than that and derives a general view of the evolution of the French economyfrom the pattern of colour variations 25.
Both graphics exemplifies what is called now a coloured scalogram. The construc-tion and the optimization of scalograms 26 has been considered by Jacques Bertin(1977, [9]), Jean-Paul Benzecri and other authors (See Valois 2000, [83, pages 100-101]).
25. Foville recognizes a difficulty in the interpretation of some variables: an increase for some items,for example the number of suicides, is negatively viewed while an increase for others, for example ironproduction, is positively viewed.
26. Neither Loua nor Foville discuss the optimization of their scalograms by reordering the columns(Loua) or the lines (Foville) since the ordering of the other dimension (Arrondissements, or years) can beconsidered as fixed.
19
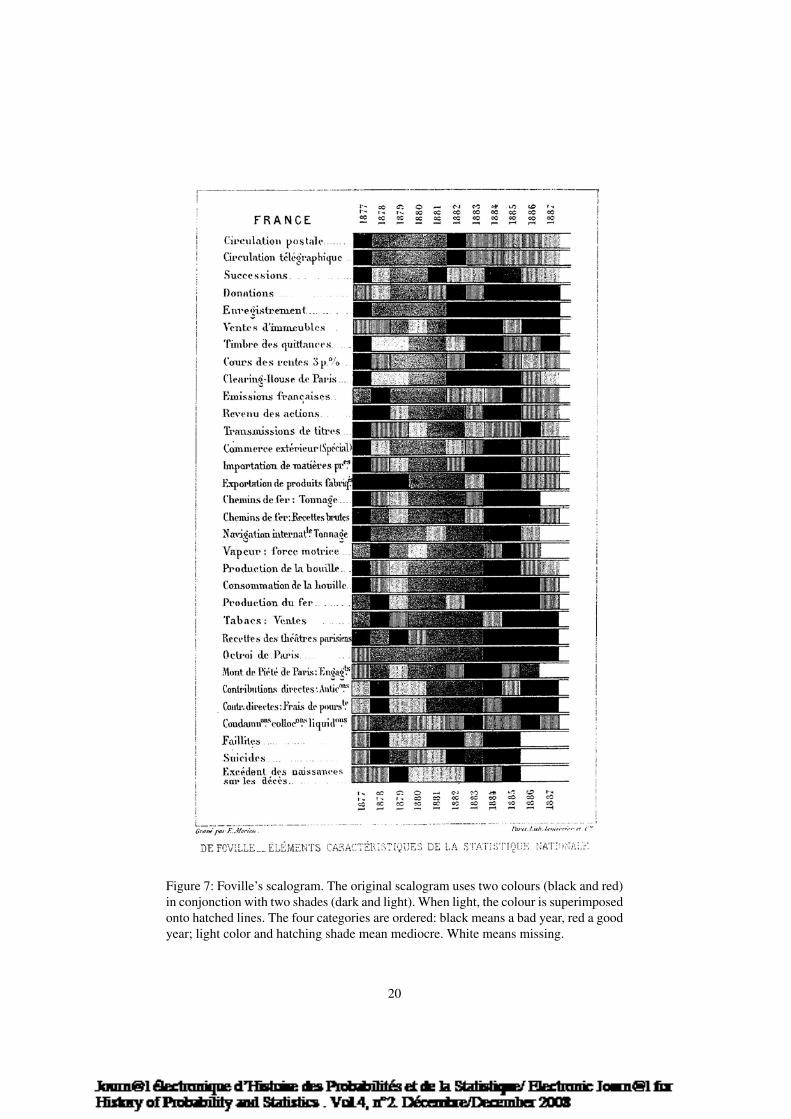
Figure 7: Foville’s scalogram. The original scalogram uses two colours (black and red)in conjonction with two shades (dark and light). When light, the colour is superimposedonto hatched lines. The four categories are ordered: black means a bad year, red a goodyear; light color and hatching shade mean mediocre. White means missing.
20
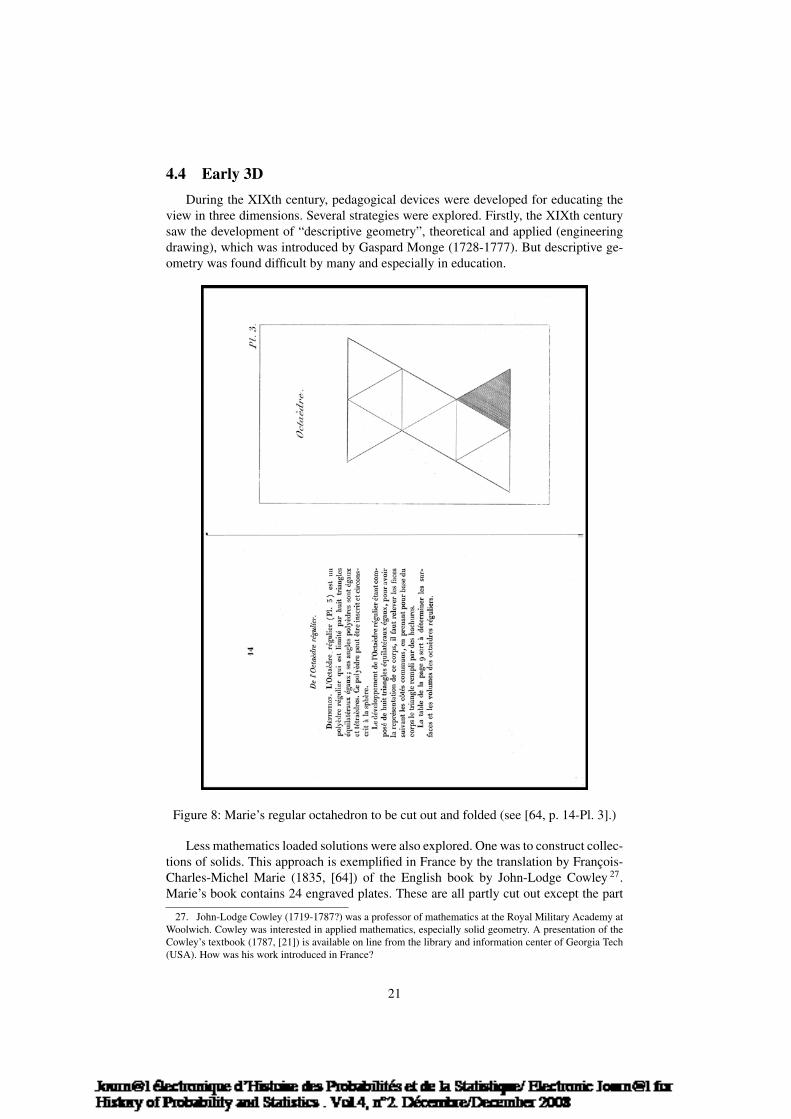
4.4 Early 3DDuring the XIXth century, pedagogical devices were developed for educating the
view in three dimensions. Several strategies were explored. Firstly, the XIXth centurysaw the development of “descriptive geometry”, theoretical and applied (engineeringdrawing), which was introduced by Gaspard Monge (1728-1777). But descriptive ge-ometry was found difficult by many and especially in education.
Figure 8: Marie’s regular octahedron to be cut out and folded (see [64, p. 14-Pl. 3].)
Less mathematics loaded solutions were also explored. One was to construct collec-tions of solids. This approach is exemplified in France by the translation by Francois-Charles-Michel Marie (1835, [64]) of the English book by John-Lodge Cowley 27.Marie’s book contains 24 engraved plates. These are all partly cut out except the part
27. John-Lodge Cowley (1719-1787?) was a professor of mathematics at the Royal Military Academy atWoolwich. Cowley was interested in applied mathematics, especially solid geometry. A presentation of theCowley’s textbook (1787, [21]) is available on line from the library and information center of Georgia Tech(USA). How was his work introduced in France?
21
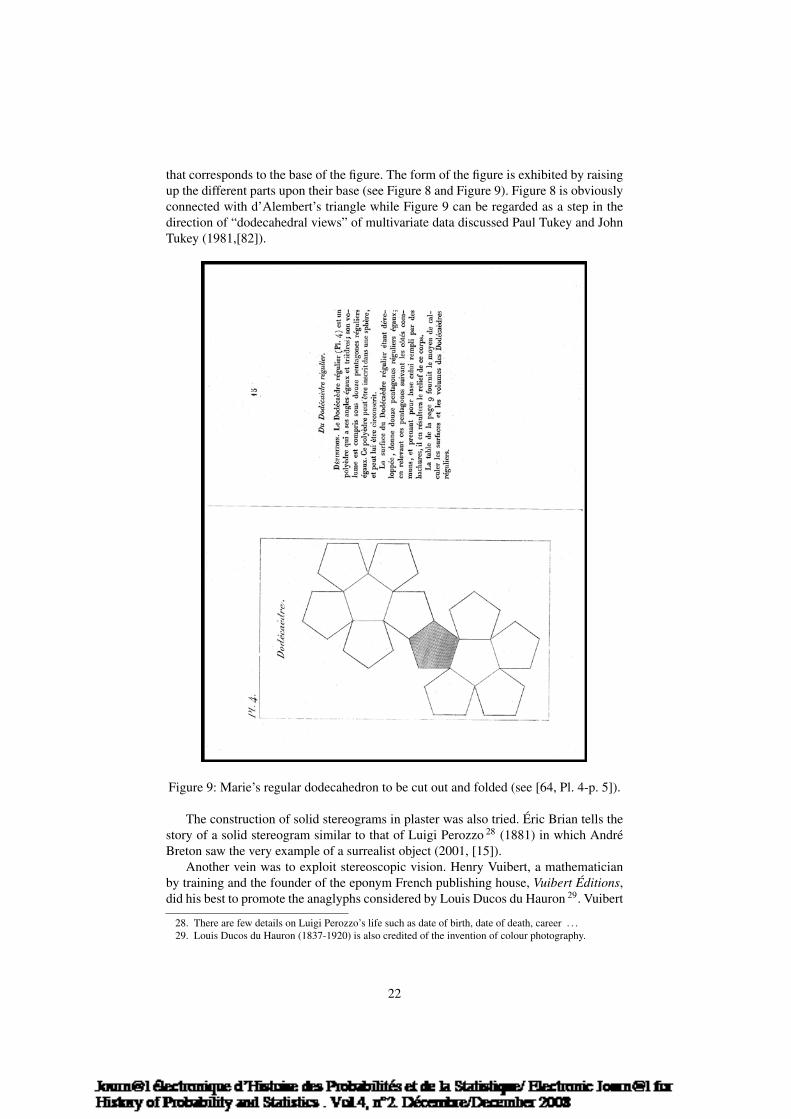
that corresponds to the base of the figure. The form of the figure is exhibited by raisingup the different parts upon their base (see Figure 8 and Figure 9). Figure 8 is obviouslyconnected with d’Alembert’s triangle while Figure 9 can be regarded as a step in thedirection of “dodecahedral views” of multivariate data discussed Paul Tukey and JohnTukey (1981,[82]).
Figure 9: Marie’s regular dodecahedron to be cut out and folded (see [64, Pl. 4-p. 5]).
The construction of solid stereograms in plaster was also tried. Eric Brian tells thestory of a solid stereogram similar to that of Luigi Perozzo 28 (1881) in which AndreBreton saw the very example of a surrealist object (2001, [15]).
Another vein was to exploit stereoscopic vision. Henry Vuibert, a mathematicianby training and the founder of the eponym French publishing house, Vuibert Editions,did his best to promote the anaglyphs considered by Louis Ducos du Hauron 29. Vuibert
28. There are few details on Luigi Perozzo’s life such as date of birth, date of death, career . . .29. Louis Ducos du Hauron (1837-1920) is also credited of the invention of colour photography.
22
(1912, [87]) was foreseeing that, by improving the printing process 30, low cost perfect3D graphics would be seen through the special red and green pair of glasses. So far,this looks like a dead lead in statistics or at best a vague protohistoric form of “Grandtours” 31 or, more ambitiously, of “virtual reality” 32.
5 The “Golden Age” of statistical graphicsBoth Loua and Foville belonged to the “Golden Age” of statistical graphics which
is rapidly evoked below. This terminology was introduced by Funkhouser to describe aperiod of time during which graphical representation of statistical data were the obligedcompanion of published official tables of data. A wide variety of graphics were consid-ered and advocated by talented statisticians: Emile Levasseur (1828-1911) and EmileCheysson (1836-1910) in France, and Georg van Mayr (1841-1925) in Germany toname but a few. Specialized articles on statistical graphics written in French werewidely read. Articles in German were translated. For example, Mayr was translatedinto French and Italian. (See a bilingual German and French text (1897, [1]), and anItalian translation (1879, [76]) with statistical diagrams.)
Notwithstanding their degree of sophistication, the graphics used during the GoldenAge have not much in common with those of l’analyse des donnees. Still they can teachus lessons in the semiology 33 of data visualization.
5.1 The Golden ageThe “Golden age of Graphics”, between 1850-1900 (± 10), is well documented.
See Funkhouser (1937,[38]), Robinson (1982,[75]), Palsky (1996, [71]), Friendly (2009,[37]).
A monument of the Golden Age, its “pinnacle” according to Friendly (2009, [37]),is the series of annual Album de statistique graphique published by the Ministere destravaux publics (Ministry of Public Works) and edited by Emile Cheysson (1836-1910) 34. The first Album 35 was published in July 1879 and the series was discontinuedin 1900. The Albums portray recurrent data for the largest part but also occasional ones.Most statistical graphics in them are of an outstanding quality.
Other French administrations published similar albums 36, e. g. an Album de statis-tique graphique du Service Vicinal (1883), or Nouvelle evaluation du revenu foncier desproprietes non baties de la France (1884), or Jacques Bertillon’s Atlas de StatistiqueGraphique de la ville de Paris (1888). Individual researchers also published graphical
30. As reported by Vuibert ([87, page 15]): “During the International meeting of mathematicians, heldin August 1912 at Cambridge, M. Richard has exhibited about fourty anaglyphs which have been greatlyadmired. We shall be able, I hope, to produce perfect ones by printing but we do not yet arrived to. Thedifficulty lies in the complexity of the composition of printing inks . . . ”
31. The image grand tour is a method for visualizing multispectral images or multiple registered images.32. Virtual reality describes a variety of applications, commonly associated with its immersive, highly
visual, 3D environments. it is associated with a technology which allows a user to interact with a computer-simulated environment.
33. For a comprehensive book on image semiology see Bertin, (1977, [9]).34. Emile Cheysson has been an active member of the Societe de statistique de Paris.35. Toussaint Loua did not forget to announce the publication of the first volume in the Journal de la
Societe de statistique de Paris [62].36. One can see in these albums a distant sign of the use of l’analyse des donnees by French Official
Statistics?
23
statistics. Toussaint Loua’s Atlas statistique de la population de Paris (1873) has al-ready been considered in subsection 4.3 37. But there are many others around the worldand an exhaustive worldwide list of albums is yet to be be made.
5.2 The objectives of graphicsAnother leading statistical “graphist” in France is Emile Levasseur (1828-1911)
who was invited to review la statistique graphique at the meeting held on the occasionof the Jubilee of the Statistical Society of London in 1885 (1885, [59]). Levasseur alsomade a related presentation of the topic at the Societe de Statistique de Paris (1886,[60]). In these papers, Levasseur distinguishes two main objectives and an aside forgraphics:
– demonstration,– invention,– control.
These can be summarized as follows. Demonstration graphics are intended for widecirculation. Invention graphics are temporary graphics used in the process of research.Control graphics are used to detect outliers in the data. While a demonstration graphicmust obey the rule of clarity (they are to reveal on first sight a general tendancyand on further investigation possible irregularities of interest), an invention graphicis ephemeral and dictated by the personal feelings of its user. Obviously, the object ofa graphic impacts its construction.
Surely, invention graphics play an important in the course of l’analyse des donnees.Statististical softwares have widely facilitated their production 38. It would be of peda-gogical interest to have an estimate of the ratio of demonstration to invention graphicsin large multivariate data analyses.
5.3 And nomograms?A nomogram, nomograph, or abac is a graphical calculating device. This planar di-
agram is designed to allow the approximate computation of the value of a function withmultiple variables. As reported in Hankins (1999, [48]) and Friendly (2009, [37]), in-novative nomograms were designed in France 39 under the impulsion of creative math-ematical engineers, Leon Lalanne (1811-1892) and Maurice d’Ocagne (1862-1938), toname but two. In his Statistical Society of London Jubilee article (1885, [59]), Lev-asseur briefly mentions the work of Lalanne but does not seem to really recognizethe potential of nomograms. To some extent, this is still the case. To my knowledge,there has been no attempt to combine explicitly the methods of L’analyse des donneeswith the geometrical principles underlying the construction of nomograms. Yet, a cal-ibrated biplot graphic, used to approximate the elements of a matrix, performs like anomogram. The same apply to more elaborate situations: skew-symmetry in square ta-bles (Gower and Digby, [44, section 3]), complex decompositions (Dossou-Gbete andGrorud, [30]), or distances in hierarchical classification trees.
37. Renaud (1877, [74]), in his “interview” of Loua’s discretization process, mentions two atlas: Loua’satlas and an Atlas industriel published by the Ministry of Trade.
38. Some researchers are old enough to remember the long computer listings on which typographic graph-ics were printed: series of scatter diagrams on axes 1 and 2, axes 1 and 3, axes 2 and 3 . . . in factorialanalyses, or huge classification trees in cluster analysis.
39. Hankins’s article [48] is motivated by a nomogram which resulted from a collaboration between theFrench Maurice d’Ocagne and the American Lawrence Joseph Henderson. Henderson’s famous nomogramis an attempt to quantify the relationships in a physico-chemical system which models mammalian blood.
24
5.4 The potential sin of the Golden AgeIn the instructions of the Album de Statistique Graphique established by an admin-
istrative decision dated 12 mars 1878, it is stated that statistical maps and diagramsare to be published on a yearly basis in order to ease comparisons over time of eco-nomic and technical facts. It is also recalled in the instructions of several followingalbums that the duty of the Administration is to publish data of good quality and thatthe methodology used in each graph is to be recalled. It is further emphasized that in noways the Administration is to provide interpretations. On the contrary, it is stated thatthe readers (Public and Press) are to draw conclusions at their own risks and dangers(see for example, the Instructions for the year 1883).
This seems at best a hazardous standpoint or worse a potential sin. The potential sinmight be the emphasis on storing in a graphical format the numbers making the datarather than patterns in the data. First, it seems at least conjectural to profess that dataor graphical representations of data can be collected without any objective on mind.The early examples discussed so far showed some form of purpose in their productionwhich was additionally reflected by the layout of their publications. In the same line, theselection of data presented in the Album are telling something about economic progressin France as viewed by high ranked civil servants. Finally, are these maps strictly andaccurately reproducing the data they visualized? No one has really checked. Some datamay have been “smoothed” to provide attractive diagrams if not to disentangle theinformation they carry. A statistical graphic should be understood as the transpositionof an abstract reality (the data) to a concrete fiction (its graphical representation). Inthis process, it may be helpful to paraphrase the statistical concept of sufficiency: thedata given the graphical representation should be independent of the objective of thework. Obviously, most of the remarks above apply to l’analyse des donnees and itsgraphics.
6 The “between” introduction of probabilistic modelsIn this section, two problems illustrate the second form of the unavoidable rein-
troduction of probability in l’analyse des donnees introduced in subsection 2.1. Onerelates to cluster analysis and the other to factorial methods.
6.1 Example 1: central partition and latent classLet F be a finite set of qualitative variables observed on a given (sample of a) pop-
ulation S. Let |F| be the cardinality of F . Each observed variable, A say, is equivalentto an observed partition of S whose classes correspond to the levels of A.
Following a descriptive approach, one can look for a “central” partition whichwould be to the observed partitions what is an ordinary mean to a statistical seriesof numbers. This problem has been investigated by Simon Regnier (1932-1980): thecentral partition P should minimize the average of the cardinal of the symmetric differ-ence between P and partitions A in F like the mean minimizes the average of the sumof squared differences. Let A(i, i) be the indicator of i and i being in the sameclass of a given partition A. Then the central partition P of the family F of partitionsis a solution of the following optimization problem:
P ∈ argminP
i∈S
i∈S
P (i, i)
d(i, i)− 12
25
where
d(i, i) = 1− 1|F|
A∈F
A(i, i)
Regnier elicited the connection of this problem with linear programming and proposedan algorithm leading to a “local” optimum (over the set of partitions obtained by trans-fer of one and only one element to any other class).
In the tradition of statistical modeling one can alternatively consider a latent classmodel. The latent class model, introduced by Paul Lazarsfeld (1950,[51]), was wellreceived in France through the work of Raymond Boudon 40 (1967, [12]). See alsoErling Andersen 41 (1994, [3, section 12]). Let yFf be the observed counts in cell f , fbeing an element of the Cartesian product of variables A in F . A latent class model isan unobserved qualitative variable P (thus a partition) defined on S with levels p suchthat the variables in F are independent given any level p of P . Since P is unobserved,it is the solution of an optimization problem which can be solved by the EM algorithm(Goodman, [42]).
How do these two approaches relate? Is the latent partition approximately central?A precise answer is still unclear but the question is typical of the “within” approach tothe introduction of probabilities in l’analyse des donnees. A dual investigation wouldconsider the relationship between the eigenvectors in multiple correspondence analysisand continuous latent variable models.
6.2 Example 2: incomplete and unbalanced design of the dataA quantitative response (continuous, counts or 0/1) and two cross-classifying fac-
tors are observed. In an incomplete or in an unbalanced design, some of the cells result-ing from the cross-classification may be structurally missing or the number of observedresponses may not be constant over the cells. Therefore the data cannot be coerced intomatrix form and statistical analyses using (generalized) singular value decompositioncannot be applied 42. However, a flexible optimization problem based on the formula-tion of generalized linear model developed in statistical modeling can still be defined.
b ∈ argminβ
w (y −m(η))2
where
η(β) = β0 + βII() + βJJ() +Kk=1
δkβIk,I()β
Jk,J()
where: is a statistical unit, y denotes the corresponding response value, I() andJ() the corresponding levels the cross-classifying factors I and J ; m, the mean func-tion, is a strictly monotone function; w = pφV (m(η))) is a weight which possiblycombines an a priori weight p, the variance function (a positively valued functionof the mean V (m(η))), and a dispersion parameter φ. Identification constraints need
40. Raymond Boudon visited Paul Lazarsfeld in the US. In the published version of his dissertation thefirst acknowledgements go to Paul Lazarsfeld (1901-1976) and Robert Fortet (1912-1998) and Jean Stoetzel(1910-1987).
41. Erlig Andersen (1939-2004) should be recognized in France for presenting both model based andcorrespondence analysis methods in his book on categorical data analysis.
42. The solution to the optimal approximation of a data matrix by a matrix of lower rank is usuallyascribed to Carl Eckart and Gale Young (1936, [32]).
26
where
d(i, i) = 1− 1|F|
A∈F
A(i, i)
Regnier elicited the connection of this problem with linear programming and proposedan algorithm leading to a “local” optimum (over the set of partitions obtained by trans-fer of one and only one element to any other class).
In the tradition of statistical modeling one can alternatively consider a latent classmodel. The latent class model, introduced by Paul Lazarsfeld (1950,[51]), was wellreceived in France through the work of Raymond Boudon 40 (1967, [12]). See alsoErling Andersen 41 (1994, [3, section 12]). Let yFf be the observed counts in cell f , fbeing an element of the Cartesian product of variables A in F . A latent class model isan unobserved qualitative variable P (thus a partition) defined on S with levels p suchthat the variables in F are independent given any level p of P . Since P is unobserved,it is the solution of an optimization problem which can be solved by the EM algorithm(Goodman, [42]).
How do these two approaches relate? Is the latent partition approximately central?A precise answer is still unclear but the question is typical of the “within” approach tothe introduction of probabilities in l’analyse des donnees. A dual investigation wouldconsider the relationship between the eigenvectors in multiple correspondence analysisand continuous latent variable models.
6.2 Example 2: incomplete and unbalanced design of the dataA quantitative response (continuous, counts or 0/1) and two cross-classifying fac-
tors are observed. In an incomplete or in an unbalanced design, some of the cells result-ing from the cross-classification may be structurally missing or the number of observedresponses may not be constant over the cells. Therefore the data cannot be coerced intomatrix form and statistical analyses using (generalized) singular value decompositioncannot be applied 42. However, a flexible optimization problem based on the formula-tion of generalized linear model developed in statistical modeling can still be defined.
b ∈ argminβ
w (y −m(η))2
where
η(β) = β0 + βII() + βJJ() +Kk=1
δkβIk,I()β
Jk,J()
where: is a statistical unit, y denotes the corresponding response value, I() andJ() the corresponding levels the cross-classifying factors I and J ; m, the mean func-tion, is a strictly monotone function; w = pφV (m(η))) is a weight which possiblycombines an a priori weight p, the variance function (a positively valued functionof the mean V (m(η))), and a dispersion parameter φ. Identification constraints need
40. Raymond Boudon visited Paul Lazarsfeld in the US. In the published version of his dissertation thefirst acknowledgements go to Paul Lazarsfeld (1901-1976) and Robert Fortet (1912-1998) and Jean Stoetzel(1910-1987).
41. Erlig Andersen (1939-2004) should be recognized in France for presenting both model based andcorrespondence analysis methods in his book on categorical data analysis.
42. The solution to the optimal approximation of a data matrix by a matrix of lower rank is usuallyascribed to Carl Eckart and Gale Young (1936, [32]).
26
to be introduced for the parameter b, e.g. the orthonormality constraints used in prin-cipal component analysis. Note that some parameters in the linear part of the model(β0 + βII() + βJJ()) may be omitted to replicate particular methods.
This approach generalizes the problem of lower rank approximation to data setswhich are not matrix coercible. It has been introduced by K. Ruben Gabriel (1979,[40])for known variances. It comprises methods such as principal component analysis, a va-riety of correspondence analyses (symmetric, non-symmetric . . . ) and Goodman’s RCassociation model. It can be further generalized to accommodate correlations betweenthe observations 43 :
b ∈ argminβ||y −m(η)||2W (β)
where y and η are the response and the predictor vectors.In the class of extension above, the core of factorial methods is preserved, namely
the row and column inner product form for the reduced rank interaction
Kk=1
δkβIk,I()β
Jk,J(),
Benzecri’s correspondence analysis, Nishisato’s dual scaling (1970, [69]), Gabriel’sbiplot (1972, [39]), Goodman’s RC association (1979, [43]) . . . Curiously a simplealgorithm for the estimation of the β, is an adaptation of the old NIPALS algorithmconsidered by Herman Wold (1966, [89]) and central in PLS 44 analyses.
7 Concluding remarksThe main factors which have contributed, in the late sixties, to a remarkable revival
of multivariate descriptive analysis in France have been considered. Clearly the impetusof l’analyse des donnees has stimulated statistical research in France and has producednovel methodologies. Did a distinctive and long-lived school of statistics emerge? Tosome extent this was true in the eighties. Nowadays, the globalization of statisticalpractices as well as the mobility of researchers hinders the very existence of isolatednational developments. But affinity groups remain as can be seen from the programs ofcontemporary international meetings.
Without much risk, one can forecast a long live for l’analyse des donnees under thebanner of multivariate data analysis.
References[1] Atlas graphique et statistique de la Suisse; Graphisch-statisticher Atlas der
Schweiz. Buchdruckerei Stampfli & Cie, Bern, 1897.
[2] Murray A. Aitkin, Dorothy A. Anderson, Brian J. Francis, and John P. Hinde.Satistical modelling in GLIM. Oxford University Press, Oxford, 1989.
43. Other generalization are possible: explanatory variables can be introduced in the predictor η(β) =
β0 +βII()
+βJJ()
+K
k=1 δkβIk,I()
βJk,J()
; the “row” βIk,I()
scores and the “column” scores βJk,J()
can be constrained to belong to separate explanatory spaces . . .44. PLS stands for Partial least squares.
27
[3] Erlig B. Andersen. The statistical analysis of categorical data. Springer-Verlag,Berlin, 3rd edition, 1994.
[4] Nicolas de Lamoignon de Basville. Memoires pour servir a l’histoire de Langue-doc. Pierre Boyer, Amsterdam, 1734.
[5] Jean-Paul Benzecri. L’analyse des donnees. I la Taxinomie, volume 1. Dunod,Paris, 1973.
[6] Jean-Paul Benzecri. L’analyse des donnees. II l’analyse des correspondances,volume 2. Dunod, Paris, 1973.
[7] Jean-Paul Benzecri. Histoire et prehistoire de l’analyse des donnees, I, II, III, IV.Cahiers de l’analyse des donnees, 1(1, 2, 3, 4), 1976.
[8] Patrice Bertier and Jean-Marie Bouroche. Analyse des donnees multi-dimensionnelles. PUF, Paris, 1975.
[9] Jacques Bertin. La graphique et le traitement graphique de l’information. Flam-marion, Paris, 1977.
[10] Lynne Billard and Edwin Diday. Symbolic data analysis: conceptual statisticsand data mining. Wiley, 2006.
[11] Yvonne M. M. Bishop, Stephen E. Fienberg, and Paul W. Holland. Discretemultivariate analysis; Theory and practice. The MIT Press, Cambridge (Mas-sachusetts), 1975.
[12] Raymond Boudon. L’analyse mathematique des faits sociaux. Plon, Paris, 1967.[13] Pierre Bourdieu. Homo academicus. Editions de Minuit, Paris, 1984.[14] Jean-Marie Bouroche and Gilbert Saporta. L’analyse des donnees. Pour la Sci-
ence, 5:23–35, 1978.[15] Eric Brian. Les objets de la chose. theorie du hasard et surrealisme au XXe siecle.
Revue de synthese, (2-3-4):473–502, 2001.[16] Francis Cailliez and Jean-Pierre Pages, editors. Introduction a l’analyse des
donnees, Paris, 1976. SMASH.[17] Henri Caussinus. Models and uses of principal component analysis; a comparison
emphasizing graphical displays and metric choices. In Multidimensional dataanalysis, pages 149–170, Leiden, 1986. DSWO Press.
[18] Henri Caussinus. Modeles probabilistes et anlyse des donnees multidimension-nelles. quelques reflexions methodologiques et applications. Journal de la Societede Statistique de Paris, tome 134, N˚2, 1993.
[19] Pierre Cazes. Compte rendu de lecture de “multiple correspondence analysis andrelated methods”. Journal de la Societe de Statistique de Paris, tome 149, N˚3,2008.
[20] Gilles Celeux and Edwin Diday. L’analyse des donnees. Bulletin de liaison de larecherche en informatique et automatique, 62:2–12, 1980.
[21] John Lodge Cowley. An illustration and mensuration of solid geometry in sevenbooks: containing forty-two moveable copper-plate schemes for forming the var-ious kinds of solids and their sections . . . , by John Lodge Cowley ; revised, cor-rected, and augmented by William Jones. printed by S. Cosnell . . . for the editor,London, 1787.
[22] Jacques Dauxois and Alain Pousse. Les analyses factorielles en calcul des prob-abilites et en statistique : essai d’etude synthetique. PhD thesis, Laboratoire destatistique et probabilites, Universite de Toulouse III, 1976.
28
[23] Jacques Dauxois, Alain Pousse, and Yves Romain. Asymptotic theory for theprincipal component analysis of a random vector fonction: Some applications tostatistical inference. Journal of multivariate analysis, 12:136–154, 1982.
[24] Michael Davenport and W. Gerald Studdert-Kennedy. The statistical analysis ofaesthetic judgment: an exploration. Applied Statistics, 21(3):324–331, 1972.
[25] Pedro de Paz Salas and Antonio Alvares. La felicissima armada que elrey DonFelipe nuestro Senor mando juntar enel puerto de la ciudad de Lisboa enel Reynode Portugal. El ano de mil y quinientos y ohcenta y ocho. Lisbao, 1588.
[26] Jean-Claude Deville and Edmond Malinvaud. Data analysis in official socio-economic statistics (with discussion). Journal of the Royal statistical Society,series A, 146(4):335–361, 1983.
[27] Edwin Diday and collaborateurs. Optimisation en classification automatique,vol.I and vol.II. INRIA-Sedis/Diffusion, 1980.
[28] Edwin Diday and Ludovic Lebart. L’analyse des donnees. La Recherche, 74:15–25, 1977.
[29] Edwin Diday, Jacques Lemaire, Jean Pouget, and Francoise Testu. Elementsd’analyse des donnees. Dunod-Bordas, Paris, 1982.
[30] Simplice Dossou-Gbete and Axel Grorud. Biplots for matched two-way tables.Annales de la faculte des sciences de Toulouse, 11(4):469–483, 2002.
[31] Francois-Jacques Durand. Statistique elementaire, essai sur l’etat geographique,physique et politique de la Suisse. Lausanne, 1795.
[32] Carl Eckart and Gale Young. The approximation of one matrix by another oflower rank. Psychometrika, 1, 1936.
[33] David Edwards. Introduction to Graphical Modelling. Springer-Verlag, NewYork, 2nd edition, 1995.
[34] Brigitte Escofier. Analyse des Correspondances - Recherches au coeur del’analyse des donnees. Presses universitaires de Rennes, 2003.
[35] Yves Escoufier. Cours d’analyse des donnees. annee scolaire 1978-1979, 1978.
[36] Alfred de Foville. Essai de meteorologie economique et sociale. Journal de laSociete de Statistique de Paris, 1ere Serie, 29e Volume, N˚6:243–249, 1888.
[37] Michael Friendly. The golden age of statistical graphics. Statistical Science, toappear.
[38] H. Gray Funkhouser. Historical development of the graphical representation ofstatistical data. Osiris, 3(1):269–405, 1937.
[39] K. Ruben Gabriel. Biplot display of multivariate matrices for inspection of dataand diagnosis. In Vic Barnett, editor, Interpreting multivariate data, pages 147–173. John Wiley & sons, 1981.
[40] K. Ruben Gabriel and Shmuel Zamir. Lower rank approximation of matrices byleast squares with any choice of weights. Technometrics, 21(4):489–498, 1979.
[41] Albert Gifi. Nonlinear multivariate analysis. John Wiley and sons, Chichester,1990.
[42] Leo A. Goodman. On the exploratory latent structure analysis using both identi-fiable and unidentifiable models. Biometrika, 61:215–231, 1974.
29
[43] Leo A. Goodman. Simple models for the analysis of association in cross-classifications having ordered categories. Journal of the American StatisticalAssociation, 74:537–552, 1979.
[44] John C. Gower and Peter G. Digby. Expressing complex relationships in twodimensions. In Vic Barnett, editor, Interpreting multivariate data, pages 83–118.John Wiley & sons, 1981.
[45] Michael Greenacre. Correspondence analysis in practice. Chapman and Hall, 1stedition, 1993.
[46] Michael Greenacre. La practica del analisis de correspondencias. FundacionBBVA, 2008.
[47] Michael Greenacre and Jeorg Blaesius, editors. Multiple correspondence analysisand related methods. Chapmann & Hall, 2006.
[48] Thomas L. Hankins. Blood, dirt and nomograms. a particular history of graphs.Isis, 90:50–80, 1999.
[49] Johann Heinrich Lambert. Pyrometrie oder vom masse des feuers und der warmemit acht kupfertafeln. Berlin, 1779.
[50] Dominique Ladiray. Conjoncture, statistique et econometrie. Economie et Statis-tique, 359-360:3–12, 2002.
[51] Paul F. Lazarsfeld. The logical and mathematical foundation of latent structureanalysis. In Samuel A. Stouffer, Louis Guttman, Edward A. Suchman, Shirley A.Star, and John A. Clausen, editors, Measurement and prediction, Princeton, 1950.Princeton University Press.
[52] Paul F. Lazarsfeld. Notes on the history of quantification in sociology - trends,sources and problems. Isis, 52(2):277–333, 1961.
[53] Ludovic Lebart and Jean-Pierre Fenelon. Statistique et informatique appliquee.Dunod, Paris, 1971.
[54] Ludovic Lebart, Alain Morineau, and Nicole Tabard. Techniques de la descriptionstatistique : Methodes et logiciels pour l’analyse des grands tableaux. Dunod,Paris, 1977.
[55] Ludovic Lebart, Alain Morineau, and Kenneth M. Warwick. Multivariate de-scriptive statistical analysis: correspondence analysis and related techniques forlarges matrices. Wiley & sons, New York, 1984.
[56] Lechartier. Les graphiques typographiques. Journal de la Societe de Statistiquede Paris, pages 311–321, 1893.
[57] Israel Cesar Lerman. Les bases de la classification automatique. Gauthier-Villars,1970.
[58] Israel Cesar Lerman. Historique de la societe francophone de classification (sfc).Bulletin de la SFC, 10, 1998.
[59] Emile Levasseur. La statistique graphique, read at the International StatisticalCongress held at the jubilee of the Statistical Society of London, June 23, 1885.Edward Stanford, London, 1885.
[60] Emile Levasseur. Quelques reflexions sur la statistique graphique. Journal de laSociete de Statistique de Paris, 27:224–225, 1886.
[61] Toussaint Loua. Atlas statistique de la population de Paris. J. Dejey & Cie, Paris,1873.
30
[62] Toussaint Loua. L’album de statistique graphique pour 1879. Journal de laSociete de statistique de Paris, 1re Serie, Volume 20(11):308, 1879.
[63] Kanti V. Mardia, John T. Kent, and John M. Bibby. Multivariate analysis. Aca-demic Press, London, 1979.
[64] Francois Charles Michel Marie. Geometrie stereographique, reliefs despolyedres, pour faciliter l’etude des corps. Bachelier, Paris, 1835.
[65] Michel Masson. Methodologie generale du traitement de l’information de masse.Nathan, Paris, 1980.
[66] Peter McCullagh and John A. Nelder. Generalized Linear Models. Chapman &Hall, 2nd edition, 1989.
[67] Paul McReynolds and Klaus Ludwig. Christian Thomasius and the origin ofpsychological rating scales. Isis, 73(3):546–553, 1984.
[68] John A. Nelder and Robert W. M. Wedderburn. Generalized linear models. Jour-nal of the Royal Statistical Society, Series A, 135:370–384, 1972.
[69] Shizuhiko Nishisato. Analysis of categorical data. Dual scaling and its applica-tions. University of Toronto Press, Toronto, 1970.
[70] Jean-Pierre Pages, Francis Cailliez, and Yves Escoufier. Analyse factorielle : unpeu d’histoire et de geometrie. Revue de Statistique Appliquee, 27(1):5–28, 1979.
[71] Gilles Palsky. Des chiffres et des cartes : naissance et developpement de la car-tographie quantitative francaise au XIXe siecle. Comite des Travaux Historiqueset Scientifiques (CTHS), Paris, 1996.
[72] Roger de Piles. Cours de peinture par principes compose par Mr de Piles. JacquesEstienne, Paris, 1708.
[73] Roger de Piles. Recueil de divers ouvrages sur la peinture et le coloris par Mr dePiles. Charles Antoine Jombert, Paris, 1755.
[74] Georges Renaud. Procede de cartographie statistique. Journal de la Societe destatistique de Paris, 1re Serie, Volume 18(1):27–28, 1877.
[75] Arthur H. Robinson. Early Thematic Mapping in the History of Cartography.University of Chicago Press, Chicago, 1982.
[76] Giovani Battista Salvioni. La statistica et la vita sociale. Ermanno Loescher,Torino e Roma, 1879.
[77] Gilbert Saporta. Donnees supplementaires sur l’analyse des donnees. L’echo desmessaches, 4:4–5, 1975.
[78] Gilbert Saporta. L’analyse des donnees. MATAPLI, Bulletin de liaison de laSociete de mathematiques appliquees et industrielles (SMAI), 2:4–6, 1984.
[79] Charles Spearman. Les aptitudes de l’homme, leur nature et leur mesure (trans-lated by Francois Brachet). Conservatoire national des arts et metiers, Paris,1936.
[80] Rene Suaudeau. Les representations figurees des physiocrates. Librairie du Re-cueil Sirey, Paris, 2e edition, 1958.
[81] John W. Tukey. The future of data analysis. Annals of mathematical statistics,33:1–67, 1962.
[82] Paul A. Tukey and John W. Tukey. Preparation; prechosen sequences of views.In Vic Barnett, editor, Interpreting multivariate data, pages 189–213. John Wiley& sons, 1981.
31
[83] Jean-Paul Valois. Approche graphique en analyse des donnees (avec discussions).Journal de la Societe Francaise de statistique, 141(4):5–107, 2000.
[84] Peter van der Heijden. End-member analysis and latent budget analysis (letter tothe editor). Applied Statistics, Journal of the Royal Statistical Society (Series C),43(3):527–528, 1994.
[85] Michel Volle. L’analyse des donnees. Economie et Statistique, 96:3–23, 1978.
[86] Michel Volle. L’analyse des donnees. Economica, Paris, 1978.
[87] Henry Vuibert. Les anaglyphes geometriques. Librairie Vuibert, Paris, 2e editionedition, 1912.
[88] Joe Whittaker. Graphical models in applied multivariate Statistics. John Wiley& Sons, Chichester, 1990.
[89] Herman Wold. Nonlinear estimation by iterative least squares procedures. In F. N.David, editor, Research papers in statistics, pages 411–444, New York, 1966.Wiley.
32